Coolville, OH Map & Demographics
Coolville Map
Coolville Overview
$23,561
PER CAPITA INCOME
$62,188
AVG FAMILY INCOME
$45,417
AVG HOUSEHOLD INCOME
0.6%
WAGE / INCOME GAP [ % ]
99.4¢/ $1
WAGE / INCOME GAP [ $ ]
0.41
INEQUALITY / GINI INDEX
615
TOTAL POPULATION
329
MALE POPULATION
286
FEMALE POPULATION
115.03
MALES / 100 FEMALES
86.93
FEMALES / 100 MALES
45.2
MEDIAN AGE
3.0
AVG FAMILY SIZE
2.4
AVG HOUSEHOLD SIZE
330
LABOR FORCE [ PEOPLE ]
66.8%
PERCENT IN LABOR FORCE
7.3%
UNEMPLOYMENT RATE
Coolville Zip Codes
Coolville Area Codes
Income in Coolville
Income Overview in Coolville
Per Capita Income in Coolville is $23,561, while median incomes of families and households are $62,188 and $45,417 respectively.
| Characteristic | Number | Measure |
| Per Capita Income | 615 | $23,561 |
| Median Family Income | 167 | $62,188 |
| Mean Family Income | 167 | $70,194 |
| Median Household Income | 260 | $45,417 |
| Mean Household Income | 260 | $54,516 |
| Income Deficit | 167 | $0 |
| Wage / Income Gap (%) | 615 | 0.61% |
| Wage / Income Gap ($) | 615 | 99.39¢ per $1 |
| Gini / Inequality Index | 615 | 0.41 |
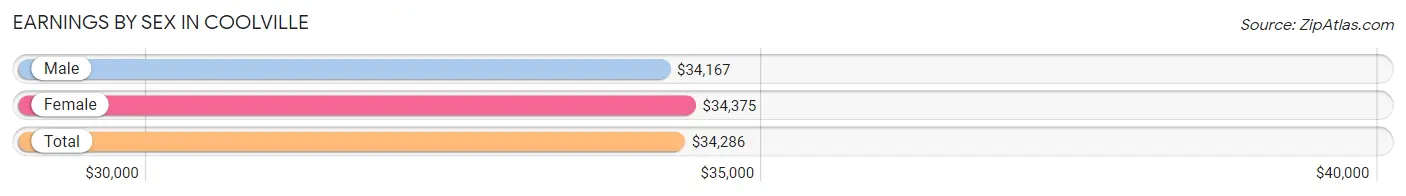
Earnings by Sex in Coolville
Average Earnings in Coolville are $34,286, $34,167 for men and $34,375 for women, a difference of 0.6%.
| Sex | Number | Average Earnings |
| Male | 168 (52.2%) | $34,167 |
| Female | 154 (47.8%) | $34,375 |
| Total | 322 (100.0%) | $34,286 |
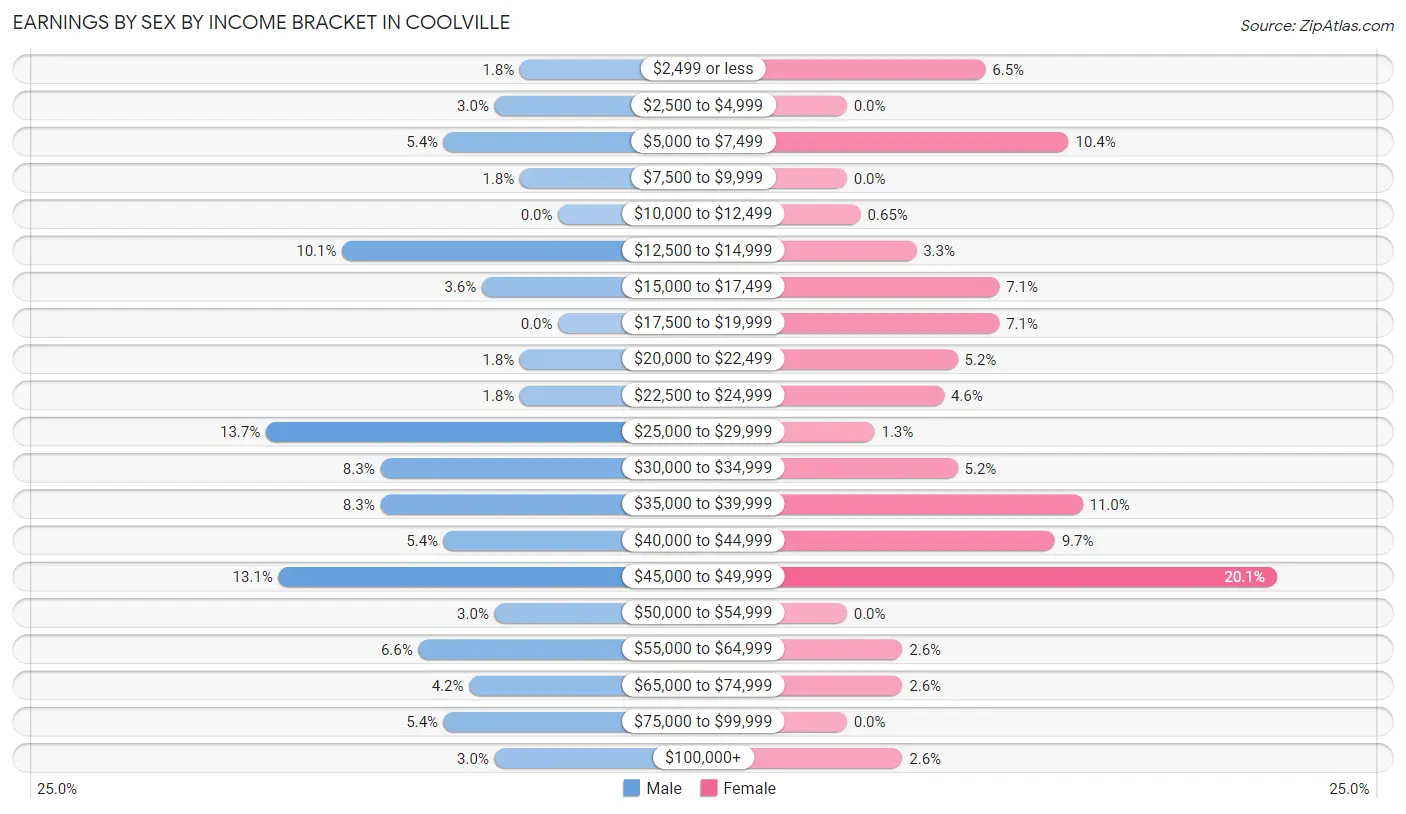
Earnings by Sex by Income Bracket in Coolville
The most common earnings brackets in Coolville are $25,000 to $29,999 for men (23 | 13.7%) and $45,000 to $49,999 for women (31 | 20.1%).
| Income | Male | Female |
| $2,499 or less | 3 (1.8%) | 10 (6.5%) |
| $2,500 to $4,999 | 5 (3.0%) | 0 (0.0%) |
| $5,000 to $7,499 | 9 (5.4%) | 16 (10.4%) |
| $7,500 to $9,999 | 3 (1.8%) | 0 (0.0%) |
| $10,000 to $12,499 | 0 (0.0%) | 1 (0.6%) |
| $12,500 to $14,999 | 17 (10.1%) | 5 (3.3%) |
| $15,000 to $17,499 | 6 (3.6%) | 11 (7.1%) |
| $17,500 to $19,999 | 0 (0.0%) | 11 (7.1%) |
| $20,000 to $22,499 | 3 (1.8%) | 8 (5.2%) |
| $22,500 to $24,999 | 3 (1.8%) | 7 (4.5%) |
| $25,000 to $29,999 | 23 (13.7%) | 2 (1.3%) |
| $30,000 to $34,999 | 14 (8.3%) | 8 (5.2%) |
| $35,000 to $39,999 | 14 (8.3%) | 17 (11.0%) |
| $40,000 to $44,999 | 9 (5.4%) | 15 (9.7%) |
| $45,000 to $49,999 | 22 (13.1%) | 31 (20.1%) |
| $50,000 to $54,999 | 5 (3.0%) | 0 (0.0%) |
| $55,000 to $64,999 | 11 (6.6%) | 4 (2.6%) |
| $65,000 to $74,999 | 7 (4.2%) | 4 (2.6%) |
| $75,000 to $99,999 | 9 (5.4%) | 0 (0.0%) |
| $100,000+ | 5 (3.0%) | 4 (2.6%) |
| Total | 168 (100.0%) | 154 (100.0%) |
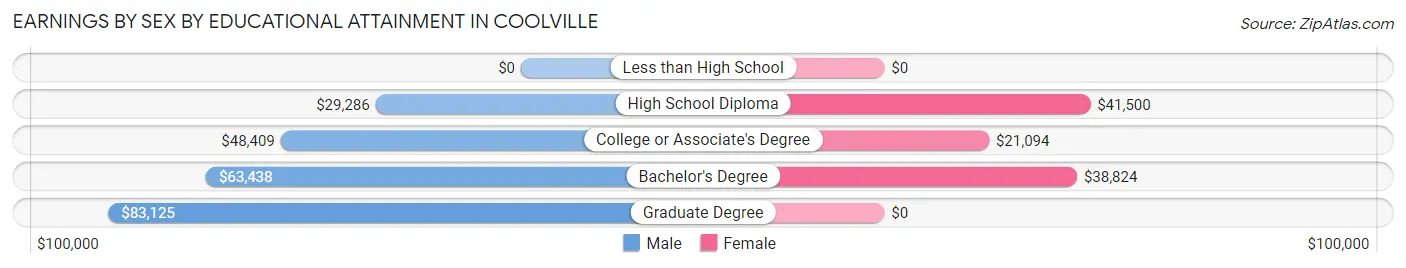
Earnings by Sex by Educational Attainment in Coolville
Average earnings in Coolville are $35,268 for men and $37,868 for women, a difference of 6.9%. Men with an educational attainment of graduate degree enjoy the highest average annual earnings of $83,125, while those with high school diploma education earn the least with $29,286. Women with an educational attainment of high school diploma earn the most with the average annual earnings of $41,500, while those with college or associate's degree education have the smallest earnings of $21,094.
| Educational Attainment | Male Income | Female Income |
| Less than High School | - | - |
| High School Diploma | $29,286 | $41,500 |
| College or Associate's Degree | $48,409 | $21,094 |
| Bachelor's Degree | $63,438 | $38,824 |
| Graduate Degree | $83,125 | $0 |
| Total | $35,268 | $37,868 |
Family Income in Coolville
Family Income Brackets in Coolville
According to the Coolville family income data, there are 43 families falling into the $75,000 to $99,999 income range, which is the most common income bracket and makes up 25.8% of all families.
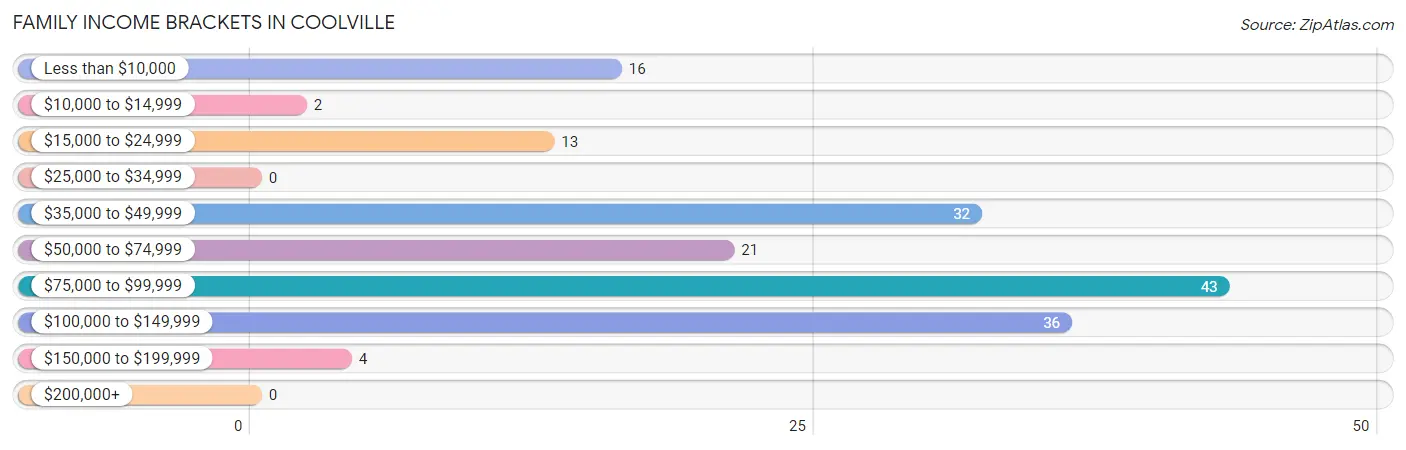
| Income Bracket | # Families | % Families |
| Less than $10,000 | 16 | 9.6% |
| $10,000 to $14,999 | 2 | 1.2% |
| $15,000 to $24,999 | 13 | 7.8% |
| $25,000 to $34,999 | 0 | 0.0% |
| $35,000 to $49,999 | 32 | 19.2% |
| $50,000 to $74,999 | 21 | 12.6% |
| $75,000 to $99,999 | 43 | 25.7% |
| $100,000 to $149,999 | 36 | 21.6% |
| $150,000 to $199,999 | 4 | 2.4% |
| $200,000+ | 0 | 0.0% |
Family Income by Famaliy Size in Coolville
4-person families (32 | 19.2%) account for the highest median family income in Coolville with $108,750 per family, while 2-person families (77 | 46.1%) have the highest median income of $29,375 per family member.
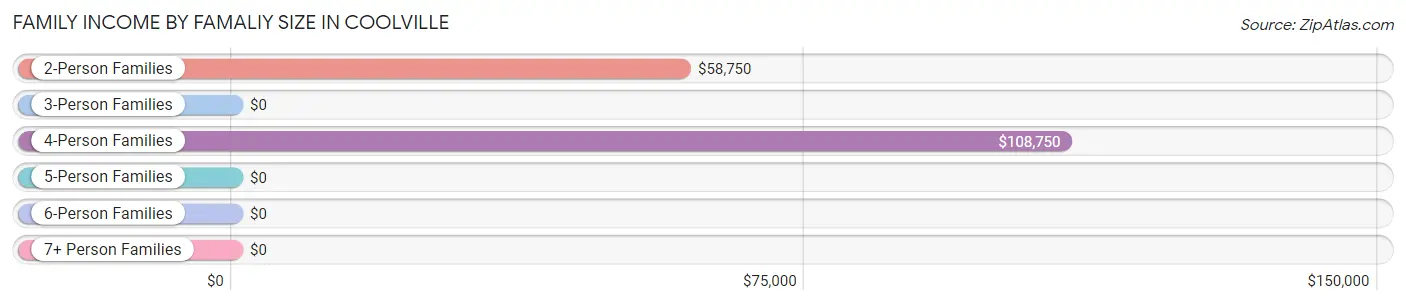
| Income Bracket | # Families | Median Income |
| 2-Person Families | 77 (46.1%) | $58,750 |
| 3-Person Families | 46 (27.5%) | $0 |
| 4-Person Families | 32 (19.2%) | $108,750 |
| 5-Person Families | 4 (2.4%) | $0 |
| 6-Person Families | 3 (1.8%) | $0 |
| 7+ Person Families | 5 (3.0%) | $0 |
| Total | 167 (100.0%) | $62,188 |
Family Income by Number of Earners in Coolville
The median family income in Coolville is $62,188, with families comprising 2 earners (51) having the highest median family income of $91,875, while families with no earners (20) have the lowest median family income of $36,000, accounting for 30.5% and 12.0% of families, respectively.
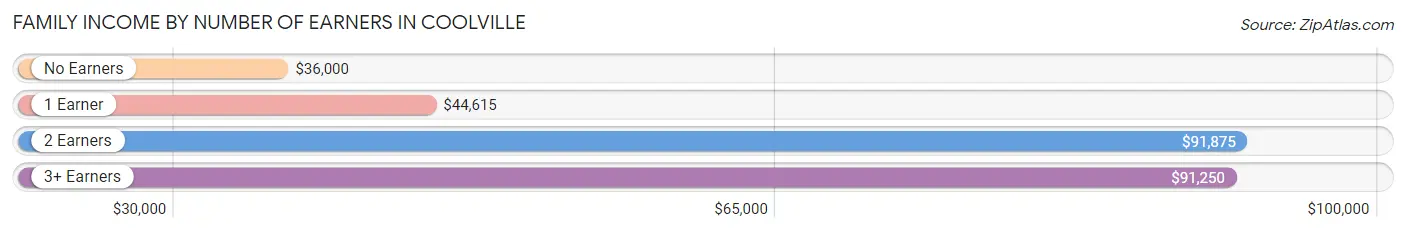
| Number of Earners | # Families | Median Income |
| No Earners | 20 (12.0%) | $36,000 |
| 1 Earner | 64 (38.3%) | $44,615 |
| 2 Earners | 51 (30.5%) | $91,875 |
| 3+ Earners | 32 (19.2%) | $91,250 |
| Total | 167 (100.0%) | $62,188 |
Household Income in Coolville
Household Income Brackets in Coolville
With 53 households falling in the category, the $15,000 to $24,999 income range is the most frequent in Coolville, accounting for 20.4% of all households.
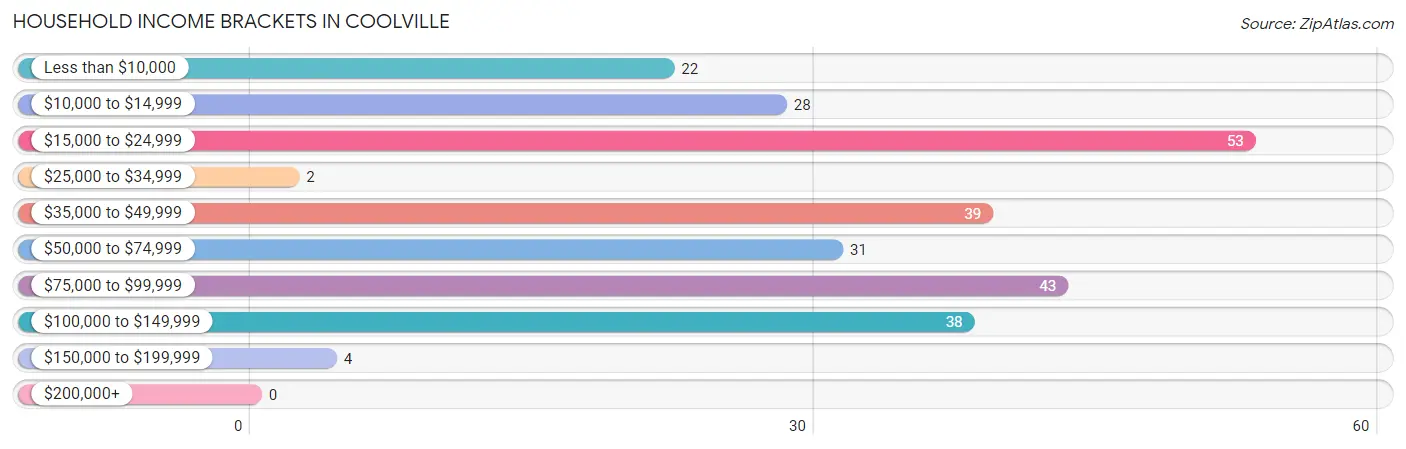
| Income Bracket | # Households | % Households |
| Less than $10,000 | 22 | 8.5% |
| $10,000 to $14,999 | 28 | 10.8% |
| $15,000 to $24,999 | 53 | 20.4% |
| $25,000 to $34,999 | 2 | 0.8% |
| $35,000 to $49,999 | 39 | 15.0% |
| $50,000 to $74,999 | 31 | 11.9% |
| $75,000 to $99,999 | 43 | 16.5% |
| $100,000 to $149,999 | 38 | 14.6% |
| $150,000 to $199,999 | 4 | 1.5% |
| $200,000+ | 0 | 0.0% |
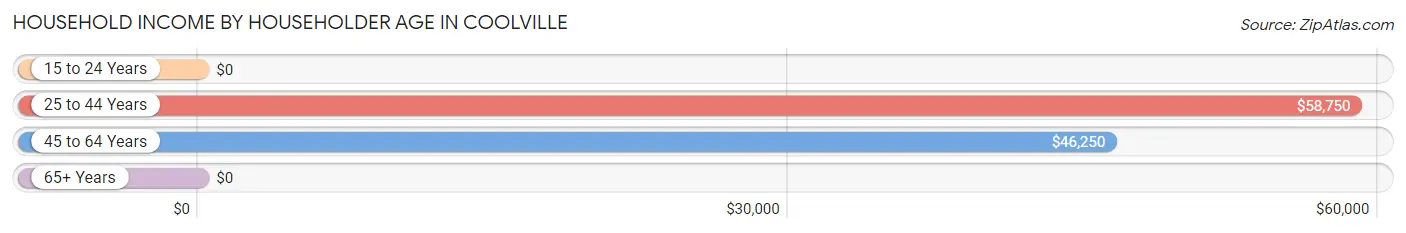
Household Income by Householder Age in Coolville
The median household income in Coolville is $45,417, with the highest median household income of $58,750 found in the 25 to 44 years age bracket for the primary householder. A total of 78 households (30.0%) fall into this category.
| Income Bracket | # Households | Median Income |
| 15 to 24 Years | 0 (0.0%) | $0 |
| 25 to 44 Years | 78 (30.0%) | $58,750 |
| 45 to 64 Years | 113 (43.5%) | $46,250 |
| 65+ Years | 69 (26.5%) | $0 |
| Total | 260 (100.0%) | $45,417 |
Poverty in Coolville
Income Below Poverty by Sex and Age in Coolville
With 21.3% poverty level for males and 17.5% for females among the residents of Coolville, 16 and 17 year old males and 12 to 14 year old females are the most vulnerable to poverty, with 8 males (100.0%) and 4 females (66.7%) in their respective age groups living below the poverty level.
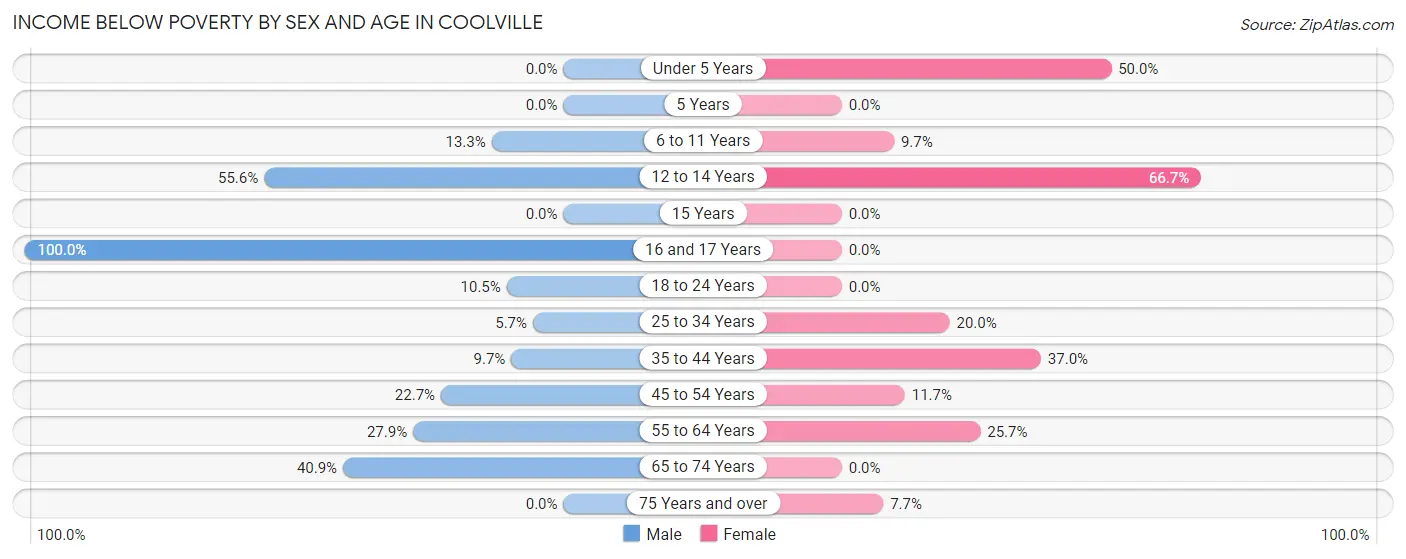
| Age Bracket | Male | Female |
| Under 5 Years | 0 (0.0%) | 3 (50.0%) |
| 5 Years | 0 (0.0%) | 0 (0.0%) |
| 6 to 11 Years | 4 (13.3%) | 3 (9.7%) |
| 12 to 14 Years | 10 (55.6%) | 4 (66.7%) |
| 15 Years | 0 (0.0%) | 0 (0.0%) |
| 16 and 17 Years | 8 (100.0%) | 0 (0.0%) |
| 18 to 24 Years | 2 (10.5%) | 0 (0.0%) |
| 25 to 34 Years | 3 (5.7%) | 3 (20.0%) |
| 35 to 44 Years | 3 (9.7%) | 17 (37.0%) |
| 45 to 54 Years | 10 (22.7%) | 9 (11.7%) |
| 55 to 64 Years | 12 (27.9%) | 9 (25.7%) |
| 65 to 74 Years | 18 (40.9%) | 0 (0.0%) |
| 75 Years and over | 0 (0.0%) | 2 (7.7%) |
| Total | 70 (21.3%) | 50 (17.5%) |
Income Above Poverty by Sex and Age in Coolville
According to the poverty statistics in Coolville, males aged under 5 years and females aged 15 years are the age groups that are most secure financially, with 100.0% of males and 100.0% of females in these age groups living above the poverty line.
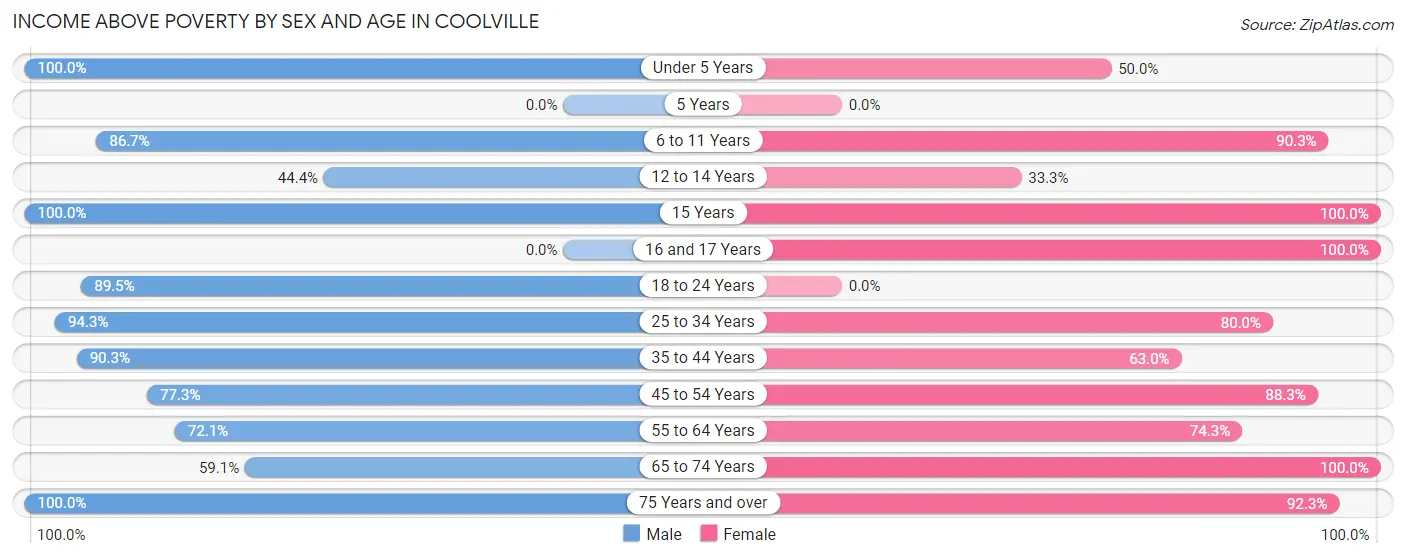
| Age Bracket | Male | Female |
| Under 5 Years | 8 (100.0%) | 3 (50.0%) |
| 5 Years | 0 (0.0%) | 0 (0.0%) |
| 6 to 11 Years | 26 (86.7%) | 28 (90.3%) |
| 12 to 14 Years | 8 (44.4%) | 2 (33.3%) |
| 15 Years | 12 (100.0%) | 10 (100.0%) |
| 16 and 17 Years | 0 (0.0%) | 10 (100.0%) |
| 18 to 24 Years | 17 (89.5%) | 0 (0.0%) |
| 25 to 34 Years | 50 (94.3%) | 12 (80.0%) |
| 35 to 44 Years | 28 (90.3%) | 29 (63.0%) |
| 45 to 54 Years | 34 (77.3%) | 68 (88.3%) |
| 55 to 64 Years | 31 (72.1%) | 26 (74.3%) |
| 65 to 74 Years | 26 (59.1%) | 24 (100.0%) |
| 75 Years and over | 19 (100.0%) | 24 (92.3%) |
| Total | 259 (78.7%) | 236 (82.5%) |
Income Below Poverty Among Married-Couple Families in Coolville
The poverty statistics for married-couple families in Coolville show that 7.3% or 9 of the total 124 families live below the poverty line. Families with 1 or 2 children have the highest poverty rate of 16.7%, comprising of 7 families. On the other hand, families with 3 or 4 children have the lowest poverty rate of 0.0%, which includes 0 families.
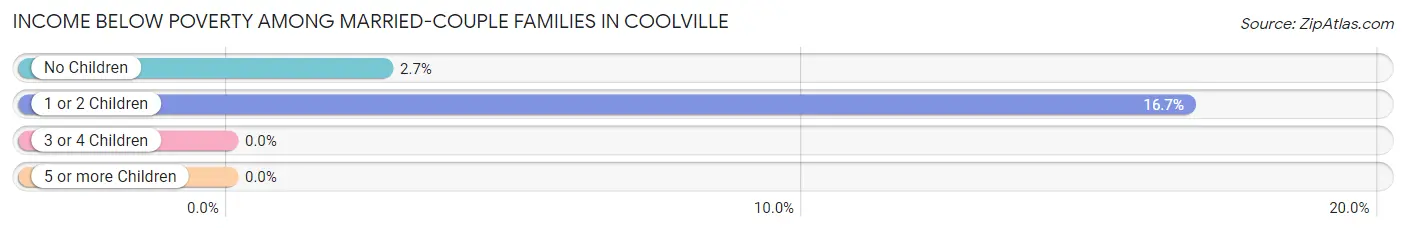
| Children | Above Poverty | Below Poverty |
| No Children | 72 (97.3%) | 2 (2.7%) |
| 1 or 2 Children | 35 (83.3%) | 7 (16.7%) |
| 3 or 4 Children | 3 (100.0%) | 0 (0.0%) |
| 5 or more Children | 5 (100.0%) | 0 (0.0%) |
| Total | 115 (92.7%) | 9 (7.3%) |
Income Below Poverty Among Single-Parent Households in Coolville
According to the poverty data in Coolville, 27.3% or 3 single-father households and 40.6% or 13 single-mother households are living below the poverty line. Among single-father households, those with no children have the highest poverty rate, with 3 households (27.3%) experiencing poverty. Likewise, among single-mother households, those with 1 or 2 children have the highest poverty rate, with 13 households (50.0%) falling below the poverty line.
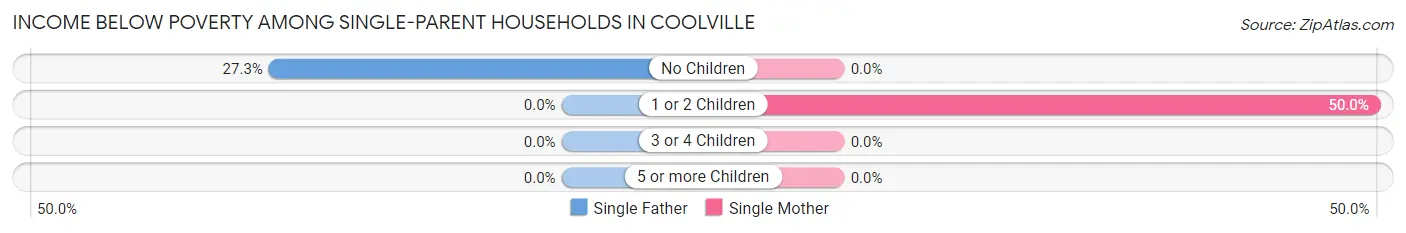
| Children | Single Father | Single Mother |
| No Children | 3 (27.3%) | 0 (0.0%) |
| 1 or 2 Children | 0 (0.0%) | 13 (50.0%) |
| 3 or 4 Children | 0 (0.0%) | 0 (0.0%) |
| 5 or more Children | 0 (0.0%) | 0 (0.0%) |
| Total | 3 (27.3%) | 13 (40.6%) |
Income Below Poverty Among Married-Couple vs Single-Parent Households in Coolville
The poverty data for Coolville shows that 9 of the married-couple family households (7.3%) and 16 of the single-parent households (37.2%) are living below the poverty level. Within the married-couple family households, those with 1 or 2 children have the highest poverty rate, with 7 households (16.7%) falling below the poverty line. Among the single-parent households, those with 1 or 2 children have the highest poverty rate, with 13 household (50.0%) living below poverty.
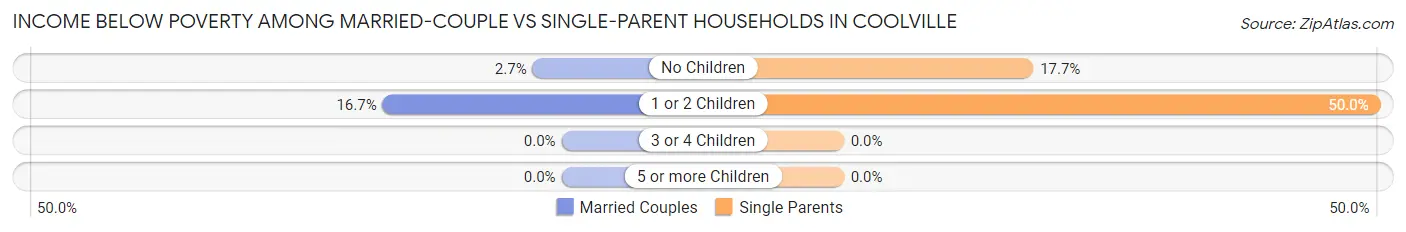
| Children | Married-Couple Families | Single-Parent Households |
| No Children | 2 (2.7%) | 3 (17.6%) |
| 1 or 2 Children | 7 (16.7%) | 13 (50.0%) |
| 3 or 4 Children | 0 (0.0%) | 0 (0.0%) |
| 5 or more Children | 0 (0.0%) | 0 (0.0%) |
| Total | 9 (7.3%) | 16 (37.2%) |
Race in Coolville
The most populous races in Coolville are White / Caucasian (602 | 97.9%), Two or more Races (13 | 2.1%), and Hispanic or Latino (2 | 0.3%).
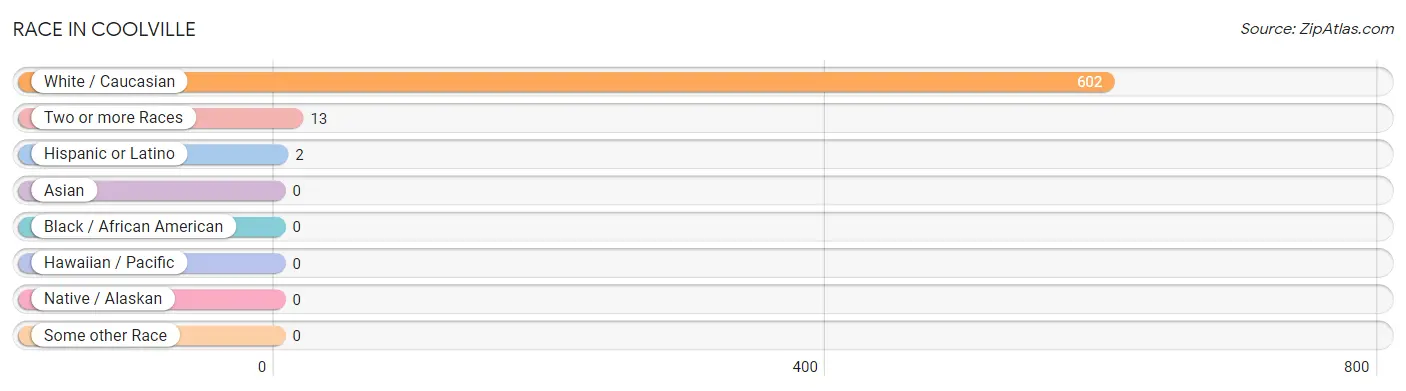
| Race | # Population | % Population |
| Asian | 0 | 0.0% |
| Black / African American | 0 | 0.0% |
| Hawaiian / Pacific | 0 | 0.0% |
| Hispanic or Latino | 2 | 0.3% |
| Native / Alaskan | 0 | 0.0% |
| White / Caucasian | 602 | 97.9% |
| Two or more Races | 13 | 2.1% |
| Some other Race | 0 | 0.0% |
| Total | 615 | 100.0% |
Ancestry in Coolville
The most populous ancestries reported in Coolville are German (124 | 20.2%), Irish (48 | 7.8%), English (45 | 7.3%), American (42 | 6.8%), and Czech (21 | 3.4%), together accounting for 45.5% of all Coolville residents.
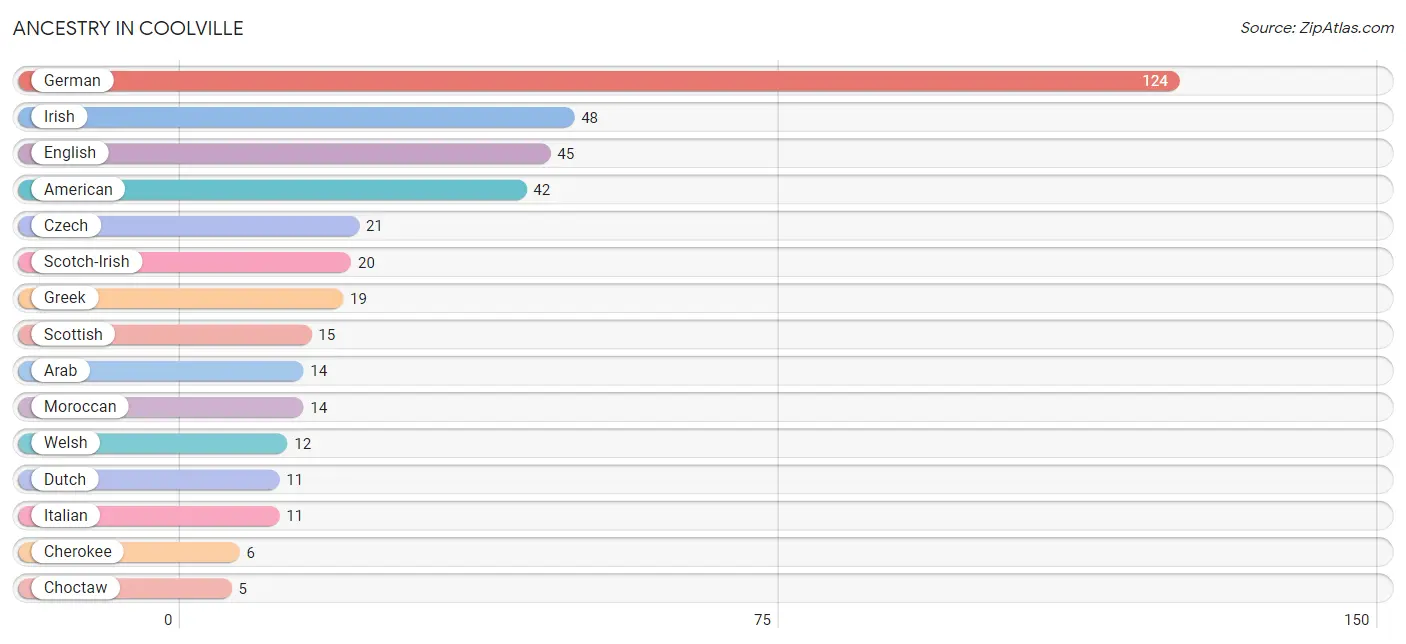
| Ancestry | # Population | % Population |
| American | 42 | 6.8% |
| Apache | 1 | 0.2% |
| Arab | 14 | 2.3% |
| Cherokee | 6 | 1.0% |
| Choctaw | 5 | 0.8% |
| Czech | 21 | 3.4% |
| Dutch | 11 | 1.8% |
| English | 45 | 7.3% |
| German | 124 | 20.2% |
| Greek | 19 | 3.1% |
| Hungarian | 3 | 0.5% |
| Irish | 48 | 7.8% |
| Italian | 11 | 1.8% |
| Moroccan | 14 | 2.3% |
| Polish | 5 | 0.8% |
| Scotch-Irish | 20 | 3.3% |
| Scottish | 15 | 2.4% |
| Seminole | 1 | 0.2% |
| Spanish | 2 | 0.3% |
| Welsh | 12 | 1.9% | View All 20 Rows |
Immigrants in Coolville
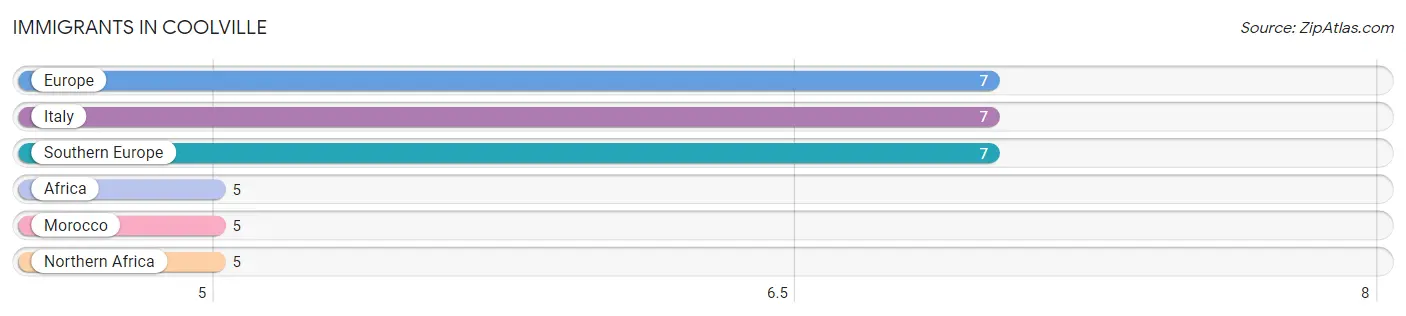
The most numerous immigrant groups reported in Coolville came from Europe (7 | 1.1%), Italy (7 | 1.1%), Southern Europe (7 | 1.1%), Africa (5 | 0.8%), and Morocco (5 | 0.8%), together accounting for 5.0% of all Coolville residents.
| Immigration Origin | # Population | % Population |
| Africa | 5 | 0.8% |
| Europe | 7 | 1.1% |
| Italy | 7 | 1.1% |
| Morocco | 5 | 0.8% |
| Northern Africa | 5 | 0.8% |
| Southern Europe | 7 | 1.1% | View All 6 Rows |
Sex and Age in Coolville
Sex and Age in Coolville
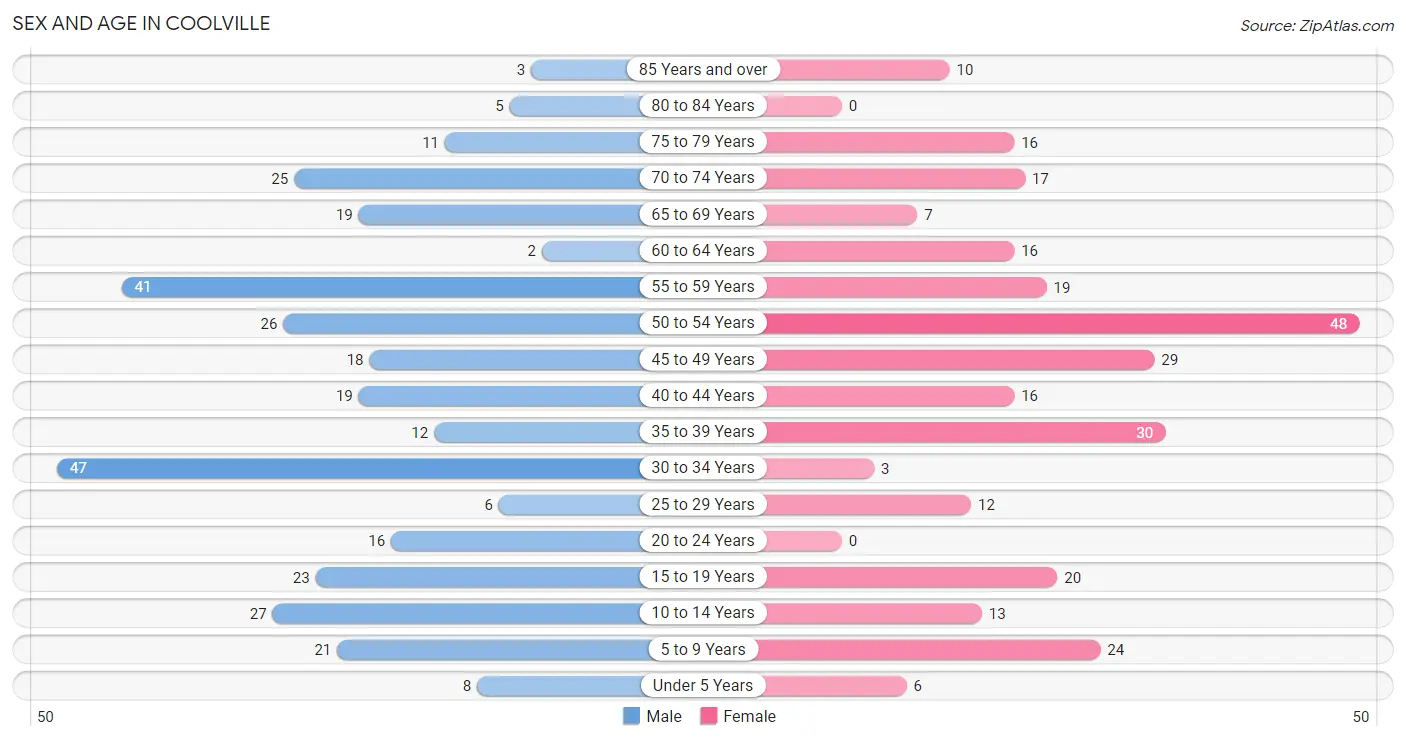
The most populous age groups in Coolville are 30 to 34 Years (47 | 14.3%) for men and 50 to 54 Years (48 | 16.8%) for women.
| Age Bracket | Male | Female |
| Under 5 Years | 8 (2.4%) | 6 (2.1%) |
| 5 to 9 Years | 21 (6.4%) | 24 (8.4%) |
| 10 to 14 Years | 27 (8.2%) | 13 (4.5%) |
| 15 to 19 Years | 23 (7.0%) | 20 (7.0%) |
| 20 to 24 Years | 16 (4.9%) | 0 (0.0%) |
| 25 to 29 Years | 6 (1.8%) | 12 (4.2%) |
| 30 to 34 Years | 47 (14.3%) | 3 (1.1%) |
| 35 to 39 Years | 12 (3.6%) | 30 (10.5%) |
| 40 to 44 Years | 19 (5.8%) | 16 (5.6%) |
| 45 to 49 Years | 18 (5.5%) | 29 (10.1%) |
| 50 to 54 Years | 26 (7.9%) | 48 (16.8%) |
| 55 to 59 Years | 41 (12.5%) | 19 (6.6%) |
| 60 to 64 Years | 2 (0.6%) | 16 (5.6%) |
| 65 to 69 Years | 19 (5.8%) | 7 (2.5%) |
| 70 to 74 Years | 25 (7.6%) | 17 (5.9%) |
| 75 to 79 Years | 11 (3.3%) | 16 (5.6%) |
| 80 to 84 Years | 5 (1.5%) | 0 (0.0%) |
| 85 Years and over | 3 (0.9%) | 10 (3.5%) |
| Total | 329 (100.0%) | 286 (100.0%) |
Families and Households in Coolville
Median Family Size in Coolville
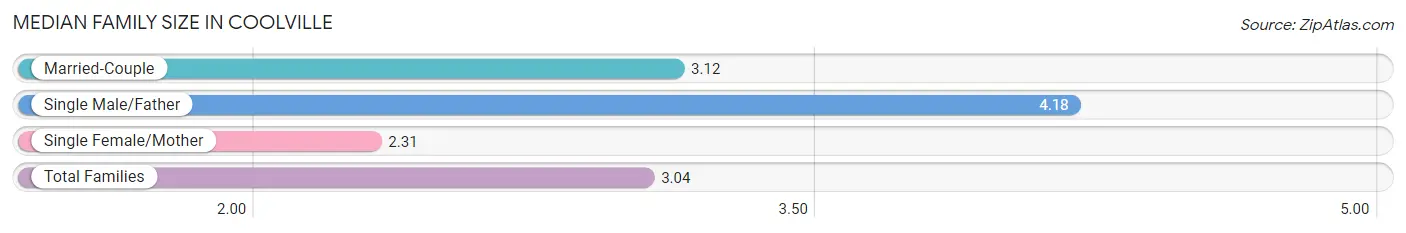
The median family size in Coolville is 3.04 persons per family, with single male/father families (11 | 6.6%) accounting for the largest median family size of 4.18 persons per family. On the other hand, single female/mother families (32 | 19.2%) represent the smallest median family size with 2.31 persons per family.
| Family Type | # Families | Family Size |
| Married-Couple | 124 (74.3%) | 3.12 |
| Single Male/Father | 11 (6.6%) | 4.18 |
| Single Female/Mother | 32 (19.2%) | 2.31 |
| Total Families | 167 (100.0%) | 3.04 |
Median Household Size in Coolville
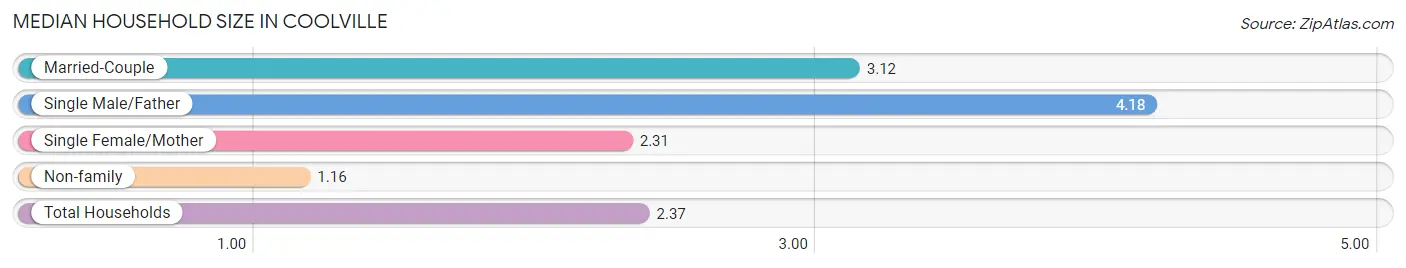
The median household size in Coolville is 2.37 persons per household, with single male/father households (11 | 4.2%) accounting for the largest median household size of 4.18 persons per household. non-family households (93 | 35.8%) represent the smallest median household size with 1.16 persons per household.
| Household Type | # Households | Household Size |
| Married-Couple | 124 (47.7%) | 3.12 |
| Single Male/Father | 11 (4.2%) | 4.18 |
| Single Female/Mother | 32 (12.3%) | 2.31 |
| Non-family | 93 (35.8%) | 1.16 |
| Total Households | 260 (100.0%) | 2.37 |
Household Size by Marriage Status in Coolville
Out of a total of 260 households in Coolville, 167 (64.2%) are family households, while 93 (35.8%) are nonfamily households. The most numerous type of family households are 2-person households, comprising 77, and the most common type of nonfamily households are 1-person households, comprising 79.
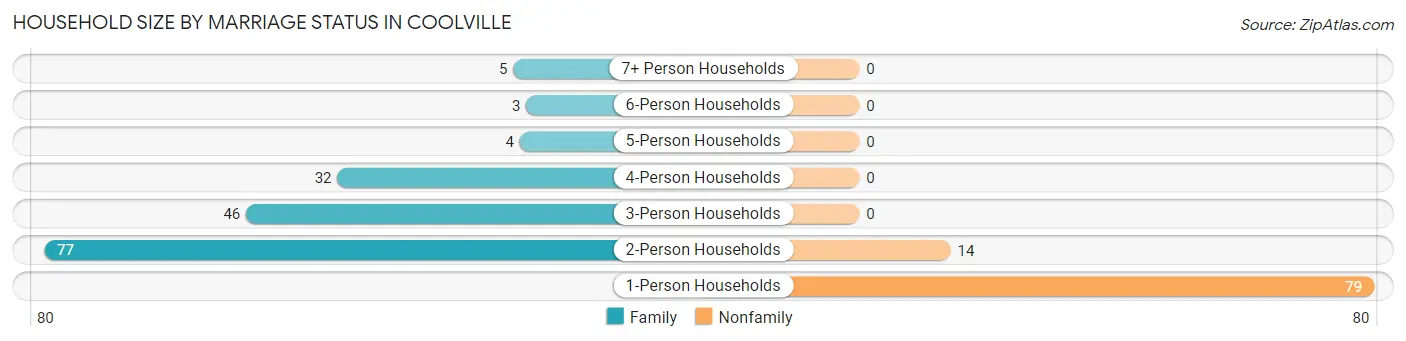
| Household Size | Family Households | Nonfamily Households |
| 1-Person Households | - | 79 (30.4%) |
| 2-Person Households | 77 (29.6%) | 14 (5.4%) |
| 3-Person Households | 46 (17.7%) | 0 (0.0%) |
| 4-Person Households | 32 (12.3%) | 0 (0.0%) |
| 5-Person Households | 4 (1.5%) | 0 (0.0%) |
| 6-Person Households | 3 (1.1%) | 0 (0.0%) |
| 7+ Person Households | 5 (1.9%) | 0 (0.0%) |
| Total | 167 (64.2%) | 93 (35.8%) |
Female Fertility in Coolville
Fertility by Age in Coolville
Average fertility rate in Coolville is 18.0 births per 1,000 women. Women in the age bracket of 20 to 34 years have the highest fertility rate with 133.0 births per 1,000 women. Women in the age bracket of 20 to 34 years acount for 100.0% of all women with births.
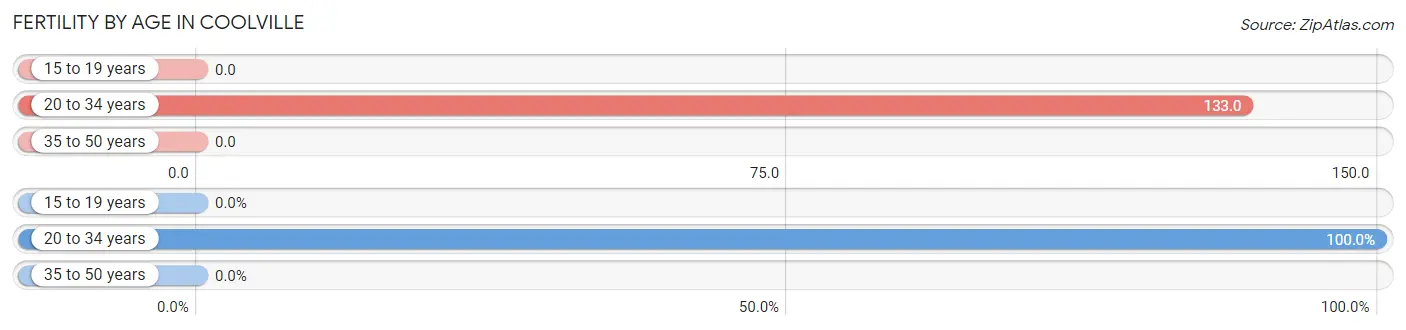
| Age Bracket | Women with Births | Births / 1,000 Women |
| 15 to 19 years | 0 (0.0%) | 0.0 |
| 20 to 34 years | 2 (100.0%) | 133.0 |
| 35 to 50 years | 0 (0.0%) | 0.0 |
| Total | 2 (100.0%) | 18.0 |
Fertility by Age by Marriage Status in Coolville
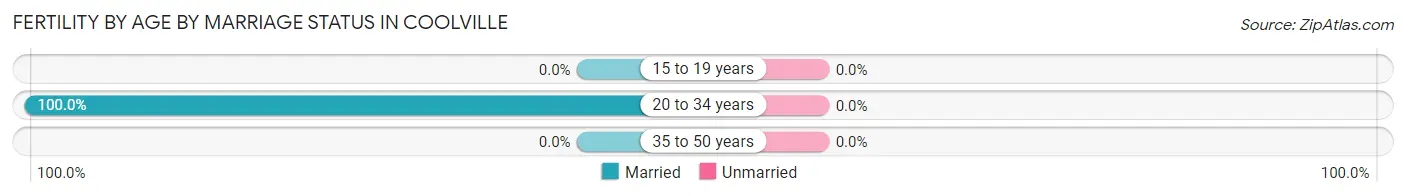
| Age Bracket | Married | Unmarried |
| 15 to 19 years | 0 (0.0%) | 0 (0.0%) |
| 20 to 34 years | 2 (100.0%) | 0 (0.0%) |
| 35 to 50 years | 0 (0.0%) | 0 (0.0%) |
| Total | 2 (100.0%) | 0 (0.0%) |
Fertility by Education in Coolville
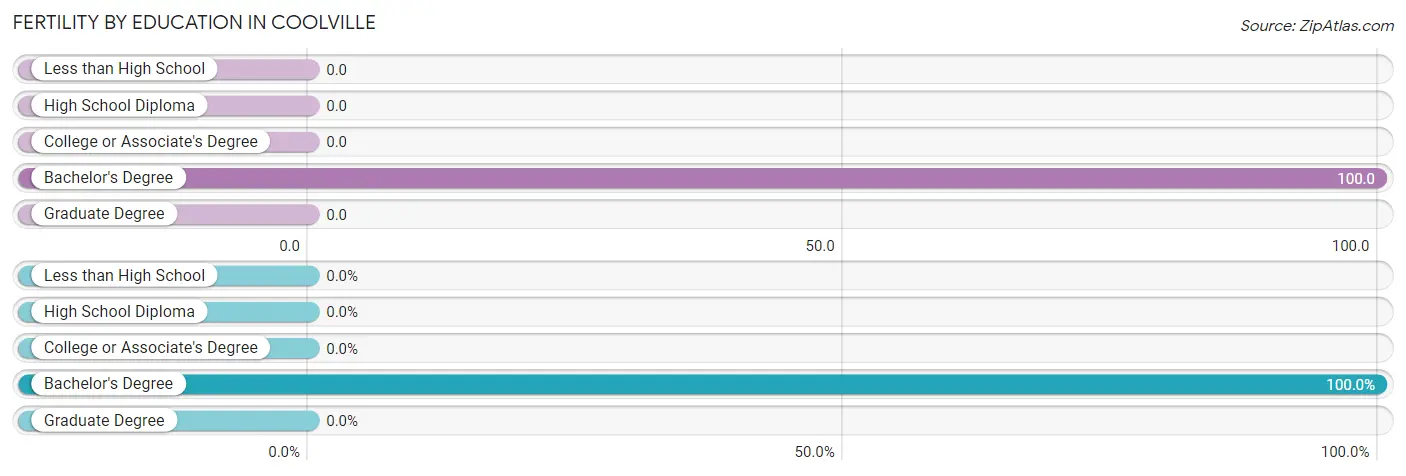
| Educational Attainment | Women with Births | Births / 1,000 Women |
| Less than High School | 0 (0.0%) | 0.0 |
| High School Diploma | 0 (0.0%) | 0.0 |
| College or Associate's Degree | 0 (0.0%) | 0.0 |
| Bachelor's Degree | 2 (100.0%) | 100.0 |
| Graduate Degree | 0 (0.0%) | 0.0 |
| Total | 2 (100.0%) | 18.0 |
Fertility by Education by Marriage Status in Coolville
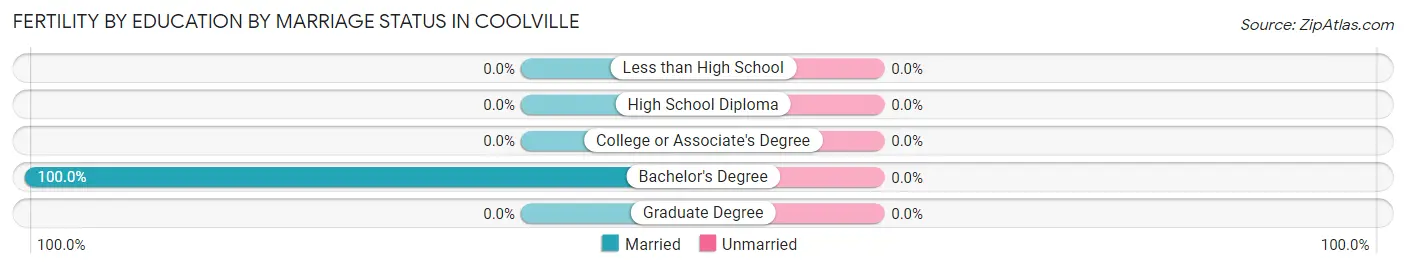
| Educational Attainment | Married | Unmarried |
| Less than High School | 0 (0.0%) | 0 (0.0%) |
| High School Diploma | 0 (0.0%) | 0 (0.0%) |
| College or Associate's Degree | 0 (0.0%) | 0 (0.0%) |
| Bachelor's Degree | 2 (100.0%) | 0 (0.0%) |
| Graduate Degree | 0 (0.0%) | 0 (0.0%) |
| Total | 2 (100.0%) | 0 (0.0%) |
Employment Characteristics in Coolville
Employment by Class of Employer in Coolville
Among the 284 employed individuals in Coolville, private company employees (171 | 60.2%), not-for-profit organizations (44 | 15.5%), and state government employees (31 | 10.9%) make up the most common classes of employment.
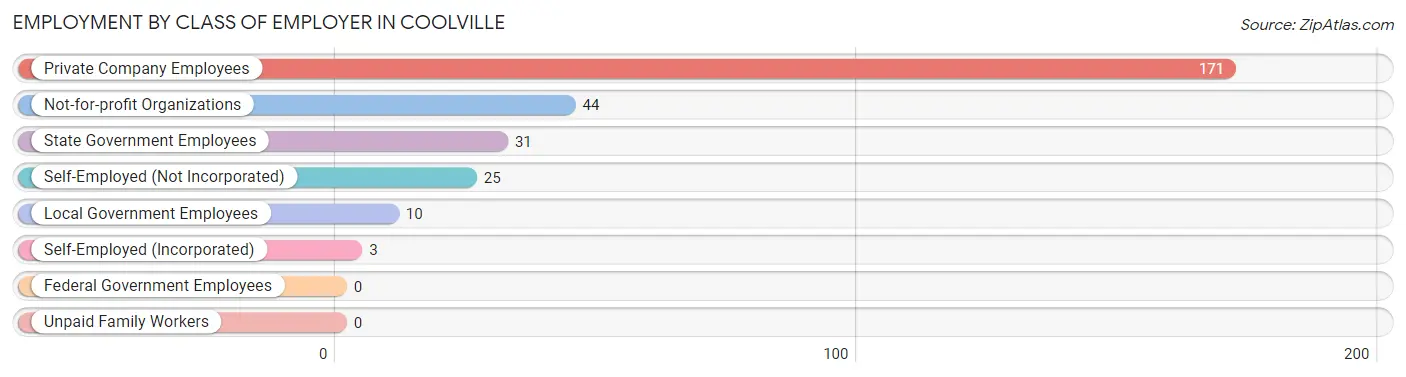
| Employer Class | # Employees | % Employees |
| Private Company Employees | 171 | 60.2% |
| Self-Employed (Incorporated) | 3 | 1.1% |
| Self-Employed (Not Incorporated) | 25 | 8.8% |
| Not-for-profit Organizations | 44 | 15.5% |
| Local Government Employees | 10 | 3.5% |
| State Government Employees | 31 | 10.9% |
| Federal Government Employees | 0 | 0.0% |
| Unpaid Family Workers | 0 | 0.0% |
| Total | 284 | 100.0% |
Employment Status by Age in Coolville
According to the labor force statistics for Coolville, out of the total population over 16 years of age (494), 66.8% or 330 individuals are in the labor force, with 7.3% or 24 of them unemployed. The age group with the highest labor force participation rate is 35 to 44 years, with 96.1% or 74 individuals in the labor force. Within the labor force, the 16 to 19 years age range has the highest percentage of unemployed individuals, with 50.0% or 5 of them being unemployed.
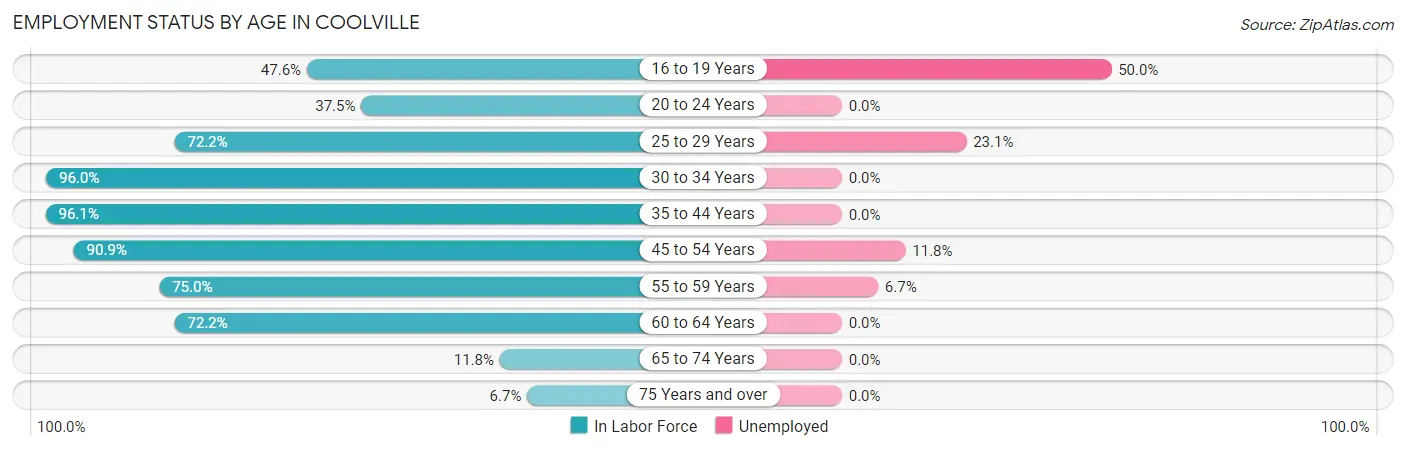
| Age Bracket | In Labor Force | Unemployed |
| 16 to 19 Years | 10 (47.6%) | 5 (50.0%) |
| 20 to 24 Years | 6 (37.5%) | 0 (0.0%) |
| 25 to 29 Years | 13 (72.2%) | 3 (23.1%) |
| 30 to 34 Years | 48 (96.0%) | 0 (0.0%) |
| 35 to 44 Years | 74 (96.1%) | 0 (0.0%) |
| 45 to 54 Years | 110 (90.9%) | 13 (11.8%) |
| 55 to 59 Years | 45 (75.0%) | 3 (6.7%) |
| 60 to 64 Years | 13 (72.2%) | 0 (0.0%) |
| 65 to 74 Years | 8 (11.8%) | 0 (0.0%) |
| 75 Years and over | 3 (6.7%) | 0 (0.0%) |
| Total | 330 (66.8%) | 24 (7.3%) |
Employment Status by Educational Attainment in Coolville
According to labor force statistics for Coolville, 88.1% of individuals (303) out of the total population between 25 and 64 years of age (344) are in the labor force, with 6.3% or 19 of them being unemployed. The group with the highest labor force participation rate are those with the educational attainment of high school diploma, with 93.4% or 155 individuals in the labor force. Within the labor force, individuals with high school diploma education have the highest percentage of unemployment, with 10.3% or 16 of them being unemployed.
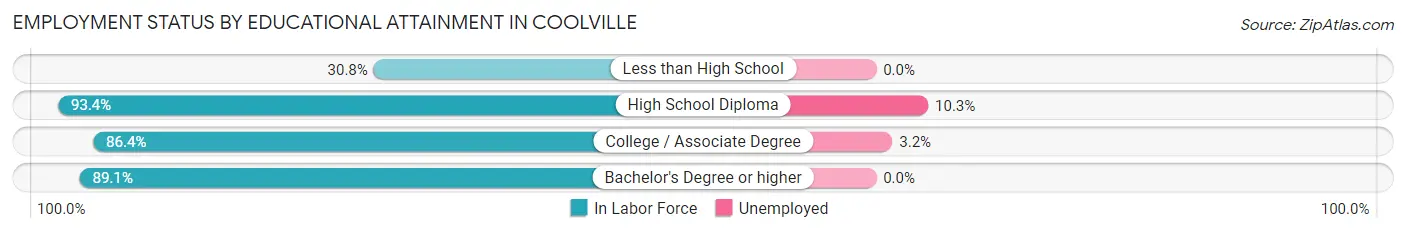
| Educational Attainment | In Labor Force | Unemployed |
| Less than High School | 4 (30.8%) | 0 (0.0%) |
| High School Diploma | 155 (93.4%) | 17 (10.3%) |
| College / Associate Degree | 95 (86.4%) | 4 (3.2%) |
| Bachelor's Degree or higher | 49 (89.1%) | 0 (0.0%) |
| Total | 303 (88.1%) | 22 (6.3%) |
Employment Occupations by Sex in Coolville
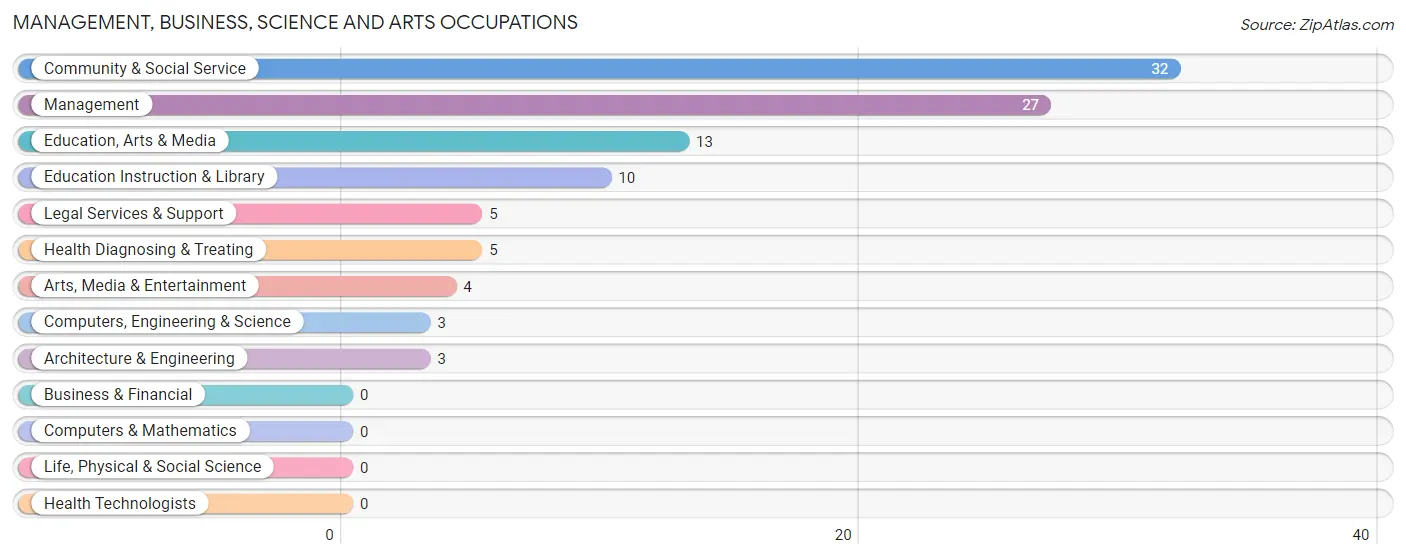
Management, Business, Science and Arts Occupations
The most common Management, Business, Science and Arts occupations in Coolville are Community & Social Service (32 | 10.5%), Management (27 | 8.8%), Education, Arts & Media (13 | 4.3%), Education Instruction & Library (10 | 3.3%), and Legal Services & Support (5 | 1.6%).
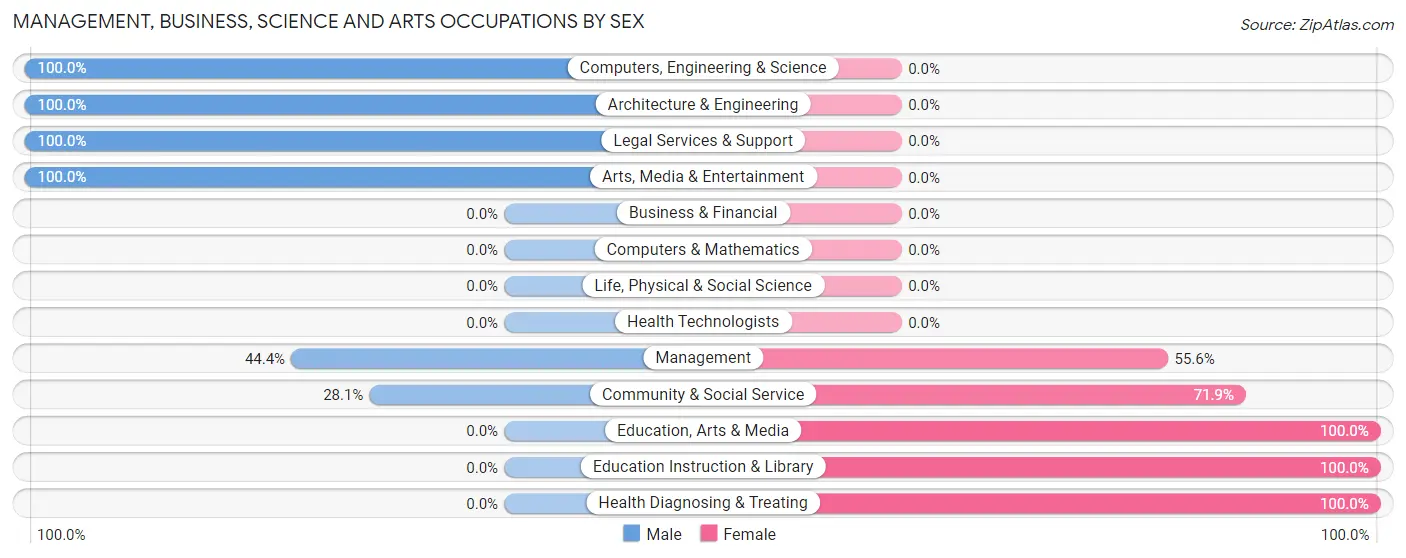
Management, Business, Science and Arts Occupations by Sex
Within the Management, Business, Science and Arts occupations in Coolville, the most male-oriented occupations are Computers, Engineering & Science (100.0%), Architecture & Engineering (100.0%), and Legal Services & Support (100.0%), while the most female-oriented occupations are Education, Arts & Media (100.0%), Education Instruction & Library (100.0%), and Health Diagnosing & Treating (100.0%).
| Occupation | Male | Female |
| Management | 12 (44.4%) | 15 (55.6%) |
| Business & Financial | 0 (0.0%) | 0 (0.0%) |
| Computers, Engineering & Science | 3 (100.0%) | 0 (0.0%) |
| Computers & Mathematics | 0 (0.0%) | 0 (0.0%) |
| Architecture & Engineering | 3 (100.0%) | 0 (0.0%) |
| Life, Physical & Social Science | 0 (0.0%) | 0 (0.0%) |
| Community & Social Service | 9 (28.1%) | 23 (71.9%) |
| Education, Arts & Media | 0 (0.0%) | 13 (100.0%) |
| Legal Services & Support | 5 (100.0%) | 0 (0.0%) |
| Education Instruction & Library | 0 (0.0%) | 10 (100.0%) |
| Arts, Media & Entertainment | 4 (100.0%) | 0 (0.0%) |
| Health Diagnosing & Treating | 0 (0.0%) | 5 (100.0%) |
| Health Technologists | 0 (0.0%) | 0 (0.0%) |
| Total (Category) | 24 (35.8%) | 43 (64.2%) |
| Total (Overall) | 156 (51.0%) | 150 (49.0%) |
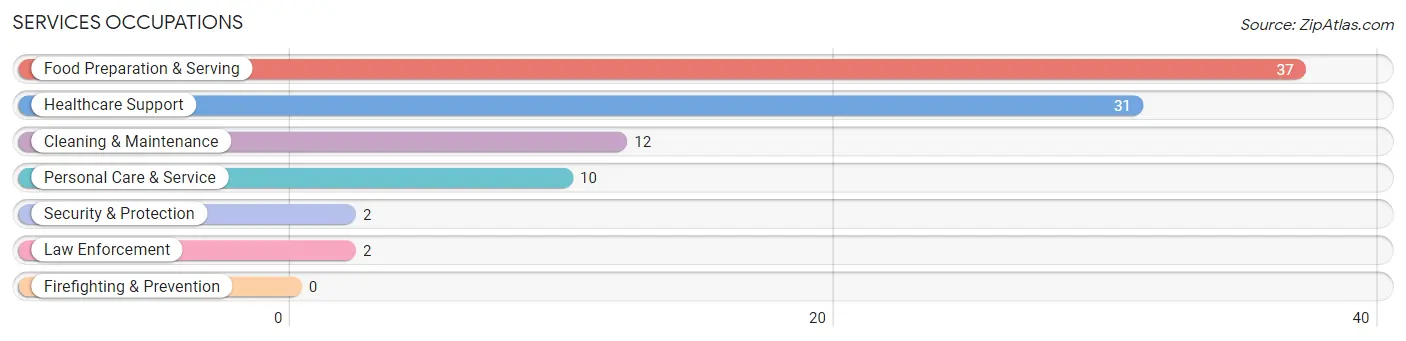
Services Occupations
The most common Services occupations in Coolville are Food Preparation & Serving (37 | 12.1%), Healthcare Support (31 | 10.1%), Cleaning & Maintenance (12 | 3.9%), Personal Care & Service (10 | 3.3%), and Security & Protection (2 | 0.6%).
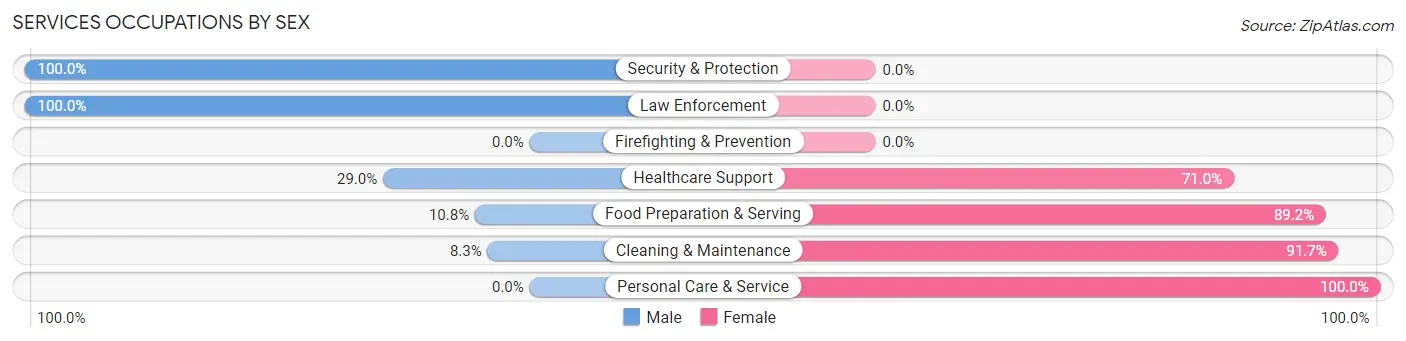
Services Occupations by Sex
Within the Services occupations in Coolville, the most male-oriented occupations are Security & Protection (100.0%), Law Enforcement (100.0%), and Healthcare Support (29.0%), while the most female-oriented occupations are Personal Care & Service (100.0%), Cleaning & Maintenance (91.7%), and Food Preparation & Serving (89.2%).
| Occupation | Male | Female |
| Healthcare Support | 9 (29.0%) | 22 (71.0%) |
| Security & Protection | 2 (100.0%) | 0 (0.0%) |
| Firefighting & Prevention | 0 (0.0%) | 0 (0.0%) |
| Law Enforcement | 2 (100.0%) | 0 (0.0%) |
| Food Preparation & Serving | 4 (10.8%) | 33 (89.2%) |
| Cleaning & Maintenance | 1 (8.3%) | 11 (91.7%) |
| Personal Care & Service | 0 (0.0%) | 10 (100.0%) |
| Total (Category) | 16 (17.4%) | 76 (82.6%) |
| Total (Overall) | 156 (51.0%) | 150 (49.0%) |
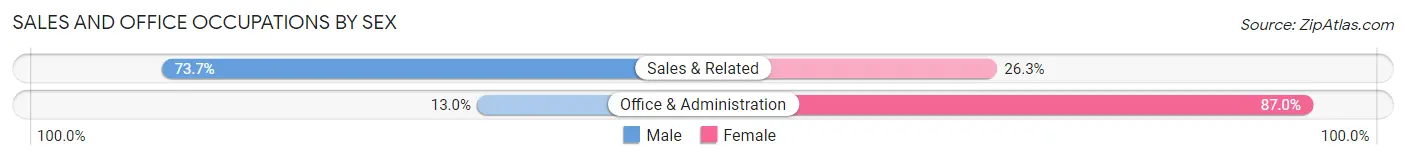
Sales and Office Occupations
The most common Sales and Office occupations in Coolville are Office & Administration (23 | 7.5%), and Sales & Related (19 | 6.2%).

Sales and Office Occupations by Sex
| Occupation | Male | Female |
| Sales & Related | 14 (73.7%) | 5 (26.3%) |
| Office & Administration | 3 (13.0%) | 20 (87.0%) |
| Total (Category) | 17 (40.5%) | 25 (59.5%) |
| Total (Overall) | 156 (51.0%) | 150 (49.0%) |
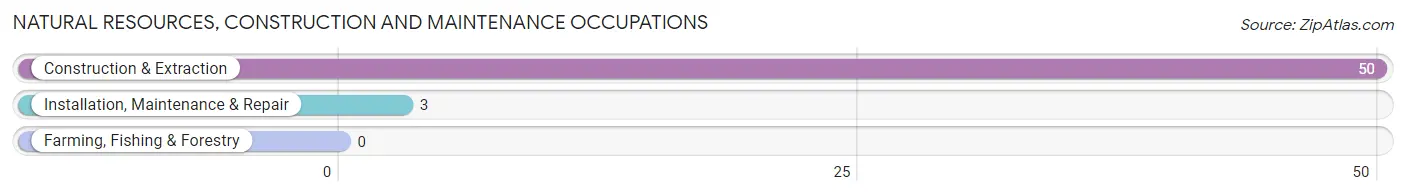
Natural Resources, Construction and Maintenance Occupations
The most common Natural Resources, Construction and Maintenance occupations in Coolville are Construction & Extraction (50 | 16.3%), and Installation, Maintenance & Repair (3 | 1.0%).
Natural Resources, Construction and Maintenance Occupations by Sex
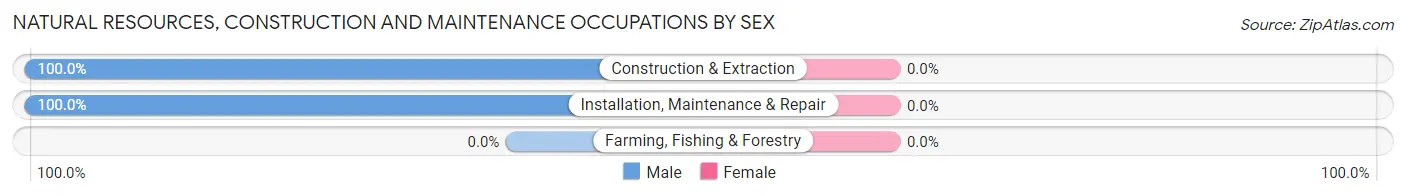
| Occupation | Male | Female |
| Farming, Fishing & Forestry | 0 (0.0%) | 0 (0.0%) |
| Construction & Extraction | 50 (100.0%) | 0 (0.0%) |
| Installation, Maintenance & Repair | 3 (100.0%) | 0 (0.0%) |
| Total (Category) | 53 (100.0%) | 0 (0.0%) |
| Total (Overall) | 156 (51.0%) | 150 (49.0%) |
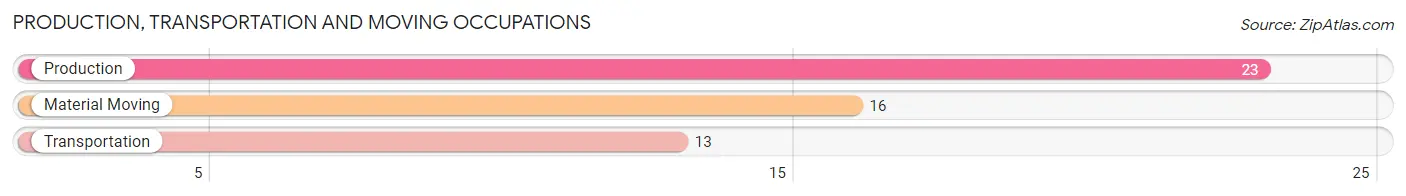
Production, Transportation and Moving Occupations
The most common Production, Transportation and Moving occupations in Coolville are Production (23 | 7.5%), Material Moving (16 | 5.2%), and Transportation (13 | 4.3%).
Production, Transportation and Moving Occupations by Sex
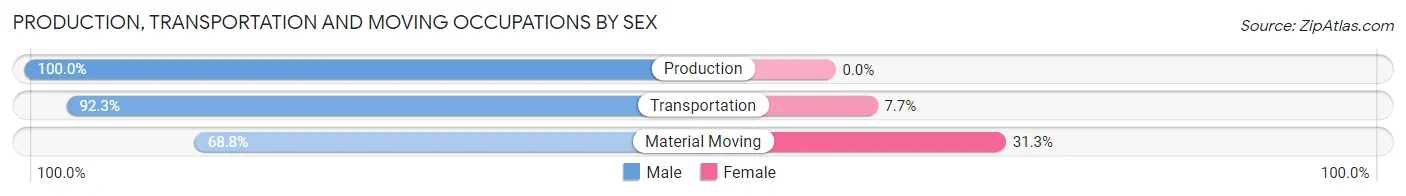
| Occupation | Male | Female |
| Production | 23 (100.0%) | 0 (0.0%) |
| Transportation | 12 (92.3%) | 1 (7.7%) |
| Material Moving | 11 (68.8%) | 5 (31.2%) |
| Total (Category) | 46 (88.5%) | 6 (11.5%) |
| Total (Overall) | 156 (51.0%) | 150 (49.0%) |
Employment Industries by Sex in Coolville
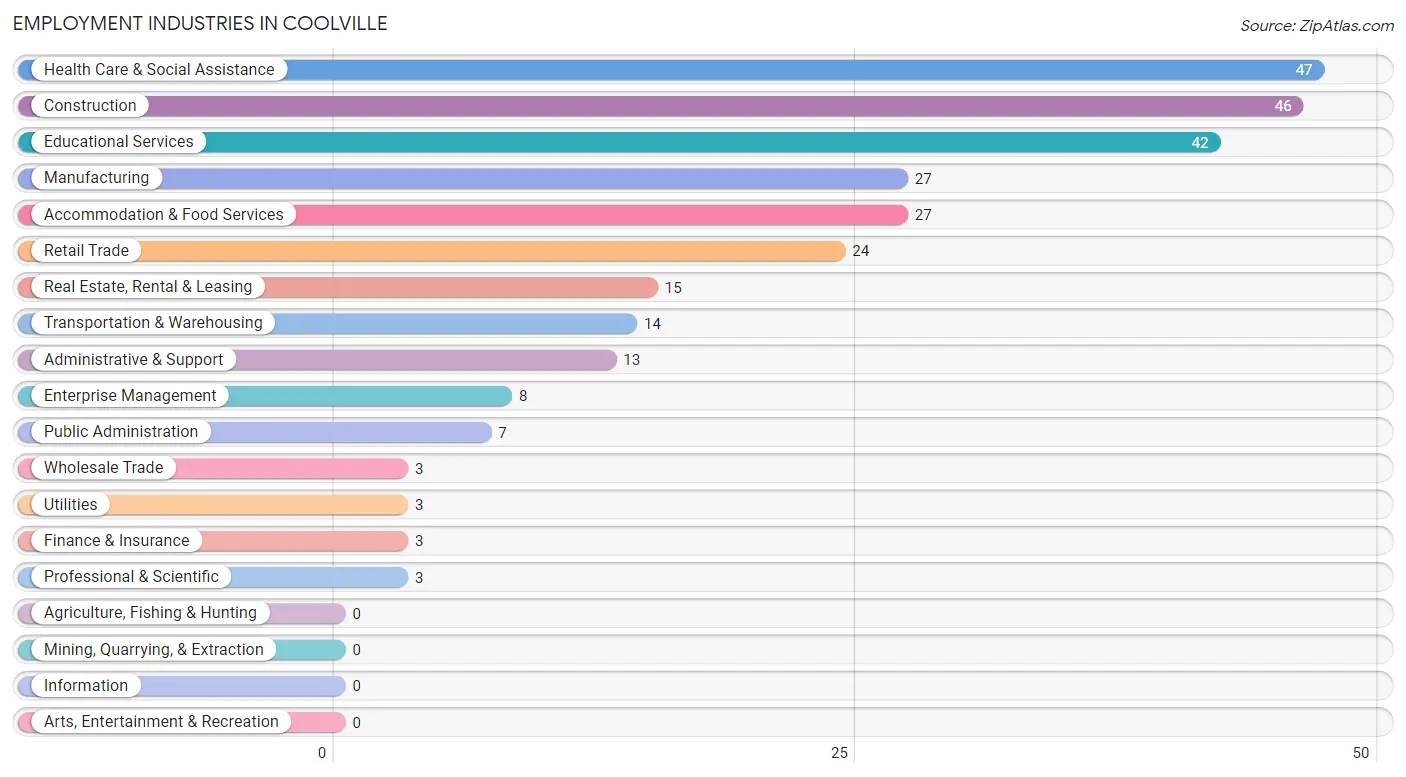
Employment Industries in Coolville
The major employment industries in Coolville include Health Care & Social Assistance (47 | 15.4%), Construction (46 | 15.0%), Educational Services (42 | 13.7%), Manufacturing (27 | 8.8%), and Accommodation & Food Services (27 | 8.8%).
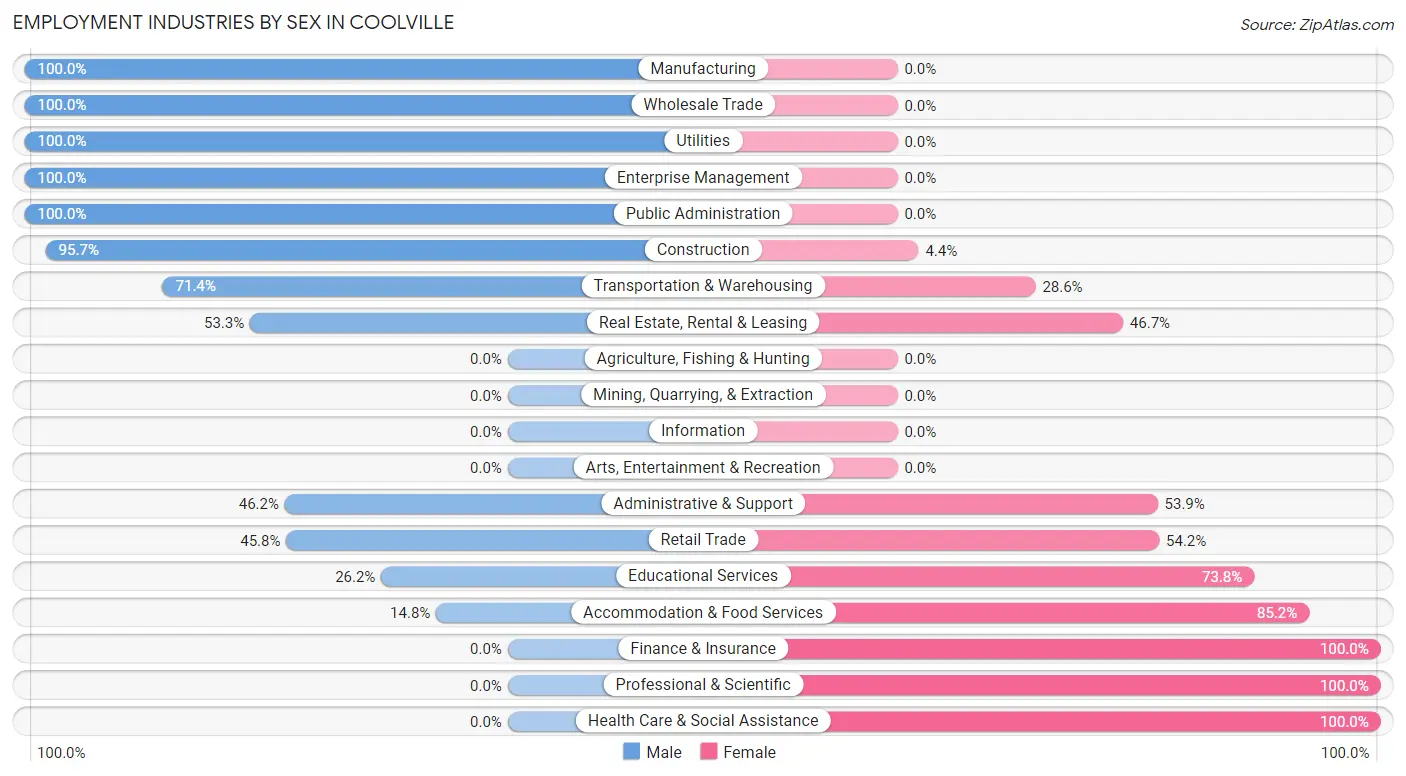
Employment Industries by Sex in Coolville
The Coolville industries that see more men than women are Manufacturing (100.0%), Wholesale Trade (100.0%), and Utilities (100.0%), whereas the industries that tend to have a higher number of women are Finance & Insurance (100.0%), Professional & Scientific (100.0%), and Health Care & Social Assistance (100.0%).
| Industry | Male | Female |
| Agriculture, Fishing & Hunting | 0 (0.0%) | 0 (0.0%) |
| Mining, Quarrying, & Extraction | 0 (0.0%) | 0 (0.0%) |
| Construction | 44 (95.7%) | 2 (4.3%) |
| Manufacturing | 27 (100.0%) | 0 (0.0%) |
| Wholesale Trade | 3 (100.0%) | 0 (0.0%) |
| Retail Trade | 11 (45.8%) | 13 (54.2%) |
| Transportation & Warehousing | 10 (71.4%) | 4 (28.6%) |
| Utilities | 3 (100.0%) | 0 (0.0%) |
| Information | 0 (0.0%) | 0 (0.0%) |
| Finance & Insurance | 0 (0.0%) | 3 (100.0%) |
| Real Estate, Rental & Leasing | 8 (53.3%) | 7 (46.7%) |
| Professional & Scientific | 0 (0.0%) | 3 (100.0%) |
| Enterprise Management | 8 (100.0%) | 0 (0.0%) |
| Administrative & Support | 6 (46.2%) | 7 (53.8%) |
| Educational Services | 11 (26.2%) | 31 (73.8%) |
| Health Care & Social Assistance | 0 (0.0%) | 47 (100.0%) |
| Arts, Entertainment & Recreation | 0 (0.0%) | 0 (0.0%) |
| Accommodation & Food Services | 4 (14.8%) | 23 (85.2%) |
| Public Administration | 7 (100.0%) | 0 (0.0%) |
| Total | 156 (51.0%) | 150 (49.0%) |
Education in Coolville
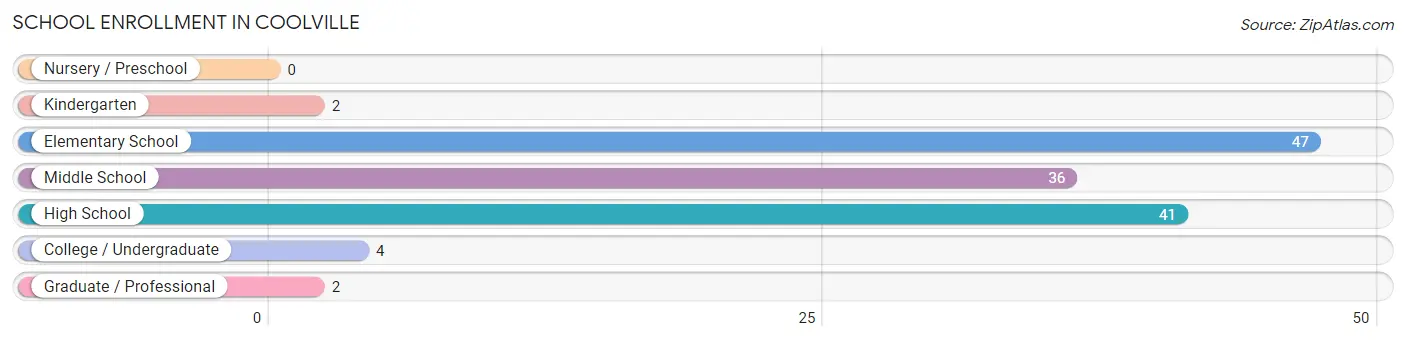
School Enrollment in Coolville
The most common levels of schooling among the 132 students in Coolville are elementary school (47 | 35.6%), high school (41 | 31.1%), and middle school (36 | 27.3%).
| School Level | # Students | % Students |
| Nursery / Preschool | 0 | 0.0% |
| Kindergarten | 2 | 1.5% |
| Elementary School | 47 | 35.6% |
| Middle School | 36 | 27.3% |
| High School | 41 | 31.1% |
| College / Undergraduate | 4 | 3.0% |
| Graduate / Professional | 2 | 1.5% |
| Total | 132 | 100.0% |
School Enrollment by Age by Funding Source in Coolville
Out of a total of 132 students who are enrolled in schools in Coolville, 18 (13.6%) attend a private institution, while the remaining 114 (86.4%) are enrolled in public schools. The age group of 35 years and over has the highest likelihood of being enrolled in private schools, with 2 (100.0% in the age bracket) enrolled. Conversely, the age group of 25 to 34 year olds has the lowest likelihood of being enrolled in a private school, with 2 (100.0% in the age bracket) attending a public institution.
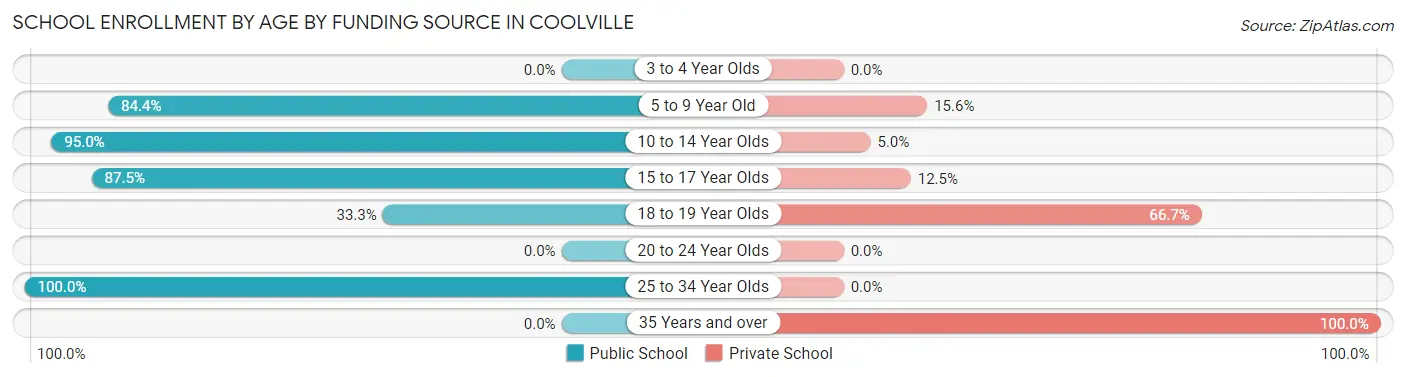
| Age Bracket | Public School | Private School |
| 3 to 4 Year Olds | 0 (0.0%) | 0 (0.0%) |
| 5 to 9 Year Old | 38 (84.4%) | 7 (15.6%) |
| 10 to 14 Year Olds | 38 (95.0%) | 2 (5.0%) |
| 15 to 17 Year Olds | 35 (87.5%) | 5 (12.5%) |
| 18 to 19 Year Olds | 1 (33.3%) | 2 (66.7%) |
| 20 to 24 Year Olds | 0 (0.0%) | 0 (0.0%) |
| 25 to 34 Year Olds | 2 (100.0%) | 0 (0.0%) |
| 35 Years and over | 0 (0.0%) | 2 (100.0%) |
| Total | 114 (86.4%) | 18 (13.6%) |
Educational Attainment by Field of Study in Coolville
Arts & humanities (16 | 22.5%), bio, nature & agricultural (15 | 21.1%), education (12 | 16.9%), business (11 | 15.5%), and visual & performing arts (4 | 5.6%) are the most common fields of study among 71 individuals in Coolville who have obtained a bachelor's degree or higher.
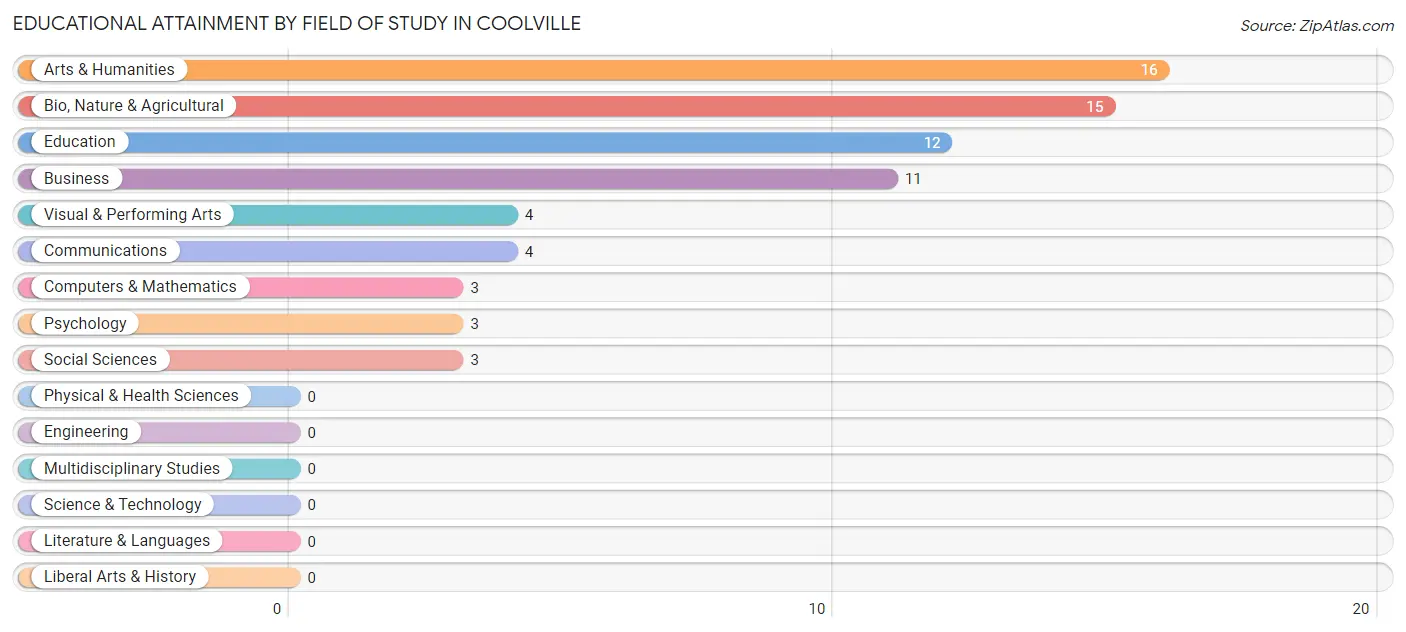
| Field of Study | # Graduates | % Graduates |
| Computers & Mathematics | 3 | 4.2% |
| Bio, Nature & Agricultural | 15 | 21.1% |
| Physical & Health Sciences | 0 | 0.0% |
| Psychology | 3 | 4.2% |
| Social Sciences | 3 | 4.2% |
| Engineering | 0 | 0.0% |
| Multidisciplinary Studies | 0 | 0.0% |
| Science & Technology | 0 | 0.0% |
| Business | 11 | 15.5% |
| Education | 12 | 16.9% |
| Literature & Languages | 0 | 0.0% |
| Liberal Arts & History | 0 | 0.0% |
| Visual & Performing Arts | 4 | 5.6% |
| Communications | 4 | 5.6% |
| Arts & Humanities | 16 | 22.5% |
| Total | 71 | 100.0% |
Transportation & Commute in Coolville
Vehicle Availability by Sex in Coolville
The most prevalent vehicle ownership categories in Coolville are males with 2 vehicles (58, accounting for 41.7%) and females with 2 vehicles (58, making up 40.0%).
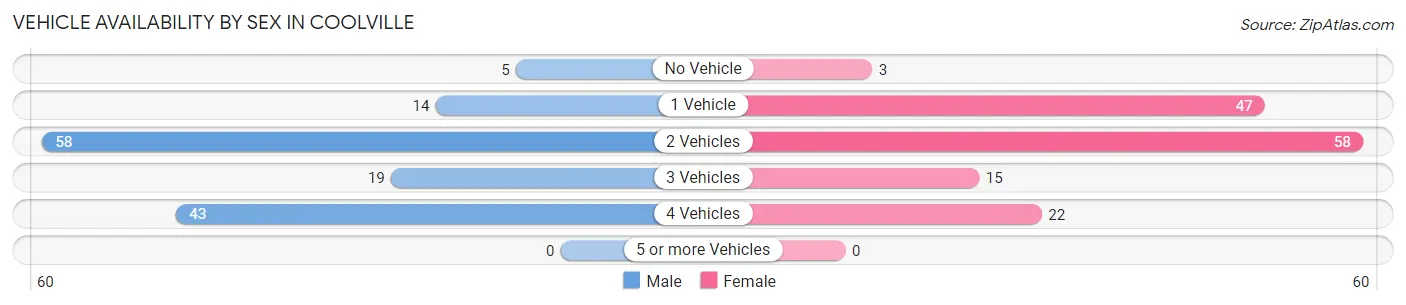
| Vehicles Available | Male | Female |
| No Vehicle | 5 (3.6%) | 3 (2.1%) |
| 1 Vehicle | 14 (10.1%) | 47 (32.4%) |
| 2 Vehicles | 58 (41.7%) | 58 (40.0%) |
| 3 Vehicles | 19 (13.7%) | 15 (10.3%) |
| 4 Vehicles | 43 (30.9%) | 22 (15.2%) |
| 5 or more Vehicles | 0 (0.0%) | 0 (0.0%) |
| Total | 139 (100.0%) | 145 (100.0%) |
Commute Time in Coolville
The most frequently occuring commute durations in Coolville are 20 to 24 minutes (64 commuters, 23.4%), 30 to 34 minutes (63 commuters, 23.0%), and 25 to 29 minutes (57 commuters, 20.8%).
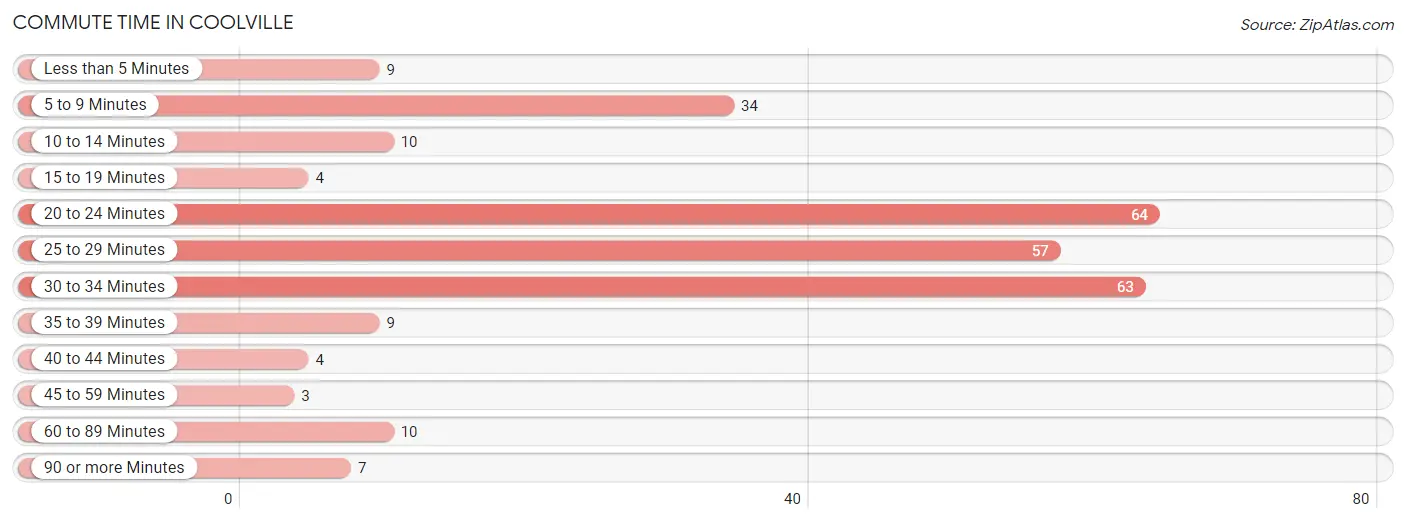
| Commute Time | # Commuters | % Commuters |
| Less than 5 Minutes | 9 | 3.3% |
| 5 to 9 Minutes | 34 | 12.4% |
| 10 to 14 Minutes | 10 | 3.6% |
| 15 to 19 Minutes | 4 | 1.5% |
| 20 to 24 Minutes | 64 | 23.4% |
| 25 to 29 Minutes | 57 | 20.8% |
| 30 to 34 Minutes | 63 | 23.0% |
| 35 to 39 Minutes | 9 | 3.3% |
| 40 to 44 Minutes | 4 | 1.5% |
| 45 to 59 Minutes | 3 | 1.1% |
| 60 to 89 Minutes | 10 | 3.6% |
| 90 or more Minutes | 7 | 2.5% |
Commute Time by Sex in Coolville
The most common commute times in Coolville are 30 to 34 minutes (38 commuters, 27.3%) for males and 25 to 29 minutes (33 commuters, 24.4%) for females.
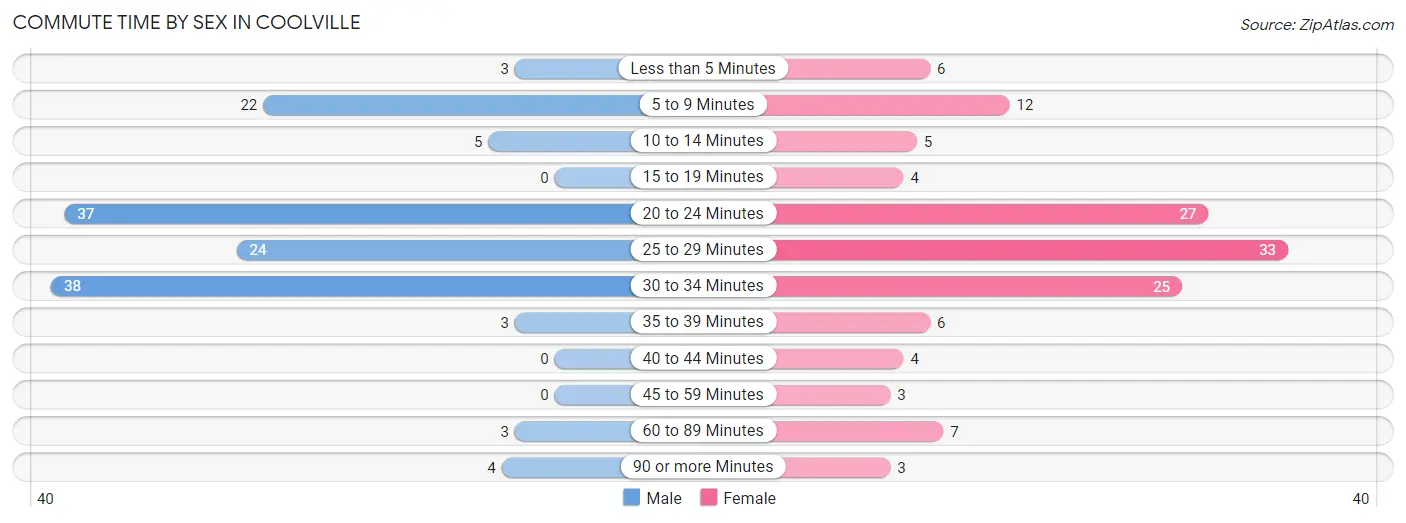
| Commute Time | Male | Female |
| Less than 5 Minutes | 3 (2.2%) | 6 (4.4%) |
| 5 to 9 Minutes | 22 (15.8%) | 12 (8.9%) |
| 10 to 14 Minutes | 5 (3.6%) | 5 (3.7%) |
| 15 to 19 Minutes | 0 (0.0%) | 4 (3.0%) |
| 20 to 24 Minutes | 37 (26.6%) | 27 (20.0%) |
| 25 to 29 Minutes | 24 (17.3%) | 33 (24.4%) |
| 30 to 34 Minutes | 38 (27.3%) | 25 (18.5%) |
| 35 to 39 Minutes | 3 (2.2%) | 6 (4.4%) |
| 40 to 44 Minutes | 0 (0.0%) | 4 (3.0%) |
| 45 to 59 Minutes | 0 (0.0%) | 3 (2.2%) |
| 60 to 89 Minutes | 3 (2.2%) | 7 (5.2%) |
| 90 or more Minutes | 4 (2.9%) | 3 (2.2%) |
Time of Departure to Work by Sex in Coolville
The most frequent times of departure to work in Coolville are 7:00 AM to 7:29 AM (29, 20.9%) for males and 9:00 AM to 9:59 AM (33, 24.4%) for females.
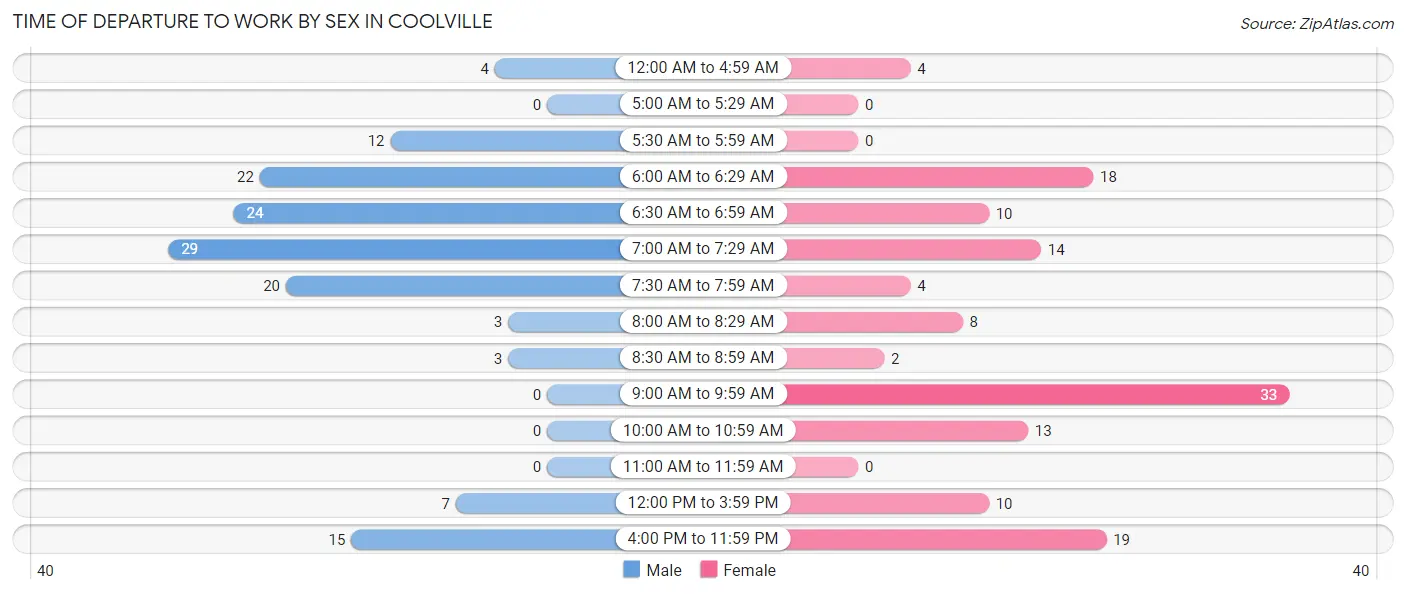
| Time of Departure | Male | Female |
| 12:00 AM to 4:59 AM | 4 (2.9%) | 4 (3.0%) |
| 5:00 AM to 5:29 AM | 0 (0.0%) | 0 (0.0%) |
| 5:30 AM to 5:59 AM | 12 (8.6%) | 0 (0.0%) |
| 6:00 AM to 6:29 AM | 22 (15.8%) | 18 (13.3%) |
| 6:30 AM to 6:59 AM | 24 (17.3%) | 10 (7.4%) |
| 7:00 AM to 7:29 AM | 29 (20.9%) | 14 (10.4%) |
| 7:30 AM to 7:59 AM | 20 (14.4%) | 4 (3.0%) |
| 8:00 AM to 8:29 AM | 3 (2.2%) | 8 (5.9%) |
| 8:30 AM to 8:59 AM | 3 (2.2%) | 2 (1.5%) |
| 9:00 AM to 9:59 AM | 0 (0.0%) | 33 (24.4%) |
| 10:00 AM to 10:59 AM | 0 (0.0%) | 13 (9.6%) |
| 11:00 AM to 11:59 AM | 0 (0.0%) | 0 (0.0%) |
| 12:00 PM to 3:59 PM | 7 (5.0%) | 10 (7.4%) |
| 4:00 PM to 11:59 PM | 15 (10.8%) | 19 (14.1%) |
| Total | 139 (100.0%) | 135 (100.0%) |
Housing Occupancy in Coolville
Occupancy by Ownership in Coolville
Of the total 260 dwellings in Coolville, owner-occupied units account for 204 (78.5%), while renter-occupied units make up 56 (21.5%).
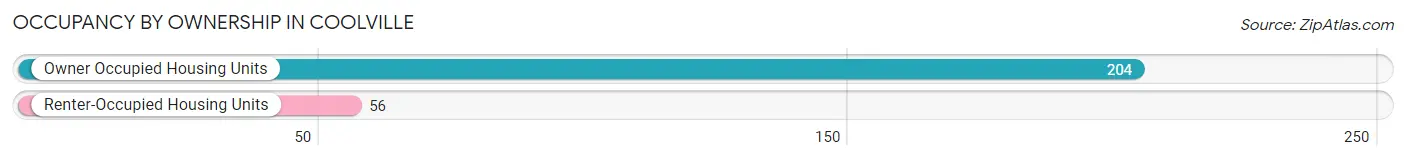
| Occupancy | # Housing Units | % Housing Units |
| Owner Occupied Housing Units | 204 | 78.5% |
| Renter-Occupied Housing Units | 56 | 21.5% |
| Total Occupied Housing Units | 260 | 100.0% |
Occupancy by Household Size in Coolville
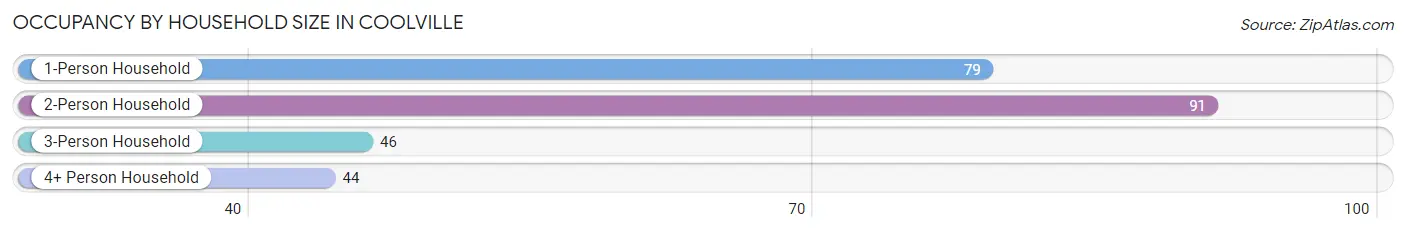
| Household Size | # Housing Units | % Housing Units |
| 1-Person Household | 79 | 30.4% |
| 2-Person Household | 91 | 35.0% |
| 3-Person Household | 46 | 17.7% |
| 4+ Person Household | 44 | 16.9% |
| Total Housing Units | 260 | 100.0% |
Occupancy by Ownership by Household Size in Coolville
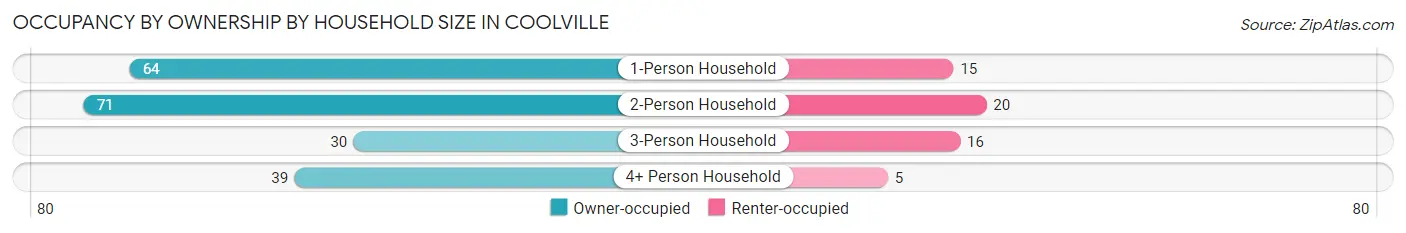
| Household Size | Owner-occupied | Renter-occupied |
| 1-Person Household | 64 (81.0%) | 15 (19.0%) |
| 2-Person Household | 71 (78.0%) | 20 (22.0%) |
| 3-Person Household | 30 (65.2%) | 16 (34.8%) |
| 4+ Person Household | 39 (88.6%) | 5 (11.4%) |
| Total Housing Units | 204 (78.5%) | 56 (21.5%) |
Occupancy by Educational Attainment in Coolville
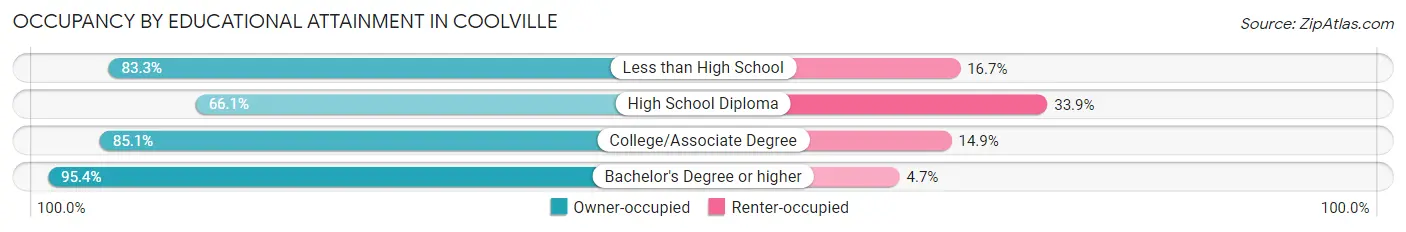
| Household Size | Owner-occupied | Renter-occupied |
| Less than High School | 15 (83.3%) | 3 (16.7%) |
| High School Diploma | 74 (66.1%) | 38 (33.9%) |
| College/Associate Degree | 74 (85.1%) | 13 (14.9%) |
| Bachelor's Degree or higher | 41 (95.4%) | 2 (4.6%) |
Occupancy by Age of Householder in Coolville
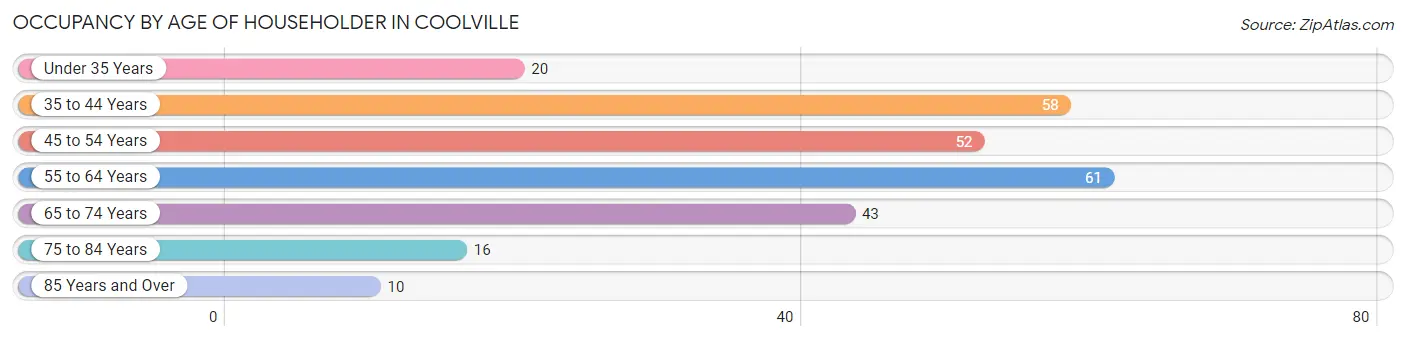
| Age Bracket | # Households | % Households |
| Under 35 Years | 20 | 7.7% |
| 35 to 44 Years | 58 | 22.3% |
| 45 to 54 Years | 52 | 20.0% |
| 55 to 64 Years | 61 | 23.5% |
| 65 to 74 Years | 43 | 16.5% |
| 75 to 84 Years | 16 | 6.1% |
| 85 Years and Over | 10 | 3.8% |
| Total | 260 | 100.0% |
Housing Finances in Coolville
Median Income by Occupancy in Coolville
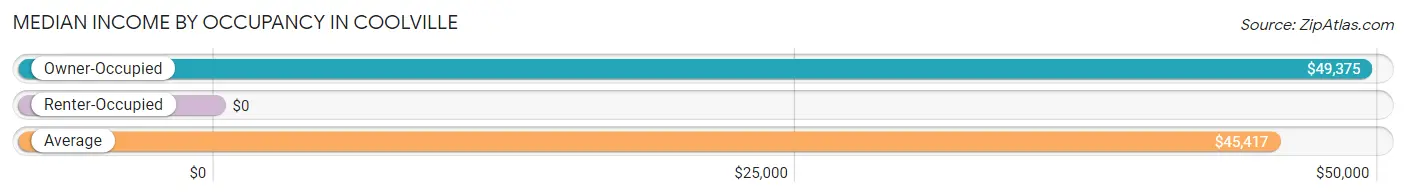
| Occupancy Type | # Households | Median Income |
| Owner-Occupied | 204 (78.5%) | $49,375 |
| Renter-Occupied | 56 (21.5%) | $0 |
| Average | 260 (100.0%) | $45,417 |
Occupancy by Householder Income Bracket in Coolville
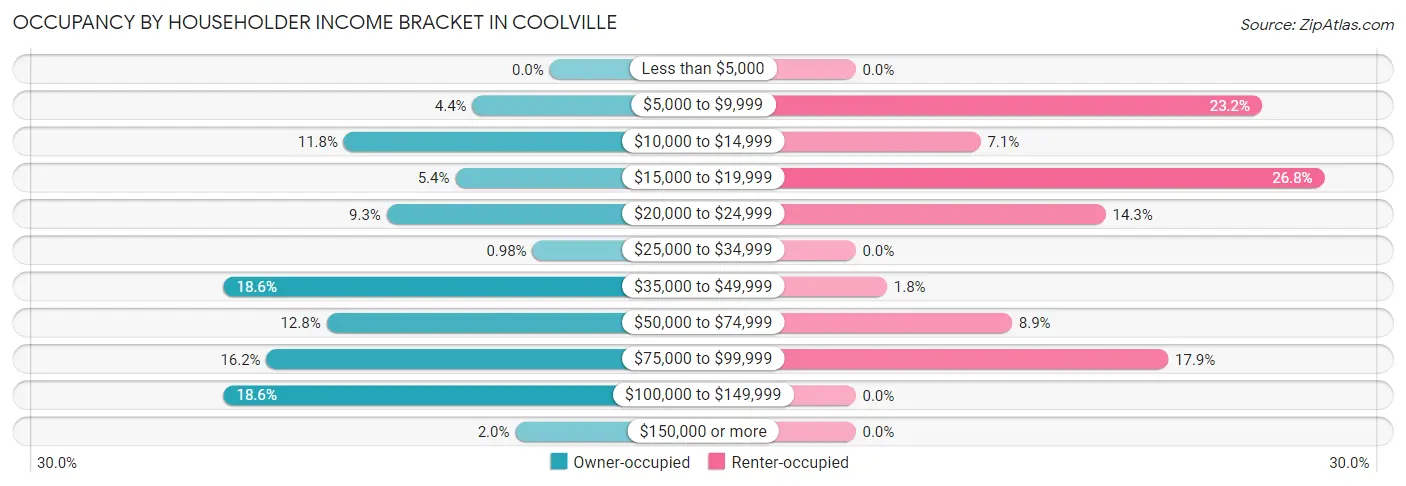
| Income Bracket | Owner-occupied | Renter-occupied |
| Less than $5,000 | 0 (0.0%) | 0 (0.0%) |
| $5,000 to $9,999 | 9 (4.4%) | 13 (23.2%) |
| $10,000 to $14,999 | 24 (11.8%) | 4 (7.1%) |
| $15,000 to $19,999 | 11 (5.4%) | 15 (26.8%) |
| $20,000 to $24,999 | 19 (9.3%) | 8 (14.3%) |
| $25,000 to $34,999 | 2 (1.0%) | 0 (0.0%) |
| $35,000 to $49,999 | 38 (18.6%) | 1 (1.8%) |
| $50,000 to $74,999 | 26 (12.8%) | 5 (8.9%) |
| $75,000 to $99,999 | 33 (16.2%) | 10 (17.9%) |
| $100,000 to $149,999 | 38 (18.6%) | 0 (0.0%) |
| $150,000 or more | 4 (2.0%) | 0 (0.0%) |
| Total | 204 (100.0%) | 56 (100.0%) |
Monthly Housing Cost Tiers in Coolville
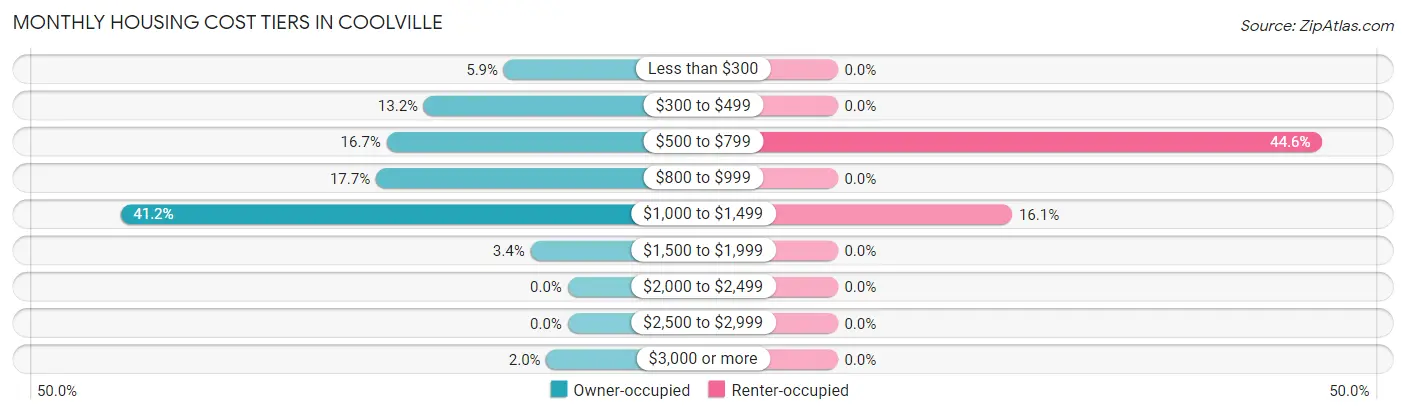
| Monthly Cost | Owner-occupied | Renter-occupied |
| Less than $300 | 12 (5.9%) | 0 (0.0%) |
| $300 to $499 | 27 (13.2%) | 0 (0.0%) |
| $500 to $799 | 34 (16.7%) | 25 (44.6%) |
| $800 to $999 | 36 (17.6%) | 0 (0.0%) |
| $1,000 to $1,499 | 84 (41.2%) | 9 (16.1%) |
| $1,500 to $1,999 | 7 (3.4%) | 0 (0.0%) |
| $2,000 to $2,499 | 0 (0.0%) | 0 (0.0%) |
| $2,500 to $2,999 | 0 (0.0%) | 0 (0.0%) |
| $3,000 or more | 4 (2.0%) | 0 (0.0%) |
| Total | 204 (100.0%) | 56 (100.0%) |
Physical Housing Characteristics in Coolville
Housing Structures in Coolville
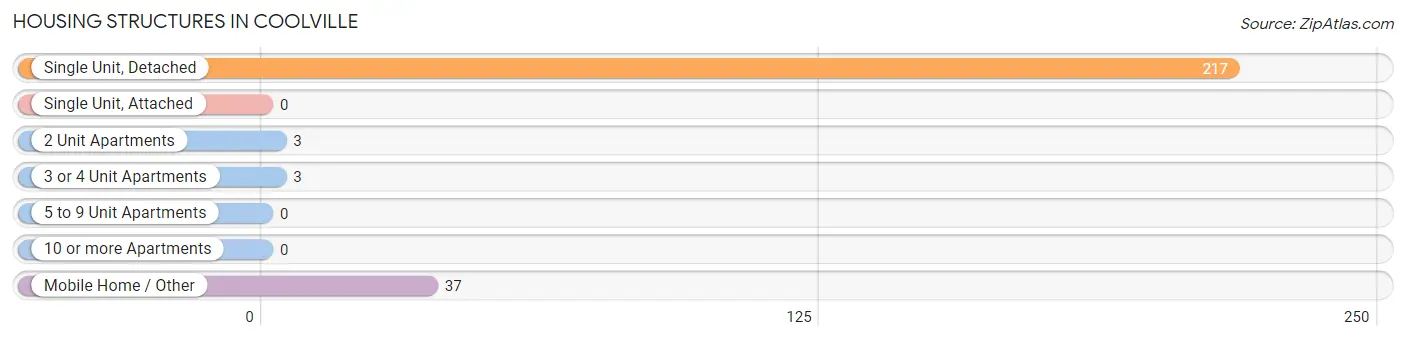
| Structure Type | # Housing Units | % Housing Units |
| Single Unit, Detached | 217 | 83.5% |
| Single Unit, Attached | 0 | 0.0% |
| 2 Unit Apartments | 3 | 1.1% |
| 3 or 4 Unit Apartments | 3 | 1.1% |
| 5 to 9 Unit Apartments | 0 | 0.0% |
| 10 or more Apartments | 0 | 0.0% |
| Mobile Home / Other | 37 | 14.2% |
| Total | 260 | 100.0% |
Housing Structures by Occupancy in Coolville
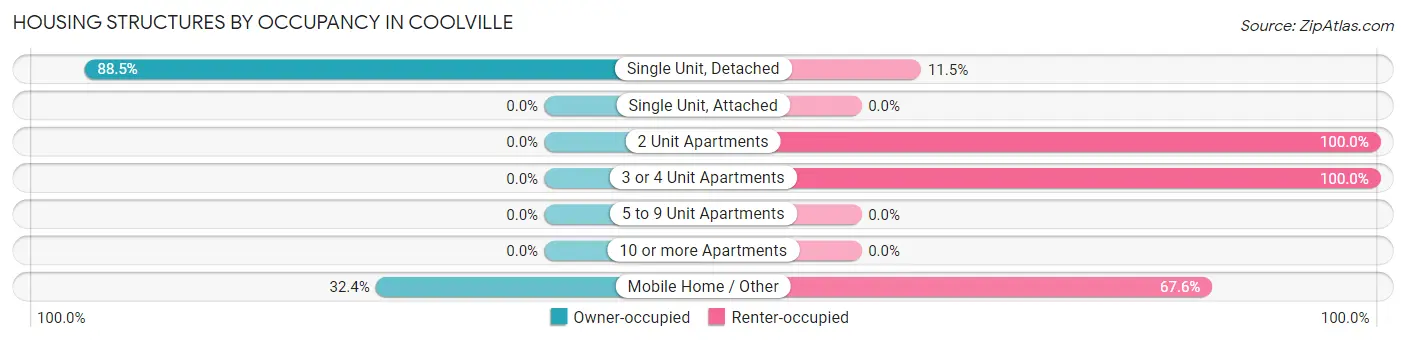
| Structure Type | Owner-occupied | Renter-occupied |
| Single Unit, Detached | 192 (88.5%) | 25 (11.5%) |
| Single Unit, Attached | 0 (0.0%) | 0 (0.0%) |
| 2 Unit Apartments | 0 (0.0%) | 3 (100.0%) |
| 3 or 4 Unit Apartments | 0 (0.0%) | 3 (100.0%) |
| 5 to 9 Unit Apartments | 0 (0.0%) | 0 (0.0%) |
| 10 or more Apartments | 0 (0.0%) | 0 (0.0%) |
| Mobile Home / Other | 12 (32.4%) | 25 (67.6%) |
| Total | 204 (78.5%) | 56 (21.5%) |
Housing Structures by Number of Rooms in Coolville
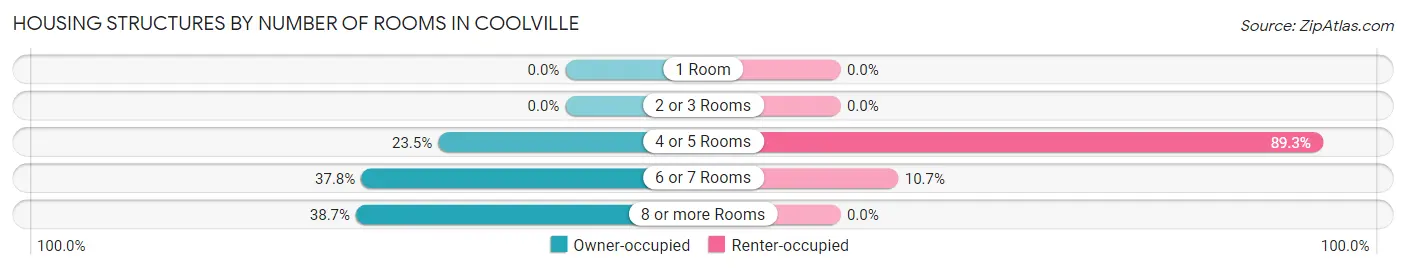
| Number of Rooms | Owner-occupied | Renter-occupied |
| 1 Room | 0 (0.0%) | 0 (0.0%) |
| 2 or 3 Rooms | 0 (0.0%) | 0 (0.0%) |
| 4 or 5 Rooms | 48 (23.5%) | 50 (89.3%) |
| 6 or 7 Rooms | 77 (37.8%) | 6 (10.7%) |
| 8 or more Rooms | 79 (38.7%) | 0 (0.0%) |
| Total | 204 (100.0%) | 56 (100.0%) |
Housing Structure by Heating Type in Coolville
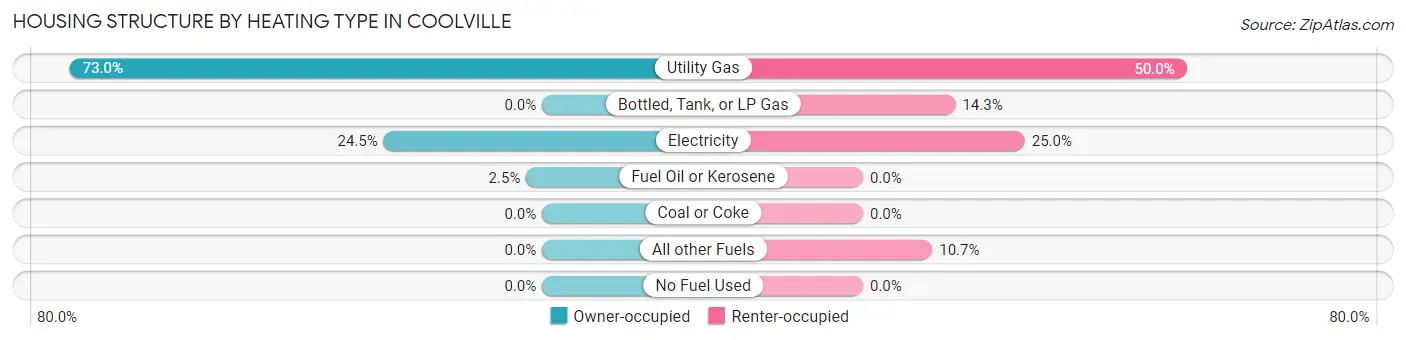
| Heating Type | Owner-occupied | Renter-occupied |
| Utility Gas | 149 (73.0%) | 28 (50.0%) |
| Bottled, Tank, or LP Gas | 0 (0.0%) | 8 (14.3%) |
| Electricity | 50 (24.5%) | 14 (25.0%) |
| Fuel Oil or Kerosene | 5 (2.5%) | 0 (0.0%) |
| Coal or Coke | 0 (0.0%) | 0 (0.0%) |
| All other Fuels | 0 (0.0%) | 6 (10.7%) |
| No Fuel Used | 0 (0.0%) | 0 (0.0%) |
| Total | 204 (100.0%) | 56 (100.0%) |
Household Vehicle Usage in Coolville
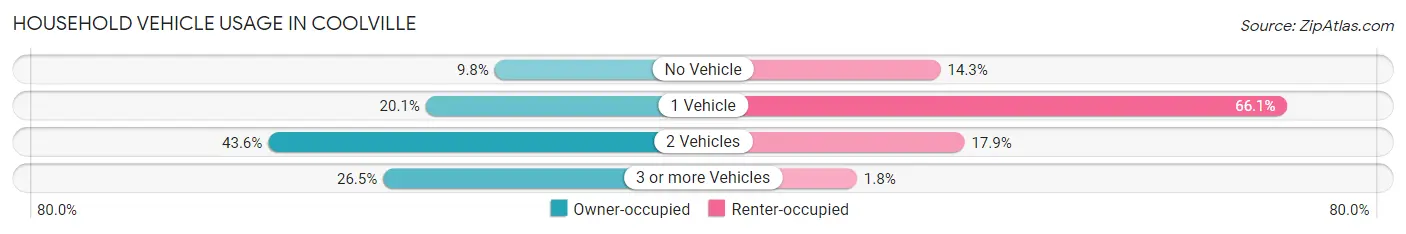
| Vehicles per Household | Owner-occupied | Renter-occupied |
| No Vehicle | 20 (9.8%) | 8 (14.3%) |
| 1 Vehicle | 41 (20.1%) | 37 (66.1%) |
| 2 Vehicles | 89 (43.6%) | 10 (17.9%) |
| 3 or more Vehicles | 54 (26.5%) | 1 (1.8%) |
| Total | 204 (100.0%) | 56 (100.0%) |
Real Estate & Mortgages in Coolville
Real Estate and Mortgage Overview in Coolville
| Characteristic | Without Mortgage | With Mortgage |
| Housing Units | 82 | 122 |
| Median Property Value | $95,000 | $114,000 |
| Median Household Income | $45,500 | $4 |
| Monthly Housing Costs | $525 | $4 |
| Real Estate Taxes | $1,013 | $3 |
Property Value by Mortgage Status in Coolville
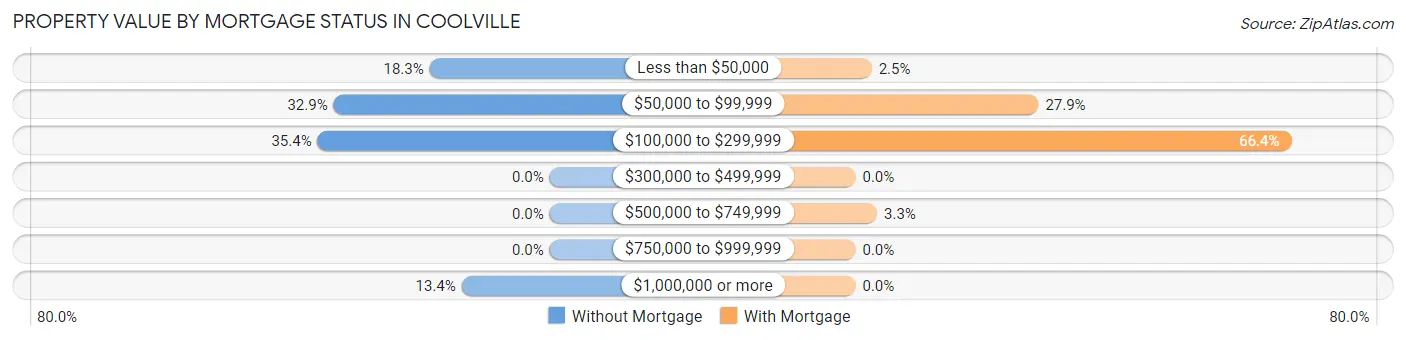
| Property Value | Without Mortgage | With Mortgage |
| Less than $50,000 | 15 (18.3%) | 3 (2.5%) |
| $50,000 to $99,999 | 27 (32.9%) | 34 (27.9%) |
| $100,000 to $299,999 | 29 (35.4%) | 81 (66.4%) |
| $300,000 to $499,999 | 0 (0.0%) | 0 (0.0%) |
| $500,000 to $749,999 | 0 (0.0%) | 4 (3.3%) |
| $750,000 to $999,999 | 0 (0.0%) | 0 (0.0%) |
| $1,000,000 or more | 11 (13.4%) | 0 (0.0%) |
| Total | 82 (100.0%) | 122 (100.0%) |
Household Income by Mortgage Status in Coolville
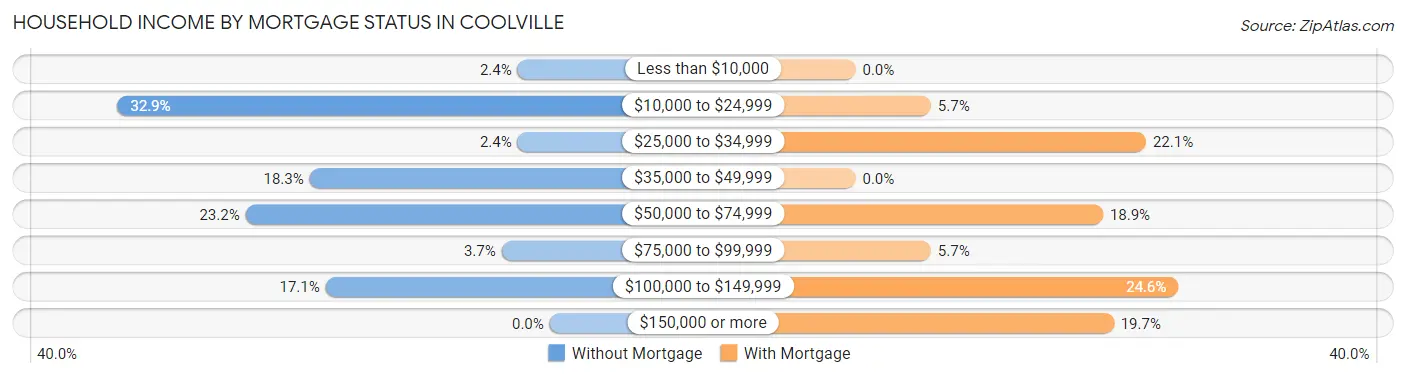
| Household Income | Without Mortgage | With Mortgage |
| Less than $10,000 | 2 (2.4%) | 0 (0.0%) |
| $10,000 to $24,999 | 27 (32.9%) | 7 (5.7%) |
| $25,000 to $34,999 | 2 (2.4%) | 27 (22.1%) |
| $35,000 to $49,999 | 15 (18.3%) | 0 (0.0%) |
| $50,000 to $74,999 | 19 (23.2%) | 23 (18.9%) |
| $75,000 to $99,999 | 3 (3.7%) | 7 (5.7%) |
| $100,000 to $149,999 | 14 (17.1%) | 30 (24.6%) |
| $150,000 or more | 0 (0.0%) | 24 (19.7%) |
| Total | 82 (100.0%) | 122 (100.0%) |
Property Value to Household Income Ratio in Coolville
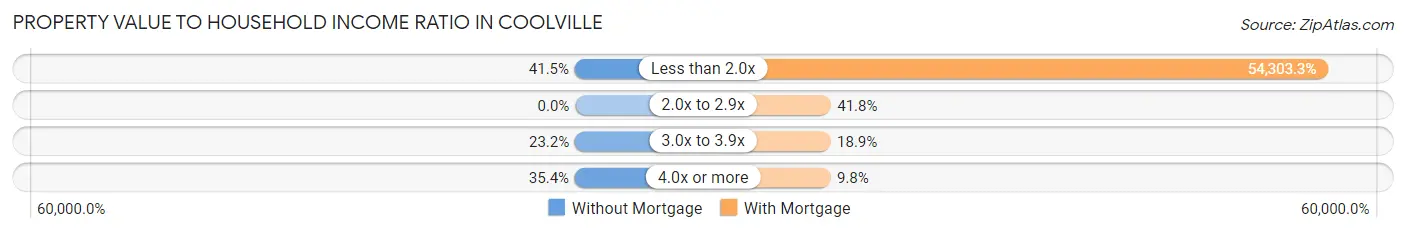
| Value-to-Income Ratio | Without Mortgage | With Mortgage |
| Less than 2.0x | 34 (41.5%) | 66,250 (54,303.3%) |
| 2.0x to 2.9x | 0 (0.0%) | 51 (41.8%) |
| 3.0x to 3.9x | 19 (23.2%) | 23 (18.9%) |
| 4.0x or more | 29 (35.4%) | 12 (9.8%) |
| Total | 82 (100.0%) | 122 (100.0%) |
Real Estate Taxes by Mortgage Status in Coolville
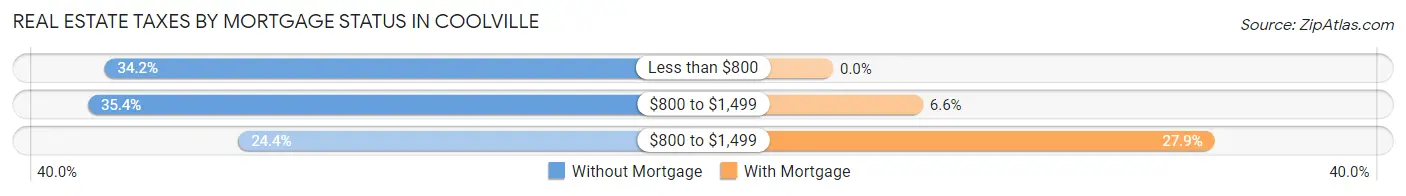
| Property Taxes | Without Mortgage | With Mortgage |
| Less than $800 | 28 (34.2%) | 0 (0.0%) |
| $800 to $1,499 | 29 (35.4%) | 8 (6.6%) |
| $800 to $1,499 | 20 (24.4%) | 34 (27.9%) |
| Total | 82 (100.0%) | 122 (100.0%) |
Health & Disability in Coolville
Health Insurance Coverage by Age in Coolville
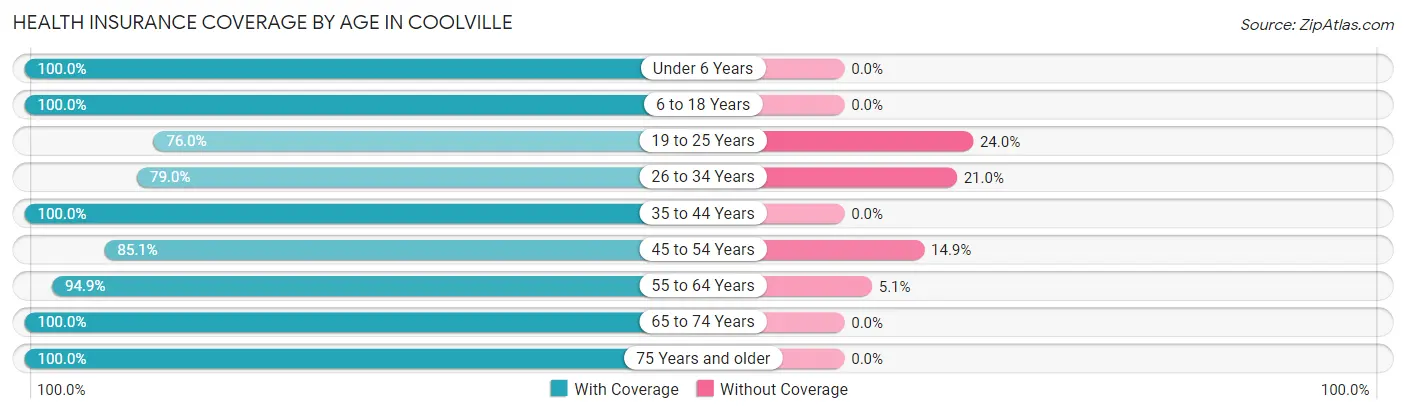
| Age Bracket | With Coverage | Without Coverage |
| Under 6 Years | 14 (100.0%) | 0 (0.0%) |
| 6 to 18 Years | 125 (100.0%) | 0 (0.0%) |
| 19 to 25 Years | 19 (76.0%) | 6 (24.0%) |
| 26 to 34 Years | 49 (79.0%) | 13 (21.0%) |
| 35 to 44 Years | 77 (100.0%) | 0 (0.0%) |
| 45 to 54 Years | 103 (85.1%) | 18 (14.9%) |
| 55 to 64 Years | 74 (94.9%) | 4 (5.1%) |
| 65 to 74 Years | 68 (100.0%) | 0 (0.0%) |
| 75 Years and older | 45 (100.0%) | 0 (0.0%) |
| Total | 574 (93.3%) | 41 (6.7%) |
Health Insurance Coverage by Citizenship Status in Coolville
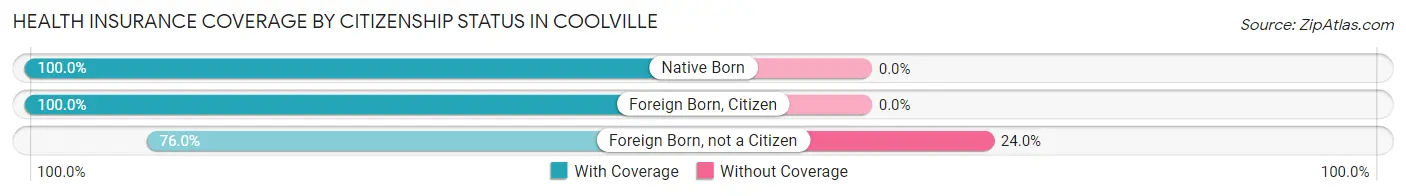
| Citizenship Status | With Coverage | Without Coverage |
| Native Born | 14 (100.0%) | 0 (0.0%) |
| Foreign Born, Citizen | 125 (100.0%) | 0 (0.0%) |
| Foreign Born, not a Citizen | 19 (76.0%) | 6 (24.0%) |
Health Insurance Coverage by Household Income in Coolville
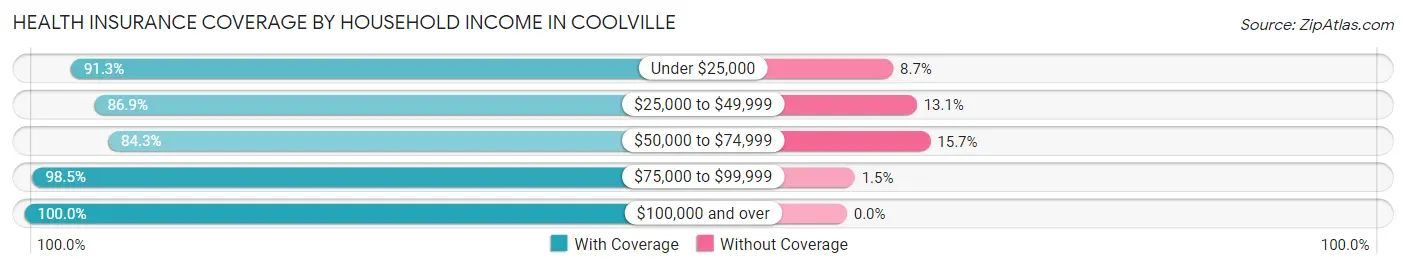
| Household Income | With Coverage | Without Coverage |
| Under $25,000 | 158 (91.3%) | 15 (8.7%) |
| $25,000 to $49,999 | 73 (86.9%) | 11 (13.1%) |
| $50,000 to $74,999 | 70 (84.3%) | 13 (15.7%) |
| $75,000 to $99,999 | 133 (98.5%) | 2 (1.5%) |
| $100,000 and over | 140 (100.0%) | 0 (0.0%) |
Public vs Private Health Insurance Coverage by Age in Coolville
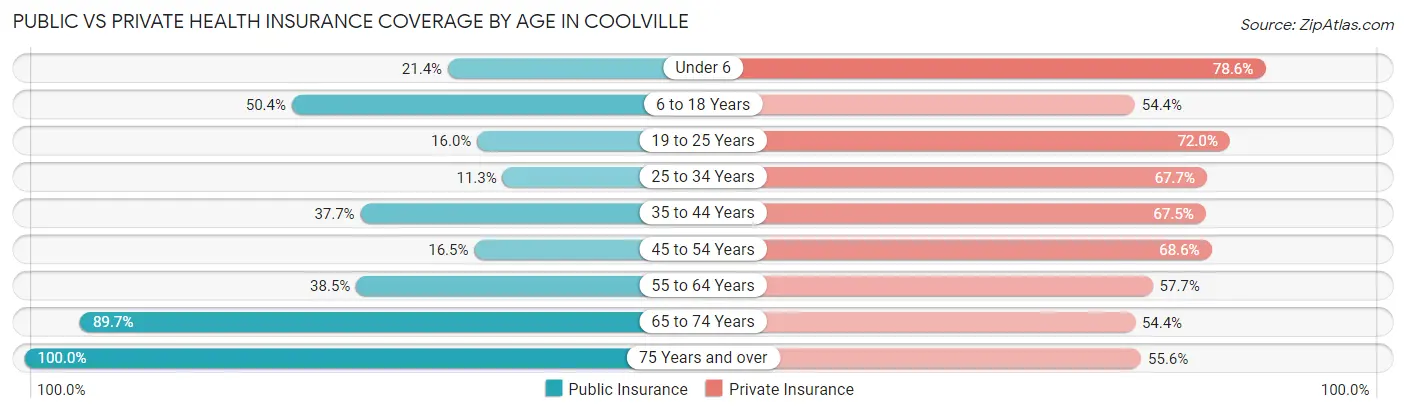
| Age Bracket | Public Insurance | Private Insurance |
| Under 6 | 3 (21.4%) | 11 (78.6%) |
| 6 to 18 Years | 63 (50.4%) | 68 (54.4%) |
| 19 to 25 Years | 4 (16.0%) | 18 (72.0%) |
| 25 to 34 Years | 7 (11.3%) | 42 (67.7%) |
| 35 to 44 Years | 29 (37.7%) | 52 (67.5%) |
| 45 to 54 Years | 20 (16.5%) | 83 (68.6%) |
| 55 to 64 Years | 30 (38.5%) | 45 (57.7%) |
| 65 to 74 Years | 61 (89.7%) | 37 (54.4%) |
| 75 Years and over | 45 (100.0%) | 25 (55.6%) |
| Total | 262 (42.6%) | 381 (62.0%) |
Disability Status by Sex by Age in Coolville
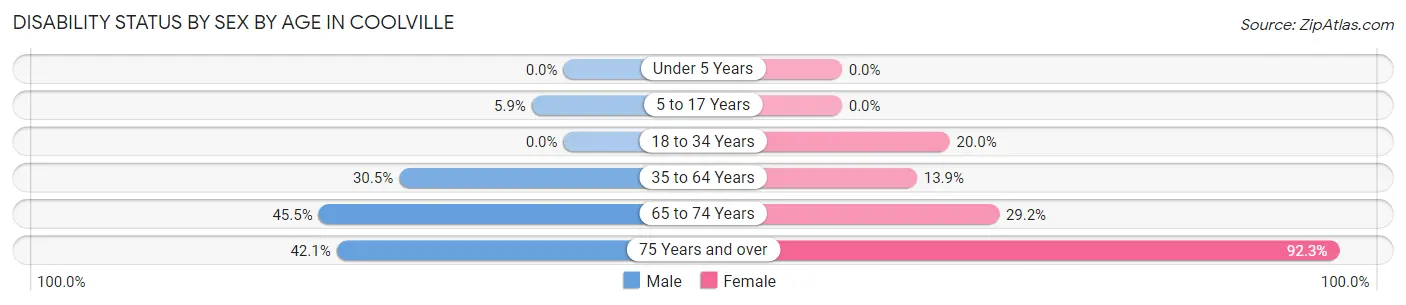
| Age Bracket | Male | Female |
| Under 5 Years | 0 (0.0%) | 0 (0.0%) |
| 5 to 17 Years | 4 (5.9%) | 0 (0.0%) |
| 18 to 34 Years | 0 (0.0%) | 3 (20.0%) |
| 35 to 64 Years | 36 (30.5%) | 22 (13.9%) |
| 65 to 74 Years | 20 (45.5%) | 7 (29.2%) |
| 75 Years and over | 8 (42.1%) | 24 (92.3%) |
Disability Class by Sex by Age in Coolville
Disability Class: Hearing Difficulty
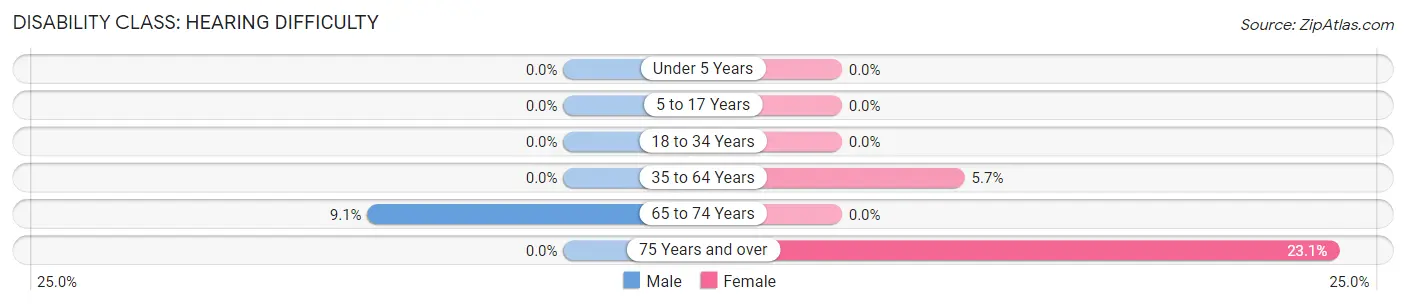
| Age Bracket | Male | Female |
| Under 5 Years | 0 (0.0%) | 0 (0.0%) |
| 5 to 17 Years | 0 (0.0%) | 0 (0.0%) |
| 18 to 34 Years | 0 (0.0%) | 0 (0.0%) |
| 35 to 64 Years | 0 (0.0%) | 9 (5.7%) |
| 65 to 74 Years | 4 (9.1%) | 0 (0.0%) |
| 75 Years and over | 0 (0.0%) | 6 (23.1%) |
Disability Class: Vision Difficulty
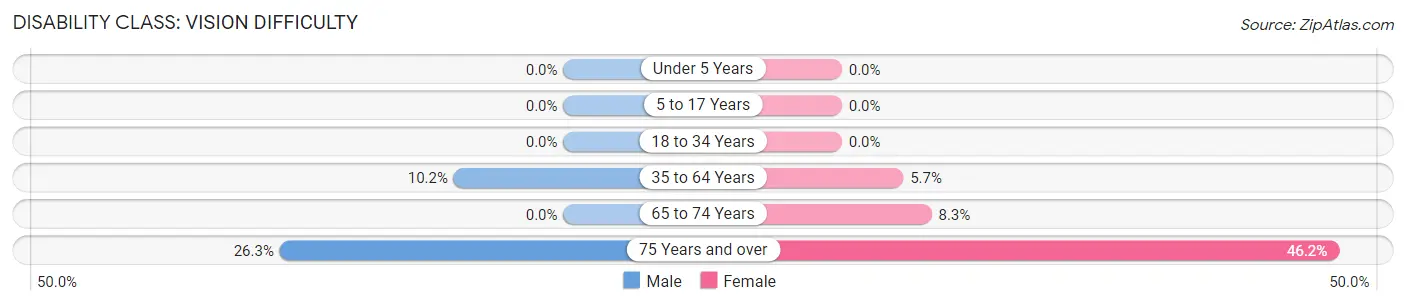
| Age Bracket | Male | Female |
| Under 5 Years | 0 (0.0%) | 0 (0.0%) |
| 5 to 17 Years | 0 (0.0%) | 0 (0.0%) |
| 18 to 34 Years | 0 (0.0%) | 0 (0.0%) |
| 35 to 64 Years | 12 (10.2%) | 9 (5.7%) |
| 65 to 74 Years | 0 (0.0%) | 2 (8.3%) |
| 75 Years and over | 5 (26.3%) | 12 (46.2%) |
Disability Class: Cognitive Difficulty
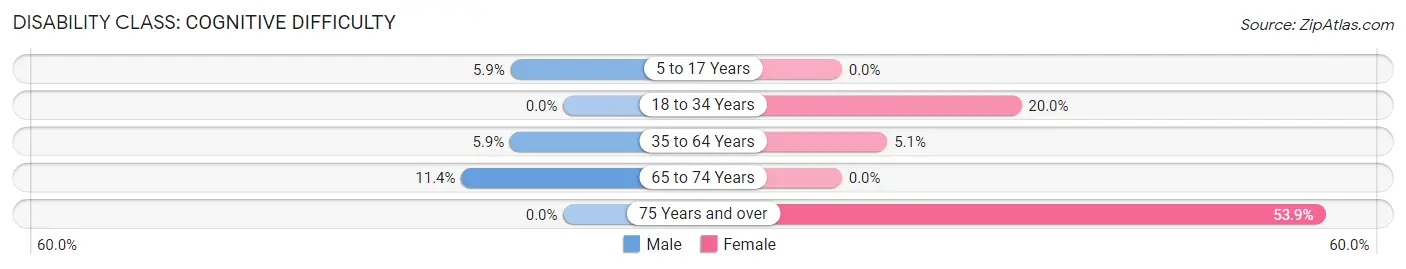
| Age Bracket | Male | Female |
| 5 to 17 Years | 4 (5.9%) | 0 (0.0%) |
| 18 to 34 Years | 0 (0.0%) | 3 (20.0%) |
| 35 to 64 Years | 7 (5.9%) | 8 (5.1%) |
| 65 to 74 Years | 5 (11.4%) | 0 (0.0%) |
| 75 Years and over | 0 (0.0%) | 14 (53.8%) |
Disability Class: Ambulatory Difficulty
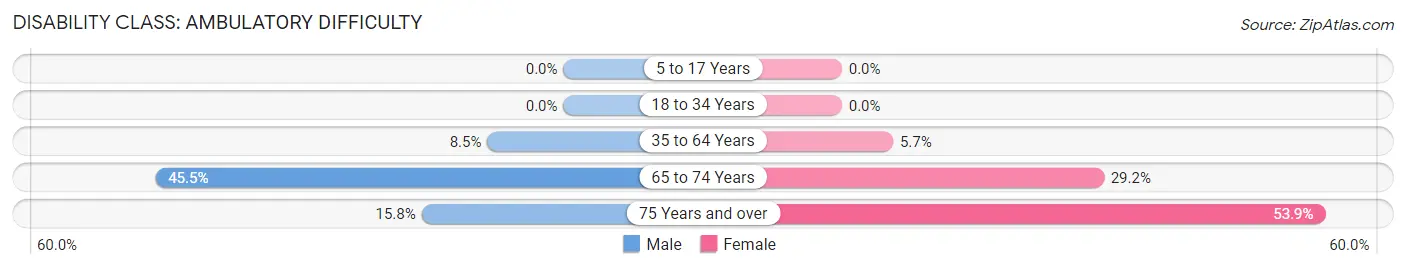
| Age Bracket | Male | Female |
| 5 to 17 Years | 0 (0.0%) | 0 (0.0%) |
| 18 to 34 Years | 0 (0.0%) | 0 (0.0%) |
| 35 to 64 Years | 10 (8.5%) | 9 (5.7%) |
| 65 to 74 Years | 20 (45.5%) | 7 (29.2%) |
| 75 Years and over | 3 (15.8%) | 14 (53.8%) |
Disability Class: Self-Care Difficulty
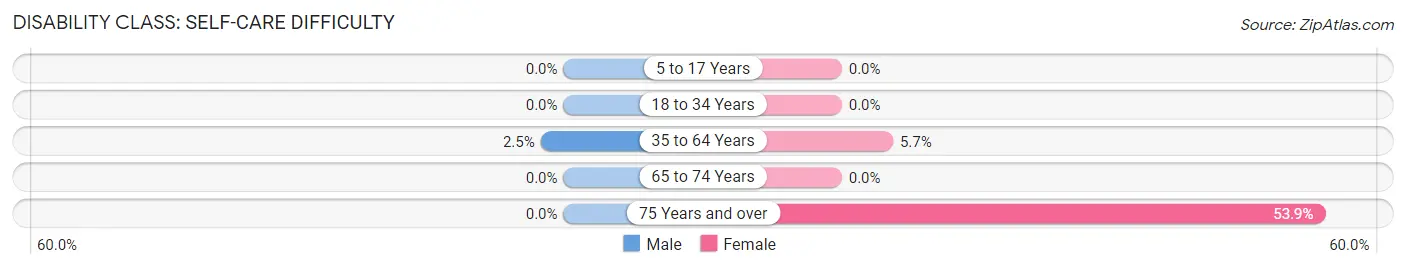
| Age Bracket | Male | Female |
| 5 to 17 Years | 0 (0.0%) | 0 (0.0%) |
| 18 to 34 Years | 0 (0.0%) | 0 (0.0%) |
| 35 to 64 Years | 3 (2.5%) | 9 (5.7%) |
| 65 to 74 Years | 0 (0.0%) | 0 (0.0%) |
| 75 Years and over | 0 (0.0%) | 14 (53.8%) |
Technology Access in Coolville
Computing Device Access in Coolville
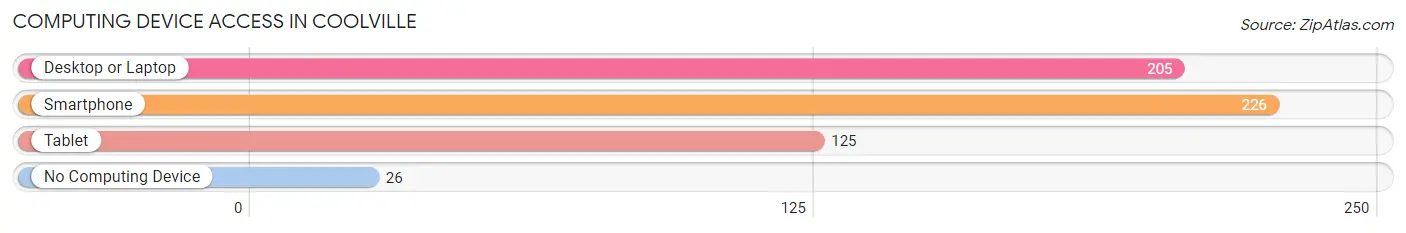
| Device Type | # Households | % Households |
| Desktop or Laptop | 205 | 78.8% |
| Smartphone | 226 | 86.9% |
| Tablet | 125 | 48.1% |
| No Computing Device | 26 | 10.0% |
| Total | 260 | 100.0% |
Internet Access in Coolville
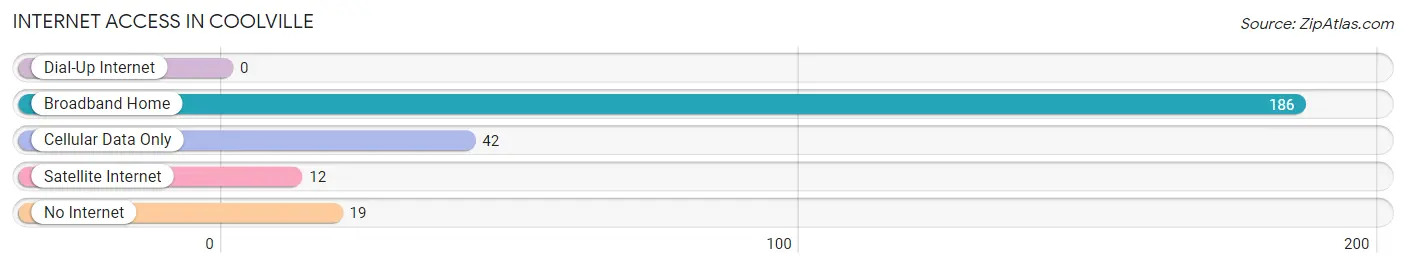
| Internet Type | # Households | % Households |
| Dial-Up Internet | 0 | 0.0% |
| Broadband Home | 186 | 71.5% |
| Cellular Data Only | 42 | 16.2% |
| Satellite Internet | 12 | 4.6% |
| No Internet | 19 | 7.3% |
| Total | 260 | 100.0% |
Coolville Summary
History
The small village of Coolville, Ohio is located in Athens County, in the southeastern part of the state. It was founded in 1817 by a group of settlers from Pennsylvania, who were looking for a place to settle and start a new life. The village was named after a local creek, which was named after a Native American chief named Cool. The village was originally a farming community, and the settlers grew corn, wheat, and other crops.
In the early 1900s, the village began to grow and develop. The first school was built in 1902, and the first post office was established in 1904. The village also had a general store, a blacksmith shop, and a few other businesses.
In the 1950s, the village began to experience a population boom. This was due to the construction of a nearby power plant, which provided jobs for many of the residents. The village also began to attract more businesses, including a grocery store, a hardware store, and a few restaurants.
Geography
Coolville is located in the Appalachian Plateau region of Ohio. It is situated in the southeastern part of the state, near the Ohio River. The village is surrounded by rolling hills and forests, and is located about 25 miles from the city of Athens.
The village has a total area of 1.2 square miles, all of which is land. The terrain is mostly flat, with some hills and valleys. The climate is humid continental, with hot summers and cold winters.
Economy
The economy of Coolville is largely based on agriculture and tourism. The village is home to several farms, which produce corn, wheat, soybeans, and other crops. The village also has a few small businesses, including a grocery store, a hardware store, and a few restaurants.
Tourism is also an important part of the local economy. The village is home to several parks and recreational areas, including the Coolville State Park. The park offers camping, fishing, and other outdoor activities. The village also hosts several festivals and events throughout the year, including the Coolville Corn Festival and the Coolville Music Festival.
Demographics
As of the 2010 census, the population of Coolville was 1,845. The racial makeup of the village was 97.3% White, 0.7% African American, 0.2% Native American, 0.3% Asian, and 1.5% from other races. The median household income was $37,917, and the median family income was $45,938.
The village has a high rate of educational attainment, with 95.3% of the population having at least a high school diploma. The village also has a low unemployment rate, with only 4.2% of the population being unemployed.
Conclusion
Coolville, Ohio is a small village located in the Appalachian Plateau region of the state. It was founded in 1817 by a group of settlers from Pennsylvania, and has since grown into a thriving community. The village has a strong agricultural economy, and is also a popular tourist destination. The population of the village is largely white, and the median household income is above the state average. The village also has a high rate of educational attainment and a low unemployment rate.
Common Questions
What is Per Capita Income in Coolville?
Per Capita income in Coolville is $23,561.
What is the Median Family Income in Coolville?
Median Family Income in Coolville is $62,188.
What is the Median Household income in Coolville?
Median Household Income in Coolville is $45,417.
What is Income or Wage Gap in Coolville?
Income or Wage Gap in Coolville is 0.6%.
Women in Coolville earn 99.4 cents for every dollar earned by a man.
What is Inequality or Gini Index in Coolville?
Inequality or Gini Index in Coolville is 0.41.
What is the Total Population of Coolville?
Total Population of Coolville is 615.
What is the Total Male Population of Coolville?
Total Male Population of Coolville is 329.
What is the Total Female Population of Coolville?
Total Female Population of Coolville is 286.
What is the Ratio of Males per 100 Females in Coolville?
There are 115.03 Males per 100 Females in Coolville.
What is the Ratio of Females per 100 Males in Coolville?
There are 86.93 Females per 100 Males in Coolville.
What is the Median Population Age in Coolville?
Median Population Age in Coolville is 45.2 Years.
What is the Average Family Size in Coolville
Average Family Size in Coolville is 3.0 People.
What is the Average Household Size in Coolville
Average Household Size in Coolville is 2.4 People.
How Large is the Labor Force in Coolville?
There are 330 People in the Labor Forcein in Coolville.
What is the Percentage of People in the Labor Force in Coolville?
66.8% of People are in the Labor Force in Coolville.
What is the Unemployment Rate in Coolville?
Unemployment Rate in Coolville is 7.3%.