Clyde, OH Map & Demographics
Clyde Map
Clyde Overview
$29,921
PER CAPITA INCOME
$72,188
AVG FAMILY INCOME
$55,956
AVG HOUSEHOLD INCOME
46.0%
WAGE / INCOME GAP [ % ]
54.0¢/ $1
WAGE / INCOME GAP [ $ ]
0.36
INEQUALITY / GINI INDEX
6,314
TOTAL POPULATION
3,384
MALE POPULATION
2,930
FEMALE POPULATION
115.49
MALES / 100 FEMALES
86.58
FEMALES / 100 MALES
49.0
MEDIAN AGE
2.6
AVG FAMILY SIZE
2.3
AVG HOUSEHOLD SIZE
3,345
LABOR FORCE [ PEOPLE ]
62.6%
PERCENT IN LABOR FORCE
7.1%
UNEMPLOYMENT RATE
Clyde Zip Codes
Income in Clyde
Income Overview in Clyde
Per Capita Income in Clyde is $29,921, while median incomes of families and households are $72,188 and $55,956 respectively.
| Characteristic | Number | Measure |
| Per Capita Income | 6,314 | $29,921 |
| Median Family Income | 1,695 | $72,188 |
| Mean Family Income | 1,695 | $77,175 |
| Median Household Income | 2,678 | $55,956 |
| Mean Household Income | 2,678 | $67,466 |
| Income Deficit | 1,695 | $0 |
| Wage / Income Gap (%) | 6,314 | 45.98% |
| Wage / Income Gap ($) | 6,314 | 54.02¢ per $1 |
| Gini / Inequality Index | 6,314 | 0.36 |
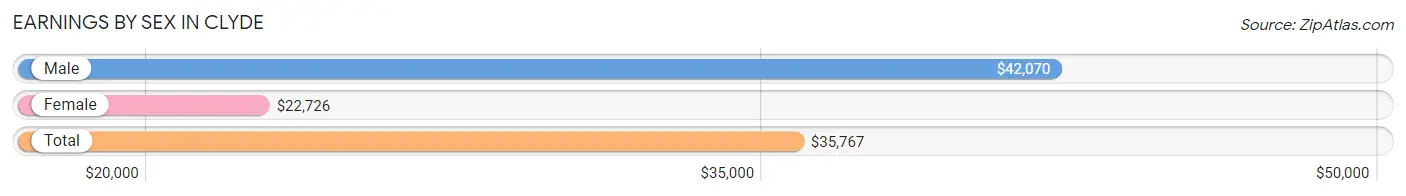
Earnings by Sex in Clyde
Average Earnings in Clyde are $35,767, $42,070 for men and $22,726 for women, a difference of 46.0%.
| Sex | Number | Average Earnings |
| Male | 2,075 (59.6%) | $42,070 |
| Female | 1,407 (40.4%) | $22,726 |
| Total | 3,482 (100.0%) | $35,767 |
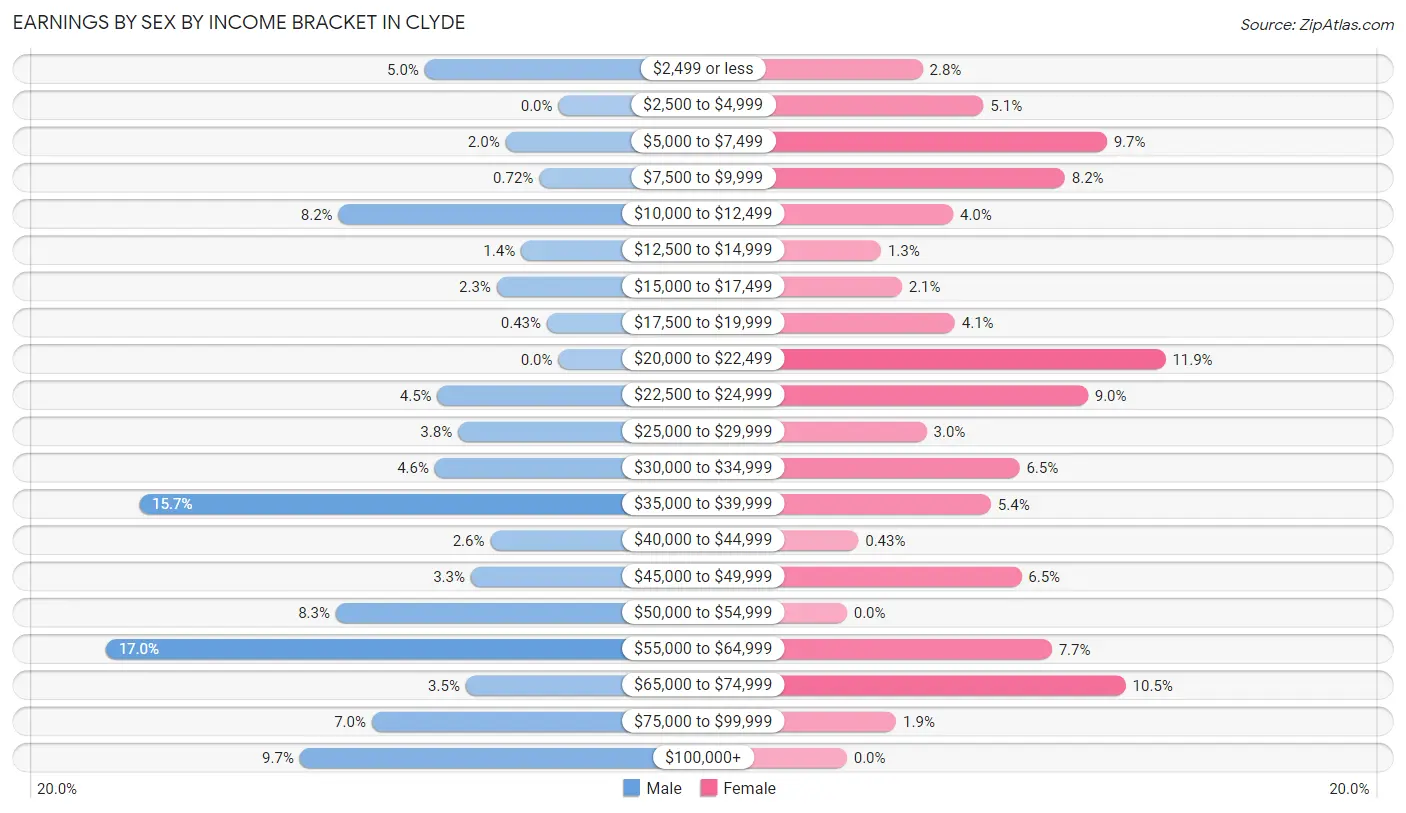
Earnings by Sex by Income Bracket in Clyde
The most common earnings brackets in Clyde are $55,000 to $64,999 for men (352 | 17.0%) and $20,000 to $22,499 for women (168 | 11.9%).
| Income | Male | Female |
| $2,499 or less | 104 (5.0%) | 40 (2.8%) |
| $2,500 to $4,999 | 0 (0.0%) | 72 (5.1%) |
| $5,000 to $7,499 | 41 (2.0%) | 137 (9.7%) |
| $7,500 to $9,999 | 15 (0.7%) | 115 (8.2%) |
| $10,000 to $12,499 | 171 (8.2%) | 56 (4.0%) |
| $12,500 to $14,999 | 29 (1.4%) | 18 (1.3%) |
| $15,000 to $17,499 | 48 (2.3%) | 29 (2.1%) |
| $17,500 to $19,999 | 9 (0.4%) | 57 (4.1%) |
| $20,000 to $22,499 | 0 (0.0%) | 168 (11.9%) |
| $22,500 to $24,999 | 94 (4.5%) | 127 (9.0%) |
| $25,000 to $29,999 | 78 (3.8%) | 42 (3.0%) |
| $30,000 to $34,999 | 96 (4.6%) | 91 (6.5%) |
| $35,000 to $39,999 | 326 (15.7%) | 76 (5.4%) |
| $40,000 to $44,999 | 53 (2.5%) | 6 (0.4%) |
| $45,000 to $49,999 | 68 (3.3%) | 92 (6.5%) |
| $50,000 to $54,999 | 173 (8.3%) | 0 (0.0%) |
| $55,000 to $64,999 | 352 (17.0%) | 108 (7.7%) |
| $65,000 to $74,999 | 72 (3.5%) | 147 (10.4%) |
| $75,000 to $99,999 | 145 (7.0%) | 26 (1.8%) |
| $100,000+ | 201 (9.7%) | 0 (0.0%) |
| Total | 2,075 (100.0%) | 1,407 (100.0%) |
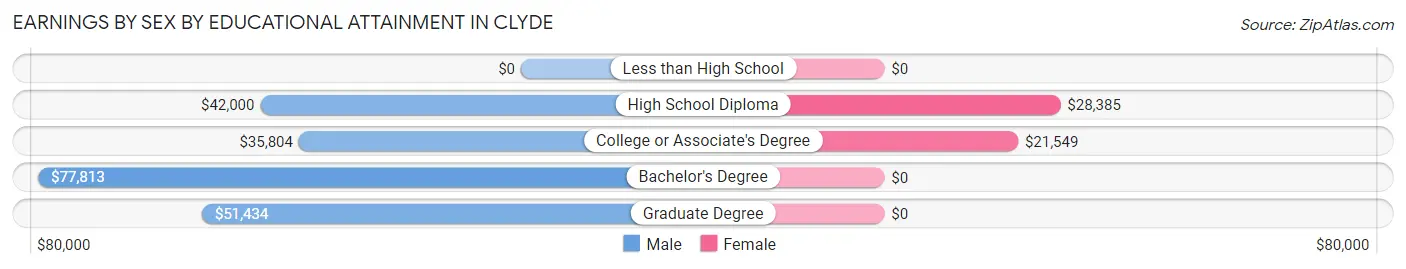
Earnings by Sex by Educational Attainment in Clyde
Average earnings in Clyde are $48,994 for men and $23,100 for women, a difference of 52.8%. Men with an educational attainment of bachelor's degree enjoy the highest average annual earnings of $77,813, while those with college or associate's degree education earn the least with $35,804. Women with an educational attainment of high school diploma earn the most with the average annual earnings of $28,385, while those with college or associate's degree education have the smallest earnings of $21,549.
| Educational Attainment | Male Income | Female Income |
| Less than High School | - | - |
| High School Diploma | $42,000 | $28,385 |
| College or Associate's Degree | $35,804 | $21,549 |
| Bachelor's Degree | $77,813 | $0 |
| Graduate Degree | $51,434 | $0 |
| Total | $48,994 | $23,100 |
Family Income in Clyde
Family Income Brackets in Clyde
According to the Clyde family income data, there are 375 families falling into the $35,000 to $49,999 income range, which is the most common income bracket and makes up 22.1% of all families.
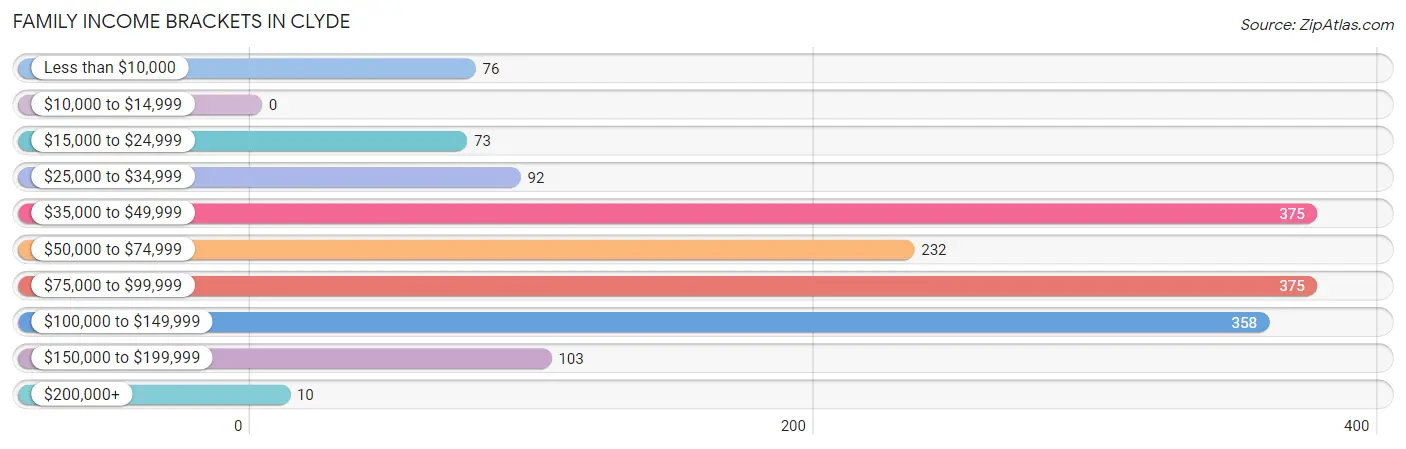
| Income Bracket | # Families | % Families |
| Less than $10,000 | 76 | 4.5% |
| $10,000 to $14,999 | 0 | 0.0% |
| $15,000 to $24,999 | 73 | 4.3% |
| $25,000 to $34,999 | 92 | 5.4% |
| $35,000 to $49,999 | 375 | 22.1% |
| $50,000 to $74,999 | 232 | 13.7% |
| $75,000 to $99,999 | 375 | 22.1% |
| $100,000 to $149,999 | 358 | 21.1% |
| $150,000 to $199,999 | 103 | 6.1% |
| $200,000+ | 10 | 0.6% |
Family Income by Famaliy Size in Clyde
3-person families (364 | 21.5%) account for the highest median family income in Clyde with $99,394 per family, while 3-person families (364 | 21.5%) have the highest median income of $33,131 per family member.
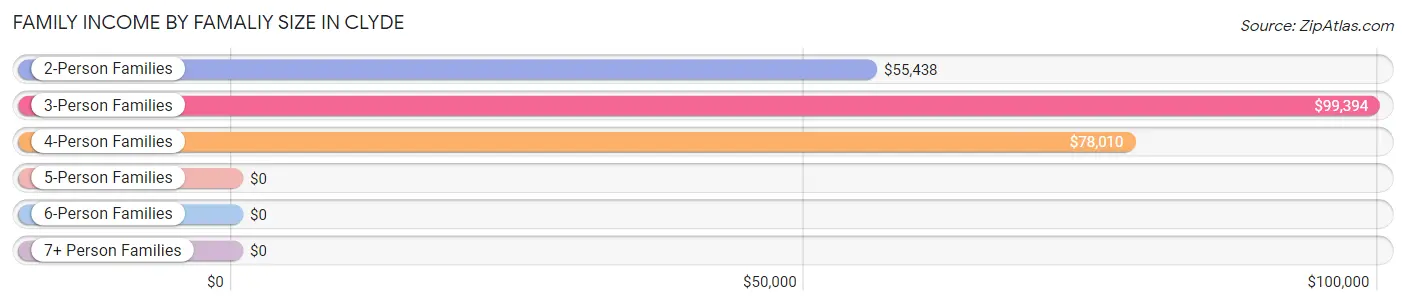
| Income Bracket | # Families | Median Income |
| 2-Person Families | 1,027 (60.6%) | $55,438 |
| 3-Person Families | 364 (21.5%) | $99,394 |
| 4-Person Families | 280 (16.5%) | $78,010 |
| 5-Person Families | 24 (1.4%) | $0 |
| 6-Person Families | 0 (0.0%) | $0 |
| 7+ Person Families | 0 (0.0%) | $0 |
| Total | 1,695 (100.0%) | $72,188 |
Family Income by Number of Earners in Clyde
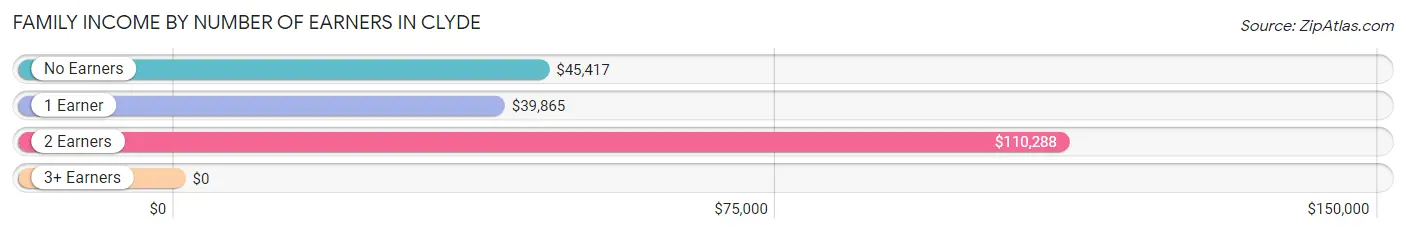
| Number of Earners | # Families | Median Income |
| No Earners | 274 (16.2%) | $45,417 |
| 1 Earner | 750 (44.3%) | $39,865 |
| 2 Earners | 607 (35.8%) | $110,288 |
| 3+ Earners | 64 (3.8%) | $0 |
| Total | 1,695 (100.0%) | $72,188 |
Household Income in Clyde
Household Income Brackets in Clyde
With 608 households falling in the category, the $35,000 to $49,999 income range is the most frequent in Clyde, accounting for 22.7% of all households. In contrast, only 11 households (0.4%) fall into the $200,000+ income bracket, making it the least populous group.
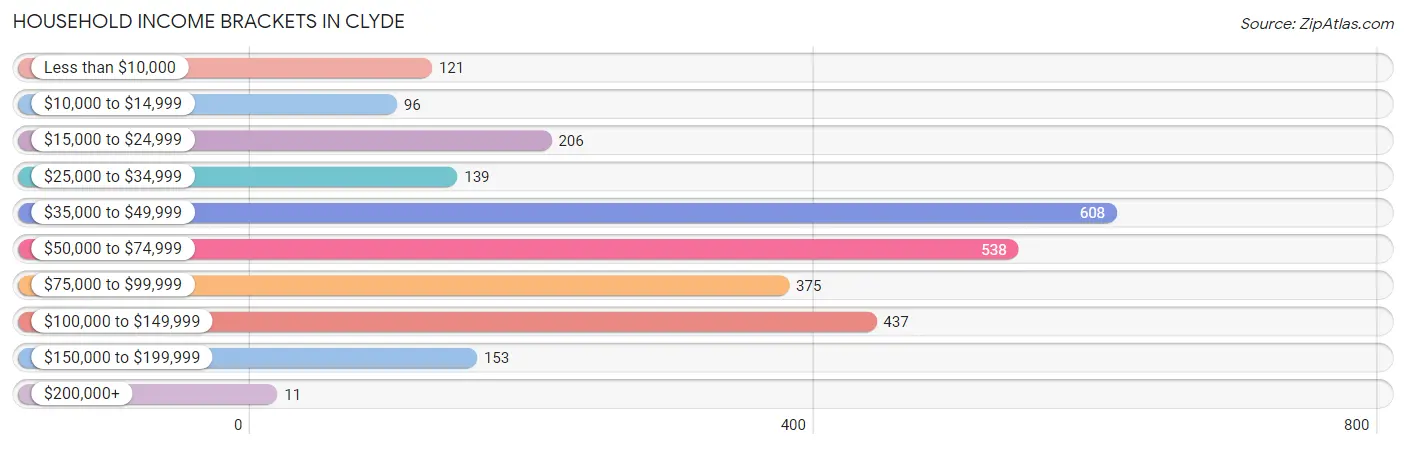
| Income Bracket | # Households | % Households |
| Less than $10,000 | 121 | 4.5% |
| $10,000 to $14,999 | 96 | 3.6% |
| $15,000 to $24,999 | 206 | 7.7% |
| $25,000 to $34,999 | 139 | 5.2% |
| $35,000 to $49,999 | 608 | 22.7% |
| $50,000 to $74,999 | 538 | 20.1% |
| $75,000 to $99,999 | 375 | 14.0% |
| $100,000 to $149,999 | 437 | 16.3% |
| $150,000 to $199,999 | 153 | 5.7% |
| $200,000+ | 11 | 0.4% |
Household Income by Householder Age in Clyde
The median household income in Clyde is $55,956, with the highest median household income of $62,303 found in the 25 to 44 years age bracket for the primary householder. A total of 784 households (29.3%) fall into this category. Meanwhile, the 15 to 24 years age bracket for the primary householder has the lowest median household income of $0, with 34 households (1.3%) in this group.
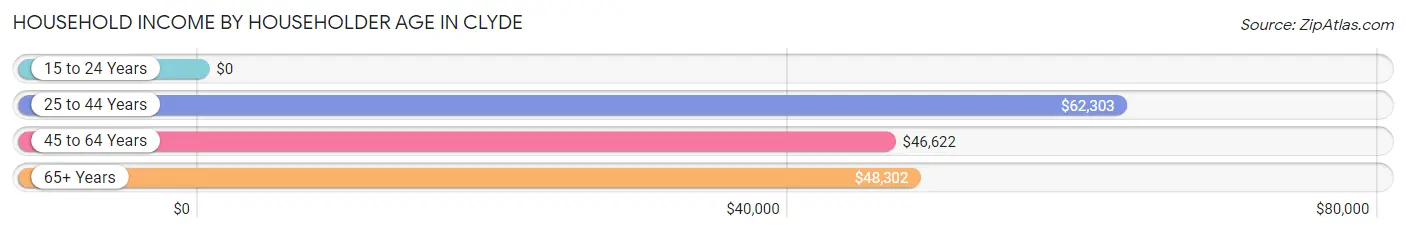
| Income Bracket | # Households | Median Income |
| 15 to 24 Years | 34 (1.3%) | $0 |
| 25 to 44 Years | 784 (29.3%) | $62,303 |
| 45 to 64 Years | 1,233 (46.0%) | $46,622 |
| 65+ Years | 627 (23.4%) | $48,302 |
| Total | 2,678 (100.0%) | $55,956 |
Poverty in Clyde
Income Below Poverty by Sex and Age in Clyde
With 7.8% poverty level for males and 13.7% for females among the residents of Clyde, 15 year old males and 12 to 14 year old females are the most vulnerable to poverty, with 56 males (44.1%) and 54 females (37.8%) in their respective age groups living below the poverty level.
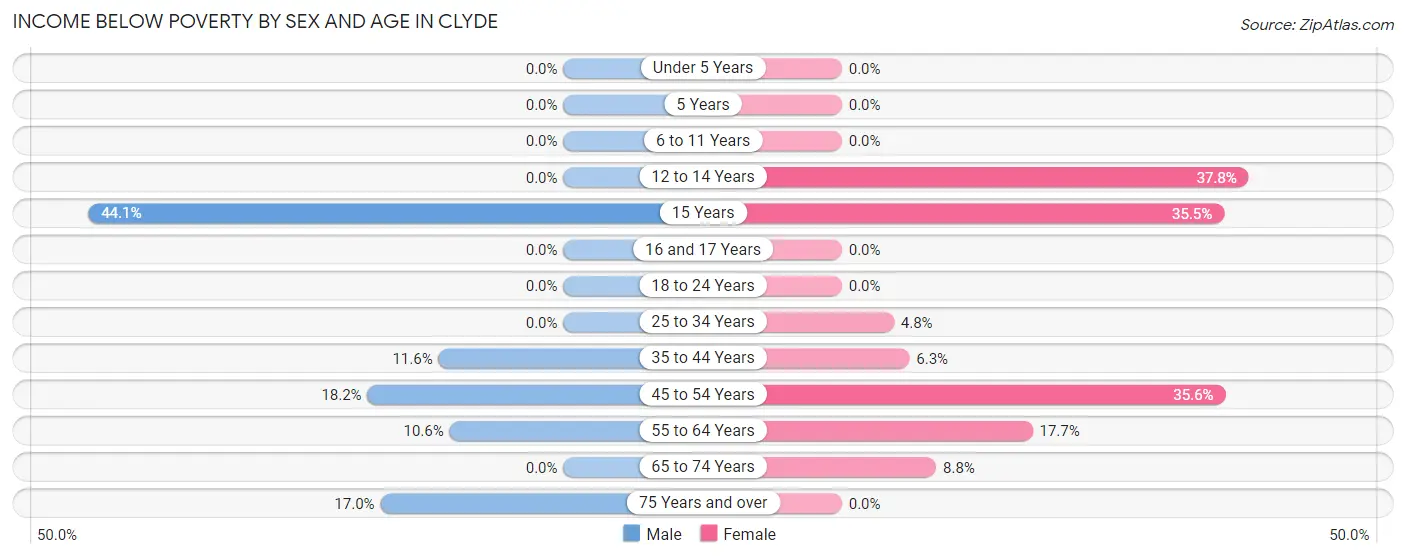
| Age Bracket | Male | Female |
| Under 5 Years | 0 (0.0%) | 0 (0.0%) |
| 5 Years | 0 (0.0%) | 0 (0.0%) |
| 6 to 11 Years | 0 (0.0%) | 0 (0.0%) |
| 12 to 14 Years | 0 (0.0%) | 54 (37.8%) |
| 15 Years | 56 (44.1%) | 11 (35.5%) |
| 16 and 17 Years | 0 (0.0%) | 0 (0.0%) |
| 18 to 24 Years | 0 (0.0%) | 0 (0.0%) |
| 25 to 34 Years | 0 (0.0%) | 17 (4.8%) |
| 35 to 44 Years | 35 (11.6%) | 18 (6.3%) |
| 45 to 54 Years | 86 (18.2%) | 152 (35.6%) |
| 55 to 64 Years | 58 (10.6%) | 103 (17.7%) |
| 65 to 74 Years | 0 (0.0%) | 37 (8.7%) |
| 75 Years and over | 27 (17.0%) | 0 (0.0%) |
| Total | 262 (7.8%) | 392 (13.7%) |
Income Above Poverty by Sex and Age in Clyde
According to the poverty statistics in Clyde, males aged under 5 years and females aged under 5 years are the age groups that are most secure financially, with 100.0% of males and 100.0% of females in these age groups living above the poverty line.
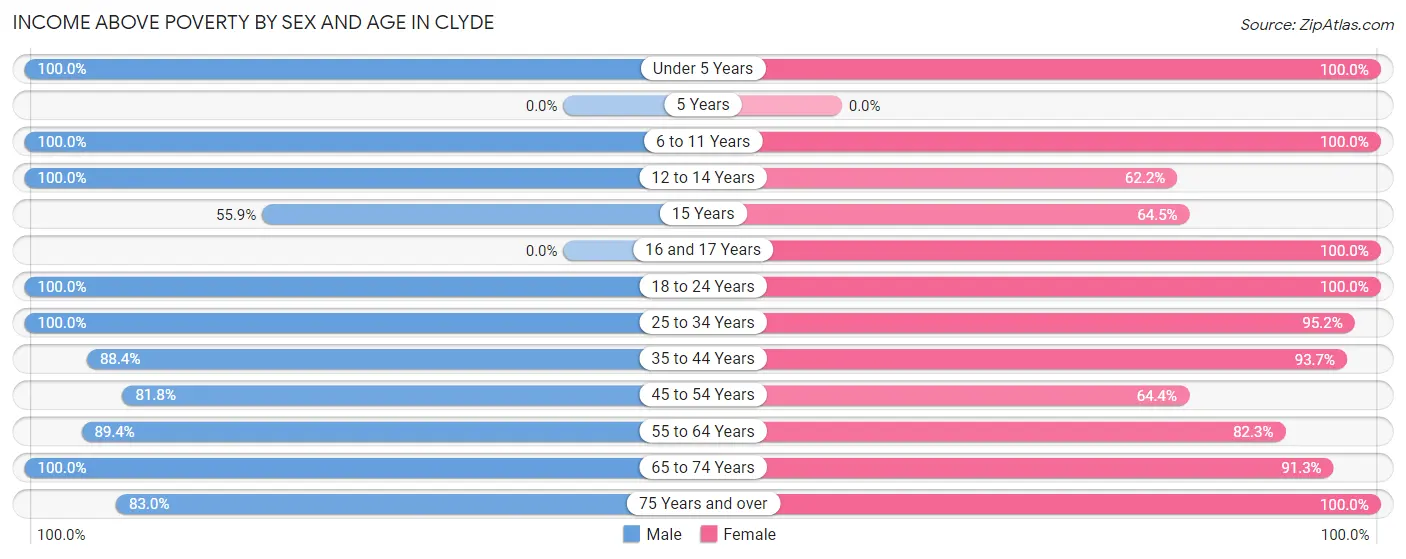
| Age Bracket | Male | Female |
| Under 5 Years | 106 (100.0%) | 64 (100.0%) |
| 5 Years | 0 (0.0%) | 0 (0.0%) |
| 6 to 11 Years | 253 (100.0%) | 120 (100.0%) |
| 12 to 14 Years | 124 (100.0%) | 89 (62.2%) |
| 15 Years | 71 (55.9%) | 20 (64.5%) |
| 16 and 17 Years | 0 (0.0%) | 97 (100.0%) |
| 18 to 24 Years | 227 (100.0%) | 118 (100.0%) |
| 25 to 34 Years | 571 (100.0%) | 335 (95.2%) |
| 35 to 44 Years | 267 (88.4%) | 269 (93.7%) |
| 45 to 54 Years | 387 (81.8%) | 275 (64.4%) |
| 55 to 64 Years | 491 (89.4%) | 479 (82.3%) |
| 65 to 74 Years | 465 (100.0%) | 386 (91.2%) |
| 75 Years and over | 132 (83.0%) | 218 (100.0%) |
| Total | 3,094 (92.2%) | 2,470 (86.3%) |
Income Below Poverty Among Married-Couple Families in Clyde
The poverty statistics for married-couple families in Clyde show that 3.0% or 37 of the total 1,222 families live below the poverty line. Families with 1 or 2 children have the highest poverty rate of 10.6%, comprising of 37 families. On the other hand, families with no children have the lowest poverty rate of 0.0%, which includes 0 families.
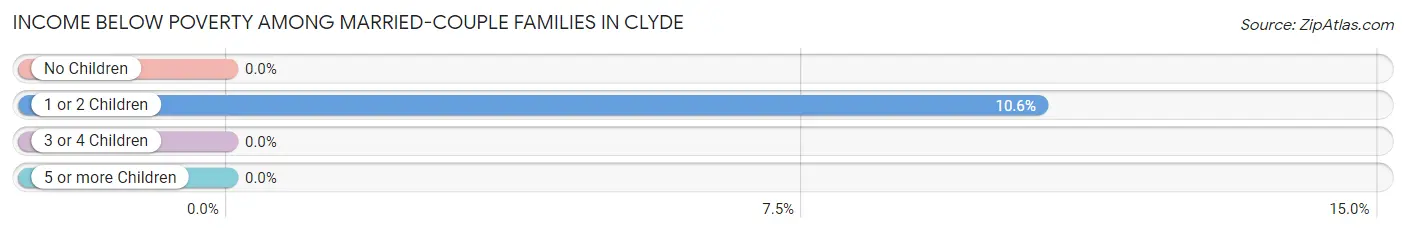
| Children | Above Poverty | Below Poverty |
| No Children | 848 (100.0%) | 0 (0.0%) |
| 1 or 2 Children | 313 (89.4%) | 37 (10.6%) |
| 3 or 4 Children | 24 (100.0%) | 0 (0.0%) |
| 5 or more Children | 0 (0.0%) | 0 (0.0%) |
| Total | 1,185 (97.0%) | 37 (3.0%) |
Income Below Poverty Among Single-Parent Households in Clyde
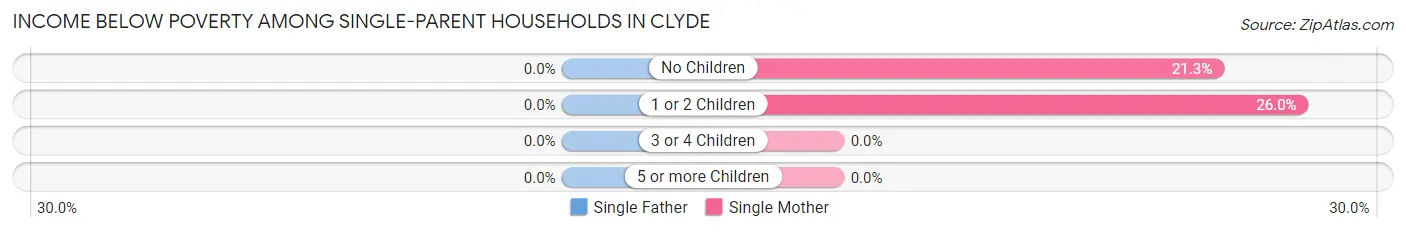
| Children | Single Father | Single Mother |
| No Children | 0 (0.0%) | 17 (21.2%) |
| 1 or 2 Children | 0 (0.0%) | 40 (26.0%) |
| 3 or 4 Children | 0 (0.0%) | 0 (0.0%) |
| 5 or more Children | 0 (0.0%) | 0 (0.0%) |
| Total | 0 (0.0%) | 57 (24.4%) |
Income Below Poverty Among Married-Couple vs Single-Parent Households in Clyde
The poverty data for Clyde shows that 37 of the married-couple family households (3.0%) and 57 of the single-parent households (12.0%) are living below the poverty level. Within the married-couple family households, those with 1 or 2 children have the highest poverty rate, with 37 households (10.6%) falling below the poverty line. Among the single-parent households, those with no children have the highest poverty rate, with 17 household (19.1%) living below poverty.
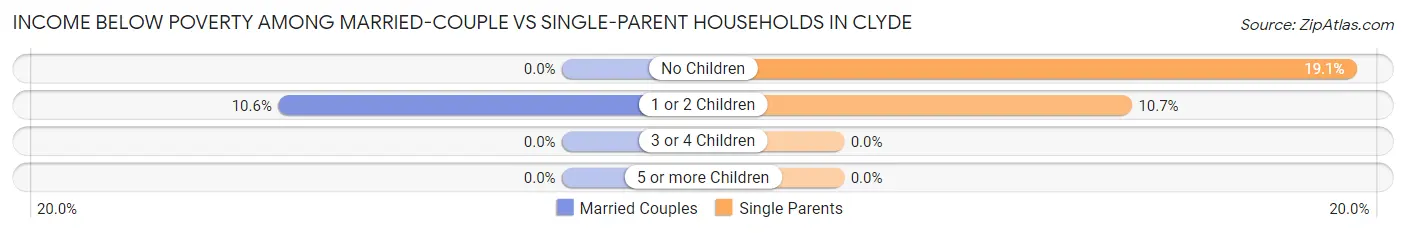
| Children | Married-Couple Families | Single-Parent Households |
| No Children | 0 (0.0%) | 17 (19.1%) |
| 1 or 2 Children | 37 (10.6%) | 40 (10.7%) |
| 3 or 4 Children | 0 (0.0%) | 0 (0.0%) |
| 5 or more Children | 0 (0.0%) | 0 (0.0%) |
| Total | 37 (3.0%) | 57 (12.0%) |
Race in Clyde
The most populous races in Clyde are White / Caucasian (5,956 | 94.3%), Hispanic or Latino (375 | 5.9%), and Two or more Races (215 | 3.4%).
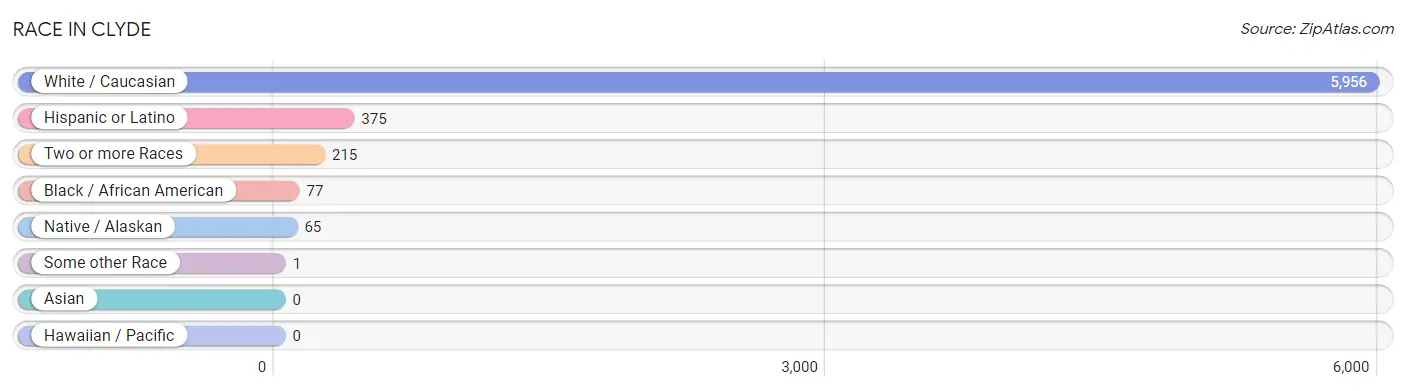
| Race | # Population | % Population |
| Asian | 0 | 0.0% |
| Black / African American | 77 | 1.2% |
| Hawaiian / Pacific | 0 | 0.0% |
| Hispanic or Latino | 375 | 5.9% |
| Native / Alaskan | 65 | 1.0% |
| White / Caucasian | 5,956 | 94.3% |
| Two or more Races | 215 | 3.4% |
| Some other Race | 1 | 0.0% |
| Total | 6,314 | 100.0% |
Ancestry in Clyde
The most populous ancestries reported in Clyde are German (2,412 | 38.2%), English (1,142 | 18.1%), Polish (519 | 8.2%), Irish (511 | 8.1%), and American (447 | 7.1%), together accounting for 79.7% of all Clyde residents.
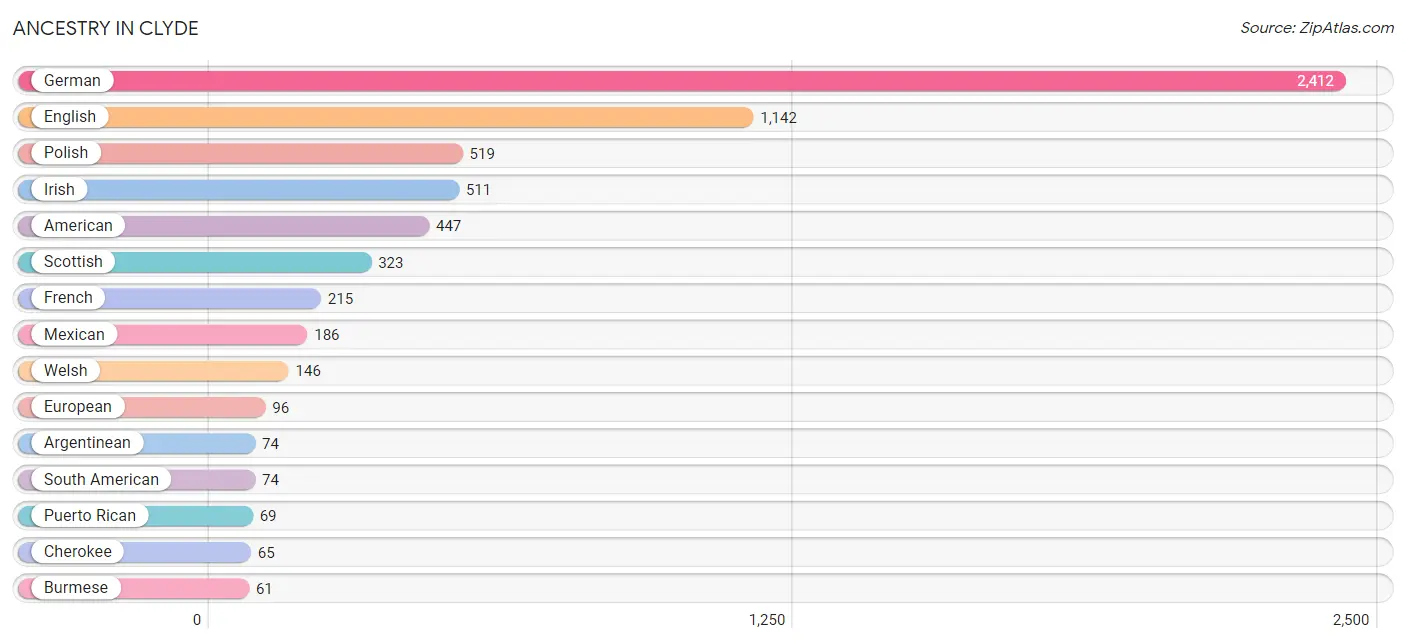
| Ancestry | # Population | % Population |
| American | 447 | 7.1% |
| Argentinean | 74 | 1.2% |
| Burmese | 61 | 1.0% |
| Cherokee | 65 | 1.0% |
| Cuban | 45 | 0.7% |
| Danish | 17 | 0.3% |
| Dutch | 30 | 0.5% |
| English | 1,142 | 18.1% |
| European | 96 | 1.5% |
| French | 215 | 3.4% |
| French Canadian | 32 | 0.5% |
| German | 2,412 | 38.2% |
| Irish | 511 | 8.1% |
| Italian | 10 | 0.2% |
| Mexican | 186 | 2.9% |
| Norwegian | 11 | 0.2% |
| Polish | 519 | 8.2% |
| Puerto Rican | 69 | 1.1% |
| Scotch-Irish | 19 | 0.3% |
| Scottish | 323 | 5.1% |
| South American | 74 | 1.2% |
| Welsh | 146 | 2.3% | View All 22 Rows |
Immigrants in Clyde
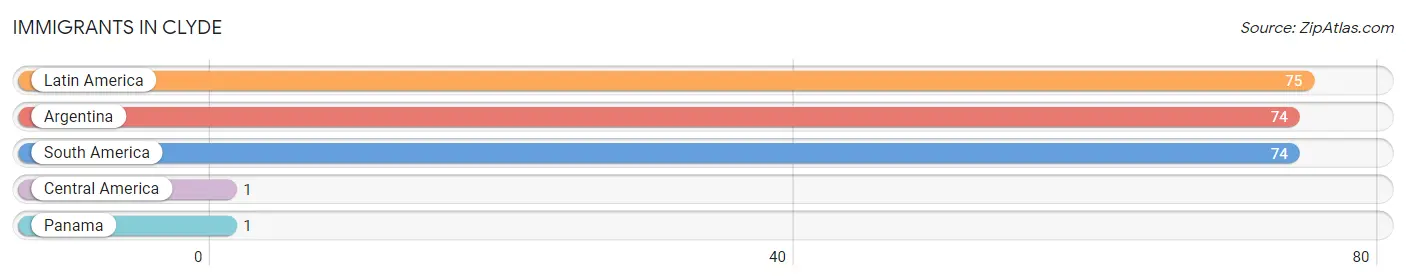
The most numerous immigrant groups reported in Clyde came from Latin America (75 | 1.2%), Argentina (74 | 1.2%), South America (74 | 1.2%), Central America (1 | 0.0%), and Panama (1 | 0.0%), together accounting for 3.6% of all Clyde residents.
| Immigration Origin | # Population | % Population |
| Argentina | 74 | 1.2% |
| Central America | 1 | 0.0% |
| Latin America | 75 | 1.2% |
| Panama | 1 | 0.0% |
| South America | 74 | 1.2% | View All 5 Rows |
Sex and Age in Clyde
Sex and Age in Clyde
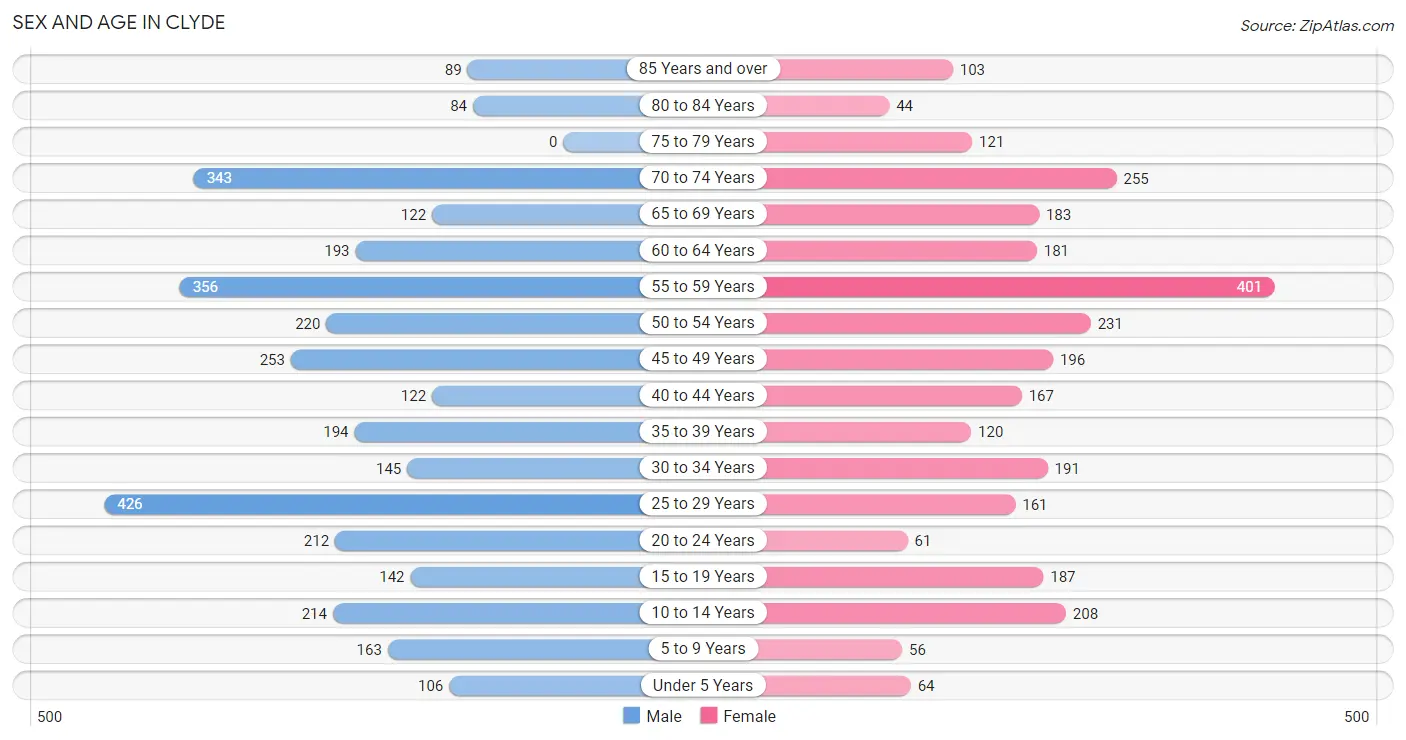
The most populous age groups in Clyde are 25 to 29 Years (426 | 12.6%) for men and 55 to 59 Years (401 | 13.7%) for women.
| Age Bracket | Male | Female |
| Under 5 Years | 106 (3.1%) | 64 (2.2%) |
| 5 to 9 Years | 163 (4.8%) | 56 (1.9%) |
| 10 to 14 Years | 214 (6.3%) | 208 (7.1%) |
| 15 to 19 Years | 142 (4.2%) | 187 (6.4%) |
| 20 to 24 Years | 212 (6.3%) | 61 (2.1%) |
| 25 to 29 Years | 426 (12.6%) | 161 (5.5%) |
| 30 to 34 Years | 145 (4.3%) | 191 (6.5%) |
| 35 to 39 Years | 194 (5.7%) | 120 (4.1%) |
| 40 to 44 Years | 122 (3.6%) | 167 (5.7%) |
| 45 to 49 Years | 253 (7.5%) | 196 (6.7%) |
| 50 to 54 Years | 220 (6.5%) | 231 (7.9%) |
| 55 to 59 Years | 356 (10.5%) | 401 (13.7%) |
| 60 to 64 Years | 193 (5.7%) | 181 (6.2%) |
| 65 to 69 Years | 122 (3.6%) | 183 (6.2%) |
| 70 to 74 Years | 343 (10.1%) | 255 (8.7%) |
| 75 to 79 Years | 0 (0.0%) | 121 (4.1%) |
| 80 to 84 Years | 84 (2.5%) | 44 (1.5%) |
| 85 Years and over | 89 (2.6%) | 103 (3.5%) |
| Total | 3,384 (100.0%) | 2,930 (100.0%) |
Families and Households in Clyde
Median Family Size in Clyde
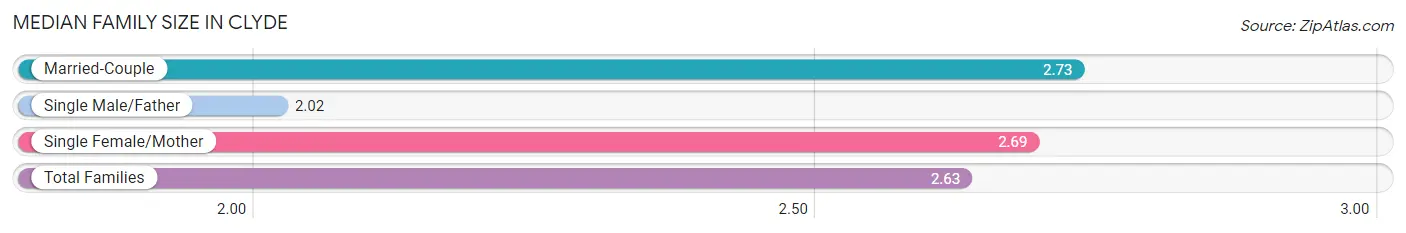
The median family size in Clyde is 2.63 persons per family, with married-couple families (1,222 | 72.1%) accounting for the largest median family size of 2.73 persons per family. On the other hand, single male/father families (239 | 14.1%) represent the smallest median family size with 2.02 persons per family.
| Family Type | # Families | Family Size |
| Married-Couple | 1,222 (72.1%) | 2.73 |
| Single Male/Father | 239 (14.1%) | 2.02 |
| Single Female/Mother | 234 (13.8%) | 2.69 |
| Total Families | 1,695 (100.0%) | 2.63 |
Median Household Size in Clyde
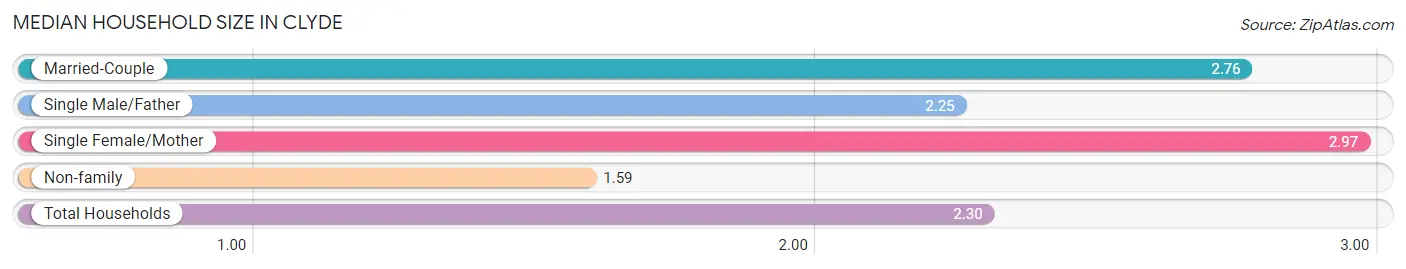
The median household size in Clyde is 2.30 persons per household, with single female/mother households (234 | 8.7%) accounting for the largest median household size of 2.97 persons per household. non-family households (983 | 36.7%) represent the smallest median household size with 1.59 persons per household.
| Household Type | # Households | Household Size |
| Married-Couple | 1,222 (45.6%) | 2.76 |
| Single Male/Father | 239 (8.9%) | 2.25 |
| Single Female/Mother | 234 (8.7%) | 2.97 |
| Non-family | 983 (36.7%) | 1.59 |
| Total Households | 2,678 (100.0%) | 2.30 |
Household Size by Marriage Status in Clyde
Out of a total of 2,678 households in Clyde, 1,695 (63.3%) are family households, while 983 (36.7%) are nonfamily households. The most numerous type of family households are 2-person households, comprising 949, and the most common type of nonfamily households are 1-person households, comprising 603.
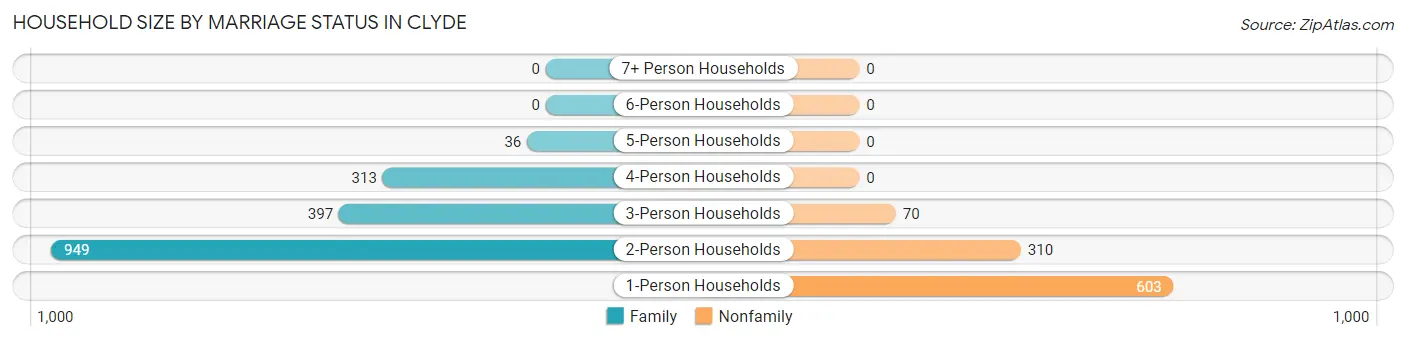
| Household Size | Family Households | Nonfamily Households |
| 1-Person Households | - | 603 (22.5%) |
| 2-Person Households | 949 (35.4%) | 310 (11.6%) |
| 3-Person Households | 397 (14.8%) | 70 (2.6%) |
| 4-Person Households | 313 (11.7%) | 0 (0.0%) |
| 5-Person Households | 36 (1.3%) | 0 (0.0%) |
| 6-Person Households | 0 (0.0%) | 0 (0.0%) |
| 7+ Person Households | 0 (0.0%) | 0 (0.0%) |
| Total | 1,695 (63.3%) | 983 (36.7%) |
Female Fertility in Clyde
Fertility by Age in Clyde
Average fertility rate in Clyde is 92.0 births per 1,000 women. Women in the age bracket of 20 to 34 years have the highest fertility rate with 206.0 births per 1,000 women. Women in the age bracket of 20 to 34 years acount for 85.0% of all women with births.
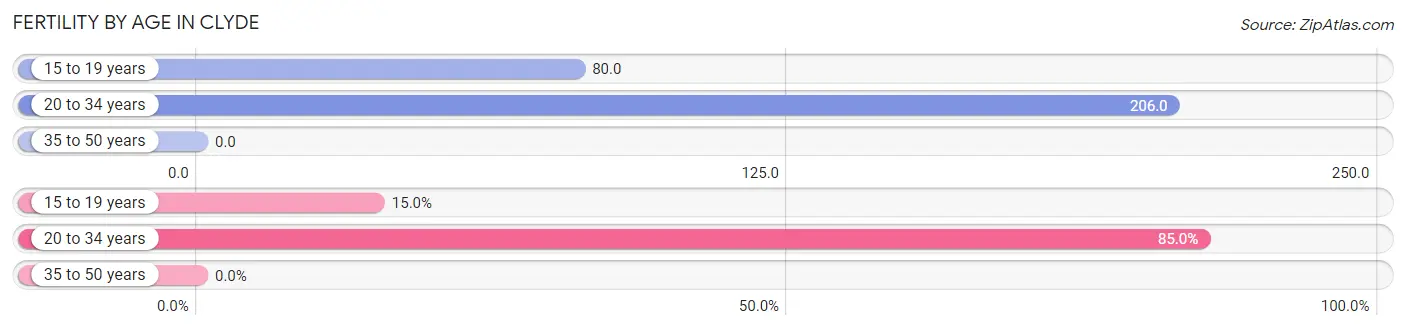
| Age Bracket | Women with Births | Births / 1,000 Women |
| 15 to 19 years | 15 (15.0%) | 80.0 |
| 20 to 34 years | 85 (85.0%) | 206.0 |
| 35 to 50 years | 0 (0.0%) | 0.0 |
| Total | 100 (100.0%) | 92.0 |
Fertility by Age by Marriage Status in Clyde
29.0% of women with births (100) in Clyde are married. The highest percentage of unmarried women with births falls into 15 to 19 years age bracket with 100.0% of them unmarried at the time of birth, while the lowest percentage of unmarried women with births belong to 20 to 34 years age bracket with 65.9% of them unmarried.
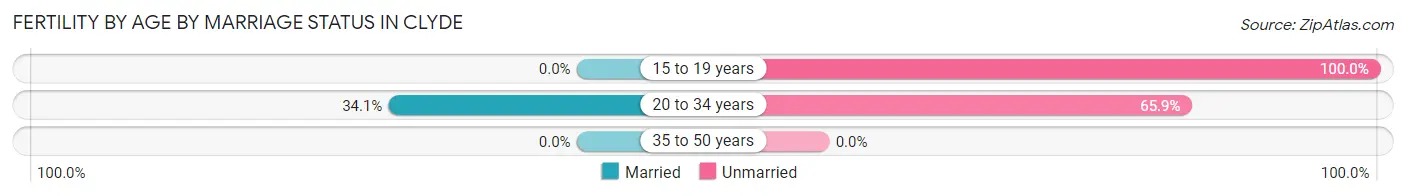
| Age Bracket | Married | Unmarried |
| 15 to 19 years | 0 (0.0%) | 15 (100.0%) |
| 20 to 34 years | 29 (34.1%) | 56 (65.9%) |
| 35 to 50 years | 0 (0.0%) | 0 (0.0%) |
| Total | 29 (29.0%) | 71 (71.0%) |
Fertility by Education in Clyde
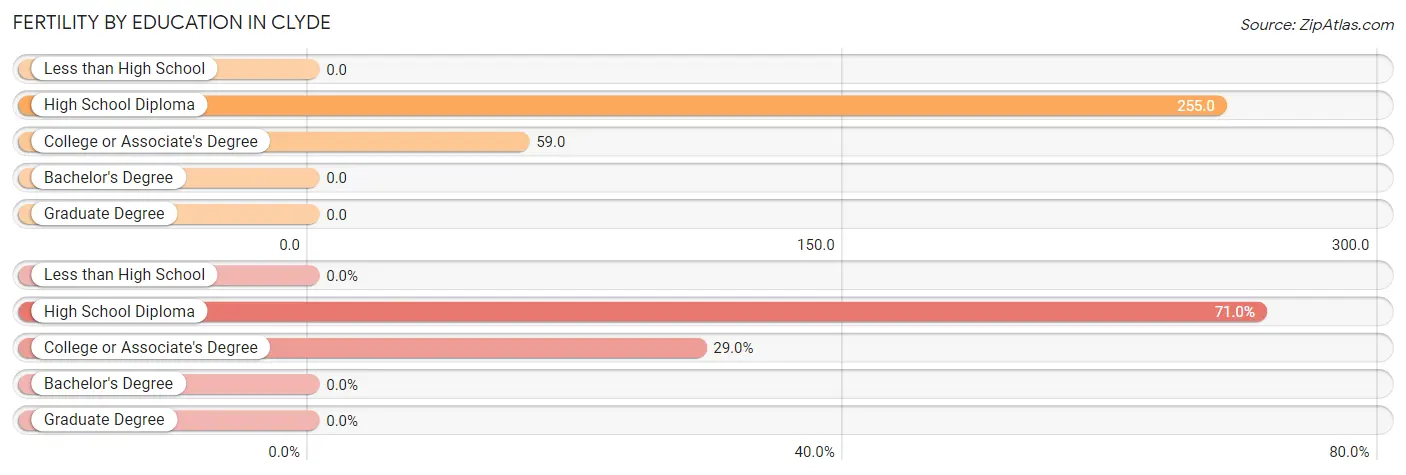
| Educational Attainment | Women with Births | Births / 1,000 Women |
| Less than High School | 0 (0.0%) | 0.0 |
| High School Diploma | 71 (71.0%) | 255.0 |
| College or Associate's Degree | 29 (29.0%) | 59.0 |
| Bachelor's Degree | 0 (0.0%) | 0.0 |
| Graduate Degree | 0 (0.0%) | 0.0 |
| Total | 100 (100.0%) | 92.0 |
Fertility by Education by Marriage Status in Clyde
71.0% of women with births in Clyde are unmarried. Women with the educational attainment of college or associate's degree are most likely to be married with 100.0% of them married at childbirth, while women with the educational attainment of high school diploma are least likely to be married with 100.0% of them unmarried at childbirth.
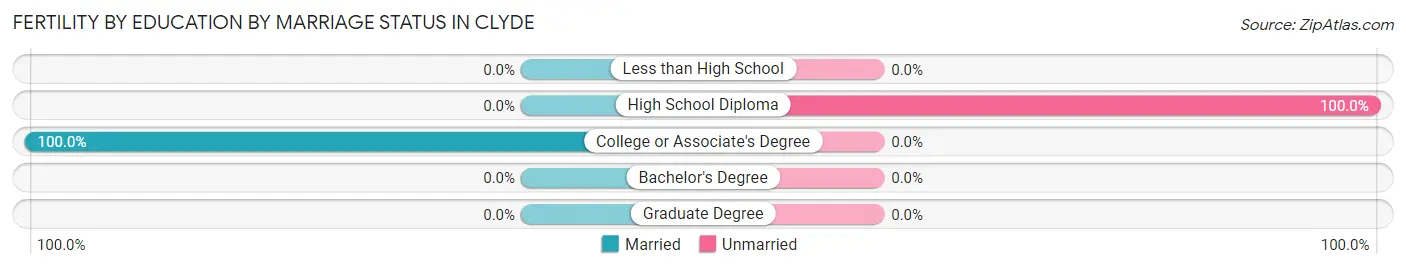
| Educational Attainment | Married | Unmarried |
| Less than High School | 0 (0.0%) | 0 (0.0%) |
| High School Diploma | 0 (0.0%) | 71 (100.0%) |
| College or Associate's Degree | 29 (100.0%) | 0 (0.0%) |
| Bachelor's Degree | 0 (0.0%) | 0 (0.0%) |
| Graduate Degree | 0 (0.0%) | 0 (0.0%) |
| Total | 29 (29.0%) | 71 (71.0%) |
Employment Characteristics in Clyde
Employment by Class of Employer in Clyde
Among the 2,953 employed individuals in Clyde, private company employees (2,286 | 77.4%), not-for-profit organizations (234 | 7.9%), and self-employed (not incorporated) (159 | 5.4%) make up the most common classes of employment.
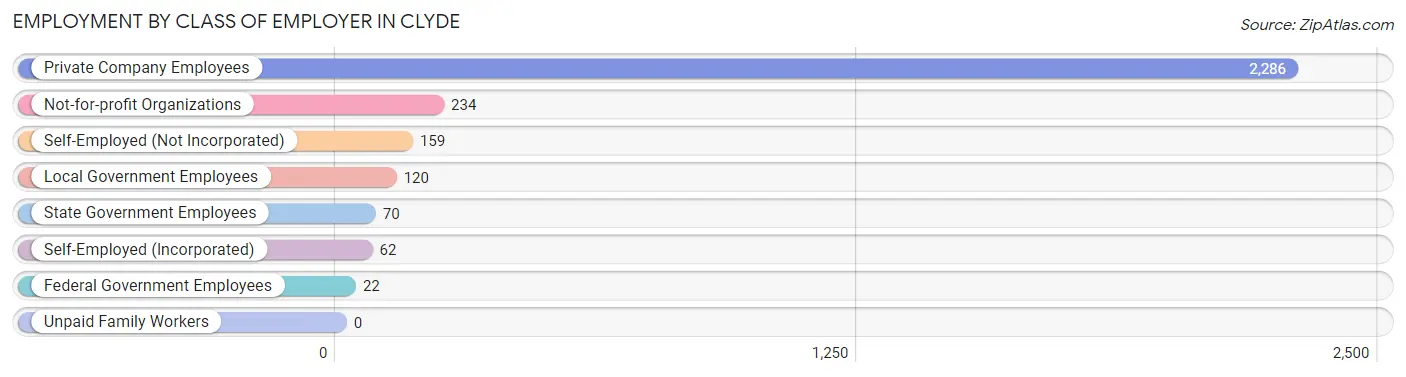
| Employer Class | # Employees | % Employees |
| Private Company Employees | 2,286 | 77.4% |
| Self-Employed (Incorporated) | 62 | 2.1% |
| Self-Employed (Not Incorporated) | 159 | 5.4% |
| Not-for-profit Organizations | 234 | 7.9% |
| Local Government Employees | 120 | 4.1% |
| State Government Employees | 70 | 2.4% |
| Federal Government Employees | 22 | 0.7% |
| Unpaid Family Workers | 0 | 0.0% |
| Total | 2,953 | 100.0% |
Employment Status by Age in Clyde
According to the labor force statistics for Clyde, out of the total population over 16 years of age (5,344), 62.6% or 3,345 individuals are in the labor force, with 7.1% or 237 of them unemployed. The age group with the highest labor force participation rate is 20 to 24 years, with 100.0% or 273 individuals in the labor force. Within the labor force, the 75 years and over age range has the highest percentage of unemployed individuals, with 100.0% or 15 of them being unemployed.
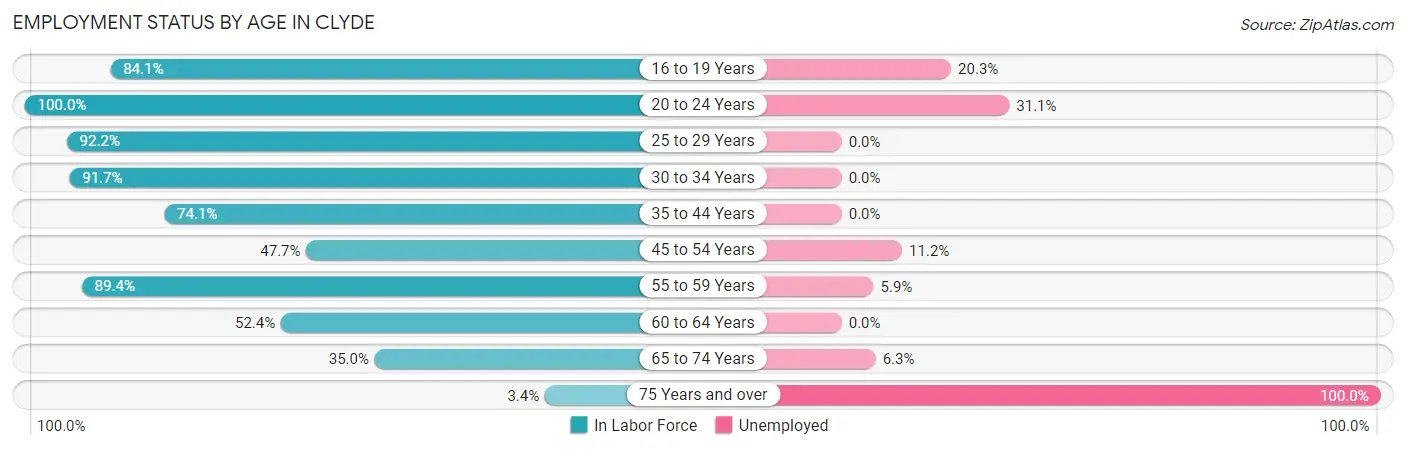
| Age Bracket | In Labor Force | Unemployed |
| 16 to 19 Years | 143 (84.1%) | 29 (20.3%) |
| 20 to 24 Years | 273 (100.0%) | 85 (31.1%) |
| 25 to 29 Years | 541 (92.2%) | 0 (0.0%) |
| 30 to 34 Years | 308 (91.7%) | 0 (0.0%) |
| 35 to 44 Years | 447 (74.1%) | 0 (0.0%) |
| 45 to 54 Years | 429 (47.7%) | 48 (11.2%) |
| 55 to 59 Years | 677 (89.4%) | 40 (5.9%) |
| 60 to 64 Years | 196 (52.4%) | 0 (0.0%) |
| 65 to 74 Years | 316 (35.0%) | 20 (6.3%) |
| 75 Years and over | 15 (3.4%) | 15 (100.0%) |
| Total | 3,345 (62.6%) | 237 (7.1%) |
Employment Status by Educational Attainment in Clyde
According to labor force statistics for Clyde, 73.0% of individuals (2,597) out of the total population between 25 and 64 years of age (3,557) are in the labor force, with 3.4% or 88 of them being unemployed. The group with the highest labor force participation rate are those with the educational attainment of bachelor's degree or higher, with 87.4% or 682 individuals in the labor force. Within the labor force, individuals with bachelor's degree or higher education have the highest percentage of unemployment, with 5.9% or 40 of them being unemployed.
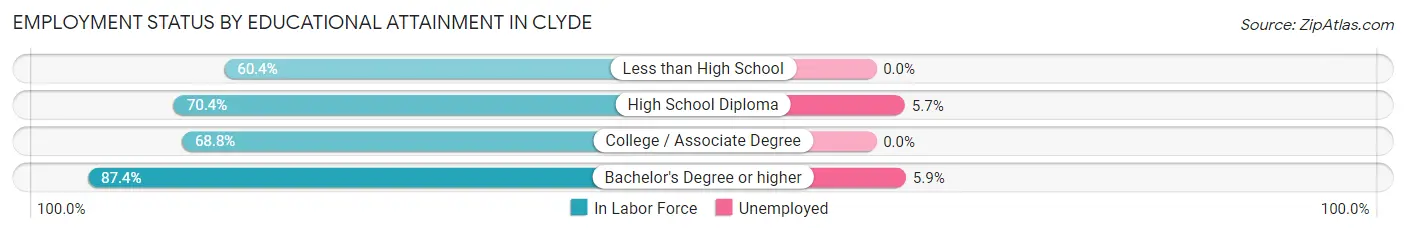
| Educational Attainment | In Labor Force | Unemployed |
| Less than High School | 90 (60.4%) | 0 (0.0%) |
| High School Diploma | 841 (70.4%) | 68 (5.7%) |
| College / Associate Degree | 987 (68.8%) | 0 (0.0%) |
| Bachelor's Degree or higher | 682 (87.4%) | 46 (5.9%) |
| Total | 2,597 (73.0%) | 121 (3.4%) |
Employment Occupations by Sex in Clyde
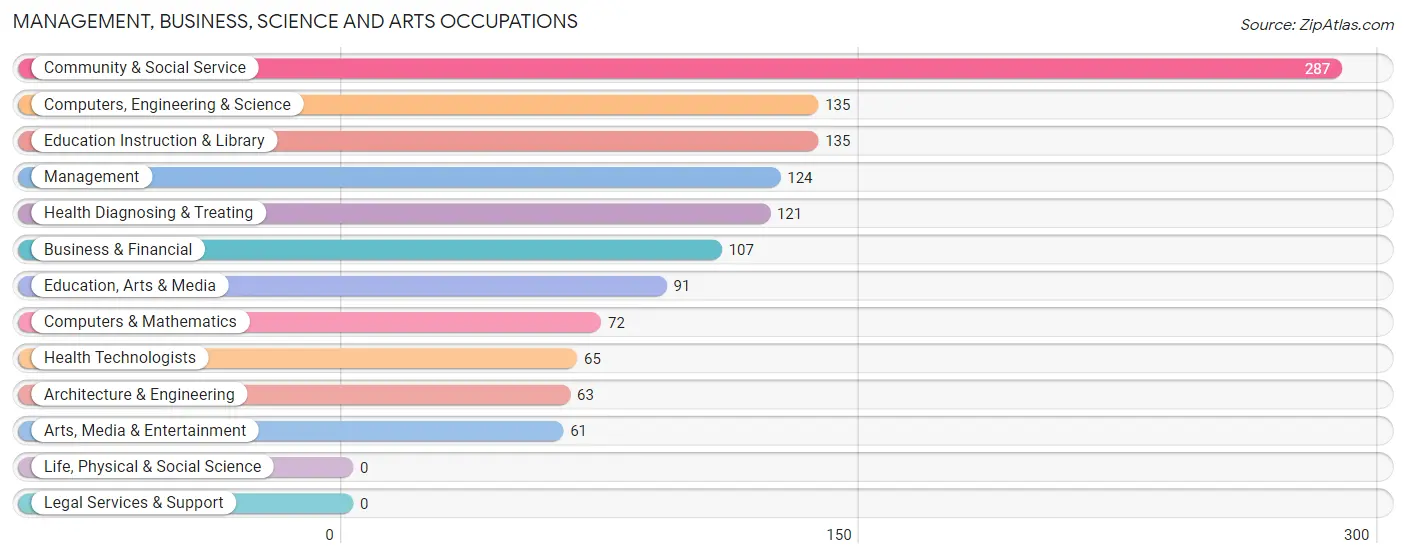
Management, Business, Science and Arts Occupations
The most common Management, Business, Science and Arts occupations in Clyde are Community & Social Service (287 | 9.2%), Computers, Engineering & Science (135 | 4.3%), Education Instruction & Library (135 | 4.3%), Management (124 | 4.0%), and Health Diagnosing & Treating (121 | 3.9%).
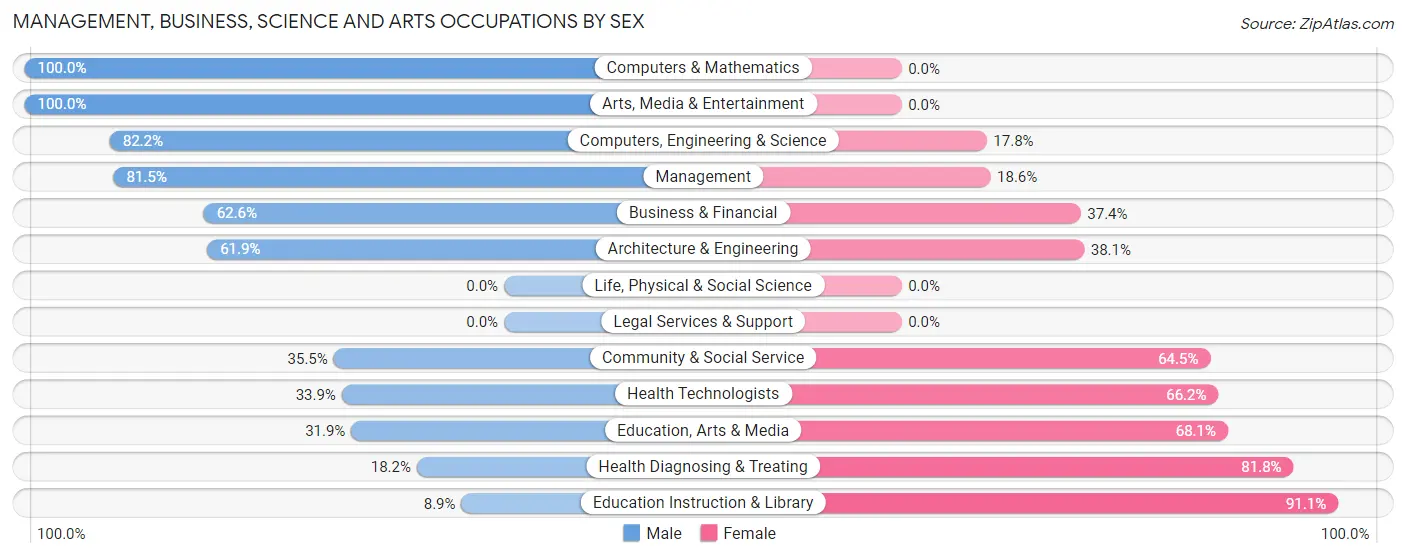
Management, Business, Science and Arts Occupations by Sex
Within the Management, Business, Science and Arts occupations in Clyde, the most male-oriented occupations are Computers & Mathematics (100.0%), Arts, Media & Entertainment (100.0%), and Computers, Engineering & Science (82.2%), while the most female-oriented occupations are Education Instruction & Library (91.1%), Health Diagnosing & Treating (81.8%), and Education, Arts & Media (68.1%).
| Occupation | Male | Female |
| Management | 101 (81.5%) | 23 (18.5%) |
| Business & Financial | 67 (62.6%) | 40 (37.4%) |
| Computers, Engineering & Science | 111 (82.2%) | 24 (17.8%) |
| Computers & Mathematics | 72 (100.0%) | 0 (0.0%) |
| Architecture & Engineering | 39 (61.9%) | 24 (38.1%) |
| Life, Physical & Social Science | 0 (0.0%) | 0 (0.0%) |
| Community & Social Service | 102 (35.5%) | 185 (64.5%) |
| Education, Arts & Media | 29 (31.9%) | 62 (68.1%) |
| Legal Services & Support | 0 (0.0%) | 0 (0.0%) |
| Education Instruction & Library | 12 (8.9%) | 123 (91.1%) |
| Arts, Media & Entertainment | 61 (100.0%) | 0 (0.0%) |
| Health Diagnosing & Treating | 22 (18.2%) | 99 (81.8%) |
| Health Technologists | 22 (33.9%) | 43 (66.1%) |
| Total (Category) | 403 (52.1%) | 371 (47.9%) |
| Total (Overall) | 1,823 (58.7%) | 1,285 (41.3%) |
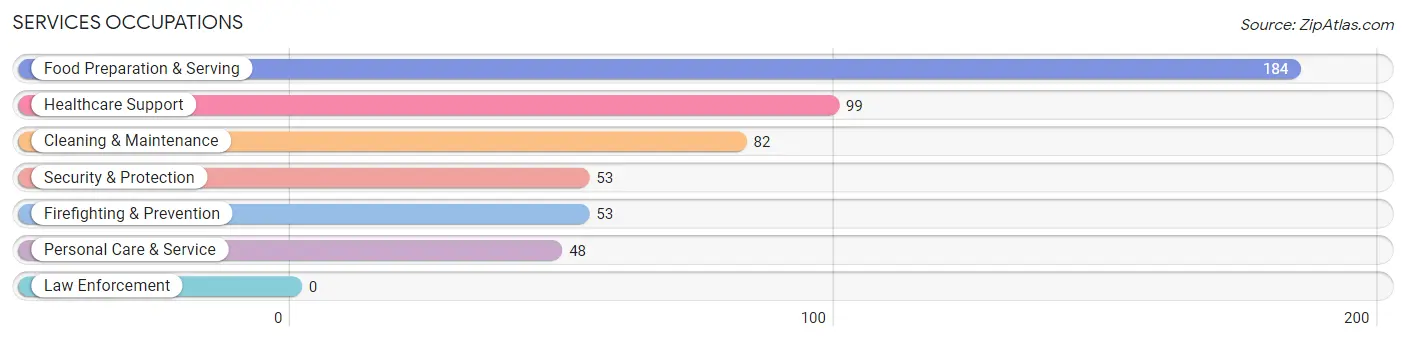
Services Occupations
The most common Services occupations in Clyde are Food Preparation & Serving (184 | 5.9%), Healthcare Support (99 | 3.2%), Cleaning & Maintenance (82 | 2.6%), Security & Protection (53 | 1.7%), and Firefighting & Prevention (53 | 1.7%).
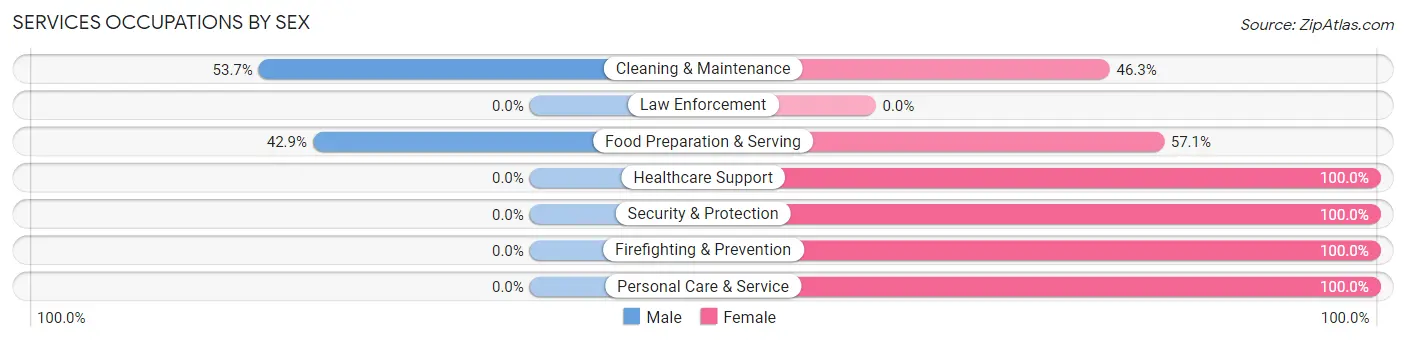
Services Occupations by Sex
Within the Services occupations in Clyde, the most male-oriented occupations are Cleaning & Maintenance (53.7%), and Food Preparation & Serving (42.9%), while the most female-oriented occupations are Healthcare Support (100.0%), Security & Protection (100.0%), and Firefighting & Prevention (100.0%).
| Occupation | Male | Female |
| Healthcare Support | 0 (0.0%) | 99 (100.0%) |
| Security & Protection | 0 (0.0%) | 53 (100.0%) |
| Firefighting & Prevention | 0 (0.0%) | 53 (100.0%) |
| Law Enforcement | 0 (0.0%) | 0 (0.0%) |
| Food Preparation & Serving | 79 (42.9%) | 105 (57.1%) |
| Cleaning & Maintenance | 44 (53.7%) | 38 (46.3%) |
| Personal Care & Service | 0 (0.0%) | 48 (100.0%) |
| Total (Category) | 123 (26.4%) | 343 (73.6%) |
| Total (Overall) | 1,823 (58.7%) | 1,285 (41.3%) |
Sales and Office Occupations
The most common Sales and Office occupations in Clyde are Office & Administration (297 | 9.6%), and Sales & Related (121 | 3.9%).
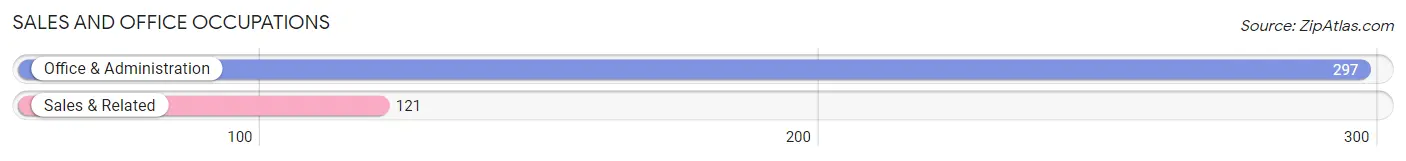
Sales and Office Occupations by Sex
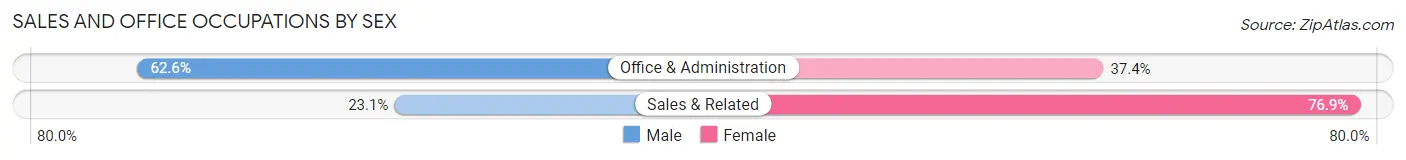
| Occupation | Male | Female |
| Sales & Related | 28 (23.1%) | 93 (76.9%) |
| Office & Administration | 186 (62.6%) | 111 (37.4%) |
| Total (Category) | 214 (51.2%) | 204 (48.8%) |
| Total (Overall) | 1,823 (58.7%) | 1,285 (41.3%) |
Natural Resources, Construction and Maintenance Occupations
The most common Natural Resources, Construction and Maintenance occupations in Clyde are Construction & Extraction (128 | 4.1%), Installation, Maintenance & Repair (65 | 2.1%), and Farming, Fishing & Forestry (22 | 0.7%).
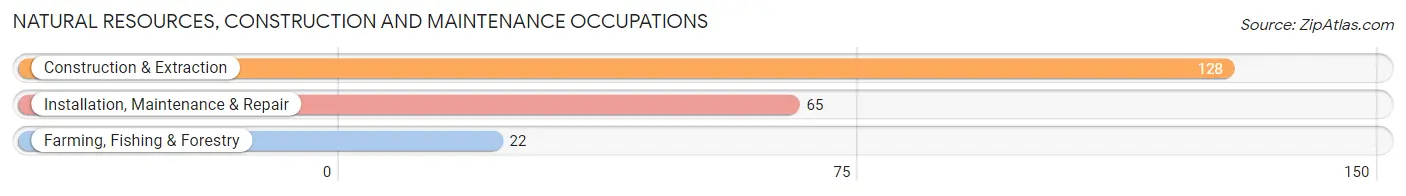
Natural Resources, Construction and Maintenance Occupations by Sex
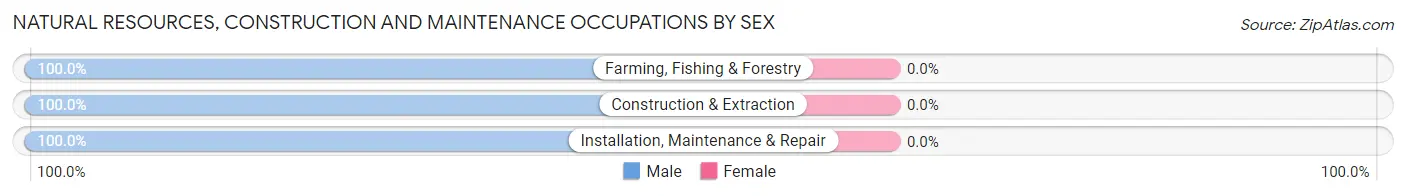
| Occupation | Male | Female |
| Farming, Fishing & Forestry | 22 (100.0%) | 0 (0.0%) |
| Construction & Extraction | 128 (100.0%) | 0 (0.0%) |
| Installation, Maintenance & Repair | 65 (100.0%) | 0 (0.0%) |
| Total (Category) | 215 (100.0%) | 0 (0.0%) |
| Total (Overall) | 1,823 (58.7%) | 1,285 (41.3%) |
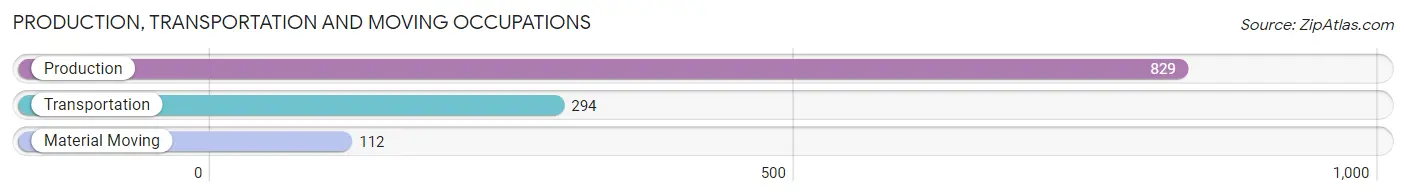
Production, Transportation and Moving Occupations
The most common Production, Transportation and Moving occupations in Clyde are Production (829 | 26.7%), Transportation (294 | 9.5%), and Material Moving (112 | 3.6%).
Production, Transportation and Moving Occupations by Sex
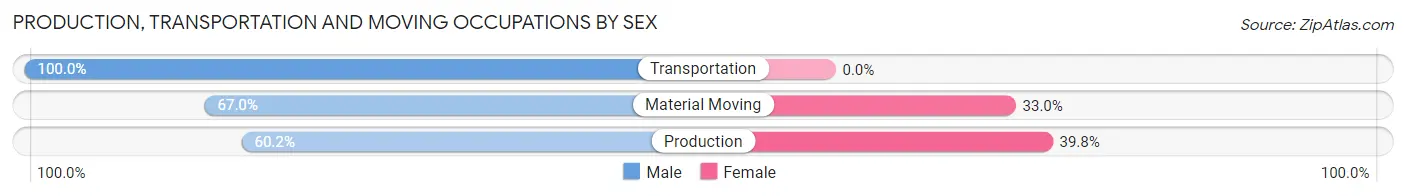
| Occupation | Male | Female |
| Production | 499 (60.2%) | 330 (39.8%) |
| Transportation | 294 (100.0%) | 0 (0.0%) |
| Material Moving | 75 (67.0%) | 37 (33.0%) |
| Total (Category) | 868 (70.3%) | 367 (29.7%) |
| Total (Overall) | 1,823 (58.7%) | 1,285 (41.3%) |
Employment Industries by Sex in Clyde
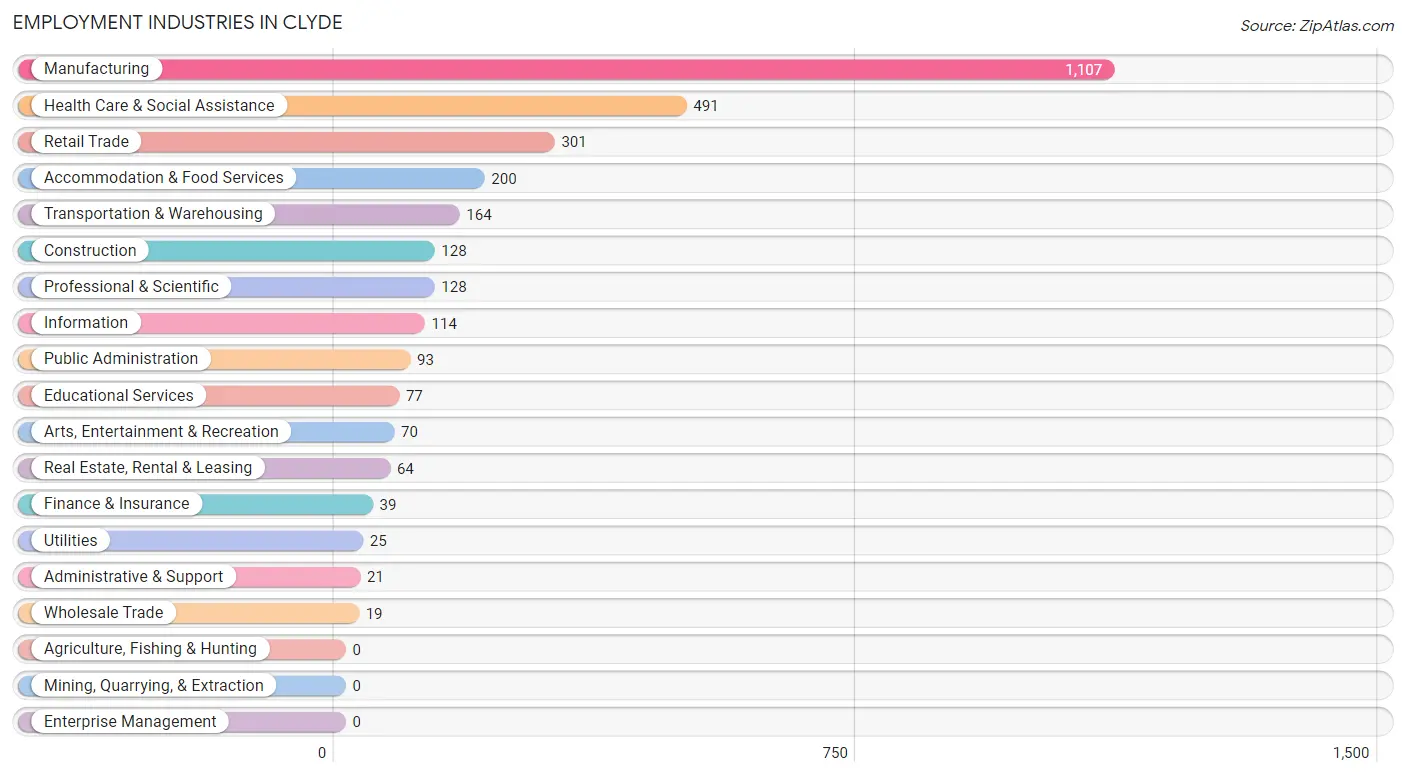
Employment Industries in Clyde
The major employment industries in Clyde include Manufacturing (1,107 | 35.6%), Health Care & Social Assistance (491 | 15.8%), Retail Trade (301 | 9.7%), Accommodation & Food Services (200 | 6.4%), and Transportation & Warehousing (164 | 5.3%).
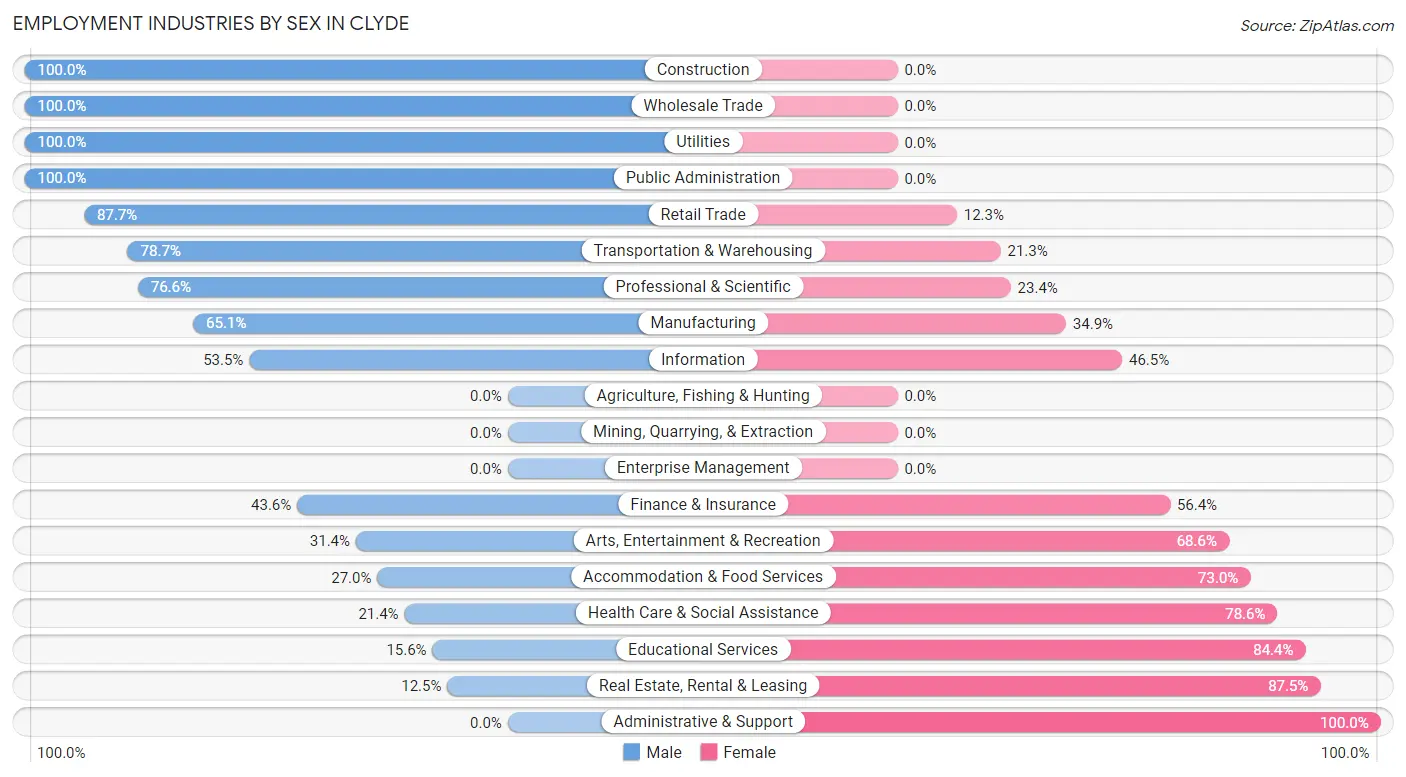
Employment Industries by Sex in Clyde
The Clyde industries that see more men than women are Construction (100.0%), Wholesale Trade (100.0%), and Utilities (100.0%), whereas the industries that tend to have a higher number of women are Administrative & Support (100.0%), Real Estate, Rental & Leasing (87.5%), and Educational Services (84.4%).
| Industry | Male | Female |
| Agriculture, Fishing & Hunting | 0 (0.0%) | 0 (0.0%) |
| Mining, Quarrying, & Extraction | 0 (0.0%) | 0 (0.0%) |
| Construction | 128 (100.0%) | 0 (0.0%) |
| Manufacturing | 721 (65.1%) | 386 (34.9%) |
| Wholesale Trade | 19 (100.0%) | 0 (0.0%) |
| Retail Trade | 264 (87.7%) | 37 (12.3%) |
| Transportation & Warehousing | 129 (78.7%) | 35 (21.3%) |
| Utilities | 25 (100.0%) | 0 (0.0%) |
| Information | 61 (53.5%) | 53 (46.5%) |
| Finance & Insurance | 17 (43.6%) | 22 (56.4%) |
| Real Estate, Rental & Leasing | 8 (12.5%) | 56 (87.5%) |
| Professional & Scientific | 98 (76.6%) | 30 (23.4%) |
| Enterprise Management | 0 (0.0%) | 0 (0.0%) |
| Administrative & Support | 0 (0.0%) | 21 (100.0%) |
| Educational Services | 12 (15.6%) | 65 (84.4%) |
| Health Care & Social Assistance | 105 (21.4%) | 386 (78.6%) |
| Arts, Entertainment & Recreation | 22 (31.4%) | 48 (68.6%) |
| Accommodation & Food Services | 54 (27.0%) | 146 (73.0%) |
| Public Administration | 93 (100.0%) | 0 (0.0%) |
| Total | 1,823 (58.7%) | 1,285 (41.3%) |
Education in Clyde
School Enrollment in Clyde
The most common levels of schooling among the 1,221 students in Clyde are middle school (345 | 28.3%), high school (314 | 25.7%), and college / undergraduate (236 | 19.3%).

| School Level | # Students | % Students |
| Nursery / Preschool | 17 | 1.4% |
| Kindergarten | 128 | 10.5% |
| Elementary School | 115 | 9.4% |
| Middle School | 345 | 28.3% |
| High School | 314 | 25.7% |
| College / Undergraduate | 236 | 19.3% |
| Graduate / Professional | 66 | 5.4% |
| Total | 1,221 | 100.0% |
School Enrollment by Age by Funding Source in Clyde
Out of a total of 1,221 students who are enrolled in schools in Clyde, 71 (5.8%) attend a private institution, while the remaining 1,150 (94.2%) are enrolled in public schools. The age group of 20 to 24 year olds has the highest likelihood of being enrolled in private schools, with 25 (15.1% in the age bracket) enrolled. Conversely, the age group of 3 to 4 year olds has the lowest likelihood of being enrolled in a private school, with 17 (100.0% in the age bracket) attending a public institution.
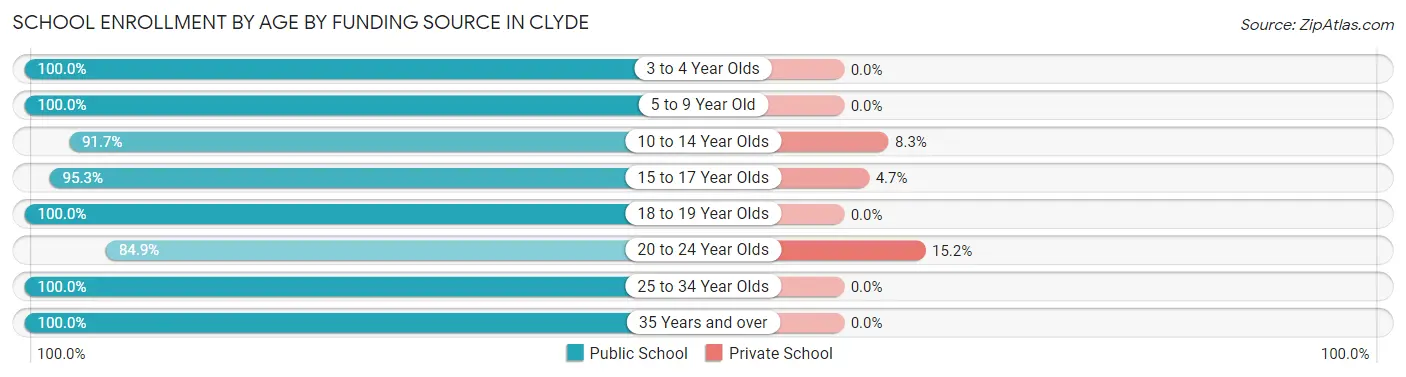
| Age Bracket | Public School | Private School |
| 3 to 4 Year Olds | 17 (100.0%) | 0 (0.0%) |
| 5 to 9 Year Old | 219 (100.0%) | 0 (0.0%) |
| 10 to 14 Year Olds | 377 (91.7%) | 34 (8.3%) |
| 15 to 17 Year Olds | 245 (95.3%) | 12 (4.7%) |
| 18 to 19 Year Olds | 15 (100.0%) | 0 (0.0%) |
| 20 to 24 Year Olds | 140 (84.9%) | 25 (15.1%) |
| 25 to 34 Year Olds | 43 (100.0%) | 0 (0.0%) |
| 35 Years and over | 94 (100.0%) | 0 (0.0%) |
| Total | 1,150 (94.2%) | 71 (5.8%) |
Educational Attainment by Field of Study in Clyde
Science & technology (265 | 26.0%), business (180 | 17.6%), education (155 | 15.2%), liberal arts & history (131 | 12.8%), and engineering (75 | 7.3%) are the most common fields of study among 1,021 individuals in Clyde who have obtained a bachelor's degree or higher.
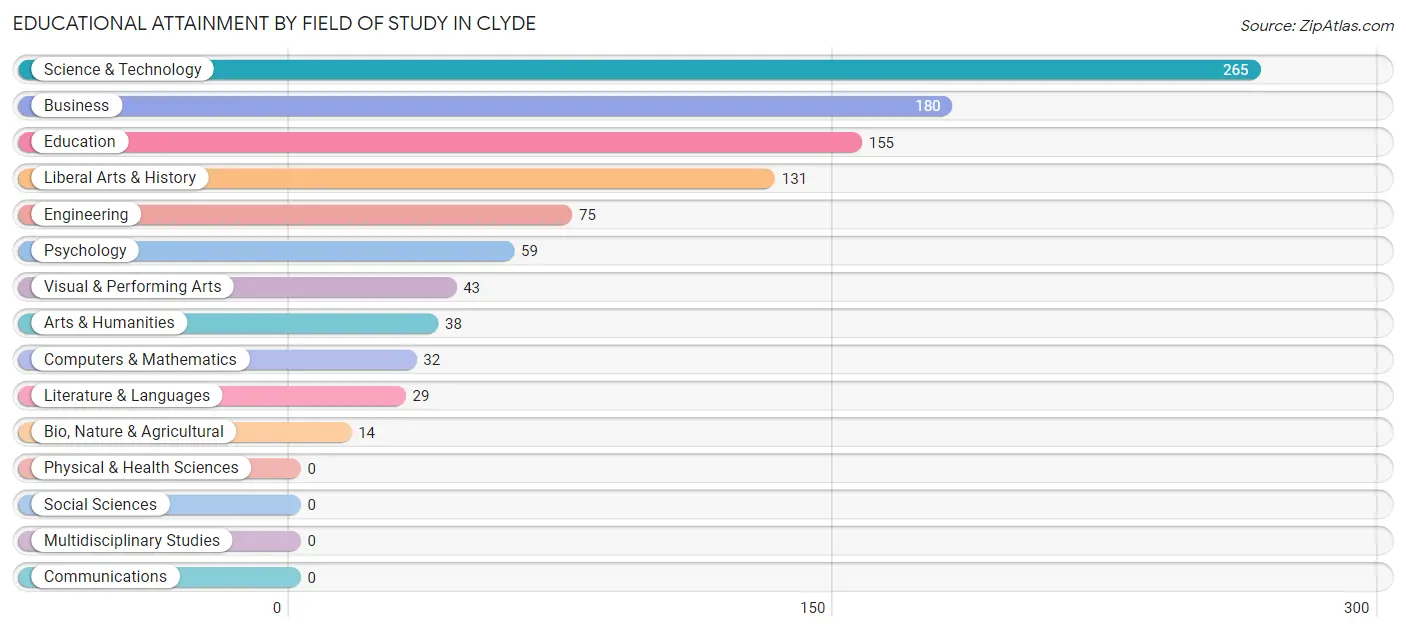
| Field of Study | # Graduates | % Graduates |
| Computers & Mathematics | 32 | 3.1% |
| Bio, Nature & Agricultural | 14 | 1.4% |
| Physical & Health Sciences | 0 | 0.0% |
| Psychology | 59 | 5.8% |
| Social Sciences | 0 | 0.0% |
| Engineering | 75 | 7.3% |
| Multidisciplinary Studies | 0 | 0.0% |
| Science & Technology | 265 | 26.0% |
| Business | 180 | 17.6% |
| Education | 155 | 15.2% |
| Literature & Languages | 29 | 2.8% |
| Liberal Arts & History | 131 | 12.8% |
| Visual & Performing Arts | 43 | 4.2% |
| Communications | 0 | 0.0% |
| Arts & Humanities | 38 | 3.7% |
| Total | 1,021 | 100.0% |
Transportation & Commute in Clyde
Vehicle Availability by Sex in Clyde
The most prevalent vehicle ownership categories in Clyde are males with 2 vehicles (1,003, accounting for 58.2%) and females with 2 vehicles (490, making up 81.6%).
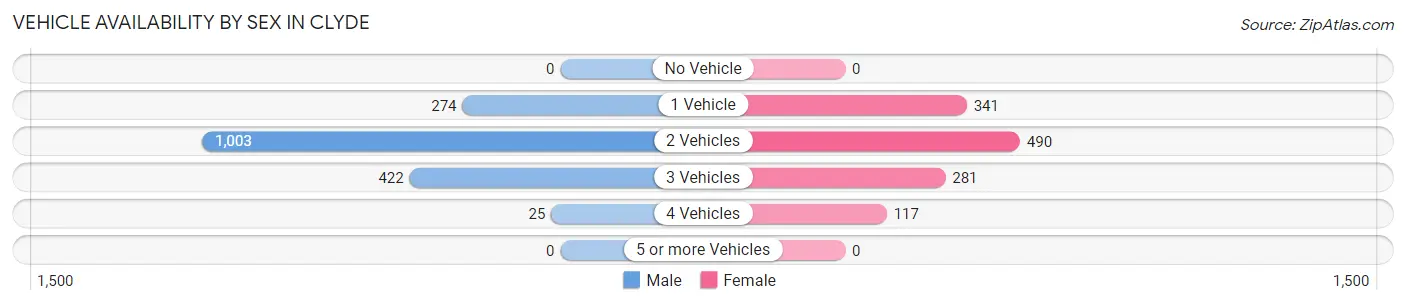
| Vehicles Available | Male | Female |
| No Vehicle | 0 (0.0%) | 0 (0.0%) |
| 1 Vehicle | 274 (15.9%) | 341 (27.8%) |
| 2 Vehicles | 1,003 (58.2%) | 490 (39.9%) |
| 3 Vehicles | 422 (24.5%) | 281 (22.9%) |
| 4 Vehicles | 25 (1.5%) | 117 (9.5%) |
| 5 or more Vehicles | 0 (0.0%) | 0 (0.0%) |
| Total | 1,724 (100.0%) | 1,229 (100.0%) |
Commute Time in Clyde
The most frequently occuring commute durations in Clyde are 5 to 9 minutes (727 commuters, 24.6%), 10 to 14 minutes (535 commuters, 18.1%), and 15 to 19 minutes (476 commuters, 16.1%).
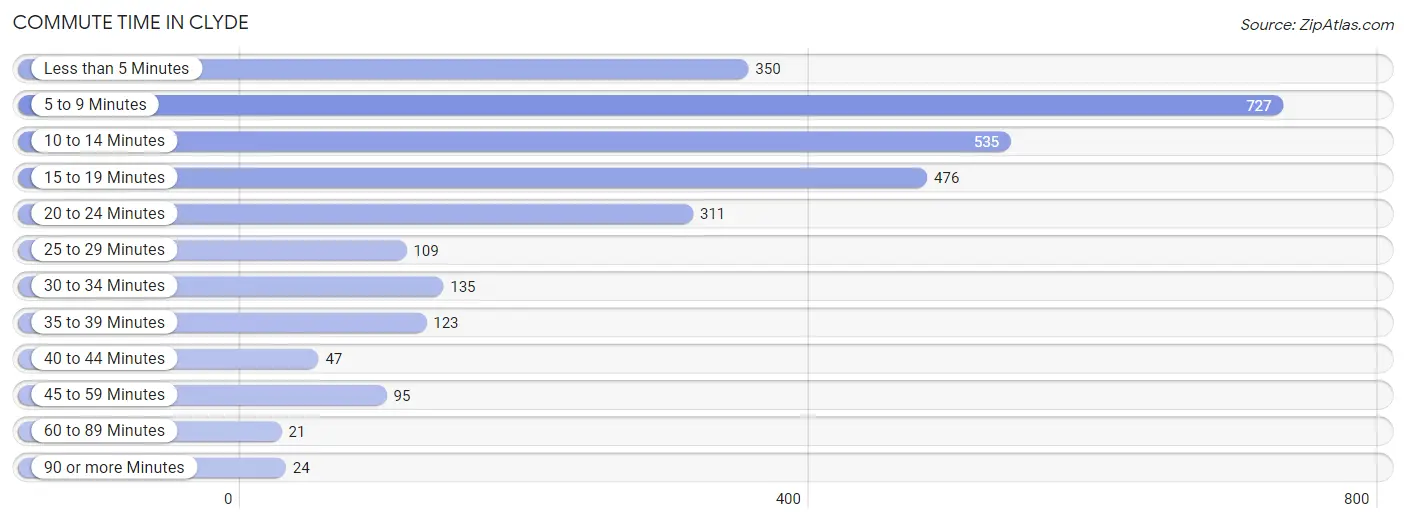
| Commute Time | # Commuters | % Commuters |
| Less than 5 Minutes | 350 | 11.8% |
| 5 to 9 Minutes | 727 | 24.6% |
| 10 to 14 Minutes | 535 | 18.1% |
| 15 to 19 Minutes | 476 | 16.1% |
| 20 to 24 Minutes | 311 | 10.5% |
| 25 to 29 Minutes | 109 | 3.7% |
| 30 to 34 Minutes | 135 | 4.6% |
| 35 to 39 Minutes | 123 | 4.2% |
| 40 to 44 Minutes | 47 | 1.6% |
| 45 to 59 Minutes | 95 | 3.2% |
| 60 to 89 Minutes | 21 | 0.7% |
| 90 or more Minutes | 24 | 0.8% |
Commute Time by Sex in Clyde
The most common commute times in Clyde are 10 to 14 minutes (442 commuters, 25.6%) for males and 5 to 9 minutes (419 commuters, 34.1%) for females.
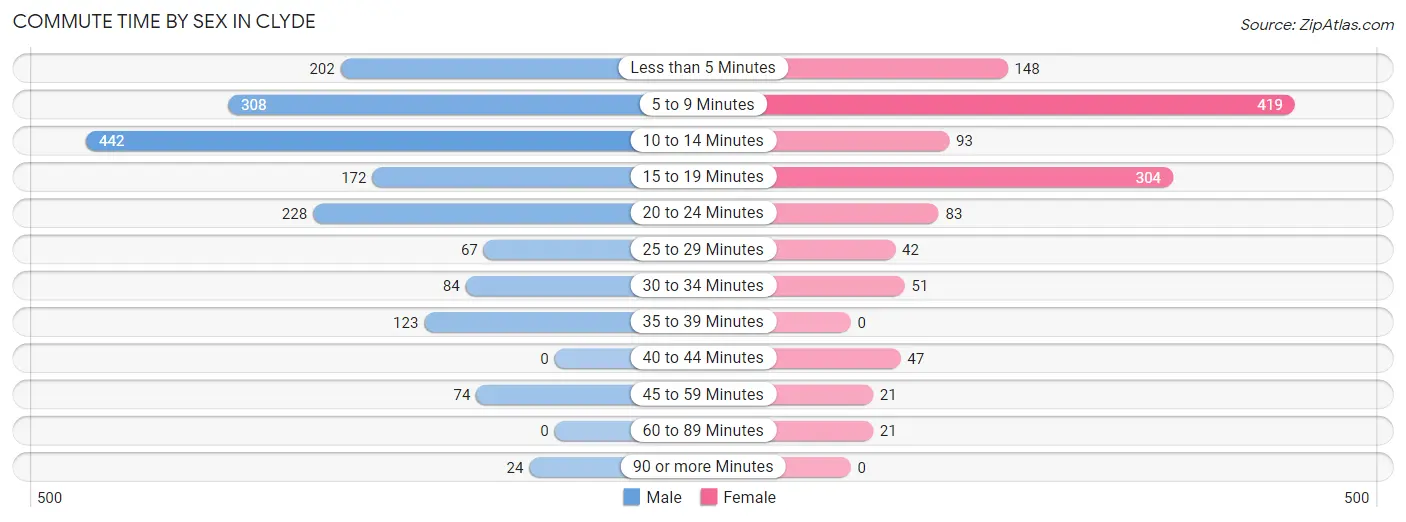
| Commute Time | Male | Female |
| Less than 5 Minutes | 202 (11.7%) | 148 (12.0%) |
| 5 to 9 Minutes | 308 (17.9%) | 419 (34.1%) |
| 10 to 14 Minutes | 442 (25.6%) | 93 (7.6%) |
| 15 to 19 Minutes | 172 (10.0%) | 304 (24.7%) |
| 20 to 24 Minutes | 228 (13.2%) | 83 (6.8%) |
| 25 to 29 Minutes | 67 (3.9%) | 42 (3.4%) |
| 30 to 34 Minutes | 84 (4.9%) | 51 (4.2%) |
| 35 to 39 Minutes | 123 (7.1%) | 0 (0.0%) |
| 40 to 44 Minutes | 0 (0.0%) | 47 (3.8%) |
| 45 to 59 Minutes | 74 (4.3%) | 21 (1.7%) |
| 60 to 89 Minutes | 0 (0.0%) | 21 (1.7%) |
| 90 or more Minutes | 24 (1.4%) | 0 (0.0%) |
Time of Departure to Work by Sex in Clyde
The most frequent times of departure to work in Clyde are 6:30 AM to 6:59 AM (388, 22.5%) for males and 4:00 PM to 11:59 PM (246, 20.0%) for females.
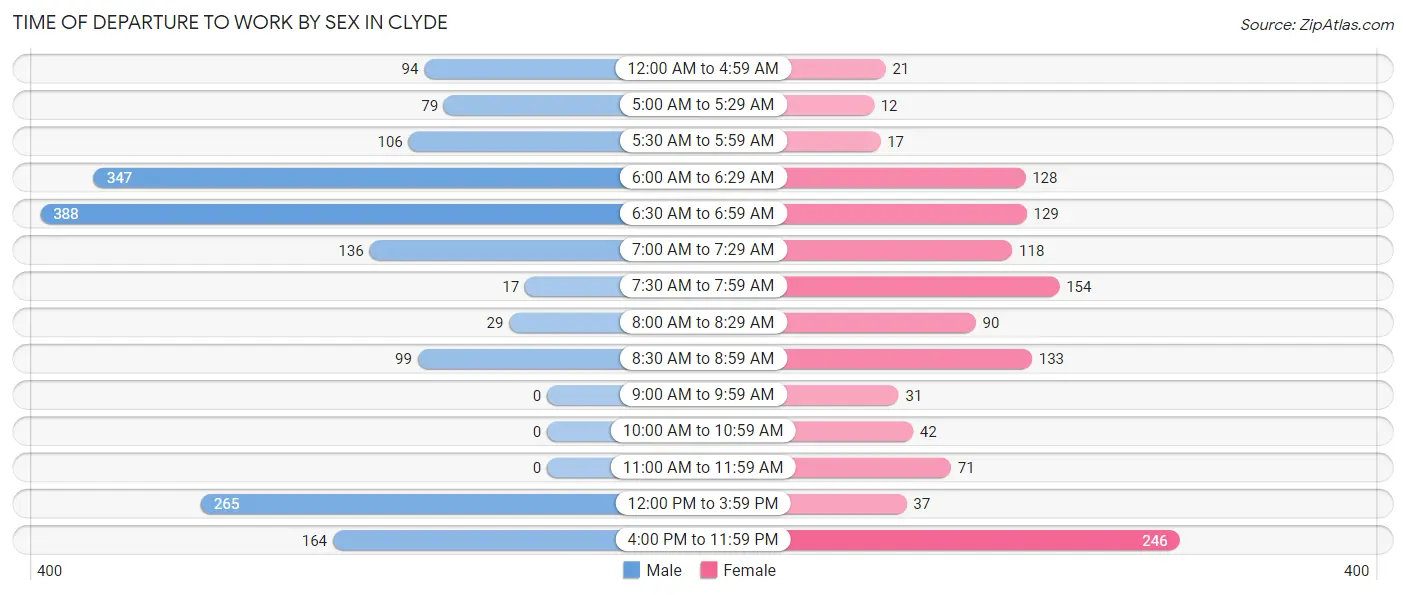
| Time of Departure | Male | Female |
| 12:00 AM to 4:59 AM | 94 (5.4%) | 21 (1.7%) |
| 5:00 AM to 5:29 AM | 79 (4.6%) | 12 (1.0%) |
| 5:30 AM to 5:59 AM | 106 (6.1%) | 17 (1.4%) |
| 6:00 AM to 6:29 AM | 347 (20.1%) | 128 (10.4%) |
| 6:30 AM to 6:59 AM | 388 (22.5%) | 129 (10.5%) |
| 7:00 AM to 7:29 AM | 136 (7.9%) | 118 (9.6%) |
| 7:30 AM to 7:59 AM | 17 (1.0%) | 154 (12.5%) |
| 8:00 AM to 8:29 AM | 29 (1.7%) | 90 (7.3%) |
| 8:30 AM to 8:59 AM | 99 (5.7%) | 133 (10.8%) |
| 9:00 AM to 9:59 AM | 0 (0.0%) | 31 (2.5%) |
| 10:00 AM to 10:59 AM | 0 (0.0%) | 42 (3.4%) |
| 11:00 AM to 11:59 AM | 0 (0.0%) | 71 (5.8%) |
| 12:00 PM to 3:59 PM | 265 (15.4%) | 37 (3.0%) |
| 4:00 PM to 11:59 PM | 164 (9.5%) | 246 (20.0%) |
| Total | 1,724 (100.0%) | 1,229 (100.0%) |
Housing Occupancy in Clyde
Occupancy by Ownership in Clyde
Of the total 2,678 dwellings in Clyde, owner-occupied units account for 1,878 (70.1%), while renter-occupied units make up 800 (29.9%).
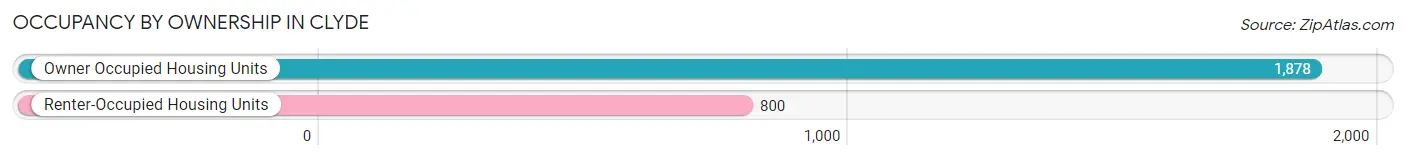
| Occupancy | # Housing Units | % Housing Units |
| Owner Occupied Housing Units | 1,878 | 70.1% |
| Renter-Occupied Housing Units | 800 | 29.9% |
| Total Occupied Housing Units | 2,678 | 100.0% |
Occupancy by Household Size in Clyde
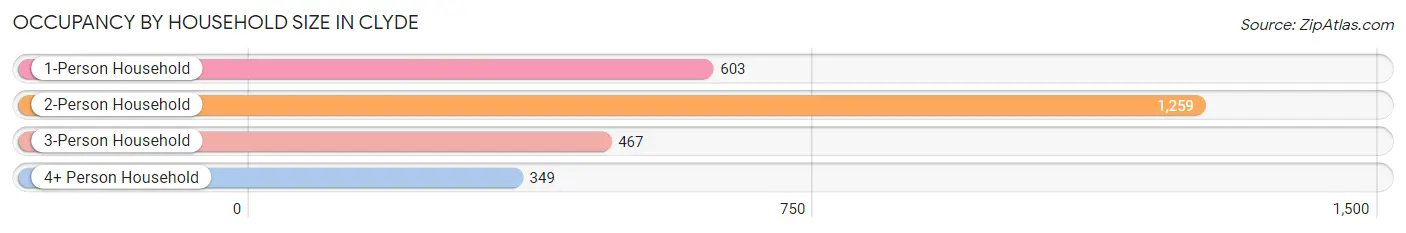
| Household Size | # Housing Units | % Housing Units |
| 1-Person Household | 603 | 22.5% |
| 2-Person Household | 1,259 | 47.0% |
| 3-Person Household | 467 | 17.4% |
| 4+ Person Household | 349 | 13.0% |
| Total Housing Units | 2,678 | 100.0% |
Occupancy by Ownership by Household Size in Clyde
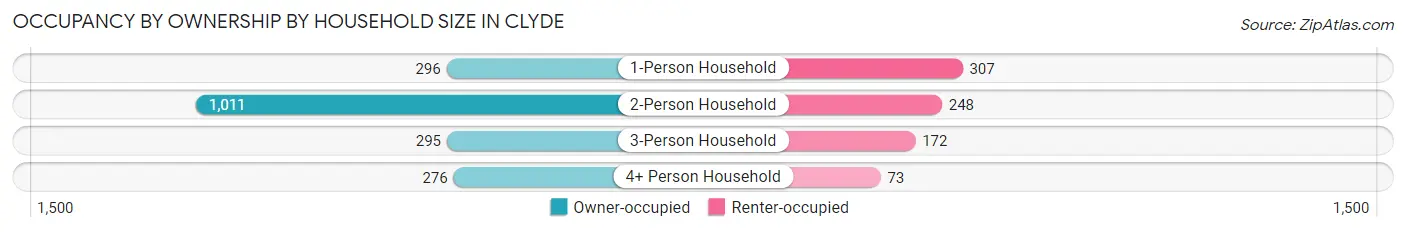
| Household Size | Owner-occupied | Renter-occupied |
| 1-Person Household | 296 (49.1%) | 307 (50.9%) |
| 2-Person Household | 1,011 (80.3%) | 248 (19.7%) |
| 3-Person Household | 295 (63.2%) | 172 (36.8%) |
| 4+ Person Household | 276 (79.1%) | 73 (20.9%) |
| Total Housing Units | 1,878 (70.1%) | 800 (29.9%) |
Occupancy by Educational Attainment in Clyde
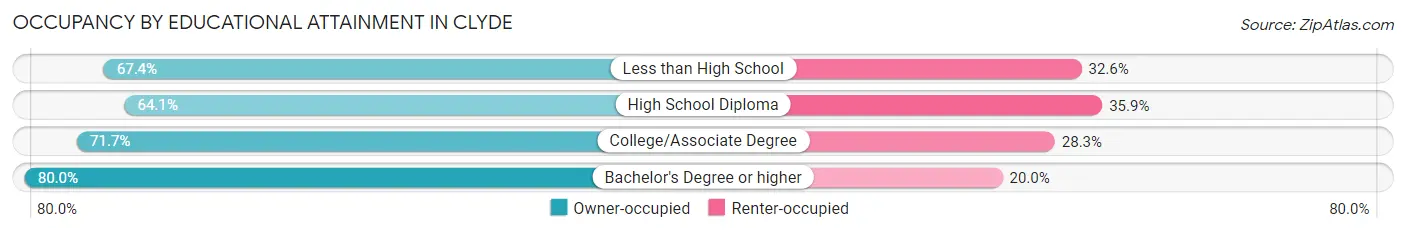
| Household Size | Owner-occupied | Renter-occupied |
| Less than High School | 120 (67.4%) | 58 (32.6%) |
| High School Diploma | 642 (64.1%) | 359 (35.9%) |
| College/Associate Degree | 713 (71.7%) | 282 (28.3%) |
| Bachelor's Degree or higher | 403 (80.0%) | 101 (20.0%) |
Occupancy by Age of Householder in Clyde
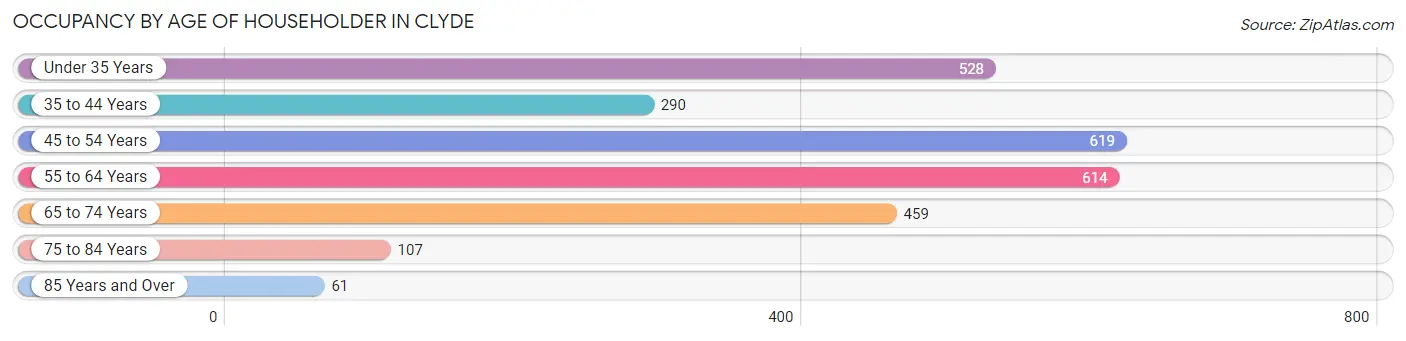
| Age Bracket | # Households | % Households |
| Under 35 Years | 528 | 19.7% |
| 35 to 44 Years | 290 | 10.8% |
| 45 to 54 Years | 619 | 23.1% |
| 55 to 64 Years | 614 | 22.9% |
| 65 to 74 Years | 459 | 17.1% |
| 75 to 84 Years | 107 | 4.0% |
| 85 Years and Over | 61 | 2.3% |
| Total | 2,678 | 100.0% |
Housing Finances in Clyde
Median Income by Occupancy in Clyde
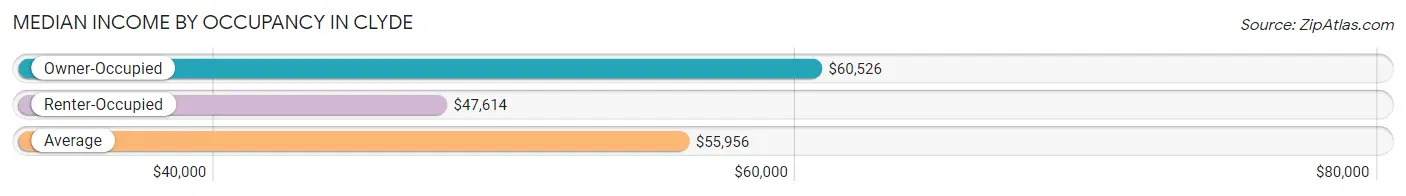
| Occupancy Type | # Households | Median Income |
| Owner-Occupied | 1,878 (70.1%) | $60,526 |
| Renter-Occupied | 800 (29.9%) | $47,614 |
| Average | 2,678 (100.0%) | $55,956 |
Occupancy by Householder Income Bracket in Clyde
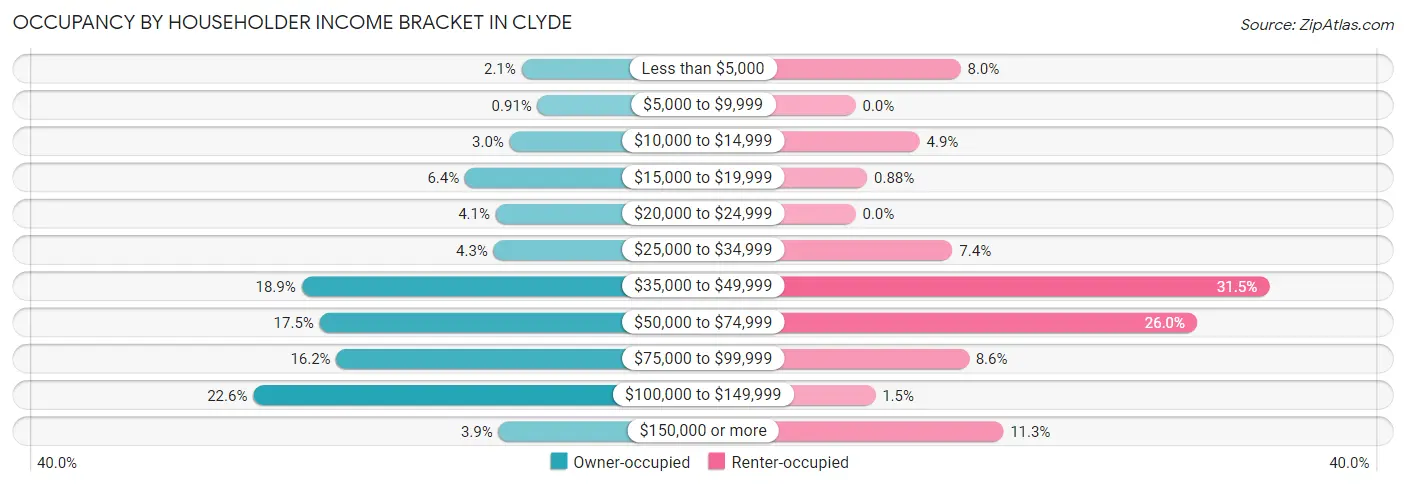
| Income Bracket | Owner-occupied | Renter-occupied |
| Less than $5,000 | 40 (2.1%) | 64 (8.0%) |
| $5,000 to $9,999 | 17 (0.9%) | 0 (0.0%) |
| $10,000 to $14,999 | 57 (3.0%) | 39 (4.9%) |
| $15,000 to $19,999 | 121 (6.4%) | 7 (0.9%) |
| $20,000 to $24,999 | 77 (4.1%) | 0 (0.0%) |
| $25,000 to $34,999 | 80 (4.3%) | 59 (7.4%) |
| $35,000 to $49,999 | 355 (18.9%) | 252 (31.5%) |
| $50,000 to $74,999 | 329 (17.5%) | 208 (26.0%) |
| $75,000 to $99,999 | 305 (16.2%) | 69 (8.6%) |
| $100,000 to $149,999 | 424 (22.6%) | 12 (1.5%) |
| $150,000 or more | 73 (3.9%) | 90 (11.3%) |
| Total | 1,878 (100.0%) | 800 (100.0%) |
Monthly Housing Cost Tiers in Clyde
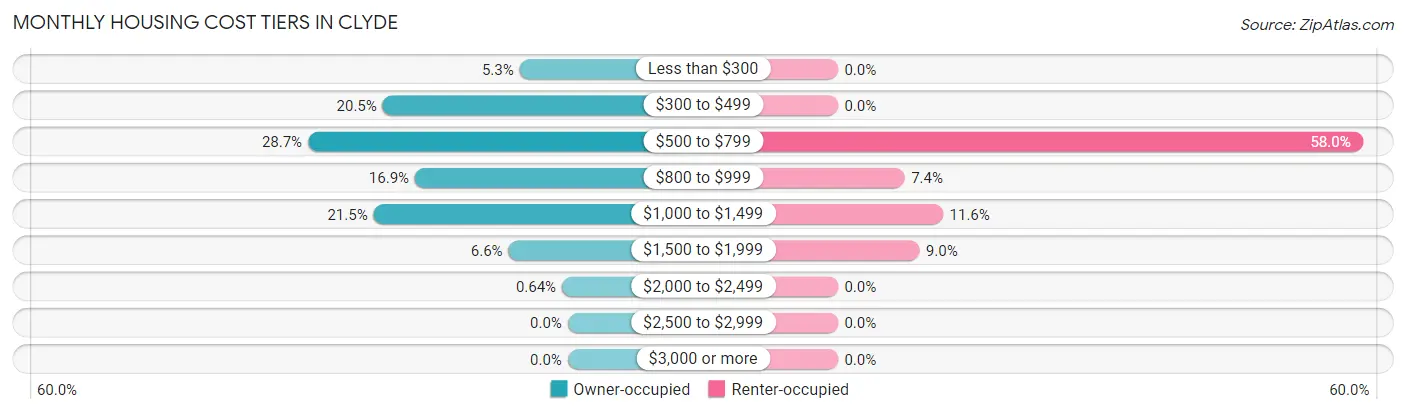
| Monthly Cost | Owner-occupied | Renter-occupied |
| Less than $300 | 100 (5.3%) | 0 (0.0%) |
| $300 to $499 | 384 (20.4%) | 0 (0.0%) |
| $500 to $799 | 539 (28.7%) | 464 (58.0%) |
| $800 to $999 | 317 (16.9%) | 59 (7.4%) |
| $1,000 to $1,499 | 403 (21.5%) | 93 (11.6%) |
| $1,500 to $1,999 | 123 (6.6%) | 72 (9.0%) |
| $2,000 to $2,499 | 12 (0.6%) | 0 (0.0%) |
| $2,500 to $2,999 | 0 (0.0%) | 0 (0.0%) |
| $3,000 or more | 0 (0.0%) | 0 (0.0%) |
| Total | 1,878 (100.0%) | 800 (100.0%) |
Physical Housing Characteristics in Clyde
Housing Structures in Clyde
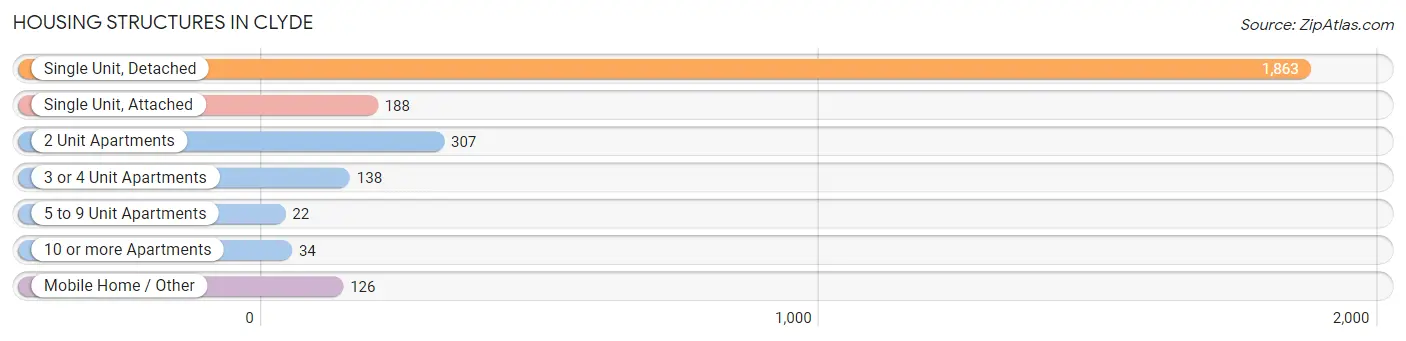
| Structure Type | # Housing Units | % Housing Units |
| Single Unit, Detached | 1,863 | 69.6% |
| Single Unit, Attached | 188 | 7.0% |
| 2 Unit Apartments | 307 | 11.5% |
| 3 or 4 Unit Apartments | 138 | 5.1% |
| 5 to 9 Unit Apartments | 22 | 0.8% |
| 10 or more Apartments | 34 | 1.3% |
| Mobile Home / Other | 126 | 4.7% |
| Total | 2,678 | 100.0% |
Housing Structures by Occupancy in Clyde
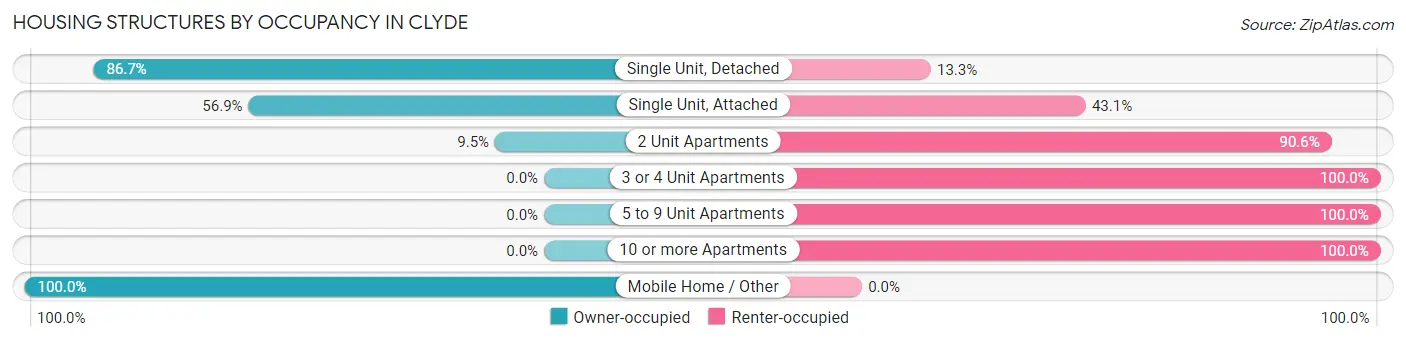
| Structure Type | Owner-occupied | Renter-occupied |
| Single Unit, Detached | 1,616 (86.7%) | 247 (13.3%) |
| Single Unit, Attached | 107 (56.9%) | 81 (43.1%) |
| 2 Unit Apartments | 29 (9.5%) | 278 (90.5%) |
| 3 or 4 Unit Apartments | 0 (0.0%) | 138 (100.0%) |
| 5 to 9 Unit Apartments | 0 (0.0%) | 22 (100.0%) |
| 10 or more Apartments | 0 (0.0%) | 34 (100.0%) |
| Mobile Home / Other | 126 (100.0%) | 0 (0.0%) |
| Total | 1,878 (70.1%) | 800 (29.9%) |
Housing Structures by Number of Rooms in Clyde
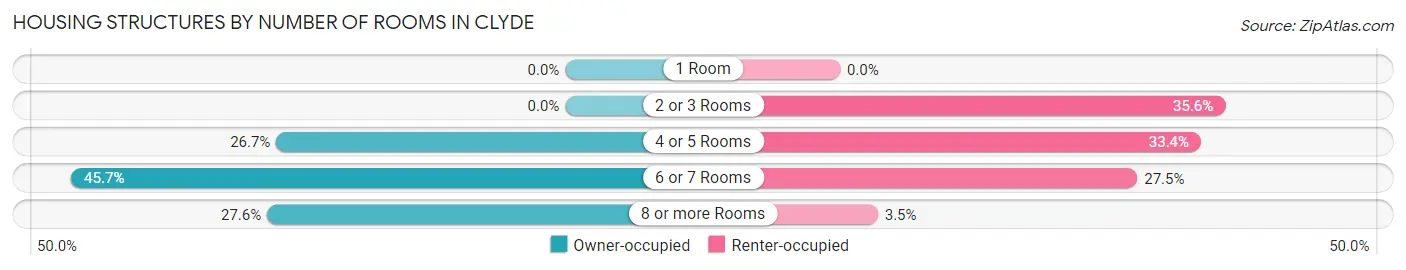
| Number of Rooms | Owner-occupied | Renter-occupied |
| 1 Room | 0 (0.0%) | 0 (0.0%) |
| 2 or 3 Rooms | 0 (0.0%) | 285 (35.6%) |
| 4 or 5 Rooms | 502 (26.7%) | 267 (33.4%) |
| 6 or 7 Rooms | 858 (45.7%) | 220 (27.5%) |
| 8 or more Rooms | 518 (27.6%) | 28 (3.5%) |
| Total | 1,878 (100.0%) | 800 (100.0%) |
Housing Structure by Heating Type in Clyde
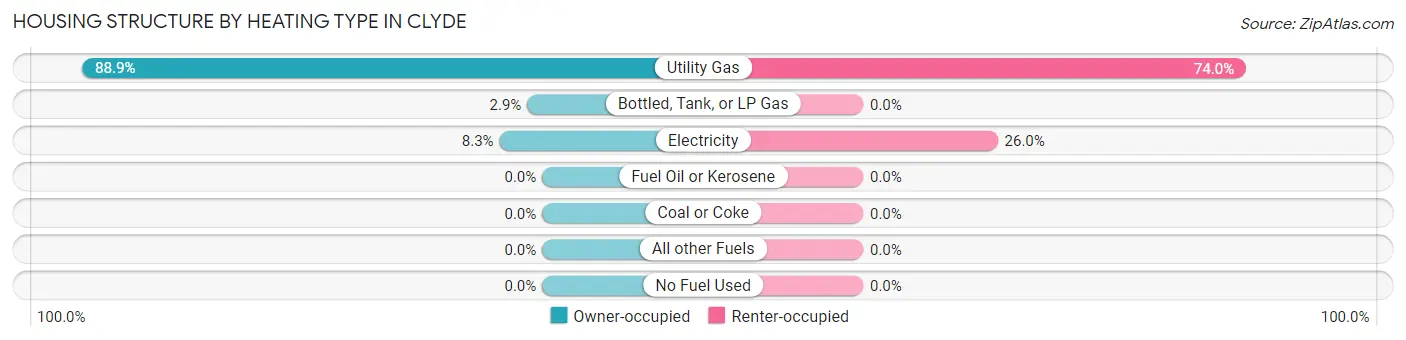
| Heating Type | Owner-occupied | Renter-occupied |
| Utility Gas | 1,669 (88.9%) | 592 (74.0%) |
| Bottled, Tank, or LP Gas | 54 (2.9%) | 0 (0.0%) |
| Electricity | 155 (8.3%) | 208 (26.0%) |
| Fuel Oil or Kerosene | 0 (0.0%) | 0 (0.0%) |
| Coal or Coke | 0 (0.0%) | 0 (0.0%) |
| All other Fuels | 0 (0.0%) | 0 (0.0%) |
| No Fuel Used | 0 (0.0%) | 0 (0.0%) |
| Total | 1,878 (100.0%) | 800 (100.0%) |
Household Vehicle Usage in Clyde
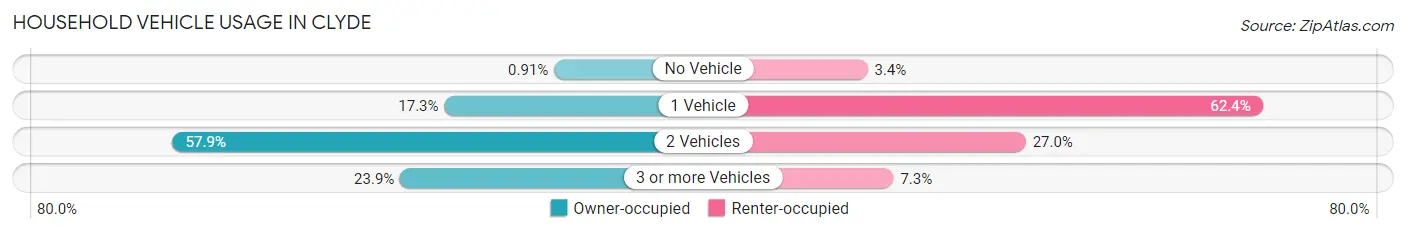
| Vehicles per Household | Owner-occupied | Renter-occupied |
| No Vehicle | 17 (0.9%) | 27 (3.4%) |
| 1 Vehicle | 325 (17.3%) | 499 (62.4%) |
| 2 Vehicles | 1,087 (57.9%) | 216 (27.0%) |
| 3 or more Vehicles | 449 (23.9%) | 58 (7.2%) |
| Total | 1,878 (100.0%) | 800 (100.0%) |
Real Estate & Mortgages in Clyde
Real Estate and Mortgage Overview in Clyde
| Characteristic | Without Mortgage | With Mortgage |
| Housing Units | 900 | 978 |
| Median Property Value | $96,400 | $137,100 |
| Median Household Income | $47,853 | $42 |
| Monthly Housing Costs | $477 | $0 |
| Real Estate Taxes | $1,361 | $0 |
Property Value by Mortgage Status in Clyde
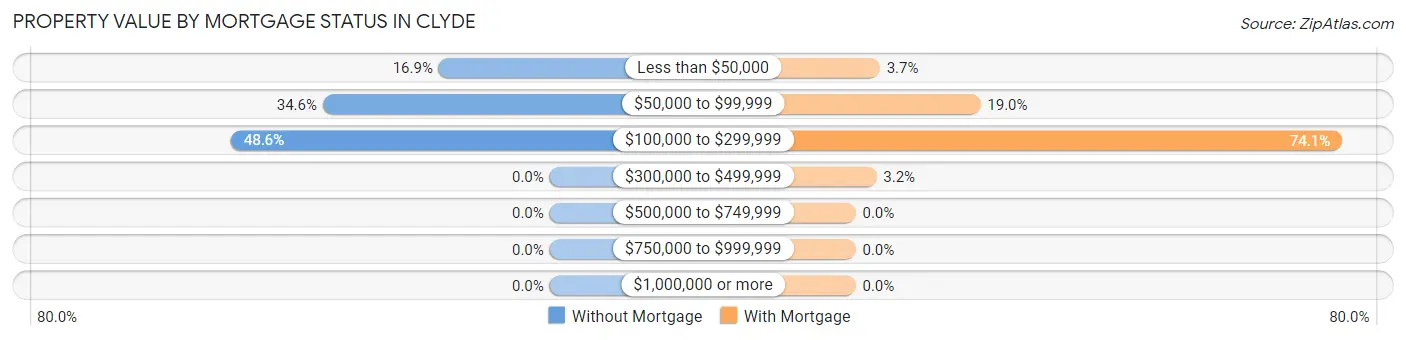
| Property Value | Without Mortgage | With Mortgage |
| Less than $50,000 | 152 (16.9%) | 36 (3.7%) |
| $50,000 to $99,999 | 311 (34.6%) | 186 (19.0%) |
| $100,000 to $299,999 | 437 (48.6%) | 725 (74.1%) |
| $300,000 to $499,999 | 0 (0.0%) | 31 (3.2%) |
| $500,000 to $749,999 | 0 (0.0%) | 0 (0.0%) |
| $750,000 to $999,999 | 0 (0.0%) | 0 (0.0%) |
| $1,000,000 or more | 0 (0.0%) | 0 (0.0%) |
| Total | 900 (100.0%) | 978 (100.0%) |
Household Income by Mortgage Status in Clyde
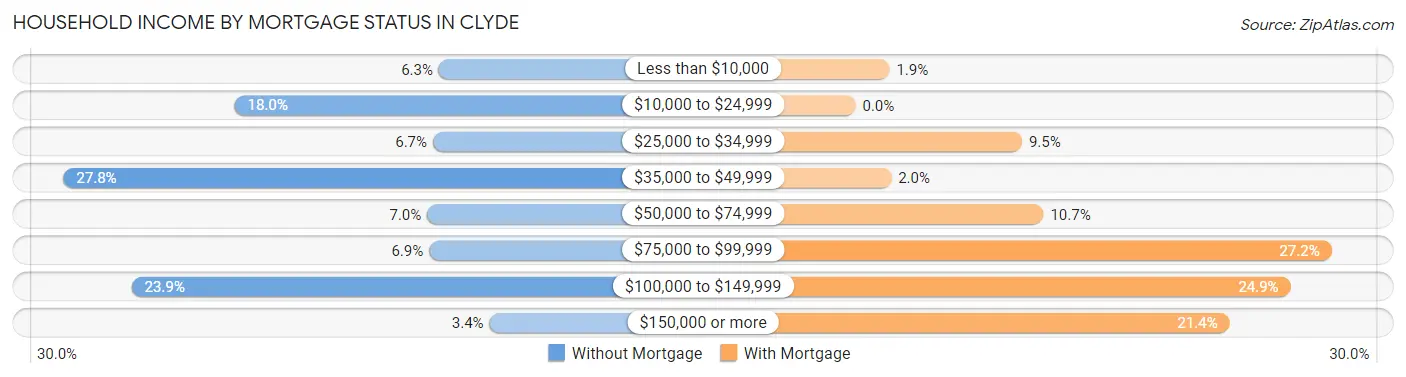
| Household Income | Without Mortgage | With Mortgage |
| Less than $10,000 | 57 (6.3%) | 19 (1.9%) |
| $10,000 to $24,999 | 162 (18.0%) | 0 (0.0%) |
| $25,000 to $34,999 | 60 (6.7%) | 93 (9.5%) |
| $35,000 to $49,999 | 250 (27.8%) | 20 (2.0%) |
| $50,000 to $74,999 | 63 (7.0%) | 105 (10.7%) |
| $75,000 to $99,999 | 62 (6.9%) | 266 (27.2%) |
| $100,000 to $149,999 | 215 (23.9%) | 243 (24.8%) |
| $150,000 or more | 31 (3.4%) | 209 (21.4%) |
| Total | 900 (100.0%) | 978 (100.0%) |
Property Value to Household Income Ratio in Clyde
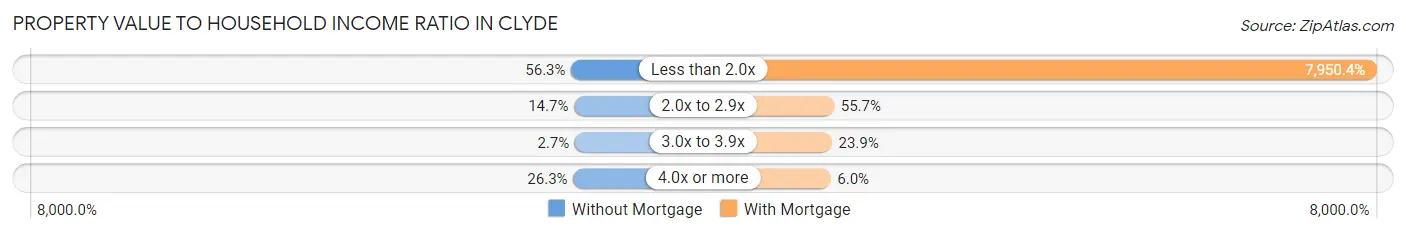
| Value-to-Income Ratio | Without Mortgage | With Mortgage |
| Less than 2.0x | 507 (56.3%) | 77,755 (7,950.4%) |
| 2.0x to 2.9x | 132 (14.7%) | 545 (55.7%) |
| 3.0x to 3.9x | 24 (2.7%) | 234 (23.9%) |
| 4.0x or more | 237 (26.3%) | 59 (6.0%) |
| Total | 900 (100.0%) | 978 (100.0%) |
Real Estate Taxes by Mortgage Status in Clyde
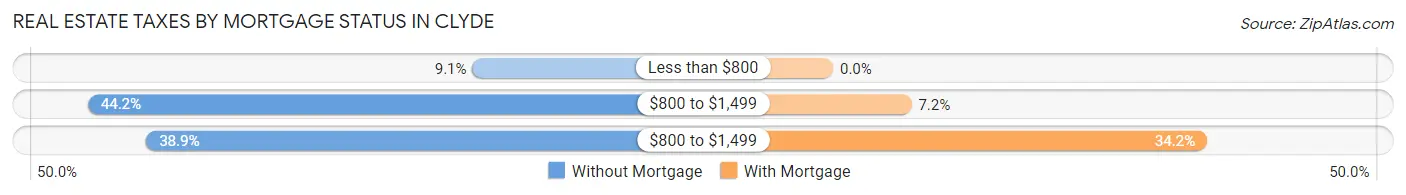
| Property Taxes | Without Mortgage | With Mortgage |
| Less than $800 | 82 (9.1%) | 0 (0.0%) |
| $800 to $1,499 | 398 (44.2%) | 70 (7.2%) |
| $800 to $1,499 | 350 (38.9%) | 334 (34.2%) |
| Total | 900 (100.0%) | 978 (100.0%) |
Health & Disability in Clyde
Health Insurance Coverage by Age in Clyde
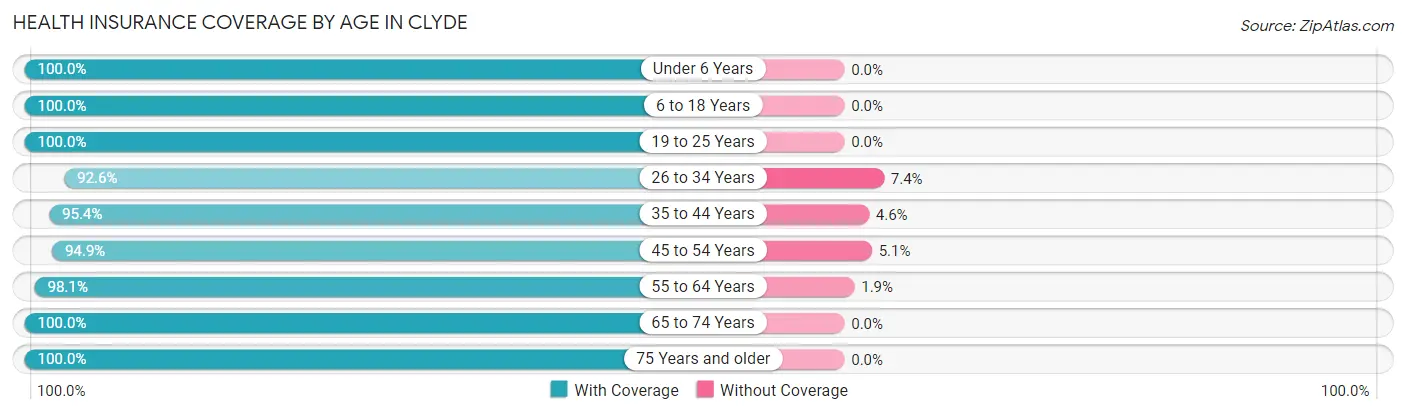
| Age Bracket | With Coverage | Without Coverage |
| Under 6 Years | 170 (100.0%) | 0 (0.0%) |
| 6 to 18 Years | 910 (100.0%) | 0 (0.0%) |
| 19 to 25 Years | 399 (100.0%) | 0 (0.0%) |
| 26 to 34 Years | 791 (92.6%) | 63 (7.4%) |
| 35 to 44 Years | 562 (95.4%) | 27 (4.6%) |
| 45 to 54 Years | 854 (94.9%) | 46 (5.1%) |
| 55 to 64 Years | 1,110 (98.1%) | 21 (1.9%) |
| 65 to 74 Years | 888 (100.0%) | 0 (0.0%) |
| 75 Years and older | 377 (100.0%) | 0 (0.0%) |
| Total | 6,061 (97.5%) | 157 (2.5%) |
Health Insurance Coverage by Citizenship Status in Clyde
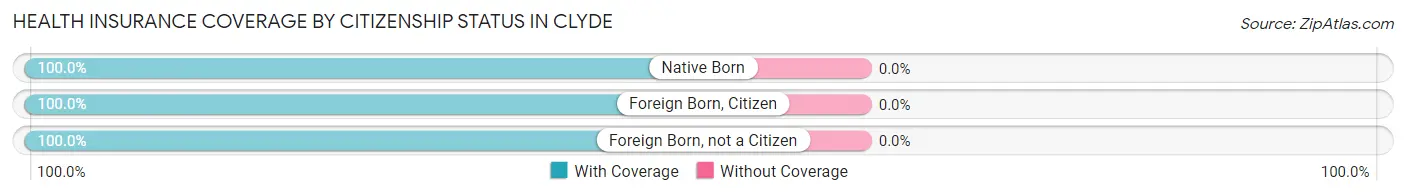
| Citizenship Status | With Coverage | Without Coverage |
| Native Born | 170 (100.0%) | 0 (0.0%) |
| Foreign Born, Citizen | 910 (100.0%) | 0 (0.0%) |
| Foreign Born, not a Citizen | 399 (100.0%) | 0 (0.0%) |
Health Insurance Coverage by Household Income in Clyde
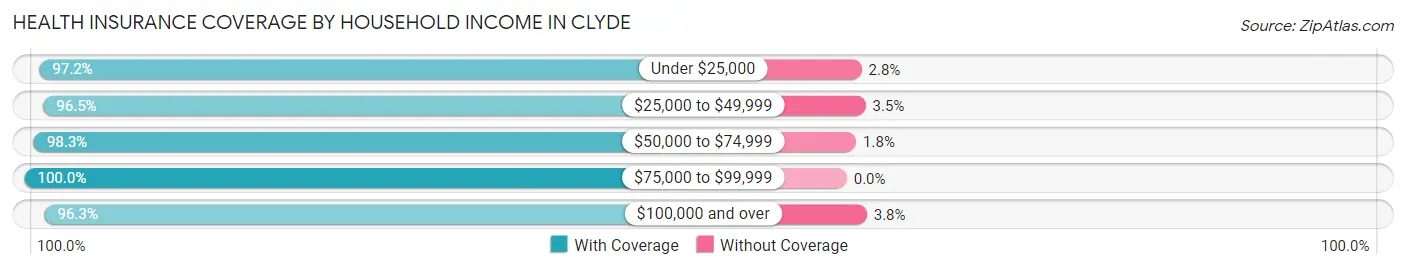
| Household Income | With Coverage | Without Coverage |
| Under $25,000 | 629 (97.2%) | 18 (2.8%) |
| $25,000 to $49,999 | 1,505 (96.5%) | 55 (3.5%) |
| $50,000 to $74,999 | 1,176 (98.3%) | 21 (1.8%) |
| $75,000 to $99,999 | 1,083 (100.0%) | 0 (0.0%) |
| $100,000 and over | 1,619 (96.3%) | 63 (3.7%) |
Public vs Private Health Insurance Coverage by Age in Clyde
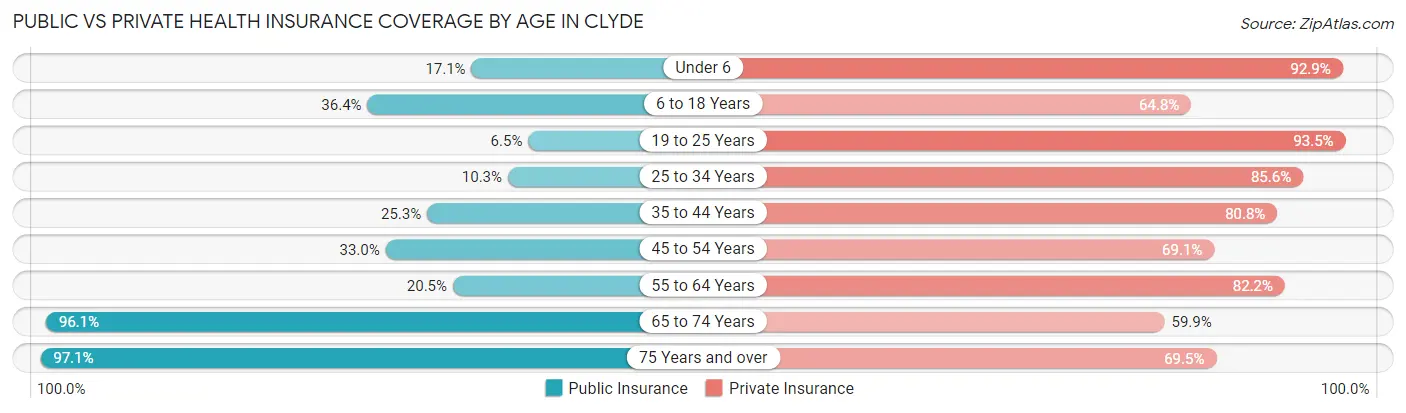
| Age Bracket | Public Insurance | Private Insurance |
| Under 6 | 29 (17.1%) | 158 (92.9%) |
| 6 to 18 Years | 331 (36.4%) | 590 (64.8%) |
| 19 to 25 Years | 26 (6.5%) | 373 (93.5%) |
| 25 to 34 Years | 88 (10.3%) | 731 (85.6%) |
| 35 to 44 Years | 149 (25.3%) | 476 (80.8%) |
| 45 to 54 Years | 297 (33.0%) | 622 (69.1%) |
| 55 to 64 Years | 232 (20.5%) | 930 (82.2%) |
| 65 to 74 Years | 853 (96.1%) | 532 (59.9%) |
| 75 Years and over | 366 (97.1%) | 262 (69.5%) |
| Total | 2,371 (38.1%) | 4,674 (75.2%) |
Disability Status by Sex by Age in Clyde
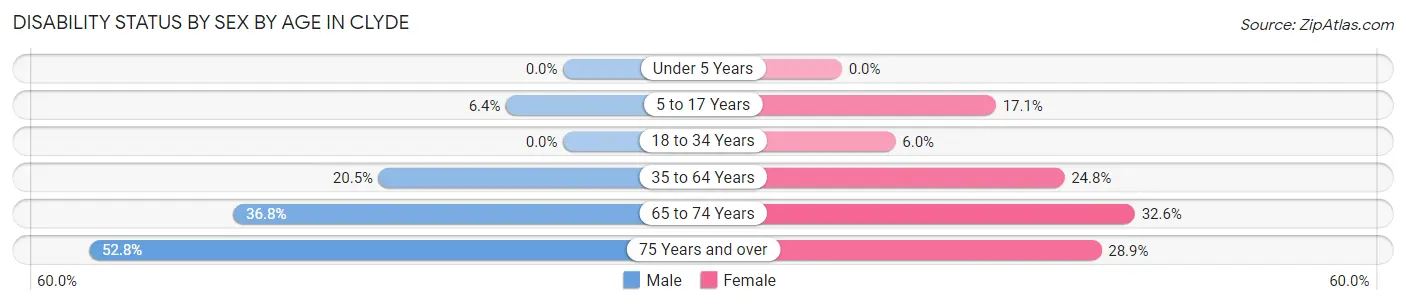
| Age Bracket | Male | Female |
| Under 5 Years | 0 (0.0%) | 0 (0.0%) |
| 5 to 17 Years | 32 (6.4%) | 67 (17.1%) |
| 18 to 34 Years | 0 (0.0%) | 28 (6.0%) |
| 35 to 64 Years | 272 (20.5%) | 321 (24.8%) |
| 65 to 74 Years | 171 (36.8%) | 138 (32.6%) |
| 75 Years and over | 84 (52.8%) | 63 (28.9%) |
Disability Class by Sex by Age in Clyde
Disability Class: Hearing Difficulty
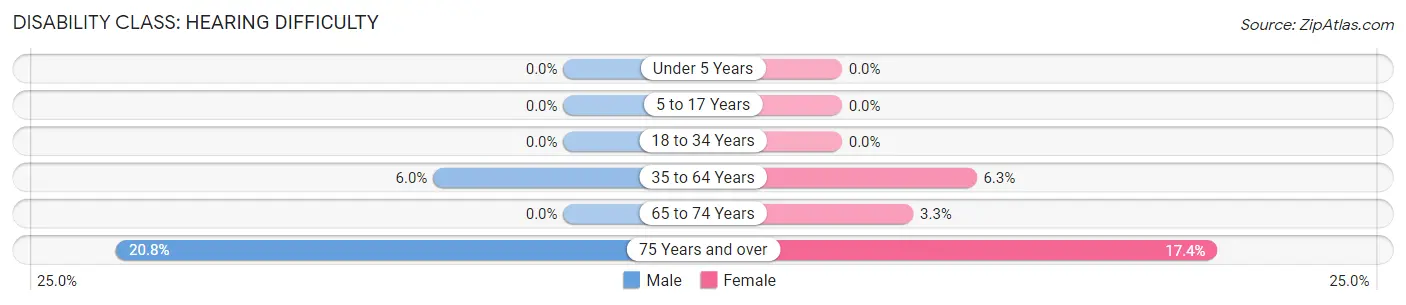
| Age Bracket | Male | Female |
| Under 5 Years | 0 (0.0%) | 0 (0.0%) |
| 5 to 17 Years | 0 (0.0%) | 0 (0.0%) |
| 18 to 34 Years | 0 (0.0%) | 0 (0.0%) |
| 35 to 64 Years | 80 (6.0%) | 81 (6.2%) |
| 65 to 74 Years | 0 (0.0%) | 14 (3.3%) |
| 75 Years and over | 33 (20.7%) | 38 (17.4%) |
Disability Class: Vision Difficulty
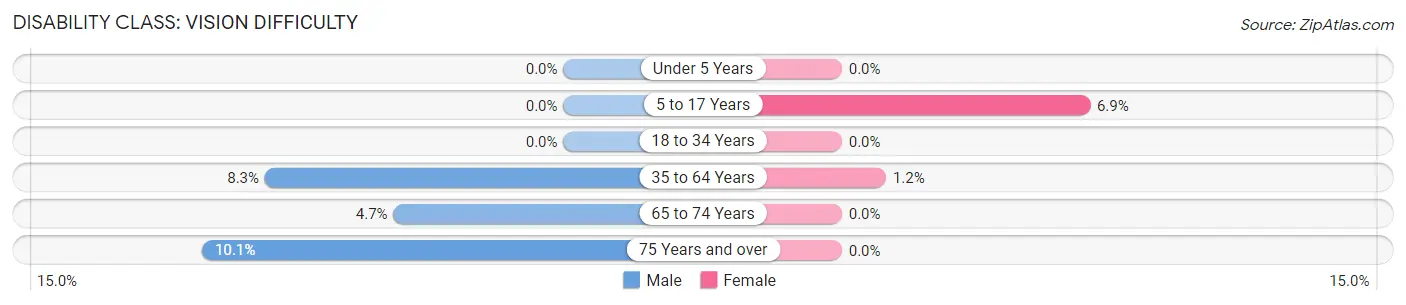
| Age Bracket | Male | Female |
| Under 5 Years | 0 (0.0%) | 0 (0.0%) |
| 5 to 17 Years | 0 (0.0%) | 27 (6.9%) |
| 18 to 34 Years | 0 (0.0%) | 0 (0.0%) |
| 35 to 64 Years | 110 (8.3%) | 16 (1.2%) |
| 65 to 74 Years | 22 (4.7%) | 0 (0.0%) |
| 75 Years and over | 16 (10.1%) | 0 (0.0%) |
Disability Class: Cognitive Difficulty
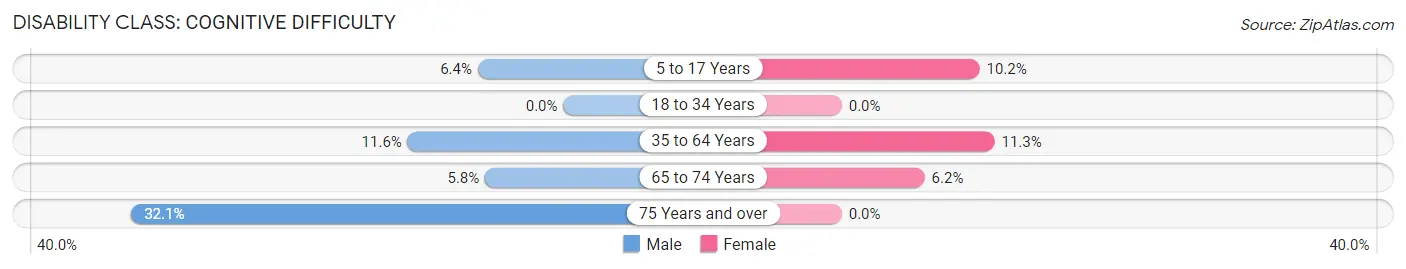
| Age Bracket | Male | Female |
| 5 to 17 Years | 32 (6.4%) | 40 (10.2%) |
| 18 to 34 Years | 0 (0.0%) | 0 (0.0%) |
| 35 to 64 Years | 153 (11.6%) | 147 (11.3%) |
| 65 to 74 Years | 27 (5.8%) | 26 (6.1%) |
| 75 Years and over | 51 (32.1%) | 0 (0.0%) |
Disability Class: Ambulatory Difficulty
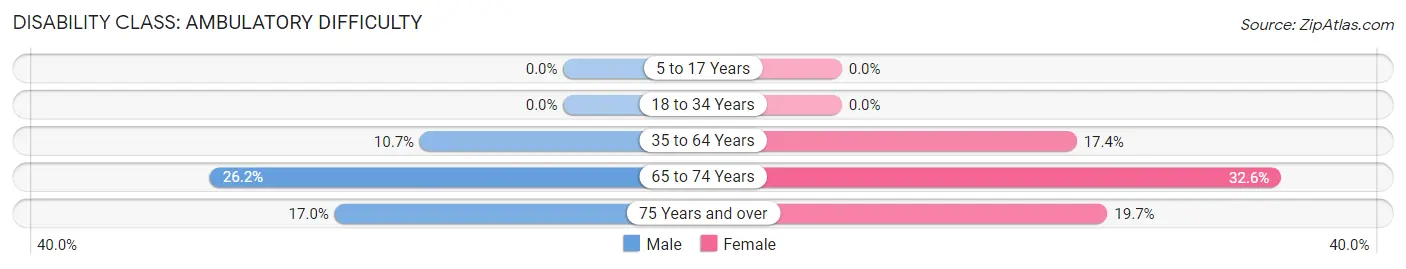
| Age Bracket | Male | Female |
| 5 to 17 Years | 0 (0.0%) | 0 (0.0%) |
| 18 to 34 Years | 0 (0.0%) | 0 (0.0%) |
| 35 to 64 Years | 141 (10.6%) | 226 (17.4%) |
| 65 to 74 Years | 122 (26.2%) | 138 (32.6%) |
| 75 Years and over | 27 (17.0%) | 43 (19.7%) |
Disability Class: Self-Care Difficulty
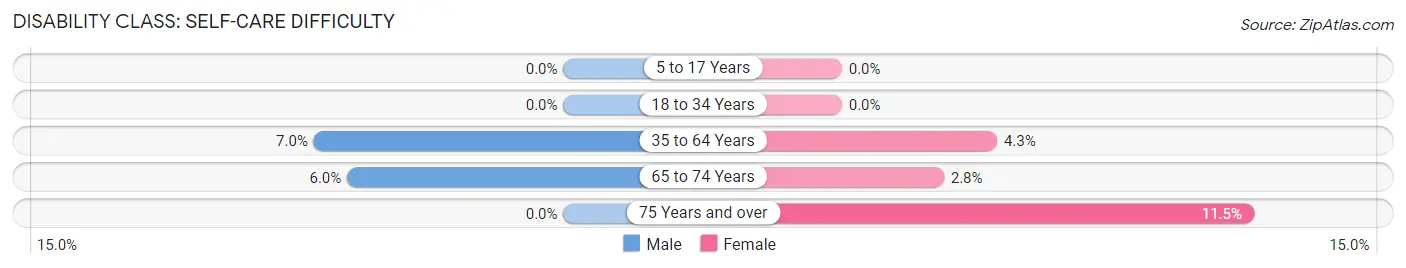
| Age Bracket | Male | Female |
| 5 to 17 Years | 0 (0.0%) | 0 (0.0%) |
| 18 to 34 Years | 0 (0.0%) | 0 (0.0%) |
| 35 to 64 Years | 92 (7.0%) | 56 (4.3%) |
| 65 to 74 Years | 28 (6.0%) | 12 (2.8%) |
| 75 Years and over | 0 (0.0%) | 25 (11.5%) |
Technology Access in Clyde
Computing Device Access in Clyde
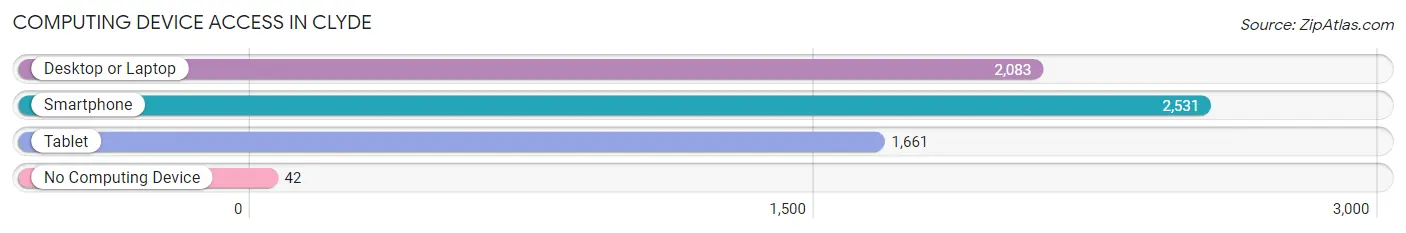
| Device Type | # Households | % Households |
| Desktop or Laptop | 2,083 | 77.8% |
| Smartphone | 2,531 | 94.5% |
| Tablet | 1,661 | 62.0% |
| No Computing Device | 42 | 1.6% |
| Total | 2,678 | 100.0% |
Internet Access in Clyde
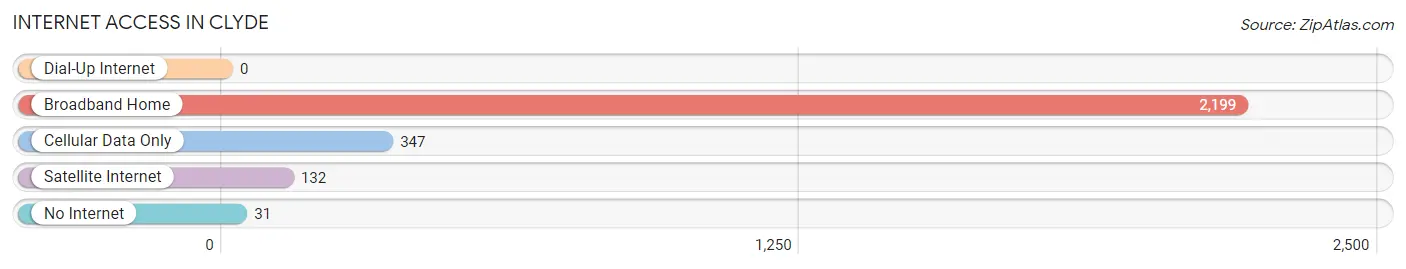
| Internet Type | # Households | % Households |
| Dial-Up Internet | 0 | 0.0% |
| Broadband Home | 2,199 | 82.1% |
| Cellular Data Only | 347 | 13.0% |
| Satellite Internet | 132 | 4.9% |
| No Internet | 31 | 1.2% |
| Total | 2,678 | 100.0% |
Clyde Summary
Clyde is a small city located in Sandusky County, Ohio. It is situated on the banks of the Sandusky River, approximately 30 miles southeast of Toledo. The city has a population of 5,719 people, according to the 2010 census.
History
Clyde was founded in 1832 by a group of settlers from New York. The city was named after the Scottish poet Robert Burns’ poem “Clyde’s Water”. The first settlers were primarily farmers and the city quickly grew to become a thriving agricultural center. In 1854, the first railroad line was built through Clyde, connecting it to Toledo and other cities in the region. This allowed for the growth of industry in the area, including the manufacture of furniture, stoves, and other products.
In the late 19th century, Clyde became a popular tourist destination due to its proximity to Lake Erie. The city was home to several resorts and hotels, as well as a popular amusement park. The city also became known for its mineral springs, which were believed to have healing properties.
Geography
Clyde is located in Sandusky County, Ohio, approximately 30 miles southeast of Toledo. The city is situated on the banks of the Sandusky River, which flows through the city and into Lake Erie. The city is surrounded by farmland and is located in the Great Black Swamp region of Ohio.
The city has a total area of 4.2 square miles, all of which is land. The city has a humid continental climate, with hot summers and cold winters. The average temperature in Clyde is around 50 degrees Fahrenheit.
Economy
Clyde’s economy is primarily based on agriculture and manufacturing. The city is home to several large agricultural companies, including the Clyde Seed Company and the Clyde Dairy Company. The city is also home to several manufacturing companies, including the Clyde Furniture Company and the Clyde Stove Company.
The city is also home to several retail stores, restaurants, and other businesses. The city is served by the Sandusky County Airport, which provides air service to the region.
Demographics
According to the 2010 census, Clyde has a population of 5,719 people. The city has a median household income of $41,945 and a median family income of $50,945. The city has a poverty rate of 16.3%, which is higher than the national average.
The city is predominantly white, with a population that is 94.3% white. The city also has a small African American population, which makes up 2.3% of the population. The city also has a small Hispanic population, which makes up 1.3% of the population.
Conclusion
Clyde is a small city located in Sandusky County, Ohio. It is situated on the banks of the Sandusky River, approximately 30 miles southeast of Toledo. The city has a population of 5,719 people, according to the 2010 census. The city’s economy is primarily based on agriculture and manufacturing, and the city is home to several large agricultural companies and manufacturing companies. The city is predominantly white, with a population that is 94.3% white. The city also has a small African American population, which makes up 2.3% of the population, and a small Hispanic population, which makes up 1.3% of the population.
Common Questions
What is Per Capita Income in Clyde?
Per Capita income in Clyde is $29,921.
What is the Median Family Income in Clyde?
Median Family Income in Clyde is $72,188.
What is the Median Household income in Clyde?
Median Household Income in Clyde is $55,956.
What is Income or Wage Gap in Clyde?
Income or Wage Gap in Clyde is 46.0%.
Women in Clyde earn 54.0 cents for every dollar earned by a man.
What is Inequality or Gini Index in Clyde?
Inequality or Gini Index in Clyde is 0.36.
What is the Total Population of Clyde?
Total Population of Clyde is 6,314.
What is the Total Male Population of Clyde?
Total Male Population of Clyde is 3,384.
What is the Total Female Population of Clyde?
Total Female Population of Clyde is 2,930.
What is the Ratio of Males per 100 Females in Clyde?
There are 115.49 Males per 100 Females in Clyde.
What is the Ratio of Females per 100 Males in Clyde?
There are 86.58 Females per 100 Males in Clyde.
What is the Median Population Age in Clyde?
Median Population Age in Clyde is 49.0 Years.
What is the Average Family Size in Clyde
Average Family Size in Clyde is 2.6 People.
What is the Average Household Size in Clyde
Average Household Size in Clyde is 2.3 People.
How Large is the Labor Force in Clyde?
There are 3,345 People in the Labor Forcein in Clyde.
What is the Percentage of People in the Labor Force in Clyde?
62.6% of People are in the Labor Force in Clyde.
What is the Unemployment Rate in Clyde?
Unemployment Rate in Clyde is 7.1%.