Cleves, OH Map & Demographics
Cleves Map
Cleves Overview
$31,769
PER CAPITA INCOME
$90,743
AVG FAMILY INCOME
$85,109
AVG HOUSEHOLD INCOME
16.1%
WAGE / INCOME GAP [ % ]
83.9¢/ $1
WAGE / INCOME GAP [ $ ]
0.38
INEQUALITY / GINI INDEX
3,395
TOTAL POPULATION
1,891
MALE POPULATION
1,504
FEMALE POPULATION
125.73
MALES / 100 FEMALES
79.53
FEMALES / 100 MALES
30.5
MEDIAN AGE
3.5
AVG FAMILY SIZE
3.1
AVG HOUSEHOLD SIZE
1,718
LABOR FORCE [ PEOPLE ]
71.2%
PERCENT IN LABOR FORCE
5.6%
UNEMPLOYMENT RATE
Cleves Zip Codes
Cleves Area Codes
Income in Cleves
Income Overview in Cleves
Per Capita Income in Cleves is $31,769, while median incomes of families and households are $90,743 and $85,109 respectively.
| Characteristic | Number | Measure |
| Per Capita Income | 3,395 | $31,769 |
| Median Family Income | 864 | $90,743 |
| Mean Family Income | 864 | $104,762 |
| Median Household Income | 1,108 | $85,109 |
| Mean Household Income | 1,108 | $98,174 |
| Income Deficit | 864 | $0 |
| Wage / Income Gap (%) | 3,395 | 16.05% |
| Wage / Income Gap ($) | 3,395 | 83.95¢ per $1 |
| Gini / Inequality Index | 3,395 | 0.38 |
Earnings by Sex in Cleves
Average Earnings in Cleves are $42,380, $48,199 for men and $40,463 for women, a difference of 16.1%.
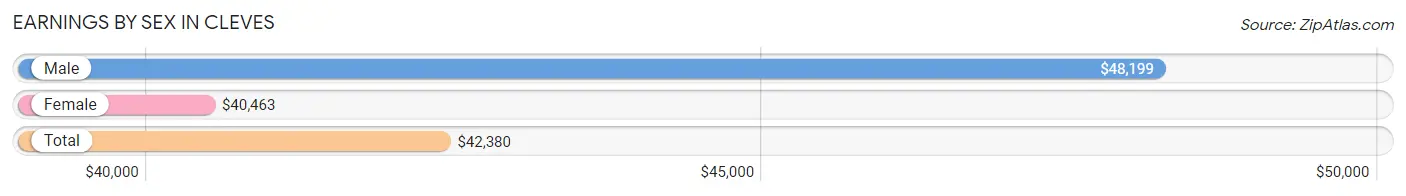
| Sex | Number | Average Earnings |
| Male | 1,051 (58.7%) | $48,199 |
| Female | 739 (41.3%) | $40,463 |
| Total | 1,790 (100.0%) | $42,380 |
Earnings by Sex by Income Bracket in Cleves
The most common earnings brackets in Cleves are $100,000+ for men (170 | 16.2%) and $40,000 to $44,999 for women (98 | 13.3%).
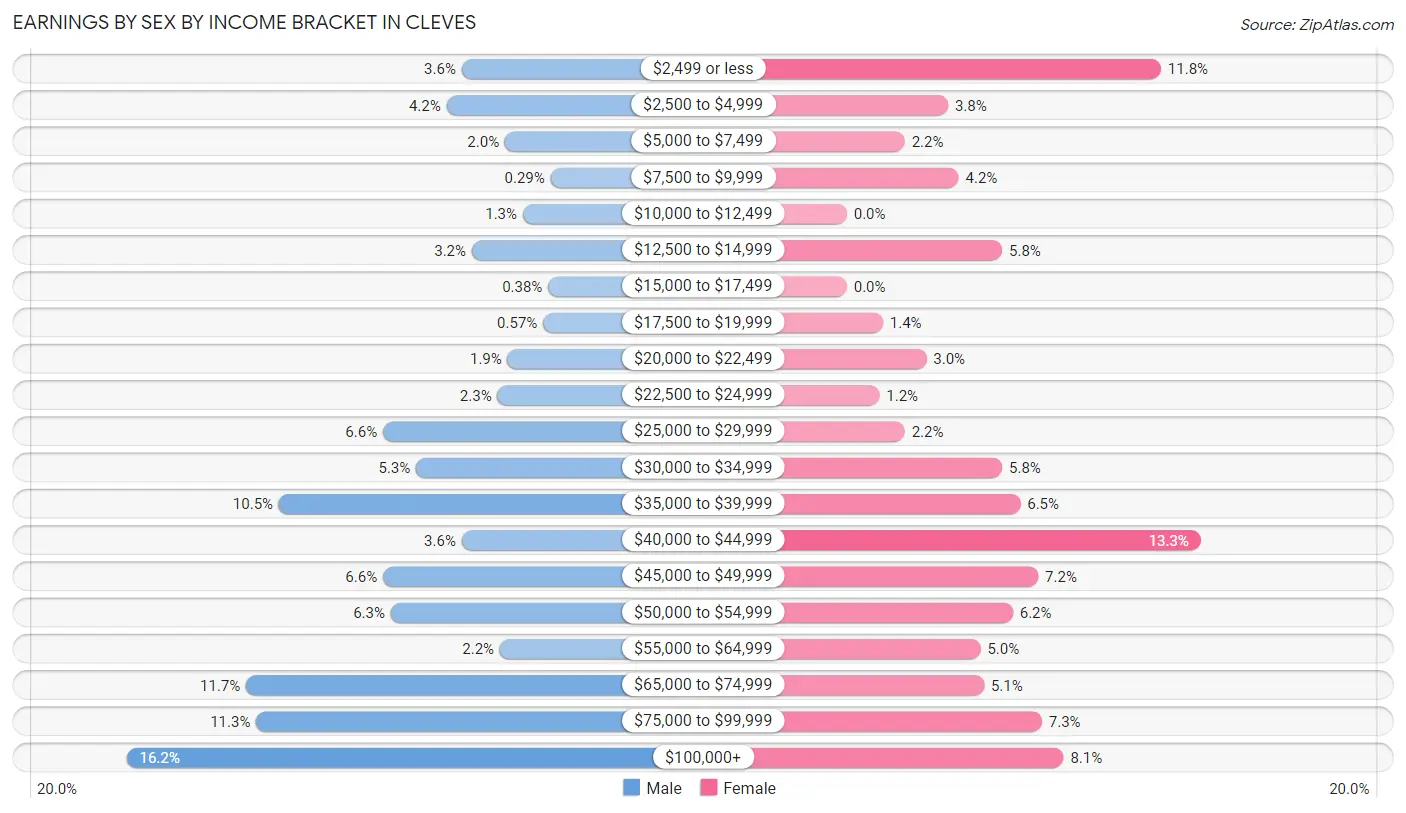
| Income | Male | Female |
| $2,499 or less | 38 (3.6%) | 87 (11.8%) |
| $2,500 to $4,999 | 44 (4.2%) | 28 (3.8%) |
| $5,000 to $7,499 | 21 (2.0%) | 16 (2.2%) |
| $7,500 to $9,999 | 3 (0.3%) | 31 (4.2%) |
| $10,000 to $12,499 | 14 (1.3%) | 0 (0.0%) |
| $12,500 to $14,999 | 34 (3.2%) | 43 (5.8%) |
| $15,000 to $17,499 | 4 (0.4%) | 0 (0.0%) |
| $17,500 to $19,999 | 6 (0.6%) | 10 (1.3%) |
| $20,000 to $22,499 | 20 (1.9%) | 22 (3.0%) |
| $22,500 to $24,999 | 24 (2.3%) | 9 (1.2%) |
| $25,000 to $29,999 | 69 (6.6%) | 16 (2.2%) |
| $30,000 to $34,999 | 56 (5.3%) | 43 (5.8%) |
| $35,000 to $39,999 | 110 (10.5%) | 48 (6.5%) |
| $40,000 to $44,999 | 38 (3.6%) | 98 (13.3%) |
| $45,000 to $49,999 | 69 (6.6%) | 53 (7.2%) |
| $50,000 to $54,999 | 66 (6.3%) | 46 (6.2%) |
| $55,000 to $64,999 | 23 (2.2%) | 37 (5.0%) |
| $65,000 to $74,999 | 123 (11.7%) | 38 (5.1%) |
| $75,000 to $99,999 | 119 (11.3%) | 54 (7.3%) |
| $100,000+ | 170 (16.2%) | 60 (8.1%) |
| Total | 1,051 (100.0%) | 739 (100.0%) |
Earnings by Sex by Educational Attainment in Cleves
Average earnings in Cleves are $65,509 for men and $45,081 for women, a difference of 31.2%. Men with an educational attainment of graduate degree enjoy the highest average annual earnings of $119,219, while those with less than high school education earn the least with $45,446. Women with an educational attainment of less than high school earn the most with the average annual earnings of $67,708, while those with high school diploma education have the smallest earnings of $40,575.
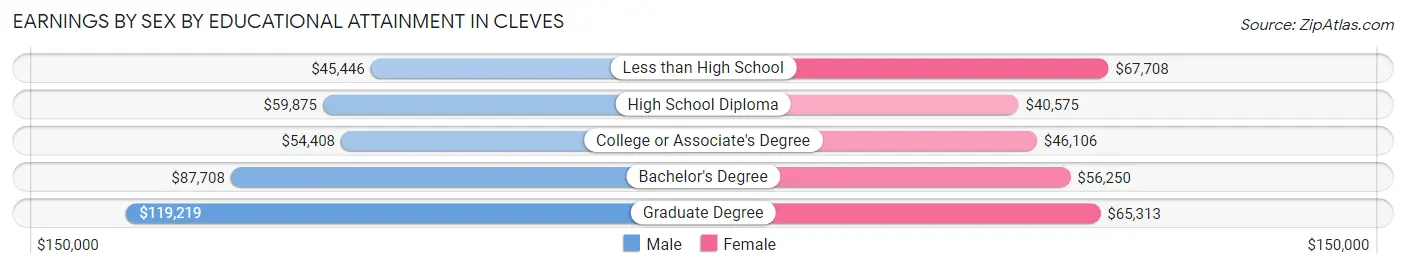
| Educational Attainment | Male Income | Female Income |
| Less than High School | $45,446 | $67,708 |
| High School Diploma | $59,875 | $40,575 |
| College or Associate's Degree | $54,408 | $46,106 |
| Bachelor's Degree | $87,708 | $56,250 |
| Graduate Degree | $119,219 | $65,313 |
| Total | $65,509 | $45,081 |
Family Income in Cleves
Family Income Brackets in Cleves
According to the Cleves family income data, there are 209 families falling into the $35,000 to $49,999 income range, which is the most common income bracket and makes up 24.2% of all families. Conversely, the $10,000 to $14,999 income bracket is the least frequent group with only 5 families (0.6%) belonging to this category.
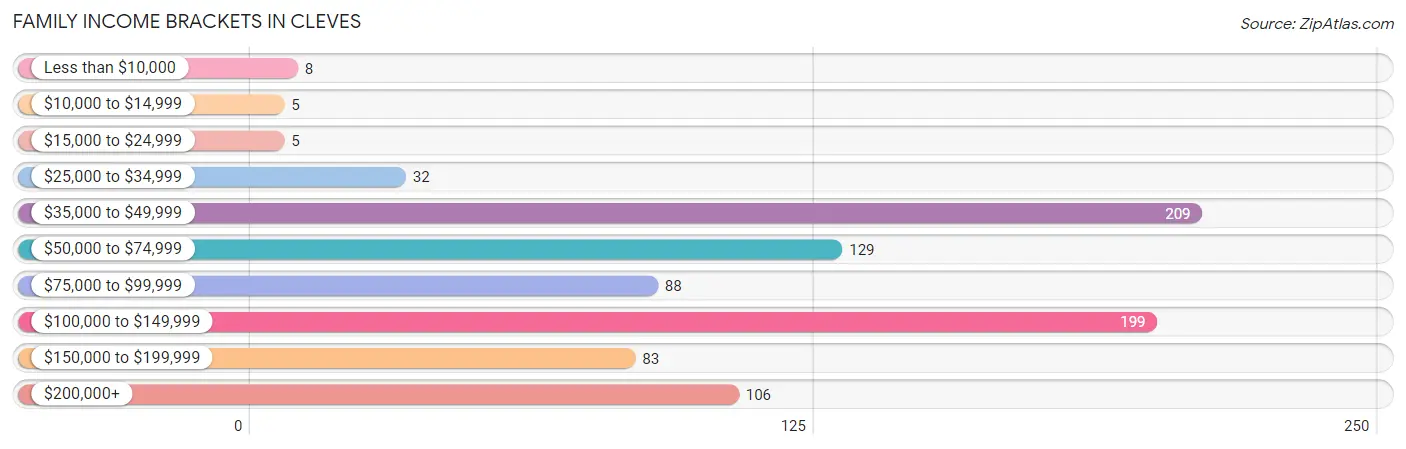
| Income Bracket | # Families | % Families |
| Less than $10,000 | 8 | 0.9% |
| $10,000 to $14,999 | 5 | 0.6% |
| $15,000 to $24,999 | 5 | 0.6% |
| $25,000 to $34,999 | 32 | 3.7% |
| $35,000 to $49,999 | 209 | 24.2% |
| $50,000 to $74,999 | 129 | 14.9% |
| $75,000 to $99,999 | 88 | 10.2% |
| $100,000 to $149,999 | 199 | 23.0% |
| $150,000 to $199,999 | 83 | 9.6% |
| $200,000+ | 106 | 12.3% |
Family Income by Famaliy Size in Cleves
6-person families (33 | 3.8%) account for the highest median family income in Cleves with $242,768 per family, while 6-person families (33 | 3.8%) have the highest median income of $40,461 per family member.
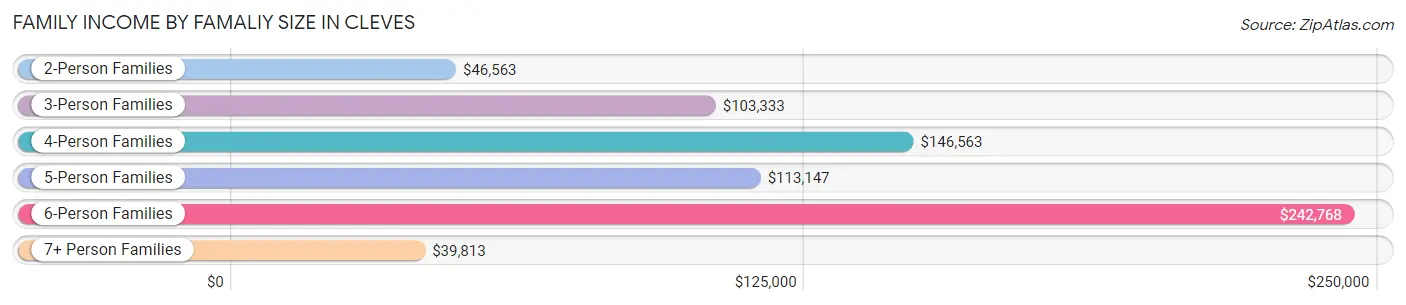
| Income Bracket | # Families | Median Income |
| 2-Person Families | 335 (38.8%) | $46,563 |
| 3-Person Families | 164 (19.0%) | $103,333 |
| 4-Person Families | 153 (17.7%) | $146,563 |
| 5-Person Families | 142 (16.4%) | $113,147 |
| 6-Person Families | 33 (3.8%) | $242,768 |
| 7+ Person Families | 37 (4.3%) | $39,813 |
| Total | 864 (100.0%) | $90,743 |
Family Income by Number of Earners in Cleves
The median family income in Cleves is $90,743, with families comprising 3+ earners (130) having the highest median family income of $211,500, while families with no earners (82) have the lowest median family income of $37,727, accounting for 15.0% and 9.5% of families, respectively.
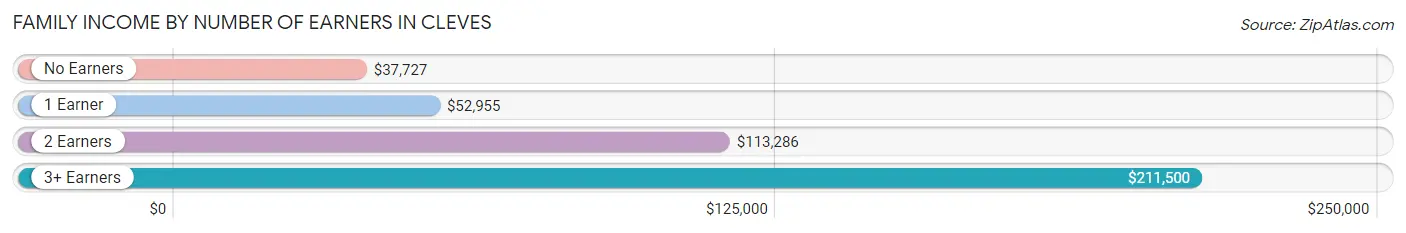
| Number of Earners | # Families | Median Income |
| No Earners | 82 (9.5%) | $37,727 |
| 1 Earner | 302 (34.9%) | $52,955 |
| 2 Earners | 350 (40.5%) | $113,286 |
| 3+ Earners | 130 (15.0%) | $211,500 |
| Total | 864 (100.0%) | $90,743 |
Household Income in Cleves
Household Income Brackets in Cleves
With 280 households falling in the category, the $100,000 to $149,999 income range is the most frequent in Cleves, accounting for 25.3% of all households. In contrast, only 13 households (1.2%) fall into the $10,000 to $14,999 income bracket, making it the least populous group.
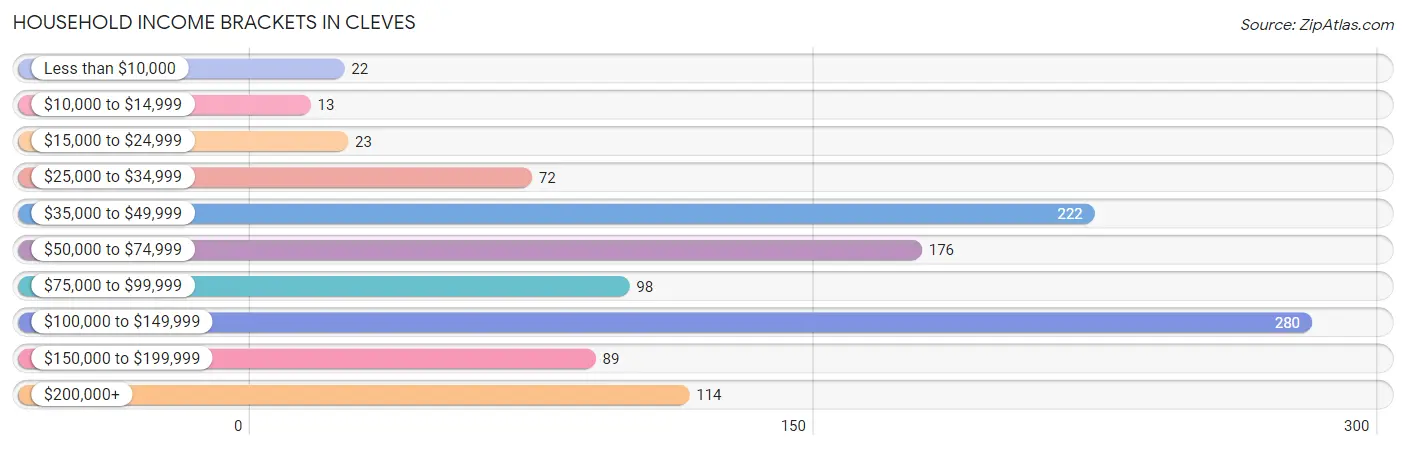
| Income Bracket | # Households | % Households |
| Less than $10,000 | 22 | 2.0% |
| $10,000 to $14,999 | 13 | 1.2% |
| $15,000 to $24,999 | 23 | 2.1% |
| $25,000 to $34,999 | 72 | 6.5% |
| $35,000 to $49,999 | 222 | 20.0% |
| $50,000 to $74,999 | 176 | 15.9% |
| $75,000 to $99,999 | 98 | 8.8% |
| $100,000 to $149,999 | 280 | 25.3% |
| $150,000 to $199,999 | 89 | 8.0% |
| $200,000+ | 114 | 10.3% |
Household Income by Householder Age in Cleves
The median household income in Cleves is $85,109, with the highest median household income of $112,702 found in the 25 to 44 years age bracket for the primary householder. A total of 388 households (35.0%) fall into this category. Meanwhile, the 65+ years age bracket for the primary householder has the lowest median household income of $37,500, with 154 households (13.9%) in this group.
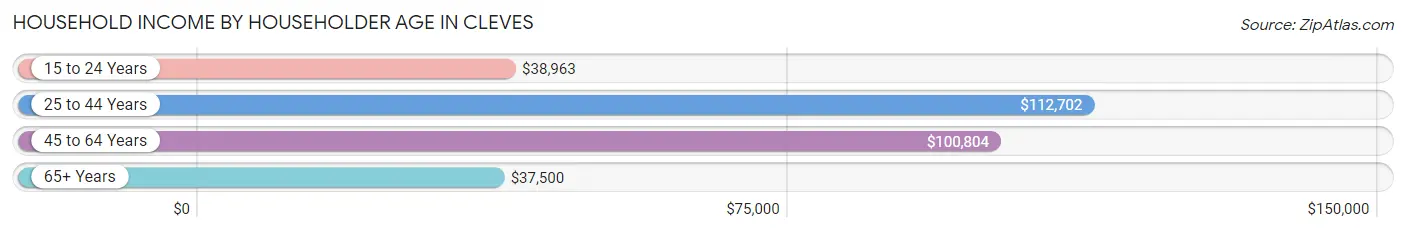
| Income Bracket | # Households | Median Income |
| 15 to 24 Years | 103 (9.3%) | $38,963 |
| 25 to 44 Years | 388 (35.0%) | $112,702 |
| 45 to 64 Years | 463 (41.8%) | $100,804 |
| 65+ Years | 154 (13.9%) | $37,500 |
| Total | 1,108 (100.0%) | $85,109 |
Poverty in Cleves
Income Below Poverty by Sex and Age in Cleves
With 8.5% poverty level for males and 18.7% for females among the residents of Cleves, 25 to 34 year old males and 18 to 24 year old females are the most vulnerable to poverty, with 41 males (19.5%) and 86 females (48.6%) in their respective age groups living below the poverty level.
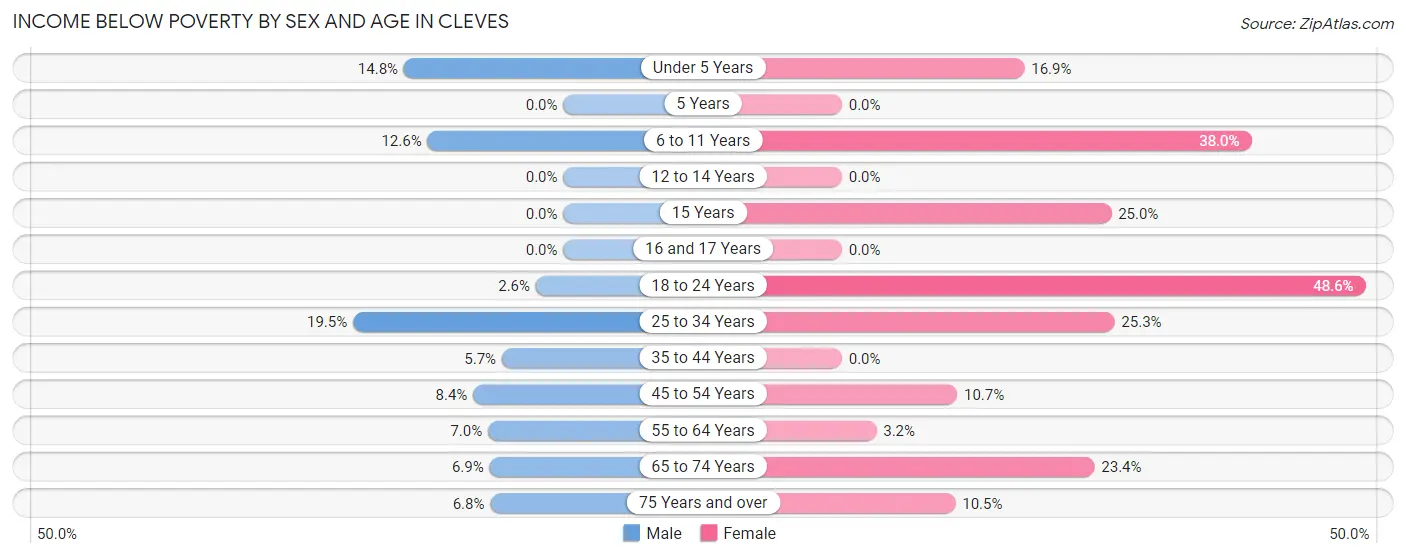
| Age Bracket | Male | Female |
| Under 5 Years | 45 (14.8%) | 21 (16.9%) |
| 5 Years | 0 (0.0%) | 0 (0.0%) |
| 6 to 11 Years | 14 (12.6%) | 57 (38.0%) |
| 12 to 14 Years | 0 (0.0%) | 0 (0.0%) |
| 15 Years | 0 (0.0%) | 4 (25.0%) |
| 16 and 17 Years | 0 (0.0%) | 0 (0.0%) |
| 18 to 24 Years | 5 (2.5%) | 86 (48.6%) |
| 25 to 34 Years | 41 (19.5%) | 64 (25.3%) |
| 35 to 44 Years | 15 (5.7%) | 0 (0.0%) |
| 45 to 54 Years | 19 (8.4%) | 26 (10.7%) |
| 55 to 64 Years | 13 (7.0%) | 4 (3.2%) |
| 65 to 74 Years | 5 (6.9%) | 15 (23.4%) |
| 75 Years and over | 4 (6.8%) | 4 (10.5%) |
| Total | 161 (8.5%) | 281 (18.7%) |
Income Above Poverty by Sex and Age in Cleves
According to the poverty statistics in Cleves, males aged 5 years and females aged 5 years are the age groups that are most secure financially, with 100.0% of males and 100.0% of females in these age groups living above the poverty line.
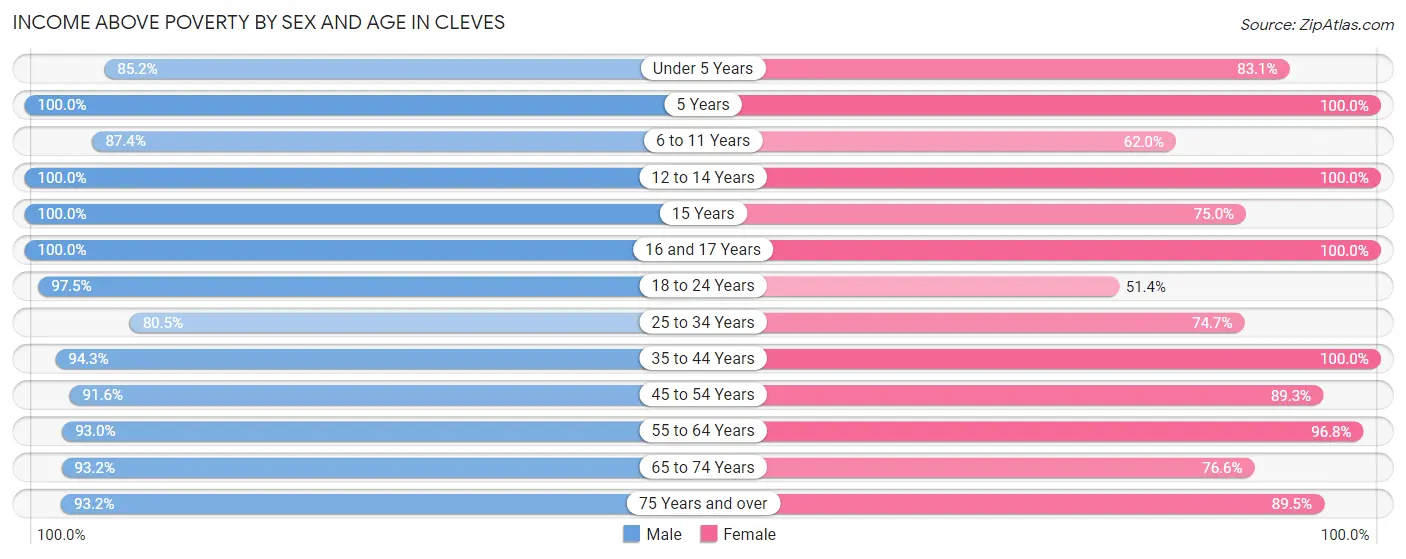
| Age Bracket | Male | Female |
| Under 5 Years | 259 (85.2%) | 103 (83.1%) |
| 5 Years | 78 (100.0%) | 32 (100.0%) |
| 6 to 11 Years | 97 (87.4%) | 93 (62.0%) |
| 12 to 14 Years | 83 (100.0%) | 59 (100.0%) |
| 15 Years | 25 (100.0%) | 12 (75.0%) |
| 16 and 17 Years | 76 (100.0%) | 42 (100.0%) |
| 18 to 24 Years | 191 (97.5%) | 91 (51.4%) |
| 25 to 34 Years | 169 (80.5%) | 189 (74.7%) |
| 35 to 44 Years | 248 (94.3%) | 181 (100.0%) |
| 45 to 54 Years | 208 (91.6%) | 217 (89.3%) |
| 55 to 64 Years | 173 (93.0%) | 121 (96.8%) |
| 65 to 74 Years | 68 (93.1%) | 49 (76.6%) |
| 75 Years and over | 55 (93.2%) | 34 (89.5%) |
| Total | 1,730 (91.5%) | 1,223 (81.3%) |
Income Below Poverty Among Married-Couple Families in Cleves
The poverty statistics for married-couple families in Cleves show that 3.0% or 18 of the total 609 families live below the poverty line. Families with 1 or 2 children have the highest poverty rate of 6.7%, comprising of 14 families. On the other hand, families with 3 or 4 children have the lowest poverty rate of 0.0%, which includes 0 families.
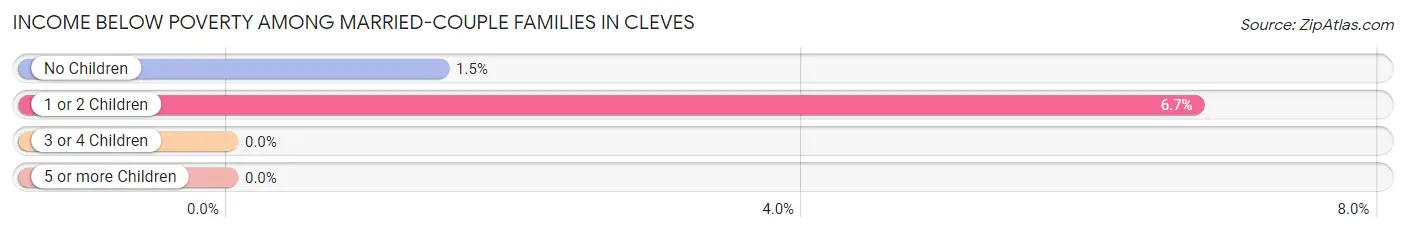
| Children | Above Poverty | Below Poverty |
| No Children | 269 (98.5%) | 4 (1.5%) |
| 1 or 2 Children | 194 (93.3%) | 14 (6.7%) |
| 3 or 4 Children | 125 (100.0%) | 0 (0.0%) |
| 5 or more Children | 3 (100.0%) | 0 (0.0%) |
| Total | 591 (97.0%) | 18 (3.0%) |
Income Below Poverty Among Single-Parent Households in Cleves
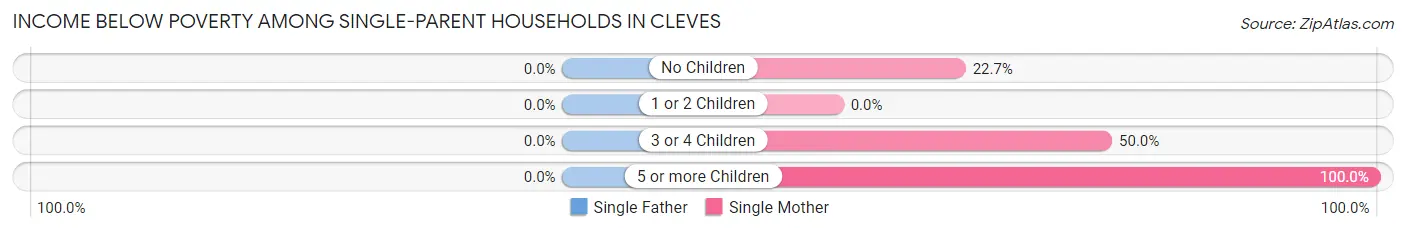
| Children | Single Father | Single Mother |
| No Children | 0 (0.0%) | 5 (22.7%) |
| 1 or 2 Children | 0 (0.0%) | 0 (0.0%) |
| 3 or 4 Children | 0 (0.0%) | 4 (50.0%) |
| 5 or more Children | 0 (0.0%) | 20 (100.0%) |
| Total | 0 (0.0%) | 29 (24.0%) |
Income Below Poverty Among Married-Couple vs Single-Parent Households in Cleves
The poverty data for Cleves shows that 18 of the married-couple family households (3.0%) and 29 of the single-parent households (11.4%) are living below the poverty level. Within the married-couple family households, those with 1 or 2 children have the highest poverty rate, with 14 households (6.7%) falling below the poverty line. Among the single-parent households, those with 5 or more children have the highest poverty rate, with 20 household (100.0%) living below poverty.
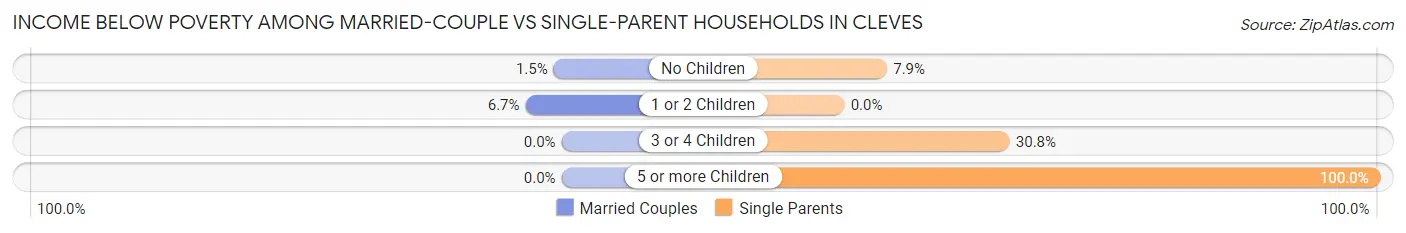
| Children | Married-Couple Families | Single-Parent Households |
| No Children | 4 (1.5%) | 5 (7.9%) |
| 1 or 2 Children | 14 (6.7%) | 0 (0.0%) |
| 3 or 4 Children | 0 (0.0%) | 4 (30.8%) |
| 5 or more Children | 0 (0.0%) | 20 (100.0%) |
| Total | 18 (3.0%) | 29 (11.4%) |
Race in Cleves
The most populous races in Cleves are White / Caucasian (3,238 | 95.4%), Two or more Races (122 | 3.6%), and Asian (22 | 0.6%).
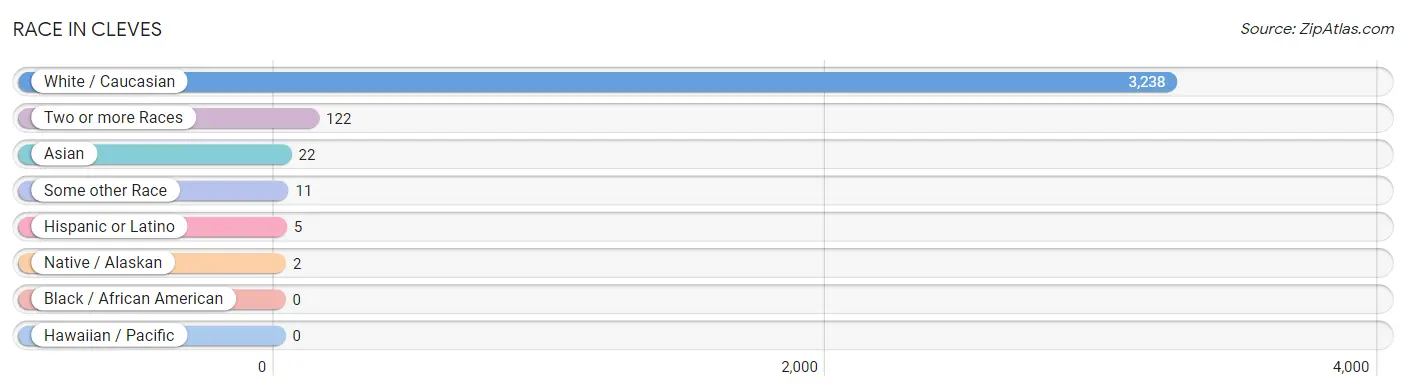
| Race | # Population | % Population |
| Asian | 22 | 0.6% |
| Black / African American | 0 | 0.0% |
| Hawaiian / Pacific | 0 | 0.0% |
| Hispanic or Latino | 5 | 0.2% |
| Native / Alaskan | 2 | 0.1% |
| White / Caucasian | 3,238 | 95.4% |
| Two or more Races | 122 | 3.6% |
| Some other Race | 11 | 0.3% |
| Total | 3,395 | 100.0% |
Ancestry in Cleves
The most populous ancestries reported in Cleves are German (1,102 | 32.5%), Irish (964 | 28.4%), English (671 | 19.8%), American (298 | 8.8%), and Italian (224 | 6.6%), together accounting for 96.0% of all Cleves residents.
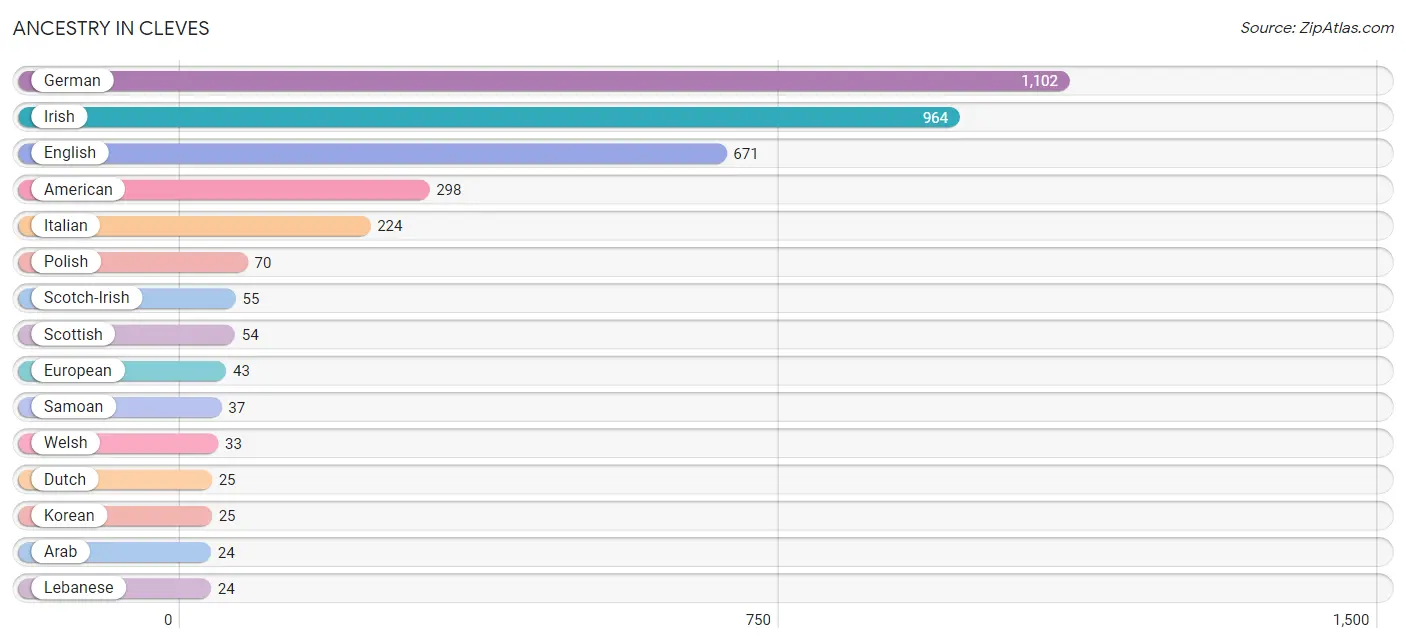
| Ancestry | # Population | % Population |
| American | 298 | 8.8% |
| Arab | 24 | 0.7% |
| Austrian | 10 | 0.3% |
| Blackfeet | 6 | 0.2% |
| Bulgarian | 5 | 0.2% |
| Cherokee | 16 | 0.5% |
| Danish | 6 | 0.2% |
| Dutch | 25 | 0.7% |
| English | 671 | 19.8% |
| European | 43 | 1.3% |
| French | 15 | 0.4% |
| German | 1,102 | 32.5% |
| Greek | 9 | 0.3% |
| Indian (Asian) | 13 | 0.4% |
| Irish | 964 | 28.4% |
| Italian | 224 | 6.6% |
| Korean | 25 | 0.7% |
| Lebanese | 24 | 0.7% |
| Norwegian | 5 | 0.2% |
| Osage | 2 | 0.1% |
| Polish | 70 | 2.1% |
| Portuguese | 3 | 0.1% |
| Samoan | 37 | 1.1% |
| Scotch-Irish | 55 | 1.6% |
| Scottish | 54 | 1.6% |
| Serbian | 5 | 0.2% |
| Sri Lankan | 12 | 0.4% |
| Swedish | 16 | 0.5% |
| Swiss | 8 | 0.2% |
| Welsh | 33 | 1.0% | View All 30 Rows |
Immigrants in Cleves
The most numerous immigrant groups reported in Cleves came from Asia (12 | 0.4%), Europe (9 | 0.3%), Africa (8 | 0.2%), South Africa (8 | 0.2%), and Philippines (7 | 0.2%), together accounting for 1.3% of all Cleves residents.
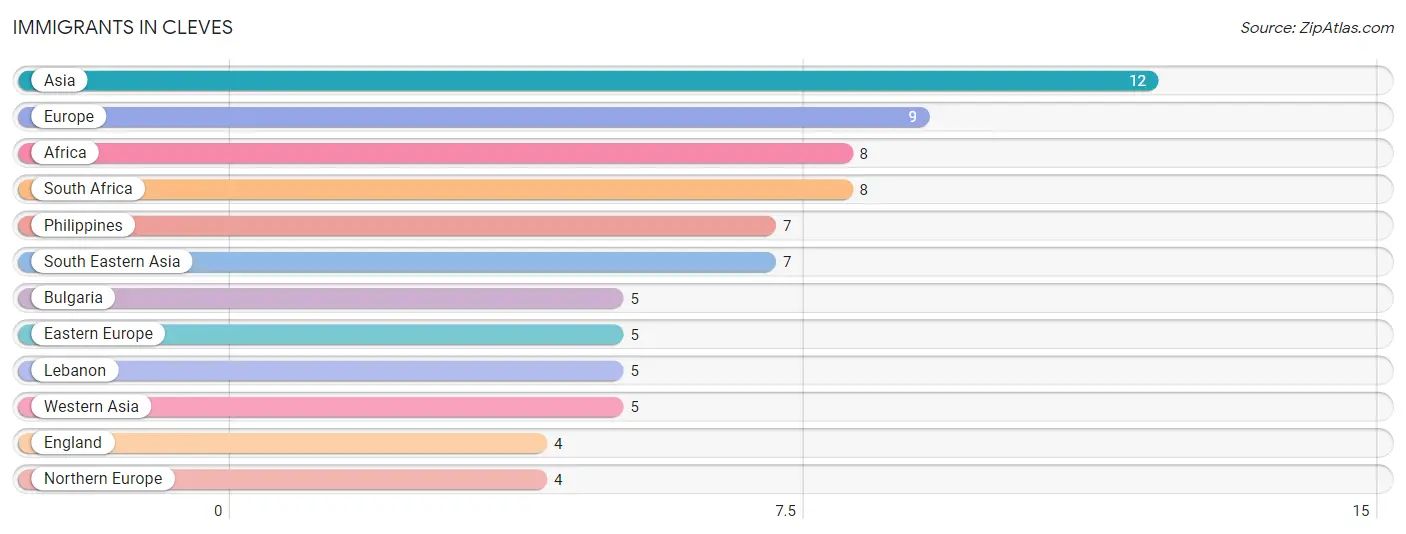
| Immigration Origin | # Population | % Population |
| Africa | 8 | 0.2% |
| Asia | 12 | 0.4% |
| Bulgaria | 5 | 0.2% |
| Eastern Europe | 5 | 0.2% |
| England | 4 | 0.1% |
| Europe | 9 | 0.3% |
| Lebanon | 5 | 0.2% |
| Northern Europe | 4 | 0.1% |
| Philippines | 7 | 0.2% |
| South Africa | 8 | 0.2% |
| South Eastern Asia | 7 | 0.2% |
| Western Asia | 5 | 0.2% | View All 12 Rows |
Sex and Age in Cleves
Sex and Age in Cleves
The most populous age groups in Cleves are Under 5 Years (304 | 16.1%) for men and 30 to 34 Years (170 | 11.3%) for women.
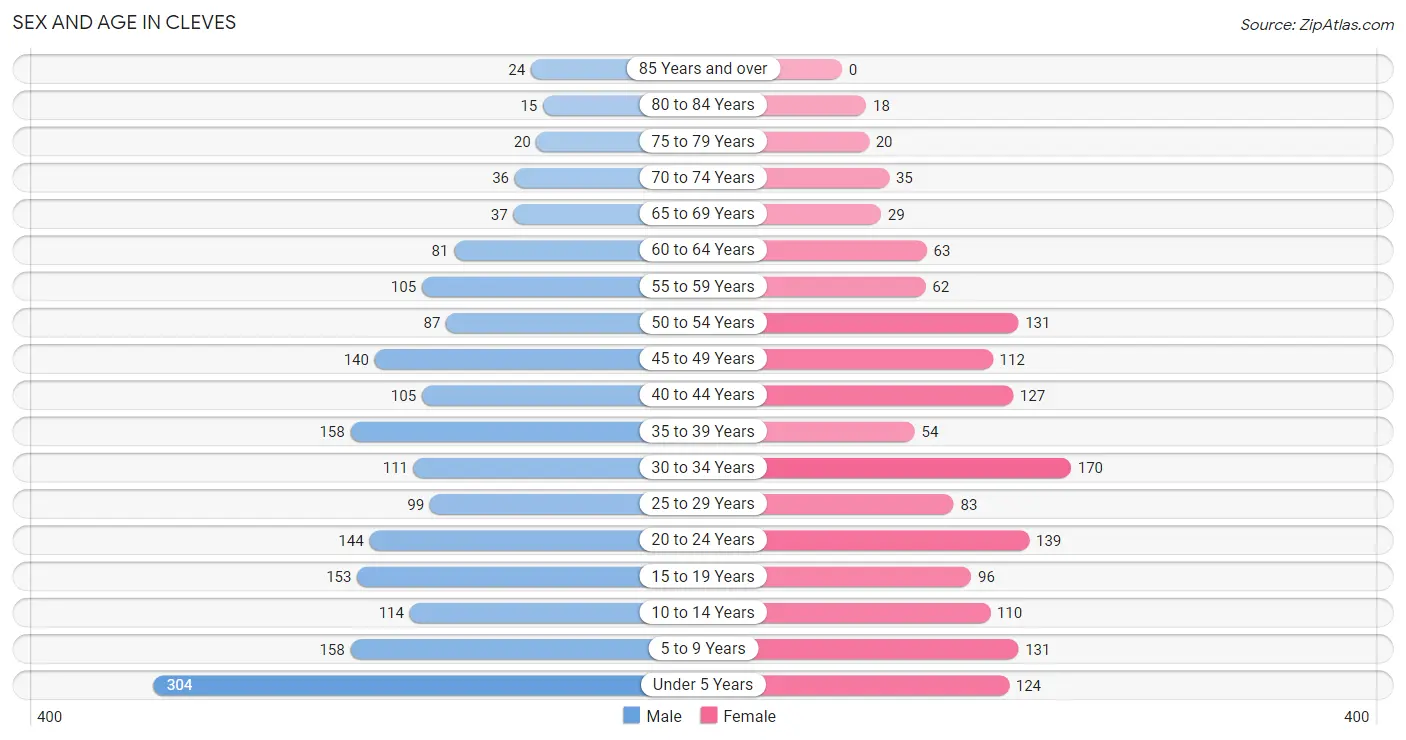
| Age Bracket | Male | Female |
| Under 5 Years | 304 (16.1%) | 124 (8.2%) |
| 5 to 9 Years | 158 (8.4%) | 131 (8.7%) |
| 10 to 14 Years | 114 (6.0%) | 110 (7.3%) |
| 15 to 19 Years | 153 (8.1%) | 96 (6.4%) |
| 20 to 24 Years | 144 (7.6%) | 139 (9.2%) |
| 25 to 29 Years | 99 (5.2%) | 83 (5.5%) |
| 30 to 34 Years | 111 (5.9%) | 170 (11.3%) |
| 35 to 39 Years | 158 (8.4%) | 54 (3.6%) |
| 40 to 44 Years | 105 (5.6%) | 127 (8.4%) |
| 45 to 49 Years | 140 (7.4%) | 112 (7.4%) |
| 50 to 54 Years | 87 (4.6%) | 131 (8.7%) |
| 55 to 59 Years | 105 (5.6%) | 62 (4.1%) |
| 60 to 64 Years | 81 (4.3%) | 63 (4.2%) |
| 65 to 69 Years | 37 (2.0%) | 29 (1.9%) |
| 70 to 74 Years | 36 (1.9%) | 35 (2.3%) |
| 75 to 79 Years | 20 (1.1%) | 20 (1.3%) |
| 80 to 84 Years | 15 (0.8%) | 18 (1.2%) |
| 85 Years and over | 24 (1.3%) | 0 (0.0%) |
| Total | 1,891 (100.0%) | 1,504 (100.0%) |
Families and Households in Cleves
Median Family Size in Cleves
The median family size in Cleves is 3.47 persons per family, with single female/mother families (121 | 14.0%) accounting for the largest median family size of 4.02 persons per family. On the other hand, single male/father families (134 | 15.5%) represent the smallest median family size with 2.18 persons per family.
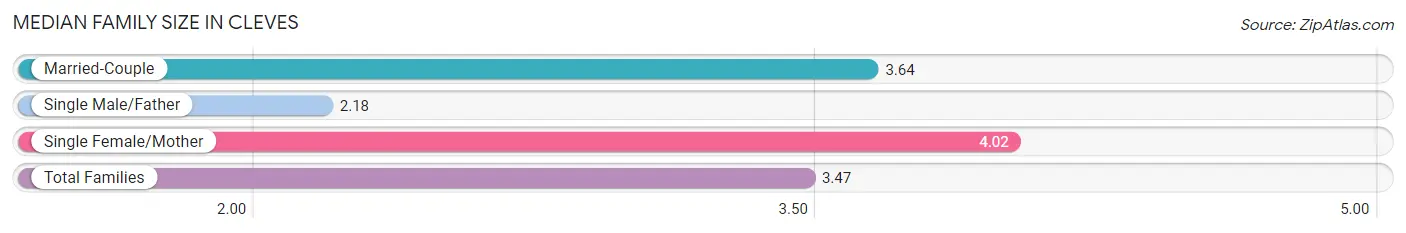
| Family Type | # Families | Family Size |
| Married-Couple | 609 (70.5%) | 3.64 |
| Single Male/Father | 134 (15.5%) | 2.18 |
| Single Female/Mother | 121 (14.0%) | 4.02 |
| Total Families | 864 (100.0%) | 3.47 |
Median Household Size in Cleves
The median household size in Cleves is 3.06 persons per household, with single female/mother households (121 | 10.9%) accounting for the largest median household size of 4.22 persons per household. non-family households (244 | 22.0%) represent the smallest median household size with 1.10 persons per household.
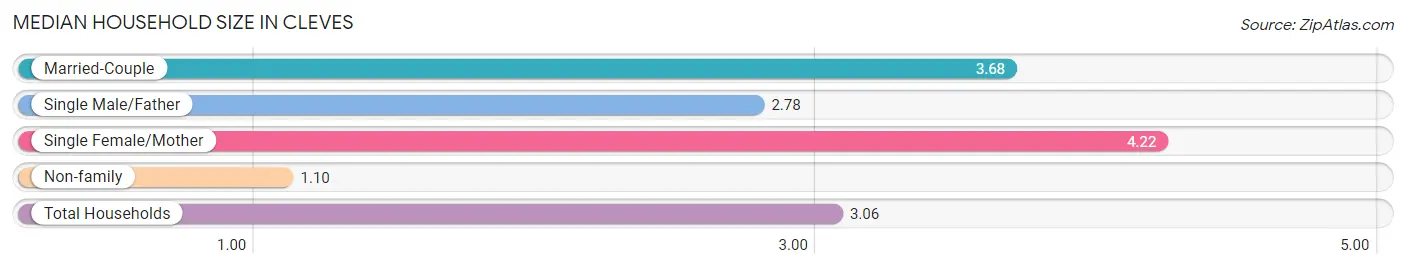
| Household Type | # Households | Household Size |
| Married-Couple | 609 (55.0%) | 3.68 |
| Single Male/Father | 134 (12.1%) | 2.78 |
| Single Female/Mother | 121 (10.9%) | 4.22 |
| Non-family | 244 (22.0%) | 1.10 |
| Total Households | 1,108 (100.0%) | 3.06 |
Household Size by Marriage Status in Cleves
Out of a total of 1,108 households in Cleves, 864 (78.0%) are family households, while 244 (22.0%) are nonfamily households. The most numerous type of family households are 3-person households, comprising 243, and the most common type of nonfamily households are 1-person households, comprising 220.
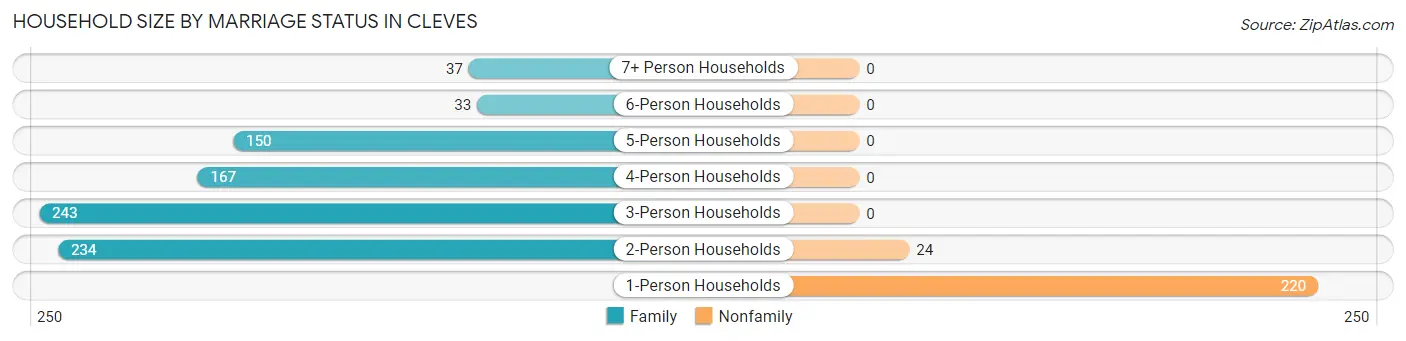
| Household Size | Family Households | Nonfamily Households |
| 1-Person Households | - | 220 (19.9%) |
| 2-Person Households | 234 (21.1%) | 24 (2.2%) |
| 3-Person Households | 243 (21.9%) | 0 (0.0%) |
| 4-Person Households | 167 (15.1%) | 0 (0.0%) |
| 5-Person Households | 150 (13.5%) | 0 (0.0%) |
| 6-Person Households | 33 (3.0%) | 0 (0.0%) |
| 7+ Person Households | 37 (3.3%) | 0 (0.0%) |
| Total | 864 (78.0%) | 244 (22.0%) |
Female Fertility in Cleves
Fertility by Age in Cleves
Average fertility rate in Cleves is 115.0 births per 1,000 women. Women in the age bracket of 20 to 34 years have the highest fertility rate with 235.0 births per 1,000 women. Women in the age bracket of 20 to 34 years acount for 100.0% of all women with births.
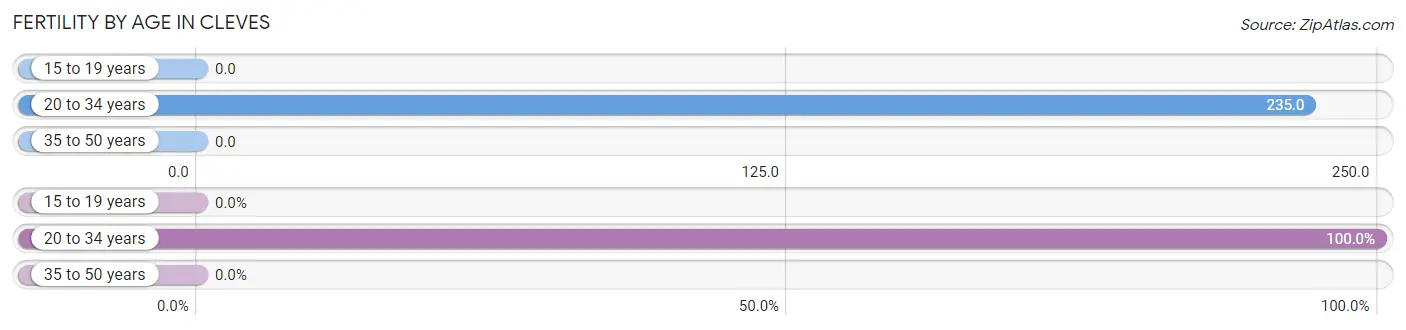
| Age Bracket | Women with Births | Births / 1,000 Women |
| 15 to 19 years | 0 (0.0%) | 0.0 |
| 20 to 34 years | 92 (100.0%) | 235.0 |
| 35 to 50 years | 0 (0.0%) | 0.0 |
| Total | 92 (100.0%) | 115.0 |
Fertility by Age by Marriage Status in Cleves
6.5% of women with births (92) in Cleves are married. The highest percentage of unmarried women with births falls into 20 to 34 years age bracket with 93.5% of them unmarried at the time of birth, while the lowest percentage of unmarried women with births belong to 20 to 34 years age bracket with 93.5% of them unmarried.
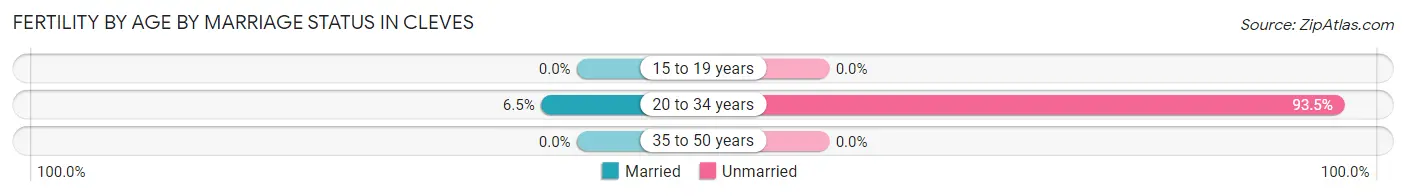
| Age Bracket | Married | Unmarried |
| 15 to 19 years | 0 (0.0%) | 0 (0.0%) |
| 20 to 34 years | 6 (6.5%) | 86 (93.5%) |
| 35 to 50 years | 0 (0.0%) | 0 (0.0%) |
| Total | 6 (6.5%) | 86 (93.5%) |
Fertility by Education in Cleves
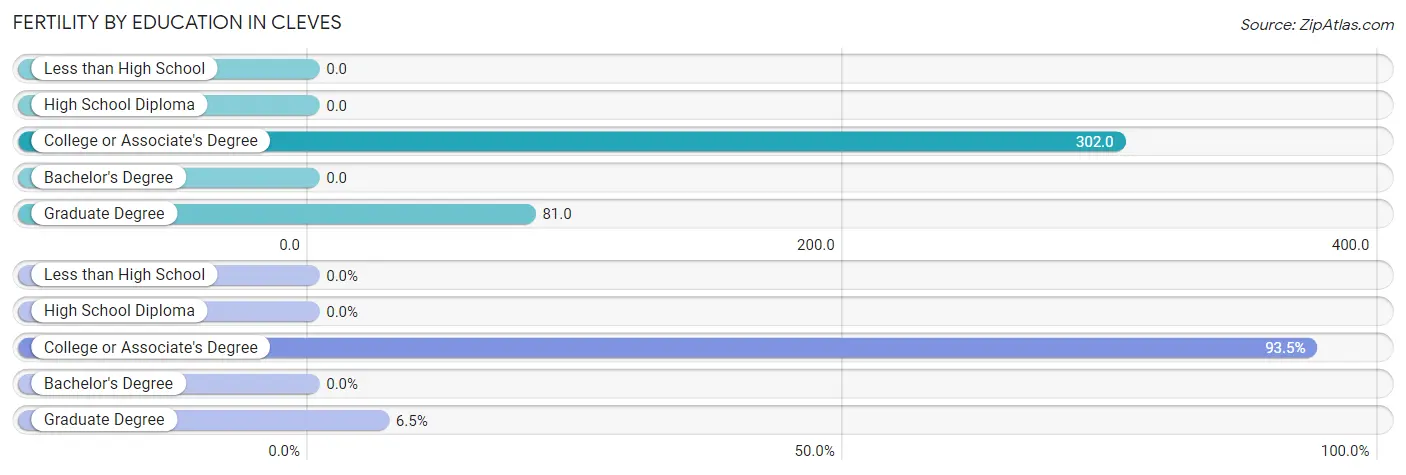
| Educational Attainment | Women with Births | Births / 1,000 Women |
| Less than High School | 0 (0.0%) | 0.0 |
| High School Diploma | 0 (0.0%) | 0.0 |
| College or Associate's Degree | 86 (93.5%) | 302.0 |
| Bachelor's Degree | 0 (0.0%) | 0.0 |
| Graduate Degree | 6 (6.5%) | 81.0 |
| Total | 92 (100.0%) | 115.0 |
Fertility by Education by Marriage Status in Cleves
93.5% of women with births in Cleves are unmarried. Women with the educational attainment of graduate degree are most likely to be married with 100.0% of them married at childbirth, while women with the educational attainment of college or associate's degree are least likely to be married with 100.0% of them unmarried at childbirth.
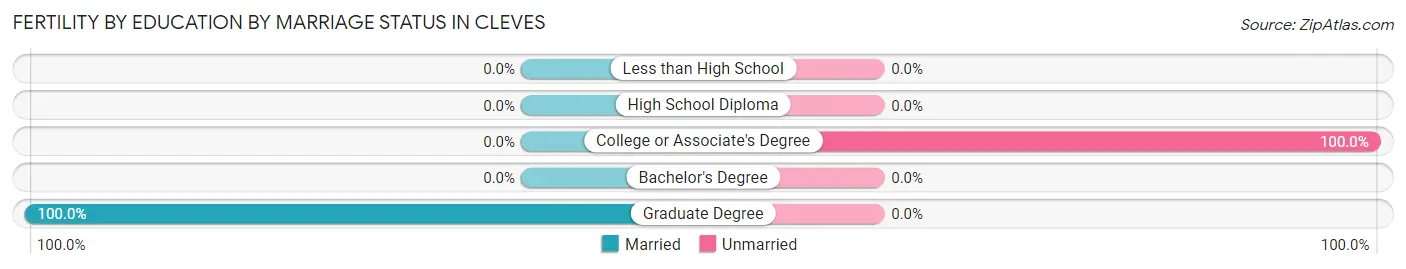
| Educational Attainment | Married | Unmarried |
| Less than High School | 0 (0.0%) | 0 (0.0%) |
| High School Diploma | 0 (0.0%) | 0 (0.0%) |
| College or Associate's Degree | 0 (0.0%) | 86 (100.0%) |
| Bachelor's Degree | 0 (0.0%) | 0 (0.0%) |
| Graduate Degree | 6 (100.0%) | 0 (0.0%) |
| Total | 6 (6.5%) | 86 (93.5%) |
Employment Characteristics in Cleves
Employment by Class of Employer in Cleves
Among the 1,566 employed individuals in Cleves, private company employees (1,197 | 76.4%), local government employees (133 | 8.5%), and not-for-profit organizations (97 | 6.2%) make up the most common classes of employment.
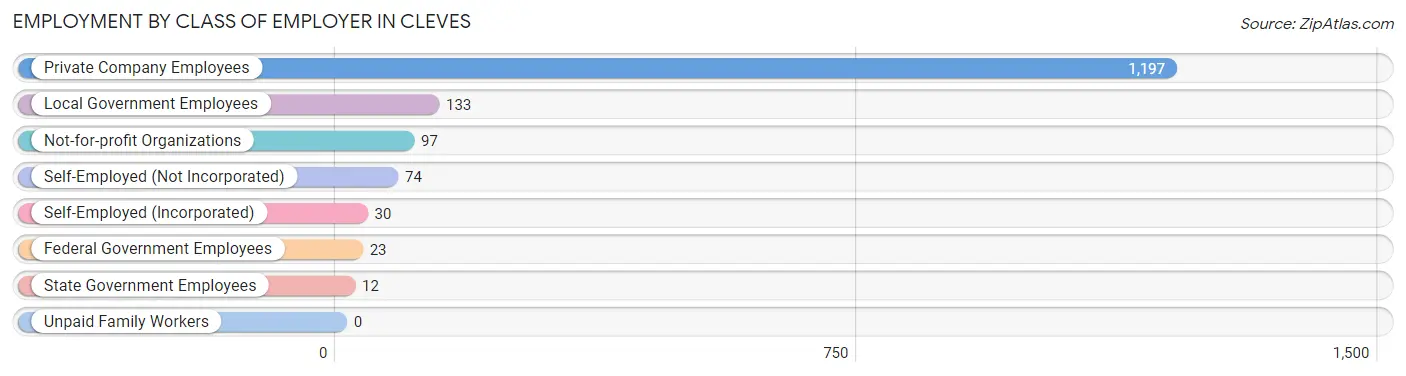
| Employer Class | # Employees | % Employees |
| Private Company Employees | 1,197 | 76.4% |
| Self-Employed (Incorporated) | 30 | 1.9% |
| Self-Employed (Not Incorporated) | 74 | 4.7% |
| Not-for-profit Organizations | 97 | 6.2% |
| Local Government Employees | 133 | 8.5% |
| State Government Employees | 12 | 0.8% |
| Federal Government Employees | 23 | 1.5% |
| Unpaid Family Workers | 0 | 0.0% |
| Total | 1,566 | 100.0% |
Employment Status by Age in Cleves
According to the labor force statistics for Cleves, out of the total population over 16 years of age (2,413), 71.2% or 1,718 individuals are in the labor force, with 5.6% or 96 of them unemployed. The age group with the highest labor force participation rate is 25 to 29 years, with 93.4% or 170 individuals in the labor force. Within the labor force, the 20 to 24 years age range has the highest percentage of unemployed individuals, with 31.7% or 80 of them being unemployed.
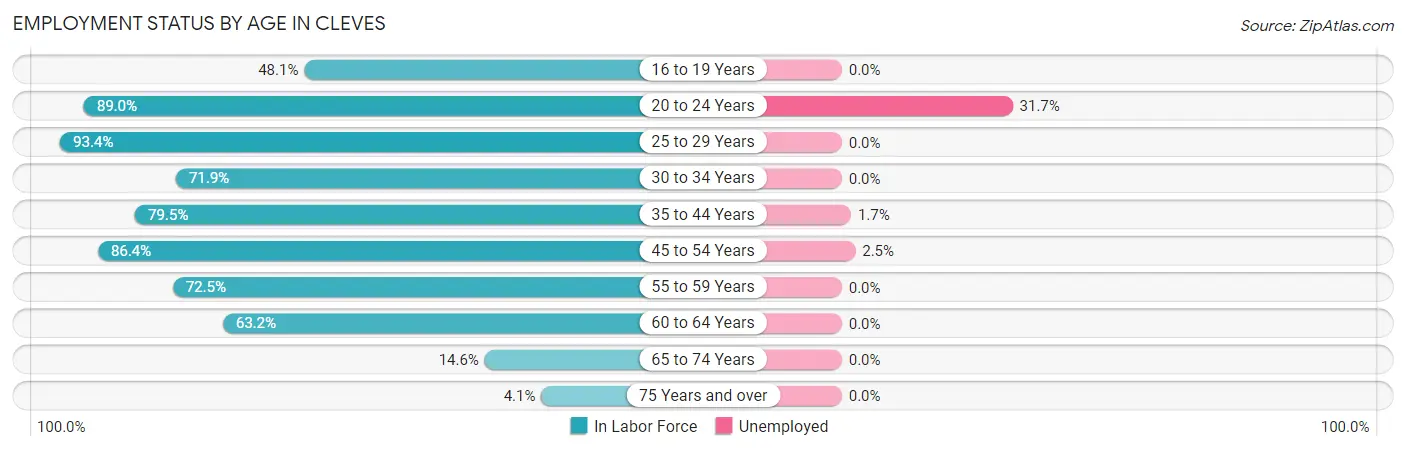
| Age Bracket | In Labor Force | Unemployed |
| 16 to 19 Years | 100 (48.1%) | 0 (0.0%) |
| 20 to 24 Years | 252 (89.0%) | 80 (31.7%) |
| 25 to 29 Years | 170 (93.4%) | 0 (0.0%) |
| 30 to 34 Years | 202 (71.9%) | 0 (0.0%) |
| 35 to 44 Years | 353 (79.5%) | 6 (1.7%) |
| 45 to 54 Years | 406 (86.4%) | 10 (2.5%) |
| 55 to 59 Years | 121 (72.5%) | 0 (0.0%) |
| 60 to 64 Years | 91 (63.2%) | 0 (0.0%) |
| 65 to 74 Years | 20 (14.6%) | 0 (0.0%) |
| 75 Years and over | 4 (4.1%) | 0 (0.0%) |
| Total | 1,718 (71.2%) | 96 (5.6%) |
Employment Status by Educational Attainment in Cleves
According to labor force statistics for Cleves, 79.6% of individuals (1,344) out of the total population between 25 and 64 years of age (1,688) are in the labor force, with 1.2% or 16 of them being unemployed. The group with the highest labor force participation rate are those with the educational attainment of bachelor's degree or higher, with 92.1% or 395 individuals in the labor force. Within the labor force, individuals with college / associate degree education have the highest percentage of unemployment, with 3.5% or 16 of them being unemployed.
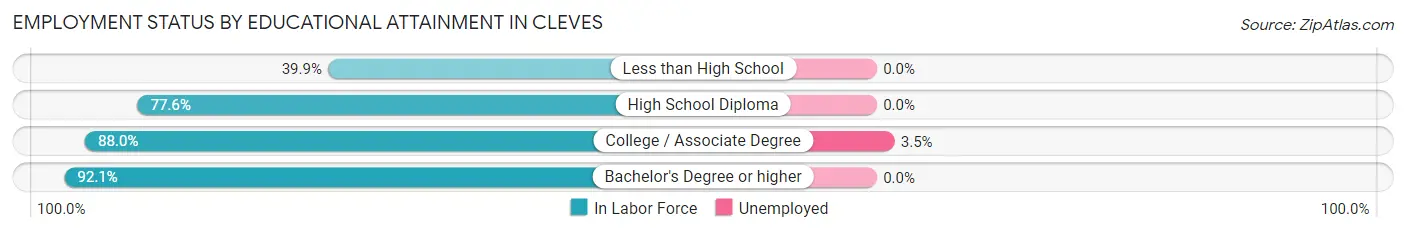
| Educational Attainment | In Labor Force | Unemployed |
| Less than High School | 87 (39.9%) | 0 (0.0%) |
| High School Diploma | 408 (77.6%) | 0 (0.0%) |
| College / Associate Degree | 453 (88.0%) | 18 (3.5%) |
| Bachelor's Degree or higher | 395 (92.1%) | 0 (0.0%) |
| Total | 1,344 (79.6%) | 20 (1.2%) |
Employment Occupations by Sex in Cleves
Management, Business, Science and Arts Occupations
The most common Management, Business, Science and Arts occupations in Cleves are Management (208 | 12.8%), Community & Social Service (132 | 8.1%), Health Diagnosing & Treating (101 | 6.2%), Computers, Engineering & Science (100 | 6.2%), and Education Instruction & Library (89 | 5.5%).
Management, Business, Science and Arts Occupations by Sex
Within the Management, Business, Science and Arts occupations in Cleves, the most male-oriented occupations are Architecture & Engineering (100.0%), Education, Arts & Media (100.0%), and Computers, Engineering & Science (79.0%), while the most female-oriented occupations are Arts, Media & Entertainment (100.0%), Health Technologists (84.1%), and Health Diagnosing & Treating (79.2%).
| Occupation | Male | Female |
| Management | 80 (38.5%) | 128 (61.5%) |
| Business & Financial | 14 (27.5%) | 37 (72.6%) |
| Computers, Engineering & Science | 79 (79.0%) | 21 (21.0%) |
| Computers & Mathematics | 24 (60.0%) | 16 (40.0%) |
| Architecture & Engineering | 40 (100.0%) | 0 (0.0%) |
| Life, Physical & Social Science | 15 (75.0%) | 5 (25.0%) |
| Community & Social Service | 64 (48.5%) | 68 (51.5%) |
| Education, Arts & Media | 18 (100.0%) | 0 (0.0%) |
| Legal Services & Support | 12 (60.0%) | 8 (40.0%) |
| Education Instruction & Library | 34 (38.2%) | 55 (61.8%) |
| Arts, Media & Entertainment | 0 (0.0%) | 5 (100.0%) |
| Health Diagnosing & Treating | 21 (20.8%) | 80 (79.2%) |
| Health Technologists | 11 (15.9%) | 58 (84.1%) |
| Total (Category) | 258 (43.6%) | 334 (56.4%) |
| Total (Overall) | 990 (61.0%) | 633 (39.0%) |
Services Occupations
The most common Services occupations in Cleves are Food Preparation & Serving (90 | 5.6%), Healthcare Support (57 | 3.5%), Security & Protection (47 | 2.9%), Personal Care & Service (42 | 2.6%), and Firefighting & Prevention (25 | 1.5%).
Services Occupations by Sex
Within the Services occupations in Cleves, the most male-oriented occupations are Security & Protection (100.0%), Firefighting & Prevention (100.0%), and Law Enforcement (100.0%), while the most female-oriented occupations are Healthcare Support (66.7%), Food Preparation & Serving (57.8%), and Personal Care & Service (33.3%).
| Occupation | Male | Female |
| Healthcare Support | 19 (33.3%) | 38 (66.7%) |
| Security & Protection | 47 (100.0%) | 0 (0.0%) |
| Firefighting & Prevention | 25 (100.0%) | 0 (0.0%) |
| Law Enforcement | 22 (100.0%) | 0 (0.0%) |
| Food Preparation & Serving | 38 (42.2%) | 52 (57.8%) |
| Cleaning & Maintenance | 19 (100.0%) | 0 (0.0%) |
| Personal Care & Service | 28 (66.7%) | 14 (33.3%) |
| Total (Category) | 151 (59.2%) | 104 (40.8%) |
| Total (Overall) | 990 (61.0%) | 633 (39.0%) |
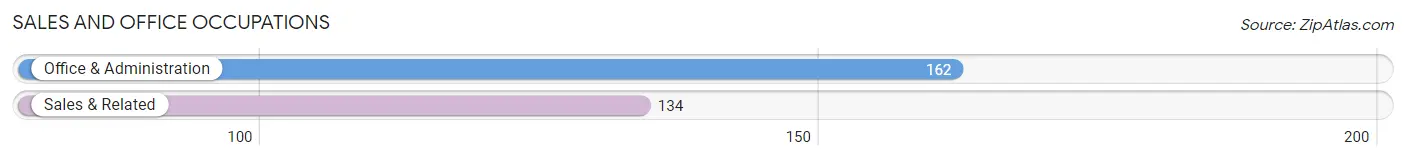
Sales and Office Occupations
The most common Sales and Office occupations in Cleves are Office & Administration (162 | 10.0%), and Sales & Related (134 | 8.3%).
Sales and Office Occupations by Sex
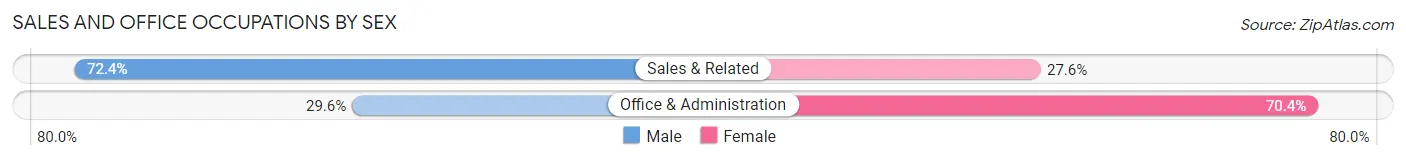
| Occupation | Male | Female |
| Sales & Related | 97 (72.4%) | 37 (27.6%) |
| Office & Administration | 48 (29.6%) | 114 (70.4%) |
| Total (Category) | 145 (49.0%) | 151 (51.0%) |
| Total (Overall) | 990 (61.0%) | 633 (39.0%) |
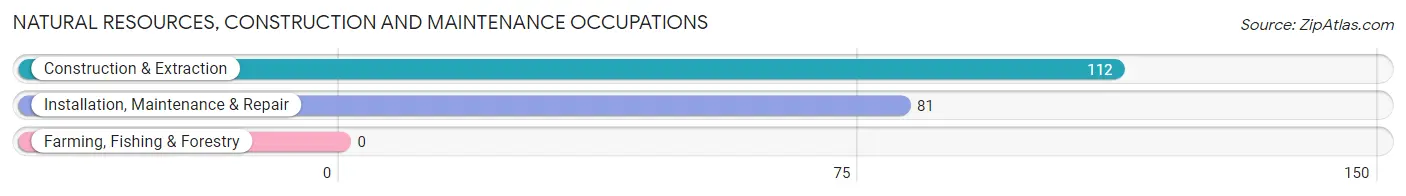
Natural Resources, Construction and Maintenance Occupations
The most common Natural Resources, Construction and Maintenance occupations in Cleves are Construction & Extraction (112 | 6.9%), and Installation, Maintenance & Repair (81 | 5.0%).
Natural Resources, Construction and Maintenance Occupations by Sex
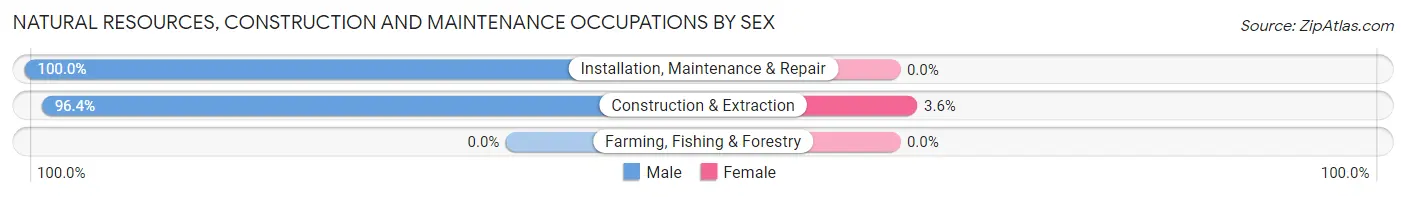
| Occupation | Male | Female |
| Farming, Fishing & Forestry | 0 (0.0%) | 0 (0.0%) |
| Construction & Extraction | 108 (96.4%) | 4 (3.6%) |
| Installation, Maintenance & Repair | 81 (100.0%) | 0 (0.0%) |
| Total (Category) | 189 (97.9%) | 4 (2.1%) |
| Total (Overall) | 990 (61.0%) | 633 (39.0%) |
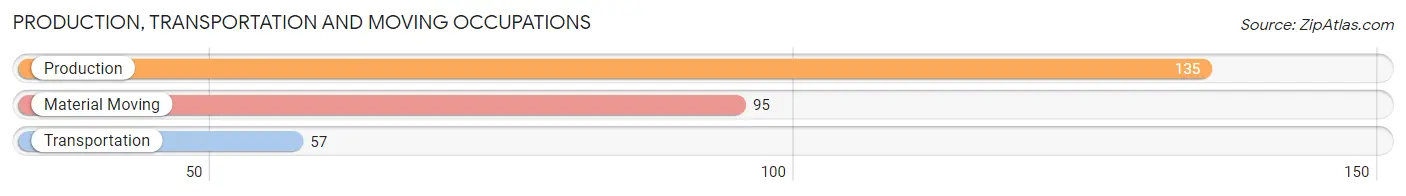
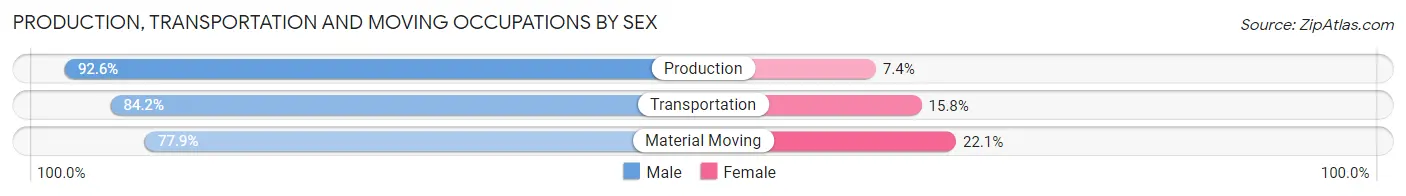
Production, Transportation and Moving Occupations
The most common Production, Transportation and Moving occupations in Cleves are Production (135 | 8.3%), Material Moving (95 | 5.9%), and Transportation (57 | 3.5%).
Production, Transportation and Moving Occupations by Sex
| Occupation | Male | Female |
| Production | 125 (92.6%) | 10 (7.4%) |
| Transportation | 48 (84.2%) | 9 (15.8%) |
| Material Moving | 74 (77.9%) | 21 (22.1%) |
| Total (Category) | 247 (86.1%) | 40 (13.9%) |
| Total (Overall) | 990 (61.0%) | 633 (39.0%) |
Employment Industries by Sex in Cleves
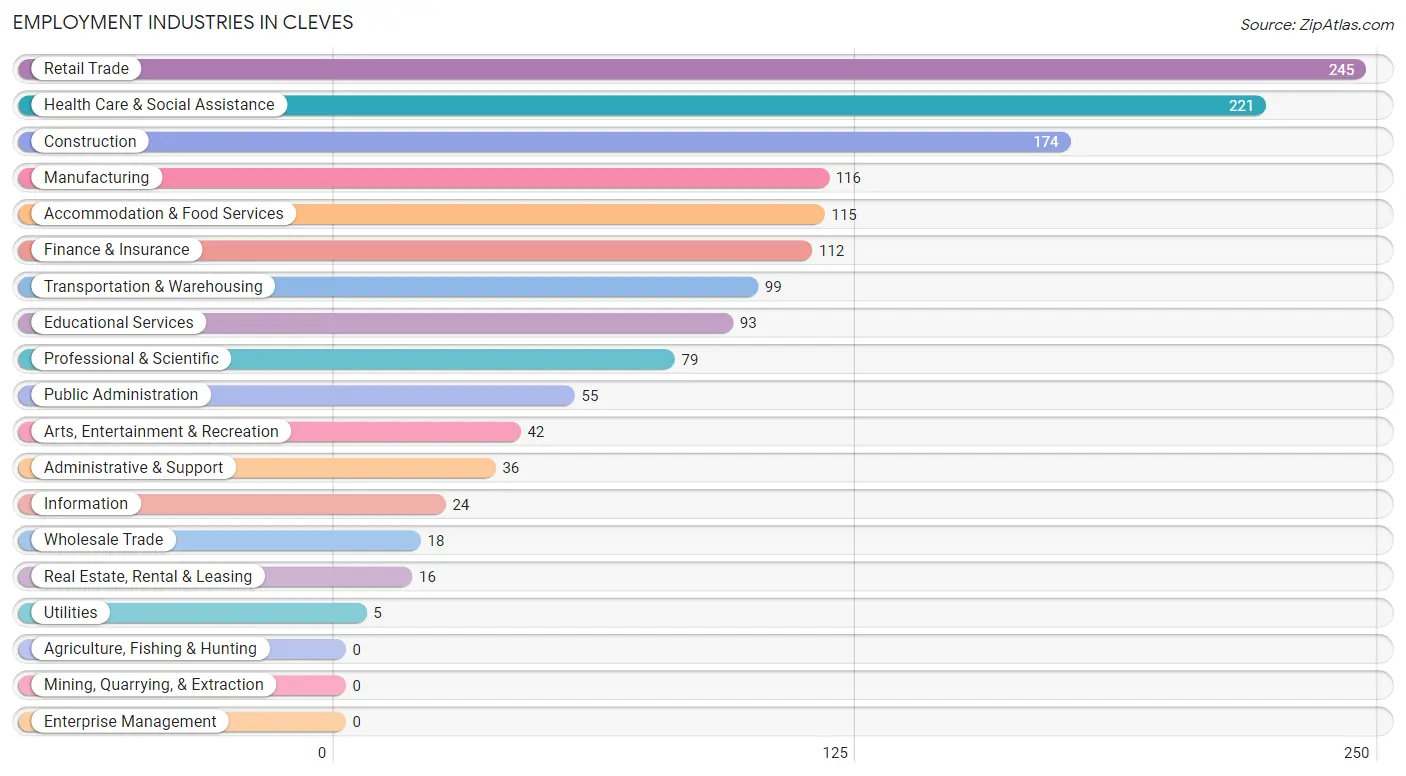
Employment Industries in Cleves
The major employment industries in Cleves include Retail Trade (245 | 15.1%), Health Care & Social Assistance (221 | 13.6%), Construction (174 | 10.7%), Manufacturing (116 | 7.1%), and Accommodation & Food Services (115 | 7.1%).
Employment Industries by Sex in Cleves
The Cleves industries that see more men than women are Utilities (100.0%), Administrative & Support (86.1%), and Construction (85.6%), whereas the industries that tend to have a higher number of women are Information (83.3%), Real Estate, Rental & Leasing (75.0%), and Health Care & Social Assistance (74.2%).
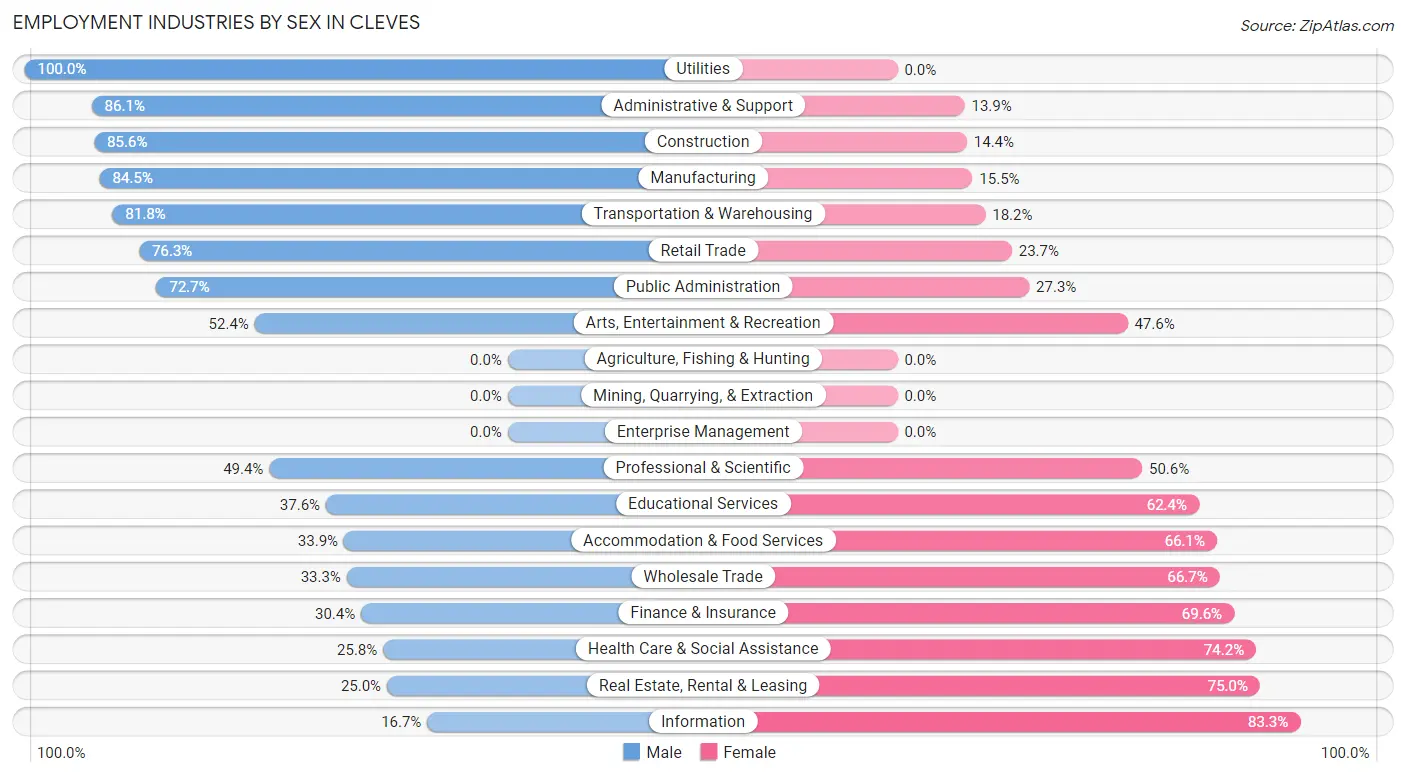
| Industry | Male | Female |
| Agriculture, Fishing & Hunting | 0 (0.0%) | 0 (0.0%) |
| Mining, Quarrying, & Extraction | 0 (0.0%) | 0 (0.0%) |
| Construction | 149 (85.6%) | 25 (14.4%) |
| Manufacturing | 98 (84.5%) | 18 (15.5%) |
| Wholesale Trade | 6 (33.3%) | 12 (66.7%) |
| Retail Trade | 187 (76.3%) | 58 (23.7%) |
| Transportation & Warehousing | 81 (81.8%) | 18 (18.2%) |
| Utilities | 5 (100.0%) | 0 (0.0%) |
| Information | 4 (16.7%) | 20 (83.3%) |
| Finance & Insurance | 34 (30.4%) | 78 (69.6%) |
| Real Estate, Rental & Leasing | 4 (25.0%) | 12 (75.0%) |
| Professional & Scientific | 39 (49.4%) | 40 (50.6%) |
| Enterprise Management | 0 (0.0%) | 0 (0.0%) |
| Administrative & Support | 31 (86.1%) | 5 (13.9%) |
| Educational Services | 35 (37.6%) | 58 (62.4%) |
| Health Care & Social Assistance | 57 (25.8%) | 164 (74.2%) |
| Arts, Entertainment & Recreation | 22 (52.4%) | 20 (47.6%) |
| Accommodation & Food Services | 39 (33.9%) | 76 (66.1%) |
| Public Administration | 40 (72.7%) | 15 (27.3%) |
| Total | 990 (61.0%) | 633 (39.0%) |
Education in Cleves
School Enrollment in Cleves
The most common levels of schooling among the 907 students in Cleves are high school (192 | 21.2%), middle school (182 | 20.1%), and college / undergraduate (176 | 19.4%).
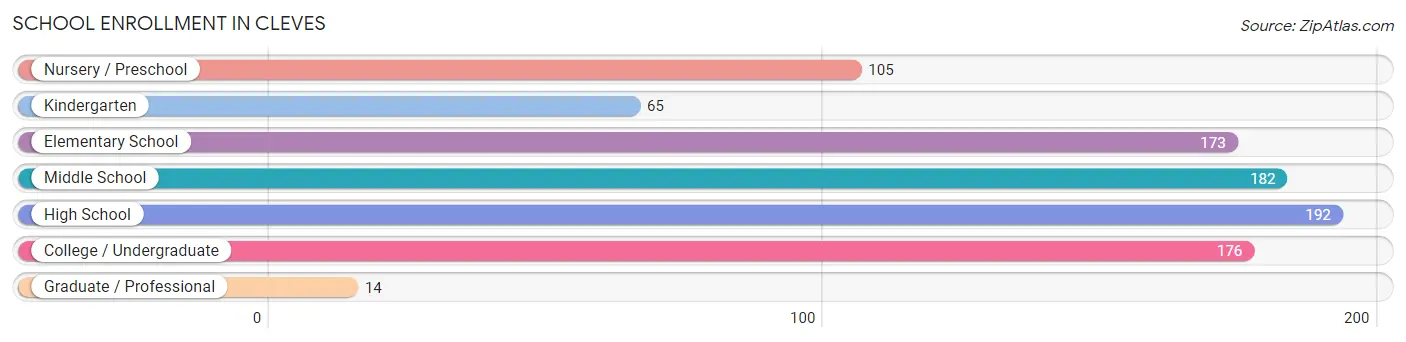
| School Level | # Students | % Students |
| Nursery / Preschool | 105 | 11.6% |
| Kindergarten | 65 | 7.2% |
| Elementary School | 173 | 19.1% |
| Middle School | 182 | 20.1% |
| High School | 192 | 21.2% |
| College / Undergraduate | 176 | 19.4% |
| Graduate / Professional | 14 | 1.5% |
| Total | 907 | 100.0% |
School Enrollment by Age by Funding Source in Cleves
Out of a total of 907 students who are enrolled in schools in Cleves, 220 (24.3%) attend a private institution, while the remaining 687 (75.7%) are enrolled in public schools. The age group of 3 to 4 year olds has the highest likelihood of being enrolled in private schools, with 19 (55.9% in the age bracket) enrolled. Conversely, the age group of 25 to 34 year olds has the lowest likelihood of being enrolled in a private school, with 82 (90.1% in the age bracket) attending a public institution.
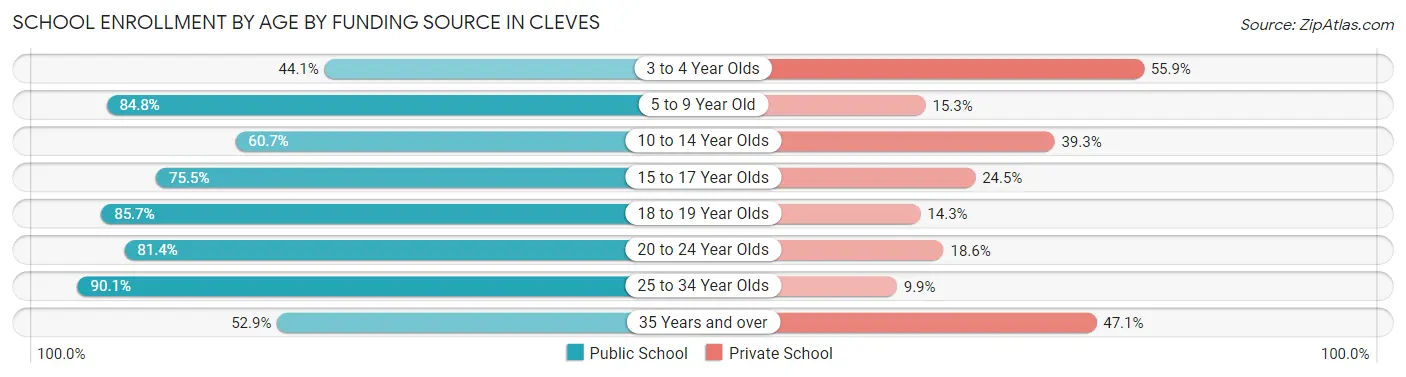
| Age Bracket | Public School | Private School |
| 3 to 4 Year Olds | 15 (44.1%) | 19 (55.9%) |
| 5 to 9 Year Old | 239 (84.8%) | 43 (15.2%) |
| 10 to 14 Year Olds | 133 (60.7%) | 86 (39.3%) |
| 15 to 17 Year Olds | 114 (75.5%) | 37 (24.5%) |
| 18 to 19 Year Olds | 60 (85.7%) | 10 (14.3%) |
| 20 to 24 Year Olds | 35 (81.4%) | 8 (18.6%) |
| 25 to 34 Year Olds | 82 (90.1%) | 9 (9.9%) |
| 35 Years and over | 9 (52.9%) | 8 (47.1%) |
| Total | 687 (75.7%) | 220 (24.3%) |
Educational Attainment by Field of Study in Cleves
Business (143 | 28.8%), science & technology (98 | 19.7%), engineering (39 | 7.9%), education (33 | 6.6%), and arts & humanities (33 | 6.6%) are the most common fields of study among 497 individuals in Cleves who have obtained a bachelor's degree or higher.
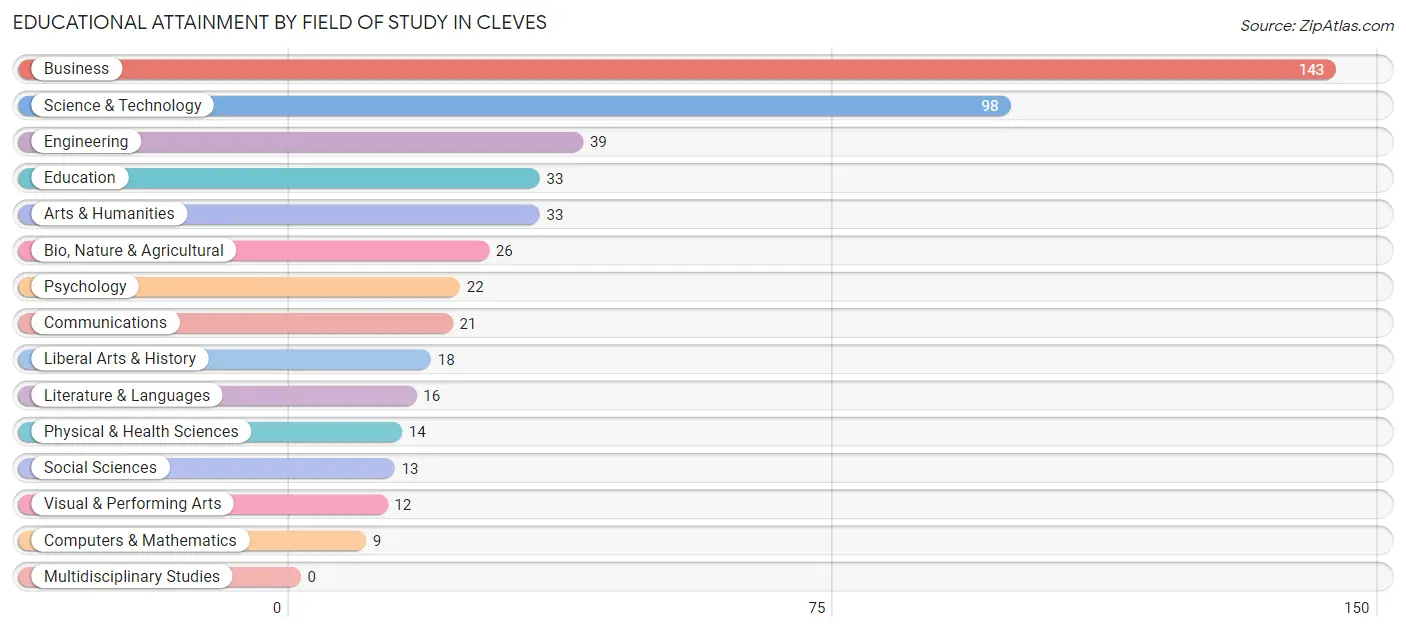
| Field of Study | # Graduates | % Graduates |
| Computers & Mathematics | 9 | 1.8% |
| Bio, Nature & Agricultural | 26 | 5.2% |
| Physical & Health Sciences | 14 | 2.8% |
| Psychology | 22 | 4.4% |
| Social Sciences | 13 | 2.6% |
| Engineering | 39 | 7.9% |
| Multidisciplinary Studies | 0 | 0.0% |
| Science & Technology | 98 | 19.7% |
| Business | 143 | 28.8% |
| Education | 33 | 6.6% |
| Literature & Languages | 16 | 3.2% |
| Liberal Arts & History | 18 | 3.6% |
| Visual & Performing Arts | 12 | 2.4% |
| Communications | 21 | 4.2% |
| Arts & Humanities | 33 | 6.6% |
| Total | 497 | 100.0% |
Transportation & Commute in Cleves
Vehicle Availability by Sex in Cleves
The most prevalent vehicle ownership categories in Cleves are males with 2 vehicles (447, accounting for 46.5%) and females with 2 vehicles (215, making up 73.9%).
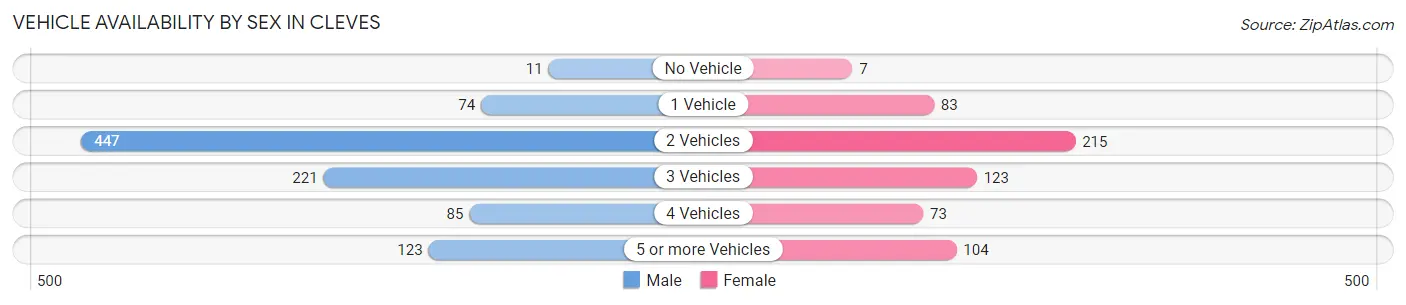
| Vehicles Available | Male | Female |
| No Vehicle | 11 (1.1%) | 7 (1.2%) |
| 1 Vehicle | 74 (7.7%) | 83 (13.7%) |
| 2 Vehicles | 447 (46.5%) | 215 (35.5%) |
| 3 Vehicles | 221 (23.0%) | 123 (20.3%) |
| 4 Vehicles | 85 (8.8%) | 73 (12.1%) |
| 5 or more Vehicles | 123 (12.8%) | 104 (17.2%) |
| Total | 961 (100.0%) | 605 (100.0%) |
Commute Time in Cleves
The most frequently occuring commute durations in Cleves are 30 to 34 minutes (389 commuters, 27.0%), 20 to 24 minutes (260 commuters, 18.0%), and 45 to 59 minutes (127 commuters, 8.8%).
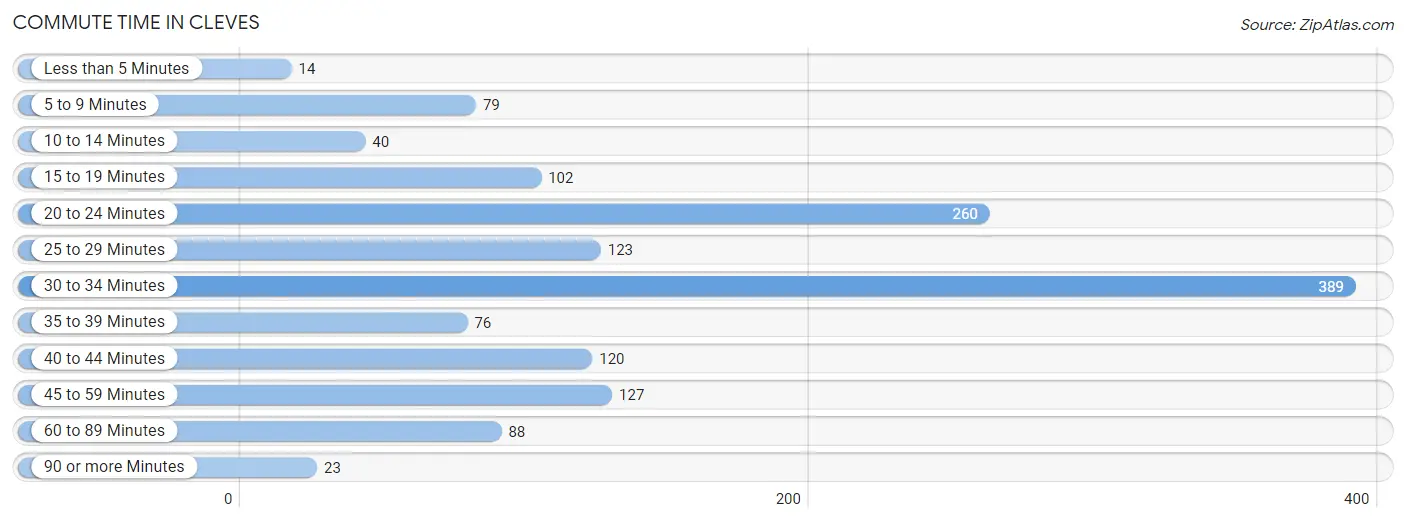
| Commute Time | # Commuters | % Commuters |
| Less than 5 Minutes | 14 | 1.0% |
| 5 to 9 Minutes | 79 | 5.5% |
| 10 to 14 Minutes | 40 | 2.8% |
| 15 to 19 Minutes | 102 | 7.1% |
| 20 to 24 Minutes | 260 | 18.0% |
| 25 to 29 Minutes | 123 | 8.5% |
| 30 to 34 Minutes | 389 | 27.0% |
| 35 to 39 Minutes | 76 | 5.3% |
| 40 to 44 Minutes | 120 | 8.3% |
| 45 to 59 Minutes | 127 | 8.8% |
| 60 to 89 Minutes | 88 | 6.1% |
| 90 or more Minutes | 23 | 1.6% |
Commute Time by Sex in Cleves
The most common commute times in Cleves are 30 to 34 minutes (277 commuters, 31.0%) for males and 20 to 24 minutes (158 commuters, 28.8%) for females.
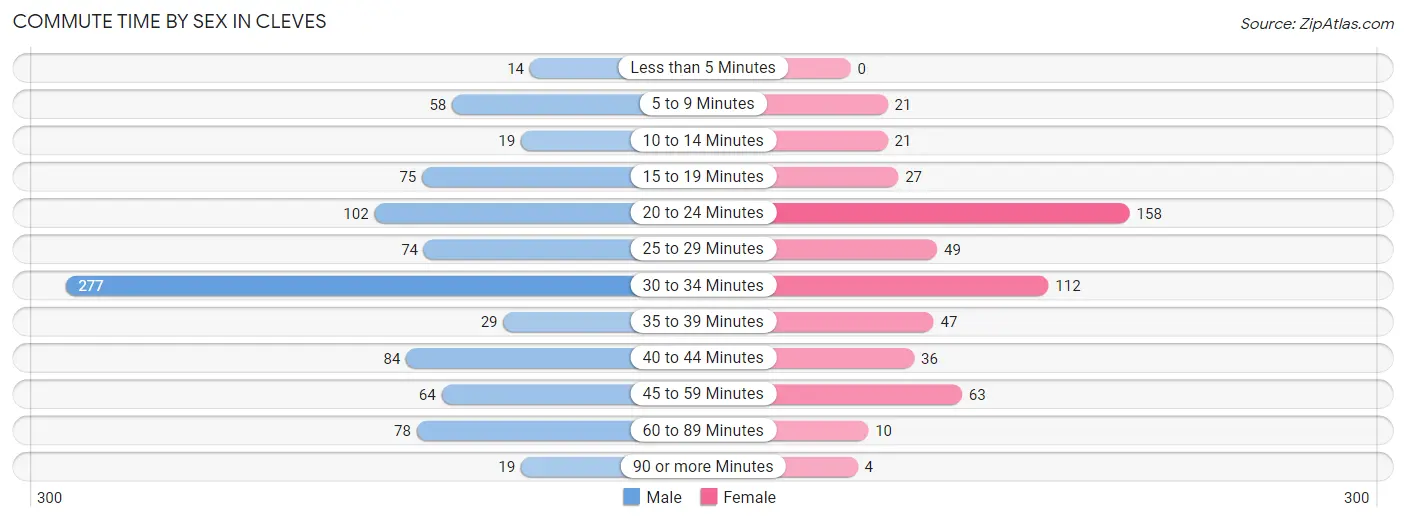
| Commute Time | Male | Female |
| Less than 5 Minutes | 14 (1.6%) | 0 (0.0%) |
| 5 to 9 Minutes | 58 (6.5%) | 21 (3.8%) |
| 10 to 14 Minutes | 19 (2.1%) | 21 (3.8%) |
| 15 to 19 Minutes | 75 (8.4%) | 27 (4.9%) |
| 20 to 24 Minutes | 102 (11.4%) | 158 (28.8%) |
| 25 to 29 Minutes | 74 (8.3%) | 49 (8.9%) |
| 30 to 34 Minutes | 277 (31.0%) | 112 (20.4%) |
| 35 to 39 Minutes | 29 (3.3%) | 47 (8.6%) |
| 40 to 44 Minutes | 84 (9.4%) | 36 (6.6%) |
| 45 to 59 Minutes | 64 (7.2%) | 63 (11.5%) |
| 60 to 89 Minutes | 78 (8.7%) | 10 (1.8%) |
| 90 or more Minutes | 19 (2.1%) | 4 (0.7%) |
Time of Departure to Work by Sex in Cleves
The most frequent times of departure to work in Cleves are 7:30 AM to 7:59 AM (155, 17.4%) for males and 7:30 AM to 7:59 AM (128, 23.4%) for females.
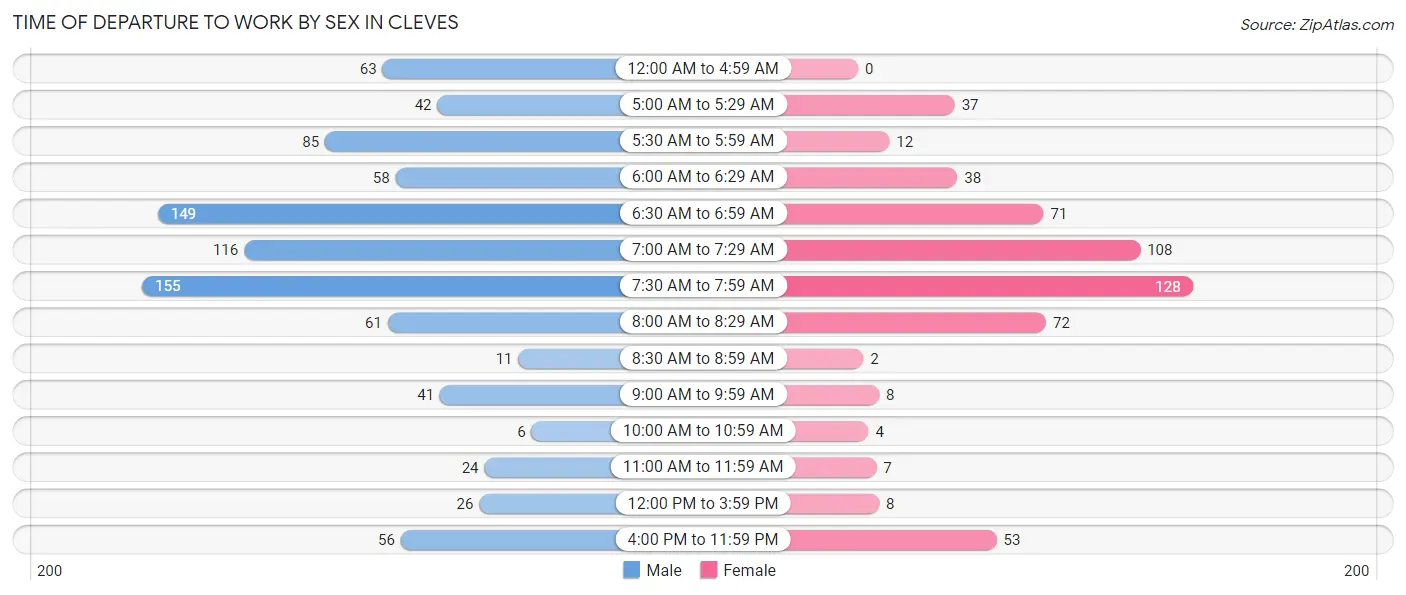
| Time of Departure | Male | Female |
| 12:00 AM to 4:59 AM | 63 (7.0%) | 0 (0.0%) |
| 5:00 AM to 5:29 AM | 42 (4.7%) | 37 (6.8%) |
| 5:30 AM to 5:59 AM | 85 (9.5%) | 12 (2.2%) |
| 6:00 AM to 6:29 AM | 58 (6.5%) | 38 (6.9%) |
| 6:30 AM to 6:59 AM | 149 (16.7%) | 71 (13.0%) |
| 7:00 AM to 7:29 AM | 116 (13.0%) | 108 (19.7%) |
| 7:30 AM to 7:59 AM | 155 (17.4%) | 128 (23.4%) |
| 8:00 AM to 8:29 AM | 61 (6.8%) | 72 (13.1%) |
| 8:30 AM to 8:59 AM | 11 (1.2%) | 2 (0.4%) |
| 9:00 AM to 9:59 AM | 41 (4.6%) | 8 (1.5%) |
| 10:00 AM to 10:59 AM | 6 (0.7%) | 4 (0.7%) |
| 11:00 AM to 11:59 AM | 24 (2.7%) | 7 (1.3%) |
| 12:00 PM to 3:59 PM | 26 (2.9%) | 8 (1.5%) |
| 4:00 PM to 11:59 PM | 56 (6.3%) | 53 (9.7%) |
| Total | 893 (100.0%) | 548 (100.0%) |
Housing Occupancy in Cleves
Occupancy by Ownership in Cleves
Of the total 1,108 dwellings in Cleves, owner-occupied units account for 844 (76.2%), while renter-occupied units make up 264 (23.8%).
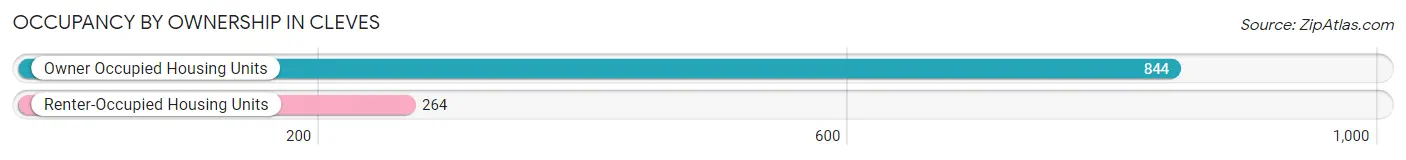
| Occupancy | # Housing Units | % Housing Units |
| Owner Occupied Housing Units | 844 | 76.2% |
| Renter-Occupied Housing Units | 264 | 23.8% |
| Total Occupied Housing Units | 1,108 | 100.0% |
Occupancy by Household Size in Cleves
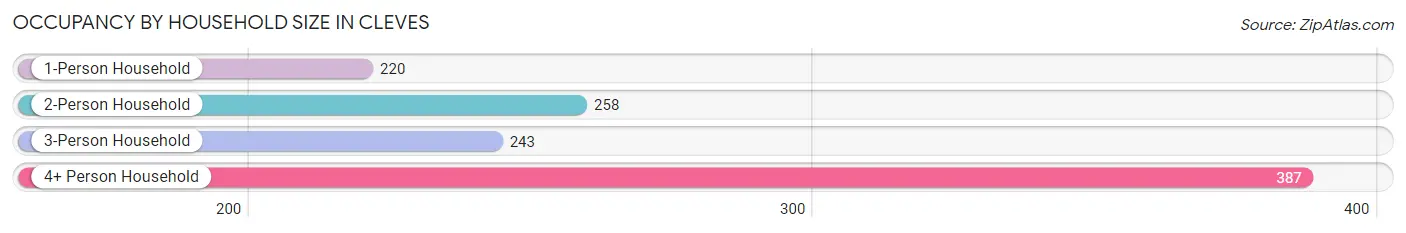
| Household Size | # Housing Units | % Housing Units |
| 1-Person Household | 220 | 19.9% |
| 2-Person Household | 258 | 23.3% |
| 3-Person Household | 243 | 21.9% |
| 4+ Person Household | 387 | 34.9% |
| Total Housing Units | 1,108 | 100.0% |
Occupancy by Ownership by Household Size in Cleves
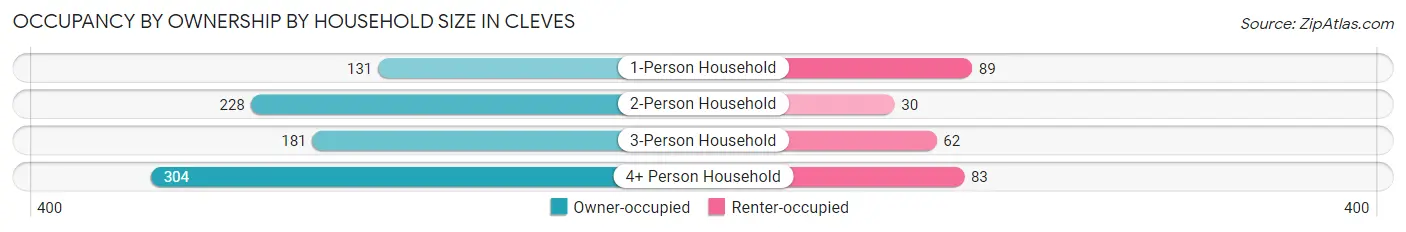
| Household Size | Owner-occupied | Renter-occupied |
| 1-Person Household | 131 (59.6%) | 89 (40.5%) |
| 2-Person Household | 228 (88.4%) | 30 (11.6%) |
| 3-Person Household | 181 (74.5%) | 62 (25.5%) |
| 4+ Person Household | 304 (78.5%) | 83 (21.4%) |
| Total Housing Units | 844 (76.2%) | 264 (23.8%) |
Occupancy by Educational Attainment in Cleves
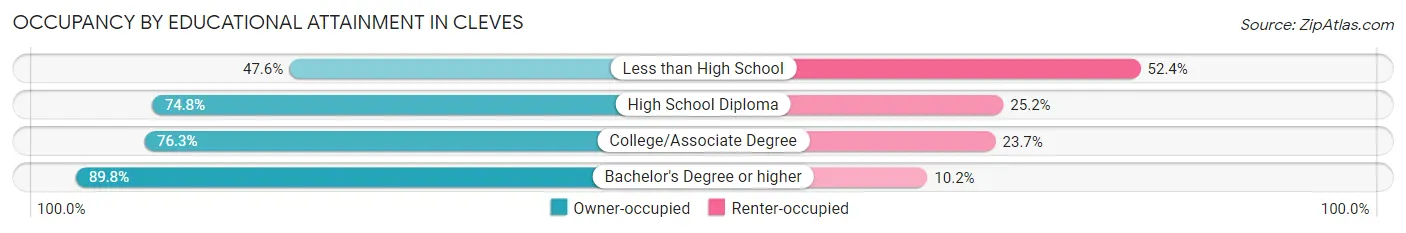
| Household Size | Owner-occupied | Renter-occupied |
| Less than High School | 49 (47.6%) | 54 (52.4%) |
| High School Diploma | 320 (74.8%) | 108 (25.2%) |
| College/Associate Degree | 245 (76.3%) | 76 (23.7%) |
| Bachelor's Degree or higher | 230 (89.8%) | 26 (10.2%) |
Occupancy by Age of Householder in Cleves
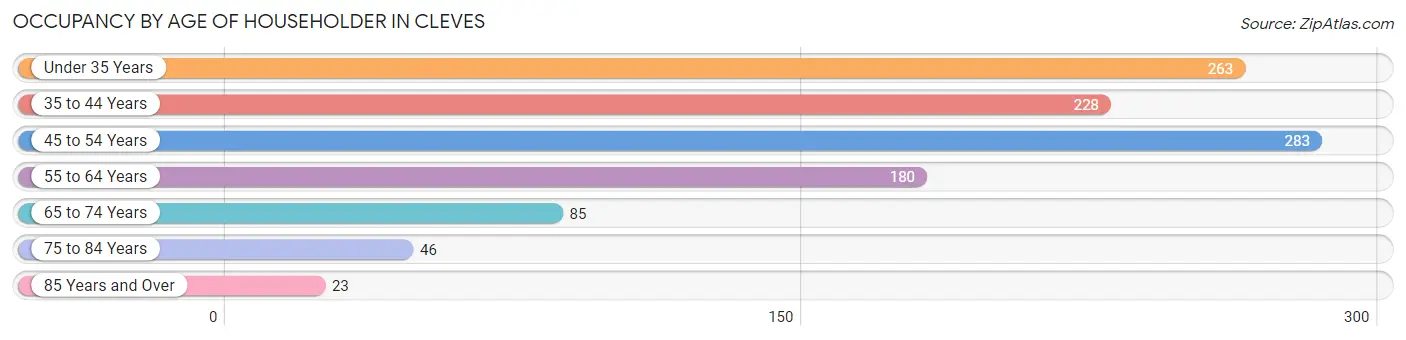
| Age Bracket | # Households | % Households |
| Under 35 Years | 263 | 23.7% |
| 35 to 44 Years | 228 | 20.6% |
| 45 to 54 Years | 283 | 25.5% |
| 55 to 64 Years | 180 | 16.3% |
| 65 to 74 Years | 85 | 7.7% |
| 75 to 84 Years | 46 | 4.2% |
| 85 Years and Over | 23 | 2.1% |
| Total | 1,108 | 100.0% |
Housing Finances in Cleves
Median Income by Occupancy in Cleves
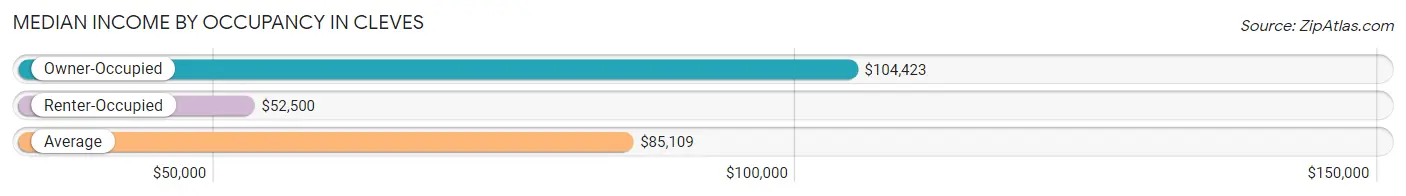
| Occupancy Type | # Households | Median Income |
| Owner-Occupied | 844 (76.2%) | $104,423 |
| Renter-Occupied | 264 (23.8%) | $52,500 |
| Average | 1,108 (100.0%) | $85,109 |
Occupancy by Householder Income Bracket in Cleves
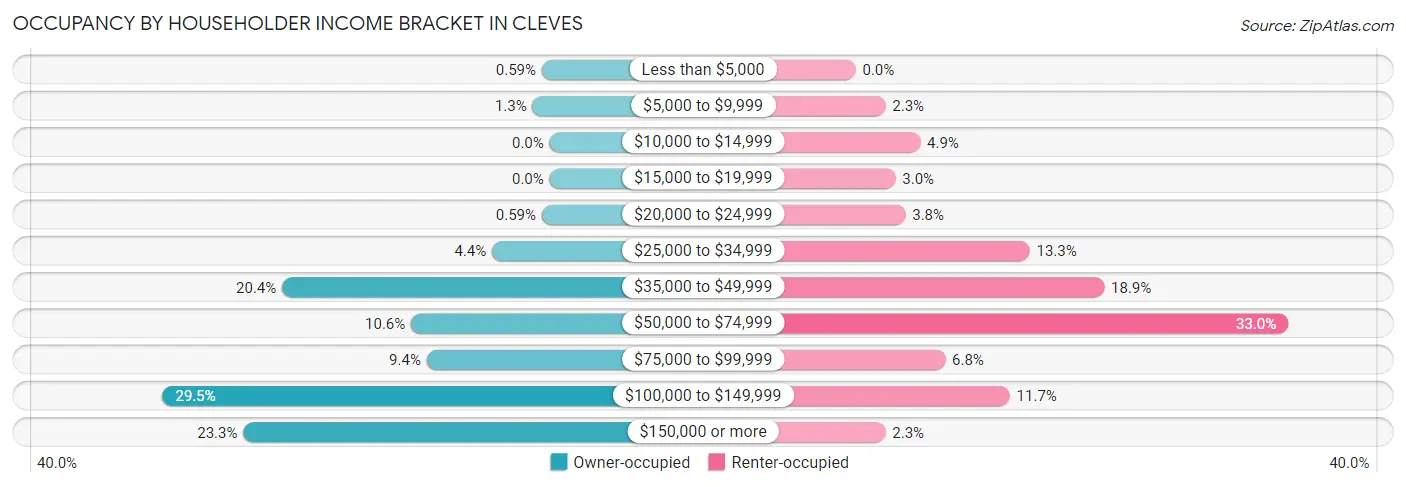
| Income Bracket | Owner-occupied | Renter-occupied |
| Less than $5,000 | 5 (0.6%) | 0 (0.0%) |
| $5,000 to $9,999 | 11 (1.3%) | 6 (2.3%) |
| $10,000 to $14,999 | 0 (0.0%) | 13 (4.9%) |
| $15,000 to $19,999 | 0 (0.0%) | 8 (3.0%) |
| $20,000 to $24,999 | 5 (0.6%) | 10 (3.8%) |
| $25,000 to $34,999 | 37 (4.4%) | 35 (13.3%) |
| $35,000 to $49,999 | 172 (20.4%) | 50 (18.9%) |
| $50,000 to $74,999 | 89 (10.5%) | 87 (33.0%) |
| $75,000 to $99,999 | 79 (9.4%) | 18 (6.8%) |
| $100,000 to $149,999 | 249 (29.5%) | 31 (11.7%) |
| $150,000 or more | 197 (23.3%) | 6 (2.3%) |
| Total | 844 (100.0%) | 264 (100.0%) |
Monthly Housing Cost Tiers in Cleves
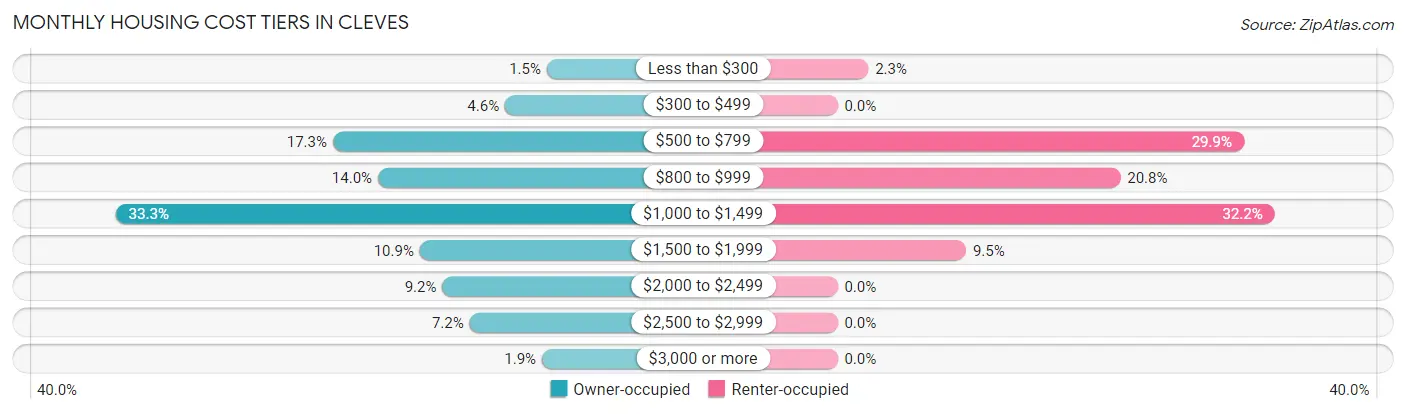
| Monthly Cost | Owner-occupied | Renter-occupied |
| Less than $300 | 13 (1.5%) | 6 (2.3%) |
| $300 to $499 | 39 (4.6%) | 0 (0.0%) |
| $500 to $799 | 146 (17.3%) | 79 (29.9%) |
| $800 to $999 | 118 (14.0%) | 55 (20.8%) |
| $1,000 to $1,499 | 281 (33.3%) | 85 (32.2%) |
| $1,500 to $1,999 | 92 (10.9%) | 25 (9.5%) |
| $2,000 to $2,499 | 78 (9.2%) | 0 (0.0%) |
| $2,500 to $2,999 | 61 (7.2%) | 0 (0.0%) |
| $3,000 or more | 16 (1.9%) | 0 (0.0%) |
| Total | 844 (100.0%) | 264 (100.0%) |
Physical Housing Characteristics in Cleves
Housing Structures in Cleves
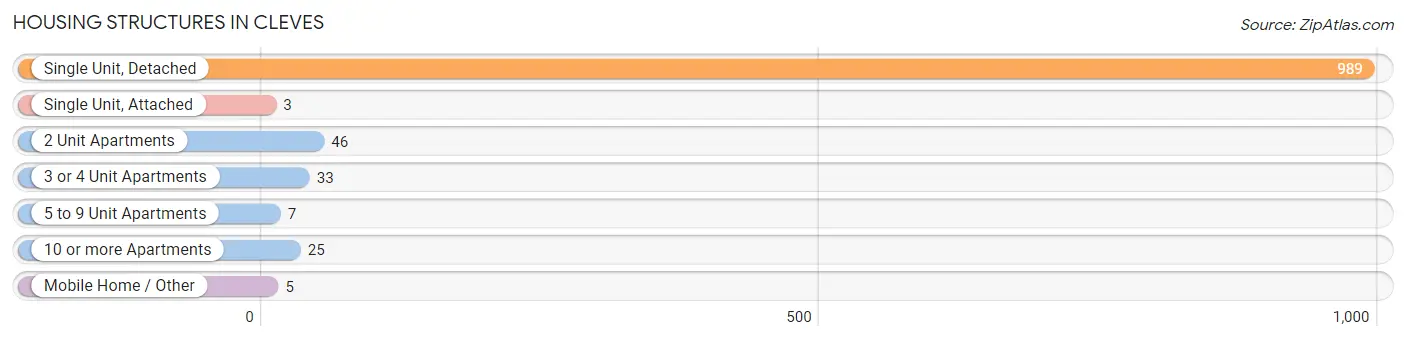
| Structure Type | # Housing Units | % Housing Units |
| Single Unit, Detached | 989 | 89.3% |
| Single Unit, Attached | 3 | 0.3% |
| 2 Unit Apartments | 46 | 4.2% |
| 3 or 4 Unit Apartments | 33 | 3.0% |
| 5 to 9 Unit Apartments | 7 | 0.6% |
| 10 or more Apartments | 25 | 2.3% |
| Mobile Home / Other | 5 | 0.4% |
| Total | 1,108 | 100.0% |
Housing Structures by Occupancy in Cleves
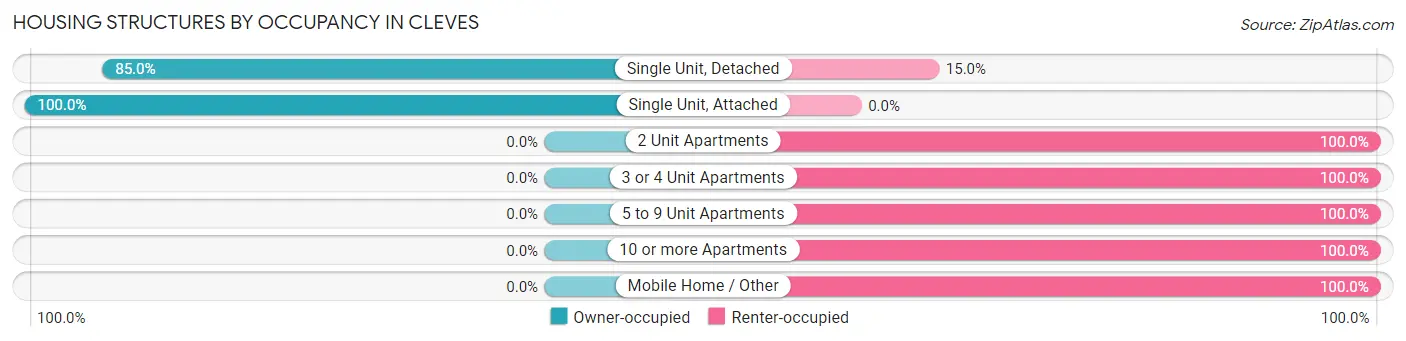
| Structure Type | Owner-occupied | Renter-occupied |
| Single Unit, Detached | 841 (85.0%) | 148 (15.0%) |
| Single Unit, Attached | 3 (100.0%) | 0 (0.0%) |
| 2 Unit Apartments | 0 (0.0%) | 46 (100.0%) |
| 3 or 4 Unit Apartments | 0 (0.0%) | 33 (100.0%) |
| 5 to 9 Unit Apartments | 0 (0.0%) | 7 (100.0%) |
| 10 or more Apartments | 0 (0.0%) | 25 (100.0%) |
| Mobile Home / Other | 0 (0.0%) | 5 (100.0%) |
| Total | 844 (76.2%) | 264 (23.8%) |
Housing Structures by Number of Rooms in Cleves
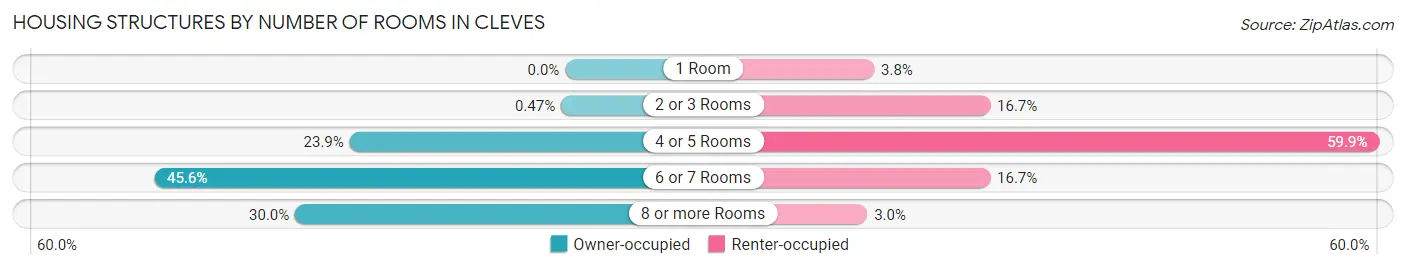
| Number of Rooms | Owner-occupied | Renter-occupied |
| 1 Room | 0 (0.0%) | 10 (3.8%) |
| 2 or 3 Rooms | 4 (0.5%) | 44 (16.7%) |
| 4 or 5 Rooms | 202 (23.9%) | 158 (59.9%) |
| 6 or 7 Rooms | 385 (45.6%) | 44 (16.7%) |
| 8 or more Rooms | 253 (30.0%) | 8 (3.0%) |
| Total | 844 (100.0%) | 264 (100.0%) |
Housing Structure by Heating Type in Cleves
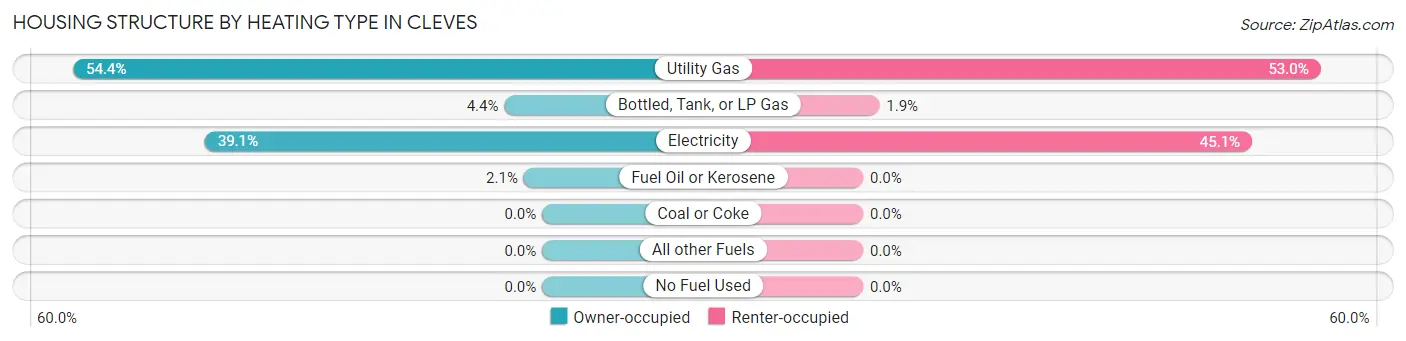
| Heating Type | Owner-occupied | Renter-occupied |
| Utility Gas | 459 (54.4%) | 140 (53.0%) |
| Bottled, Tank, or LP Gas | 37 (4.4%) | 5 (1.9%) |
| Electricity | 330 (39.1%) | 119 (45.1%) |
| Fuel Oil or Kerosene | 18 (2.1%) | 0 (0.0%) |
| Coal or Coke | 0 (0.0%) | 0 (0.0%) |
| All other Fuels | 0 (0.0%) | 0 (0.0%) |
| No Fuel Used | 0 (0.0%) | 0 (0.0%) |
| Total | 844 (100.0%) | 264 (100.0%) |
Household Vehicle Usage in Cleves
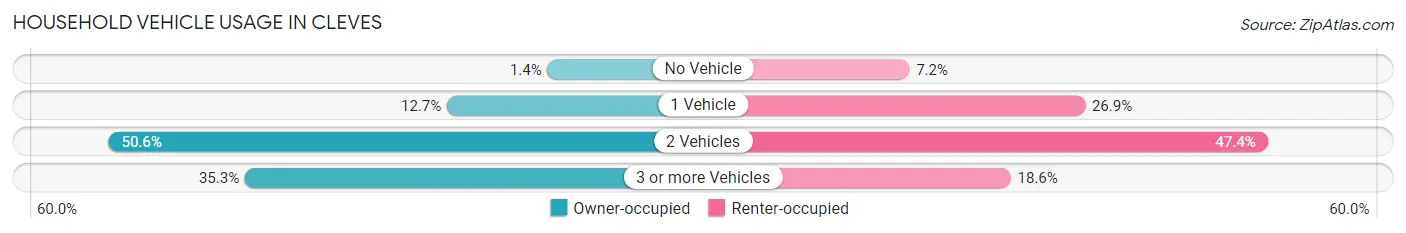
| Vehicles per Household | Owner-occupied | Renter-occupied |
| No Vehicle | 12 (1.4%) | 19 (7.2%) |
| 1 Vehicle | 107 (12.7%) | 71 (26.9%) |
| 2 Vehicles | 427 (50.6%) | 125 (47.3%) |
| 3 or more Vehicles | 298 (35.3%) | 49 (18.6%) |
| Total | 844 (100.0%) | 264 (100.0%) |
Real Estate & Mortgages in Cleves
Real Estate and Mortgage Overview in Cleves
| Characteristic | Without Mortgage | With Mortgage |
| Housing Units | 179 | 665 |
| Median Property Value | $204,400 | $145,200 |
| Median Household Income | $95,417 | $165 |
| Monthly Housing Costs | $704 | $16 |
| Real Estate Taxes | $2,864 | $4 |
Property Value by Mortgage Status in Cleves
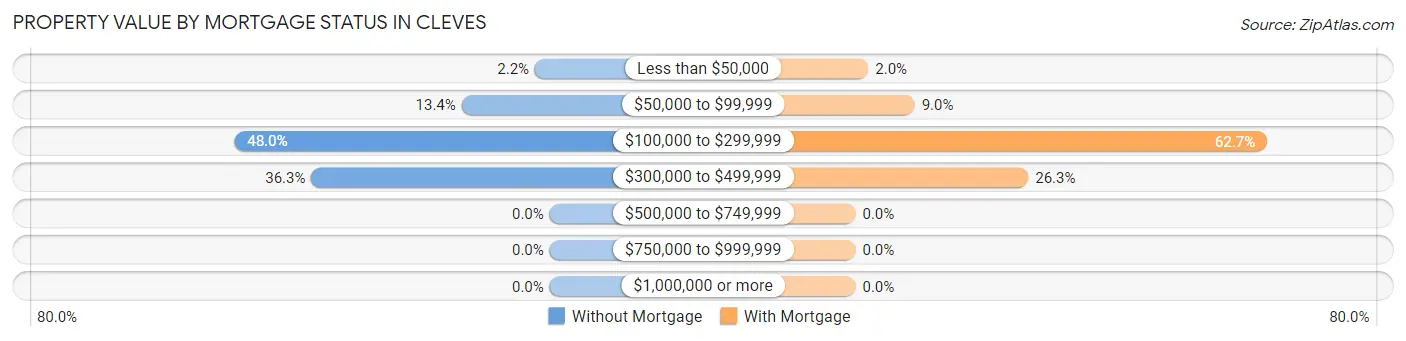
| Property Value | Without Mortgage | With Mortgage |
| Less than $50,000 | 4 (2.2%) | 13 (1.9%) |
| $50,000 to $99,999 | 24 (13.4%) | 60 (9.0%) |
| $100,000 to $299,999 | 86 (48.0%) | 417 (62.7%) |
| $300,000 to $499,999 | 65 (36.3%) | 175 (26.3%) |
| $500,000 to $749,999 | 0 (0.0%) | 0 (0.0%) |
| $750,000 to $999,999 | 0 (0.0%) | 0 (0.0%) |
| $1,000,000 or more | 0 (0.0%) | 0 (0.0%) |
| Total | 179 (100.0%) | 665 (100.0%) |
Household Income by Mortgage Status in Cleves
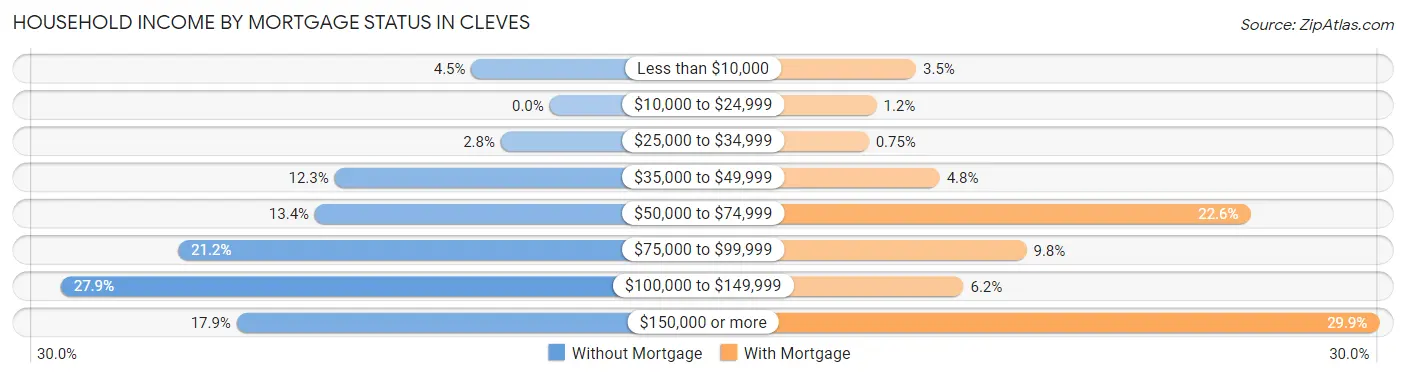
| Household Income | Without Mortgage | With Mortgage |
| Less than $10,000 | 8 (4.5%) | 23 (3.5%) |
| $10,000 to $24,999 | 0 (0.0%) | 8 (1.2%) |
| $25,000 to $34,999 | 5 (2.8%) | 5 (0.7%) |
| $35,000 to $49,999 | 22 (12.3%) | 32 (4.8%) |
| $50,000 to $74,999 | 24 (13.4%) | 150 (22.6%) |
| $75,000 to $99,999 | 38 (21.2%) | 65 (9.8%) |
| $100,000 to $149,999 | 50 (27.9%) | 41 (6.2%) |
| $150,000 or more | 32 (17.9%) | 199 (29.9%) |
| Total | 179 (100.0%) | 665 (100.0%) |
Property Value to Household Income Ratio in Cleves
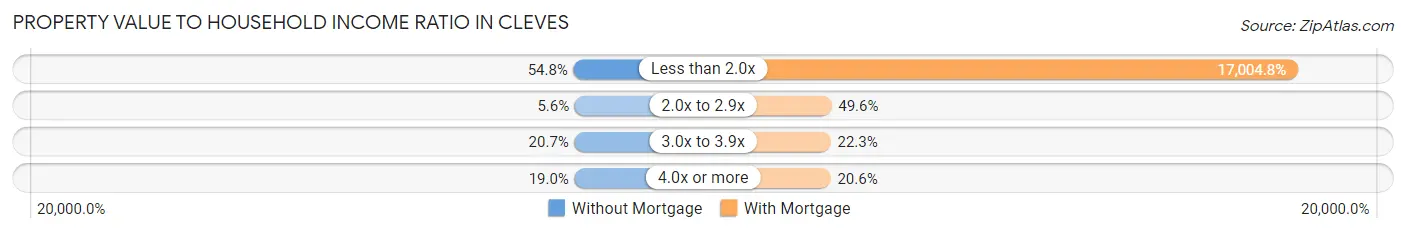
| Value-to-Income Ratio | Without Mortgage | With Mortgage |
| Less than 2.0x | 98 (54.7%) | 113,082 (17,004.8%) |
| 2.0x to 2.9x | 10 (5.6%) | 330 (49.6%) |
| 3.0x to 3.9x | 37 (20.7%) | 148 (22.3%) |
| 4.0x or more | 34 (19.0%) | 137 (20.6%) |
| Total | 179 (100.0%) | 665 (100.0%) |
Real Estate Taxes by Mortgage Status in Cleves
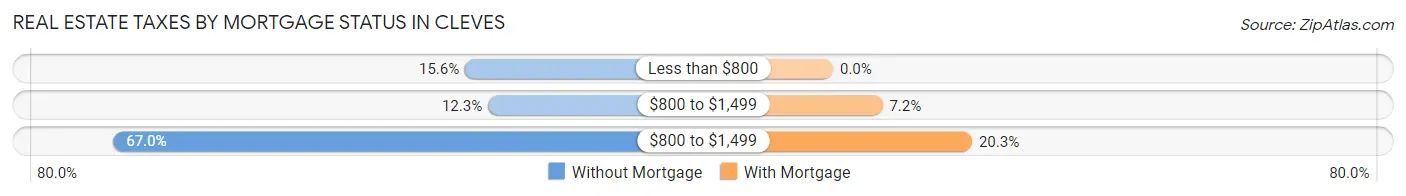
| Property Taxes | Without Mortgage | With Mortgage |
| Less than $800 | 28 (15.6%) | 0 (0.0%) |
| $800 to $1,499 | 22 (12.3%) | 48 (7.2%) |
| $800 to $1,499 | 120 (67.0%) | 135 (20.3%) |
| Total | 179 (100.0%) | 665 (100.0%) |
Health & Disability in Cleves
Health Insurance Coverage by Age in Cleves
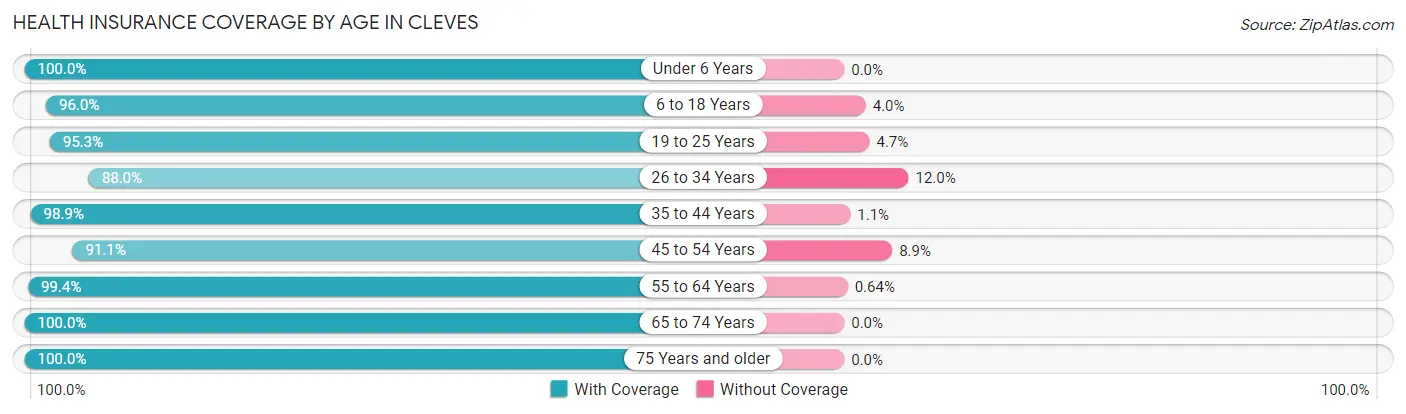
| Age Bracket | With Coverage | Without Coverage |
| Under 6 Years | 538 (100.0%) | 0 (0.0%) |
| 6 to 18 Years | 575 (96.0%) | 24 (4.0%) |
| 19 to 25 Years | 364 (95.3%) | 18 (4.7%) |
| 26 to 34 Years | 367 (88.0%) | 50 (12.0%) |
| 35 to 44 Years | 439 (98.9%) | 5 (1.1%) |
| 45 to 54 Years | 428 (91.1%) | 42 (8.9%) |
| 55 to 64 Years | 309 (99.4%) | 2 (0.6%) |
| 65 to 74 Years | 137 (100.0%) | 0 (0.0%) |
| 75 Years and older | 97 (100.0%) | 0 (0.0%) |
| Total | 3,254 (95.9%) | 141 (4.2%) |
Health Insurance Coverage by Citizenship Status in Cleves
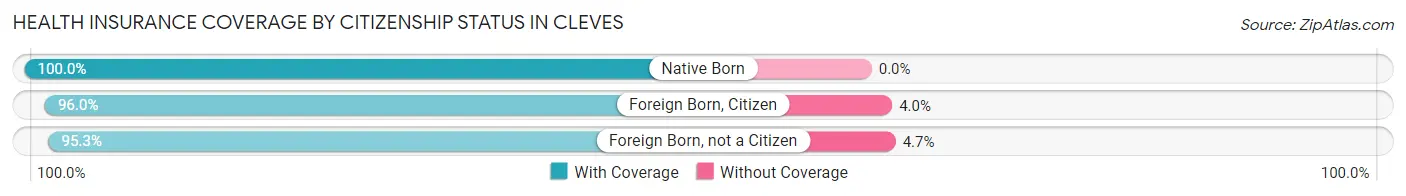
| Citizenship Status | With Coverage | Without Coverage |
| Native Born | 538 (100.0%) | 0 (0.0%) |
| Foreign Born, Citizen | 575 (96.0%) | 24 (4.0%) |
| Foreign Born, not a Citizen | 364 (95.3%) | 18 (4.7%) |
Health Insurance Coverage by Household Income in Cleves
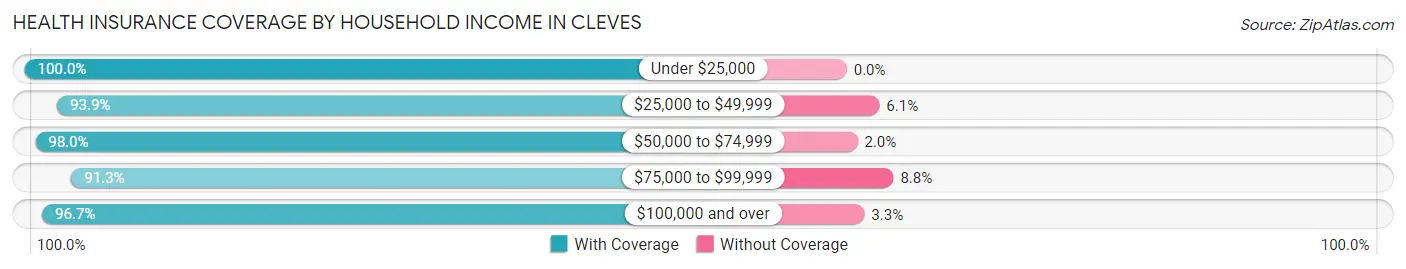
| Household Income | With Coverage | Without Coverage |
| Under $25,000 | 78 (100.0%) | 0 (0.0%) |
| $25,000 to $49,999 | 769 (93.9%) | 50 (6.1%) |
| $50,000 to $74,999 | 438 (98.0%) | 9 (2.0%) |
| $75,000 to $99,999 | 240 (91.2%) | 23 (8.7%) |
| $100,000 and over | 1,729 (96.7%) | 59 (3.3%) |
Public vs Private Health Insurance Coverage by Age in Cleves
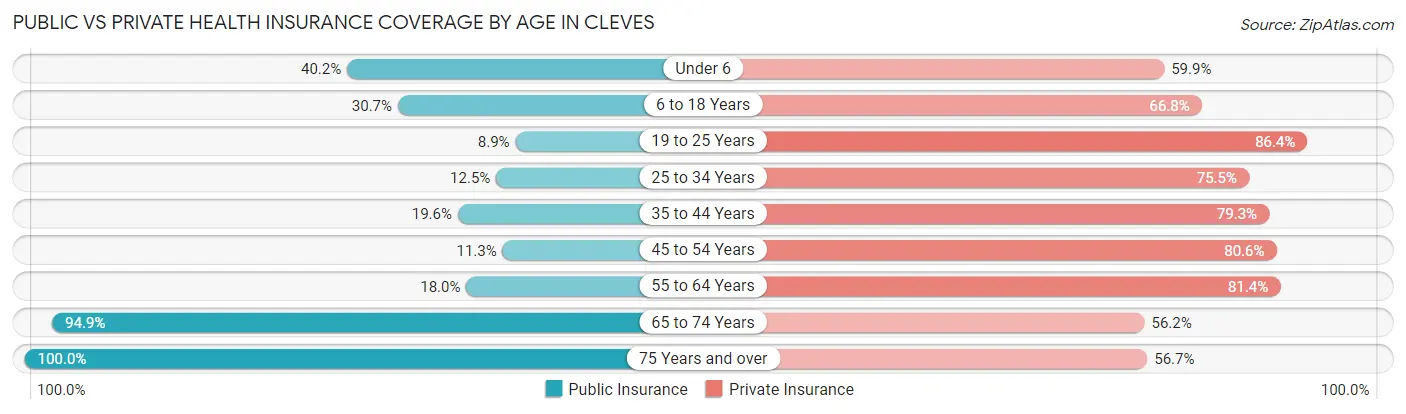
| Age Bracket | Public Insurance | Private Insurance |
| Under 6 | 216 (40.2%) | 322 (59.9%) |
| 6 to 18 Years | 184 (30.7%) | 400 (66.8%) |
| 19 to 25 Years | 34 (8.9%) | 330 (86.4%) |
| 25 to 34 Years | 52 (12.5%) | 315 (75.5%) |
| 35 to 44 Years | 87 (19.6%) | 352 (79.3%) |
| 45 to 54 Years | 53 (11.3%) | 379 (80.6%) |
| 55 to 64 Years | 56 (18.0%) | 253 (81.4%) |
| 65 to 74 Years | 130 (94.9%) | 77 (56.2%) |
| 75 Years and over | 97 (100.0%) | 55 (56.7%) |
| Total | 909 (26.8%) | 2,483 (73.1%) |
Disability Status by Sex by Age in Cleves
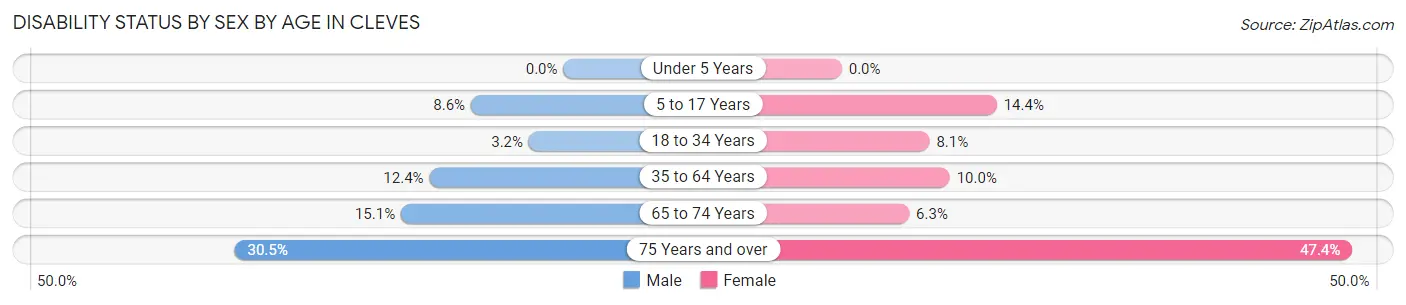
| Age Bracket | Male | Female |
| Under 5 Years | 0 (0.0%) | 0 (0.0%) |
| 5 to 17 Years | 32 (8.6%) | 43 (14.4%) |
| 18 to 34 Years | 13 (3.2%) | 35 (8.1%) |
| 35 to 64 Years | 84 (12.4%) | 55 (10.0%) |
| 65 to 74 Years | 11 (15.1%) | 4 (6.2%) |
| 75 Years and over | 18 (30.5%) | 18 (47.4%) |
Disability Class by Sex by Age in Cleves
Disability Class: Hearing Difficulty
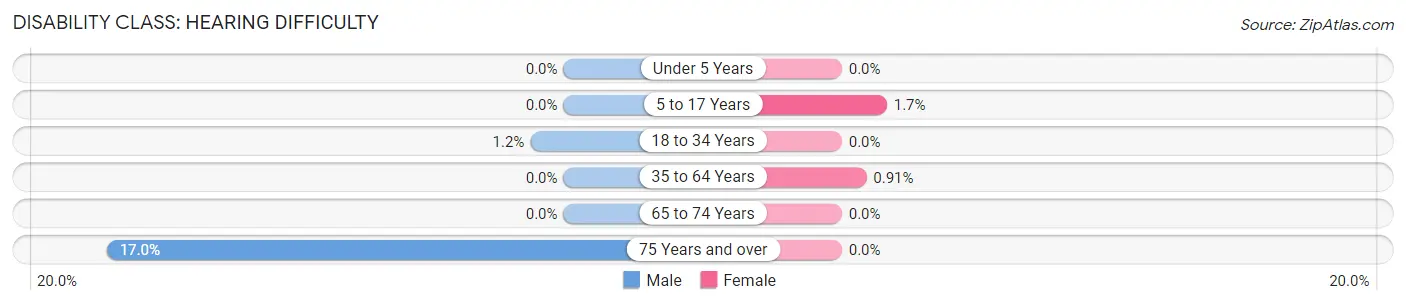
| Age Bracket | Male | Female |
| Under 5 Years | 0 (0.0%) | 0 (0.0%) |
| 5 to 17 Years | 0 (0.0%) | 5 (1.7%) |
| 18 to 34 Years | 5 (1.2%) | 0 (0.0%) |
| 35 to 64 Years | 0 (0.0%) | 5 (0.9%) |
| 65 to 74 Years | 0 (0.0%) | 0 (0.0%) |
| 75 Years and over | 10 (17.0%) | 0 (0.0%) |
Disability Class: Vision Difficulty
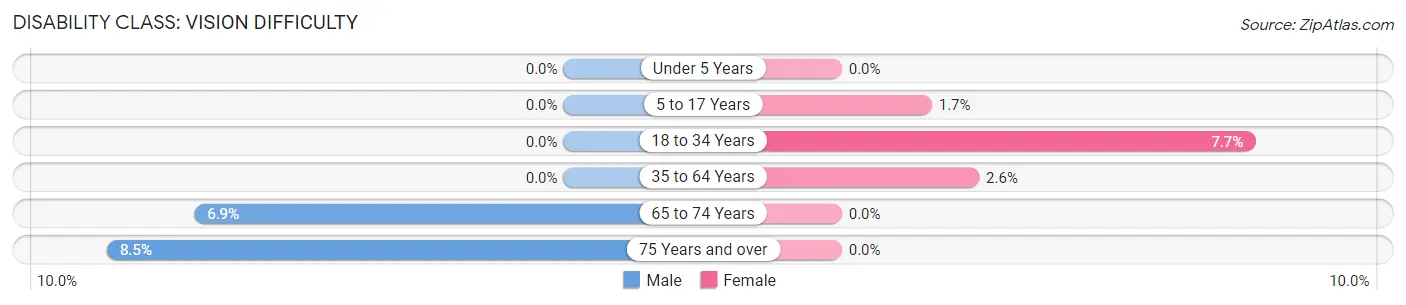
| Age Bracket | Male | Female |
| Under 5 Years | 0 (0.0%) | 0 (0.0%) |
| 5 to 17 Years | 0 (0.0%) | 5 (1.7%) |
| 18 to 34 Years | 0 (0.0%) | 33 (7.7%) |
| 35 to 64 Years | 0 (0.0%) | 14 (2.5%) |
| 65 to 74 Years | 5 (6.9%) | 0 (0.0%) |
| 75 Years and over | 5 (8.5%) | 0 (0.0%) |
Disability Class: Cognitive Difficulty
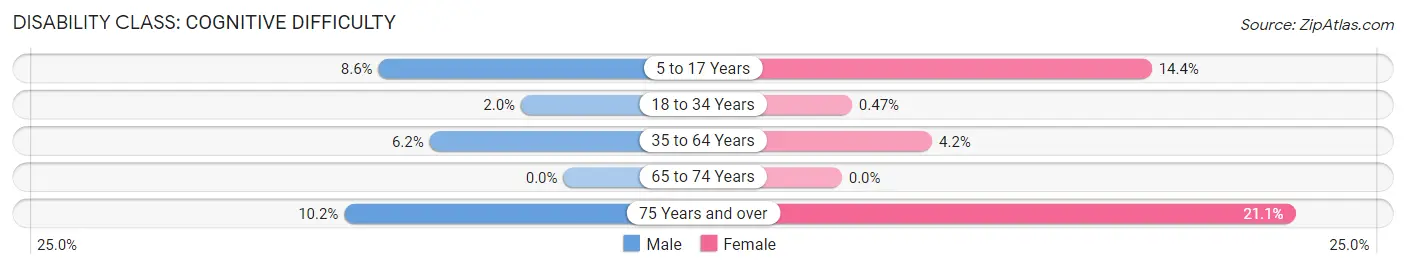
| Age Bracket | Male | Female |
| 5 to 17 Years | 32 (8.6%) | 43 (14.4%) |
| 18 to 34 Years | 8 (2.0%) | 2 (0.5%) |
| 35 to 64 Years | 42 (6.2%) | 23 (4.2%) |
| 65 to 74 Years | 0 (0.0%) | 0 (0.0%) |
| 75 Years and over | 6 (10.2%) | 8 (21.0%) |
Disability Class: Ambulatory Difficulty
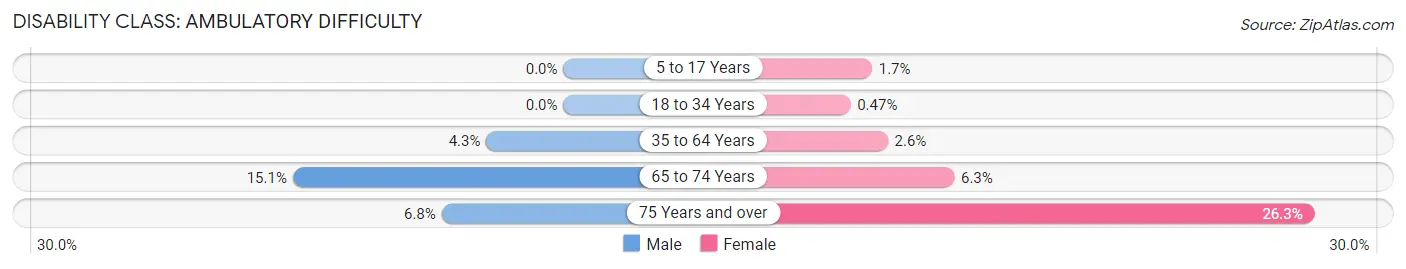
| Age Bracket | Male | Female |
| 5 to 17 Years | 0 (0.0%) | 5 (1.7%) |
| 18 to 34 Years | 0 (0.0%) | 2 (0.5%) |
| 35 to 64 Years | 29 (4.3%) | 14 (2.5%) |
| 65 to 74 Years | 11 (15.1%) | 4 (6.2%) |
| 75 Years and over | 4 (6.8%) | 10 (26.3%) |
Disability Class: Self-Care Difficulty
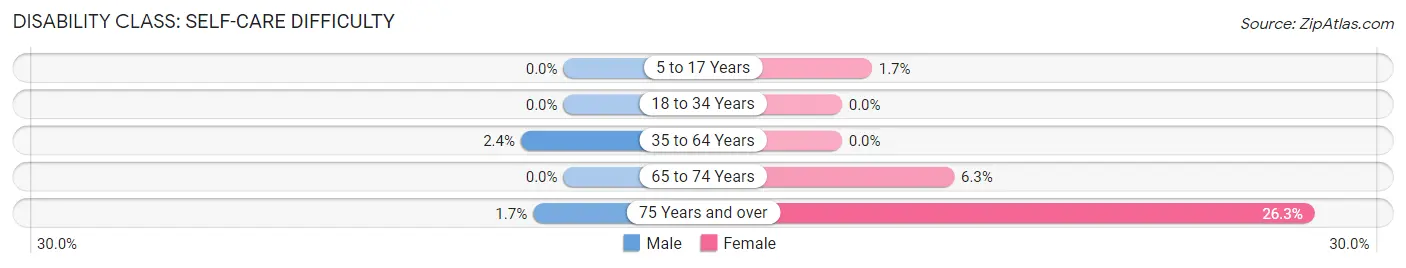
| Age Bracket | Male | Female |
| 5 to 17 Years | 0 (0.0%) | 5 (1.7%) |
| 18 to 34 Years | 0 (0.0%) | 0 (0.0%) |
| 35 to 64 Years | 16 (2.4%) | 0 (0.0%) |
| 65 to 74 Years | 0 (0.0%) | 4 (6.2%) |
| 75 Years and over | 1 (1.7%) | 10 (26.3%) |
Technology Access in Cleves
Computing Device Access in Cleves
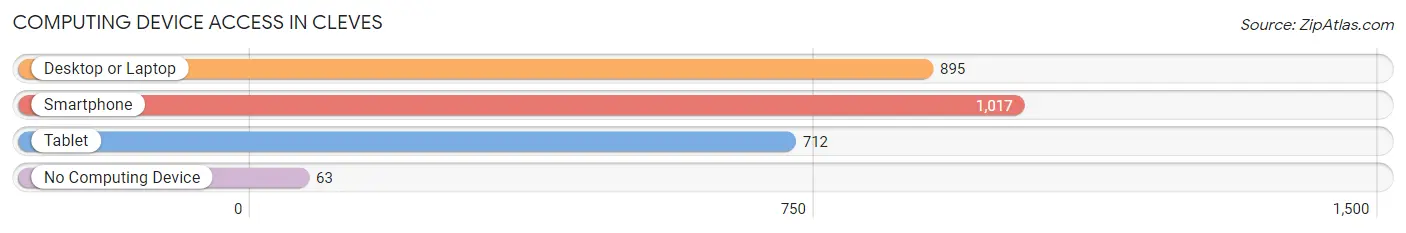
| Device Type | # Households | % Households |
| Desktop or Laptop | 895 | 80.8% |
| Smartphone | 1,017 | 91.8% |
| Tablet | 712 | 64.3% |
| No Computing Device | 63 | 5.7% |
| Total | 1,108 | 100.0% |
Internet Access in Cleves
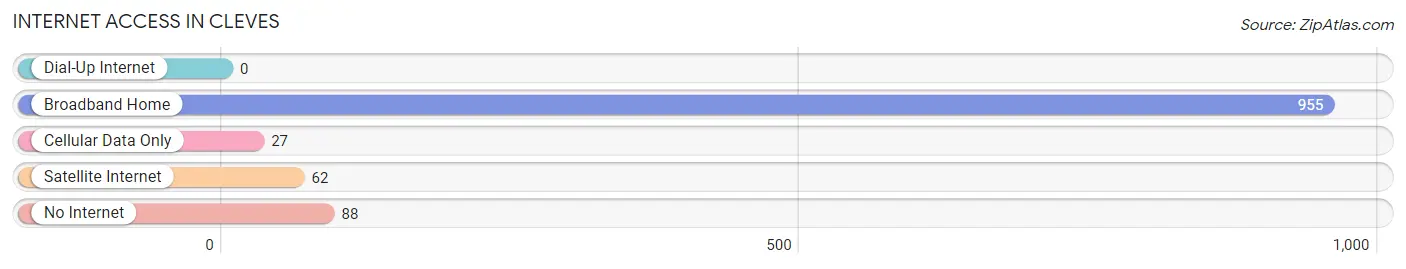
| Internet Type | # Households | % Households |
| Dial-Up Internet | 0 | 0.0% |
| Broadband Home | 955 | 86.2% |
| Cellular Data Only | 27 | 2.4% |
| Satellite Internet | 62 | 5.6% |
| No Internet | 88 | 7.9% |
| Total | 1,108 | 100.0% |
Cleves Summary
Cleves, Ohio is a small village located in Hamilton County, Ohio. It is situated on the banks of the Ohio River, just north of Cincinnati. The village was founded in 1817 and has a population of approximately 2,000 people.
History
The area that is now Cleves was originally inhabited by the Miami tribe of Native Americans. The first white settlers arrived in the area in the late 1700s. The village was founded in 1817 by John Cleves Symmes, a Revolutionary War veteran and land speculator. He named the village after his father, John Cleves Symmes Jr. The village was incorporated in 1845.
In the early 1900s, the village was a popular destination for tourists. It was known for its scenic views of the Ohio River and its many parks and recreational areas. The village also had a thriving business district, with several stores, restaurants, and other businesses.
Geography
Cleves is located in Hamilton County, Ohio, on the banks of the Ohio River. It is situated just north of Cincinnati. The village is bordered by the cities of North Bend, Addyston, and Harrison. The village covers an area of 1.2 square miles and has a population of approximately 2,000 people.
The terrain of the village is mostly flat, with some rolling hills. The climate is humid continental, with hot summers and cold winters. The average annual temperature is around 50 degrees Fahrenheit.
Economy
The economy of Cleves is largely based on agriculture and manufacturing. The village is home to several small businesses, including a grocery store, a hardware store, and a few restaurants. The village also has a few small industrial parks.
The village is also home to a few large employers, including a manufacturing plant and a distribution center. The village is also home to a few small technology companies.
Demographics
As of the 2010 census, the population of Cleves was 2,000 people. The racial makeup of the village was 97.2% White, 0.7% African American, 0.3% Native American, 0.2% Asian, 0.1% Pacific Islander, and 1.5% from other races. The median household income was $45,000.
The village is home to a diverse population, with people from many different backgrounds and cultures. The village is also home to a large number of immigrants, with the largest groups being from Mexico, India, and China.
Conclusion
Cleves, Ohio is a small village located in Hamilton County, Ohio. It is situated on the banks of the Ohio River, just north of Cincinnati. The village was founded in 1817 and has a population of approximately 2,000 people. The economy of the village is largely based on agriculture and manufacturing, and the village is home to a diverse population.
Common Questions
What is Per Capita Income in Cleves?
Per Capita income in Cleves is $31,769.
What is the Median Family Income in Cleves?
Median Family Income in Cleves is $90,743.
What is the Median Household income in Cleves?
Median Household Income in Cleves is $85,109.
What is Income or Wage Gap in Cleves?
Income or Wage Gap in Cleves is 16.1%.
Women in Cleves earn 83.9 cents for every dollar earned by a man.
What is Inequality or Gini Index in Cleves?
Inequality or Gini Index in Cleves is 0.38.
What is the Total Population of Cleves?
Total Population of Cleves is 3,395.
What is the Total Male Population of Cleves?
Total Male Population of Cleves is 1,891.
What is the Total Female Population of Cleves?
Total Female Population of Cleves is 1,504.
What is the Ratio of Males per 100 Females in Cleves?
There are 125.73 Males per 100 Females in Cleves.
What is the Ratio of Females per 100 Males in Cleves?
There are 79.53 Females per 100 Males in Cleves.
What is the Median Population Age in Cleves?
Median Population Age in Cleves is 30.5 Years.
What is the Average Family Size in Cleves
Average Family Size in Cleves is 3.5 People.
What is the Average Household Size in Cleves
Average Household Size in Cleves is 3.1 People.
How Large is the Labor Force in Cleves?
There are 1,718 People in the Labor Forcein in Cleves.
What is the Percentage of People in the Labor Force in Cleves?
71.2% of People are in the Labor Force in Cleves.
What is the Unemployment Rate in Cleves?
Unemployment Rate in Cleves is 5.6%.