Zip Codes with the Highest Percentage of Population Employed in Health Care & Social Assistance in Cincinnati, OH
RELATED REPORTS & OPTIONS
Health Care & Social Assistance
Cincinnati
Compare Zip Codes
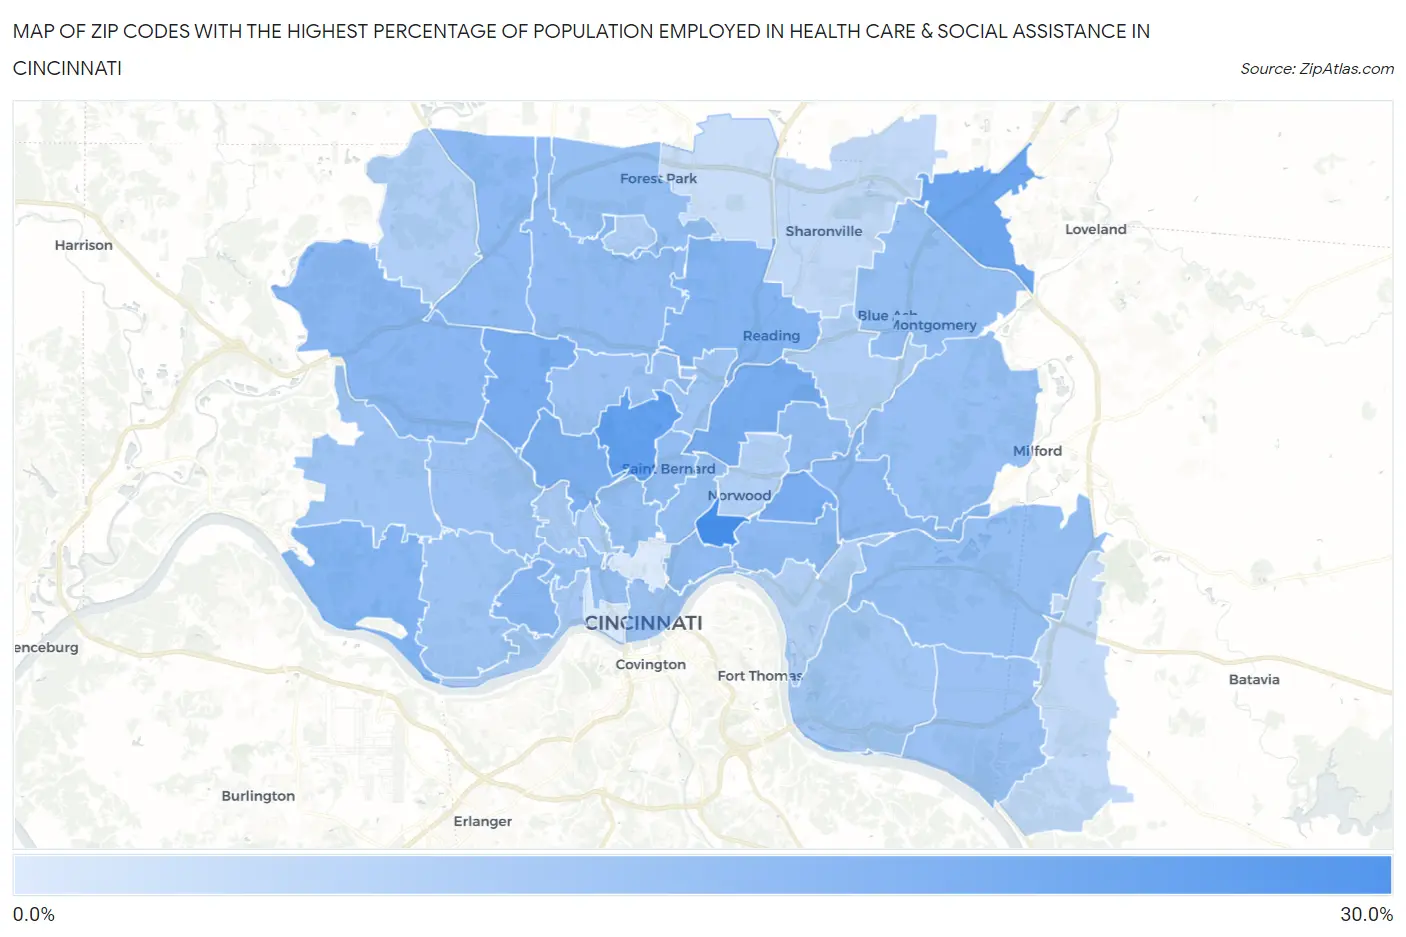
Map of Zip Codes with the Highest Percentage of Population Employed in Health Care & Social Assistance in Cincinnati
0.0%
30.0%
Zip Codes with the Highest Percentage of Population Employed in Health Care & Social Assistance in Cincinnati, OH
| Zip Code | % Employed | vs State | vs National | |
| 1. | 45207 | 27.1% | 15.7%(+11.5)#52 | 13.9%(+13.2)#1,321 |
| 2. | 45232 | 23.6% | 15.7%(+7.90)#88 | 13.9%(+9.64)#2,118 |
| 3. | 45249 | 21.9% | 15.7%(+6.19)#130 | 13.9%(+7.93)#2,872 |
| 4. | 45237 | 20.7% | 15.7%(+5.02)#167 | 13.9%(+6.75)#3,591 |
| 5. | 45239 | 20.7% | 15.7%(+5.01)#168 | 13.9%(+6.75)#3,594 |
| 6. | 45209 | 20.5% | 15.7%(+4.81)#173 | 13.9%(+6.55)#3,734 |
| 7. | 45223 | 19.9% | 15.7%(+4.18)#192 | 13.9%(+5.92)#4,194 |
| 8. | 45215 | 19.1% | 15.7%(+3.40)#234 | 13.9%(+5.13)#4,915 |
| 9. | 45233 | 19.0% | 15.7%(+3.31)#238 | 13.9%(+5.05)#5,008 |
| 10. | 45205 | 18.5% | 15.7%(+2.86)#260 | 13.9%(+4.59)#5,510 |
| 11. | 45247 | 18.4% | 15.7%(+2.76)#266 | 13.9%(+4.50)#5,641 |
| 12. | 45227 | 18.2% | 15.7%(+2.54)#278 | 13.9%(+4.28)#5,920 |
| 13. | 45208 | 18.0% | 15.7%(+2.34)#293 | 13.9%(+4.07)#6,169 |
| 14. | 45251 | 17.9% | 15.7%(+2.19)#305 | 13.9%(+3.92)#6,384 |
| 15. | 45231 | 17.7% | 15.7%(+2.05)#318 | 13.9%(+3.79)#6,593 |
| 16. | 45206 | 17.7% | 15.7%(+2.00)#325 | 13.9%(+3.74)#6,670 |
| 17. | 45213 | 17.3% | 15.7%(+1.66)#359 | 13.9%(+3.40)#7,195 |
| 18. | 45217 | 17.3% | 15.7%(+1.65)#360 | 13.9%(+3.39)#7,206 |
| 19. | 45242 | 17.2% | 15.7%(+1.54)#370 | 13.9%(+3.28)#7,372 |
| 20. | 45244 | 17.2% | 15.7%(+1.49)#373 | 13.9%(+3.23)#7,452 |
| 21. | 45240 | 17.0% | 15.7%(+1.36)#380 | 13.9%(+3.10)#7,672 |
| 22. | 45220 | 17.0% | 15.7%(+1.36)#382 | 13.9%(+3.09)#7,678 |
| 23. | 45229 | 17.0% | 15.7%(+1.32)#385 | 13.9%(+3.05)#7,742 |
| 24. | 45243 | 16.9% | 15.7%(+1.21)#393 | 13.9%(+2.95)#7,906 |
| 25. | 45214 | 16.9% | 15.7%(+1.18)#398 | 13.9%(+2.92)#7,960 |
| 26. | 45224 | 16.4% | 15.7%(+0.756)#443 | 13.9%(+2.49)#8,686 |
| 27. | 45202 | 16.4% | 15.7%(+0.721)#446 | 13.9%(+2.46)#8,751 |
| 28. | 45211 | 16.3% | 15.7%(+0.593)#460 | 13.9%(+2.33)#9,011 |
| 29. | 45255 | 16.2% | 15.7%(+0.575)#464 | 13.9%(+2.31)#9,047 |
| 30. | 45248 | 16.1% | 15.7%(+0.424)#484 | 13.9%(+2.16)#9,323 |
| 31. | 45216 | 15.9% | 15.7%(+0.236)#503 | 13.9%(+1.97)#9,684 |
| 32. | 45238 | 15.9% | 15.7%(+0.214)#504 | 13.9%(+1.95)#9,735 |
| 33. | 45230 | 15.5% | 15.7%(-0.221)#539 | 13.9%(+1.51)#10,623 |
| 34. | 45204 | 15.2% | 15.7%(-0.493)#571 | 13.9%(+1.24)#11,236 |
| 35. | 45225 | 14.6% | 15.7%(-1.08)#626 | 13.9%(+0.654)#12,621 |
| 36. | 45218 | 14.0% | 15.7%(-1.64)#667 | 13.9%(+0.094)#13,987 |
| 37. | 45252 | 13.8% | 15.7%(-1.84)#687 | 13.9%(-0.103)#14,488 |
| 38. | 45236 | 13.7% | 15.7%(-1.92)#693 | 13.9%(-0.187)#14,682 |
| 39. | 45226 | 13.4% | 15.7%(-2.26)#734 | 13.9%(-0.527)#15,523 |
| 40. | 45212 | 13.4% | 15.7%(-2.31)#737 | 13.9%(-0.572)#15,626 |
| 41. | 45241 | 11.9% | 15.7%(-3.80)#848 | 13.9%(-2.06)#19,309 |
| 42. | 45245 | 11.8% | 15.7%(-3.91)#854 | 13.9%(-2.17)#19,577 |
| 43. | 45246 | 11.0% | 15.7%(-4.67)#914 | 13.9%(-2.93)#21,341 |
| 44. | 45203 | 9.1% | 15.7%(-6.56)#1,014 | 13.9%(-4.83)#25,009 |
| 45. | 45219 | 8.6% | 15.7%(-7.05)#1,024 | 13.9%(-5.31)#25,718 |
1
Common Questions
What are the Top 10 Zip Codes with the Highest Percentage of Population Employed in Health Care & Social Assistance in Cincinnati, OH?
Top 10 Zip Codes with the Highest Percentage of Population Employed in Health Care & Social Assistance in Cincinnati, OH are:
What zip code has the Highest Percentage of Population Employed in Health Care & Social Assistance in Cincinnati, OH?
45207 has the Highest Percentage of Population Employed in Health Care & Social Assistance in Cincinnati, OH with 27.1%.
What is the Percentage of Population Employed in Health Care & Social Assistance in Cincinnati, OH?
Percentage of Population Employed in Health Care & Social Assistance in Cincinnati is 17.1%.
What is the Percentage of Population Employed in Health Care & Social Assistance in Ohio?
Percentage of Population Employed in Health Care & Social Assistance in Ohio is 15.7%.
What is the Percentage of Population Employed in Health Care & Social Assistance in the United States?
Percentage of Population Employed in Health Care & Social Assistance in the United States is 13.9%.