Churchill, OH Map & Demographics
Churchill Map
Churchill Overview
$27,330
PER CAPITA INCOME
$64,583
AVG FAMILY INCOME
$62,386
AVG HOUSEHOLD INCOME
0.3%
WAGE / INCOME GAP [ % ]
99.7¢/ $1
WAGE / INCOME GAP [ $ ]
0.36
INEQUALITY / GINI INDEX
2,115
TOTAL POPULATION
1,143
MALE POPULATION
972
FEMALE POPULATION
117.59
MALES / 100 FEMALES
85.04
FEMALES / 100 MALES
43.8
MEDIAN AGE
3.0
AVG FAMILY SIZE
2.5
AVG HOUSEHOLD SIZE
1,086
LABOR FORCE [ PEOPLE ]
65.0%
PERCENT IN LABOR FORCE
5.3%
UNEMPLOYMENT RATE
Income in Churchill
Income Overview in Churchill
Per Capita Income in Churchill is $27,330, while median incomes of families and households are $64,583 and $62,386 respectively.
| Characteristic | Number | Measure |
| Per Capita Income | 2,115 | $27,330 |
| Median Family Income | 594 | $64,583 |
| Mean Family Income | 594 | $80,069 |
| Median Household Income | 846 | $62,386 |
| Mean Household Income | 846 | $67,604 |
| Income Deficit | 594 | $0 |
| Wage / Income Gap (%) | 2,115 | 0.27% |
| Wage / Income Gap ($) | 2,115 | 99.73¢ per $1 |
| Gini / Inequality Index | 2,115 | 0.36 |
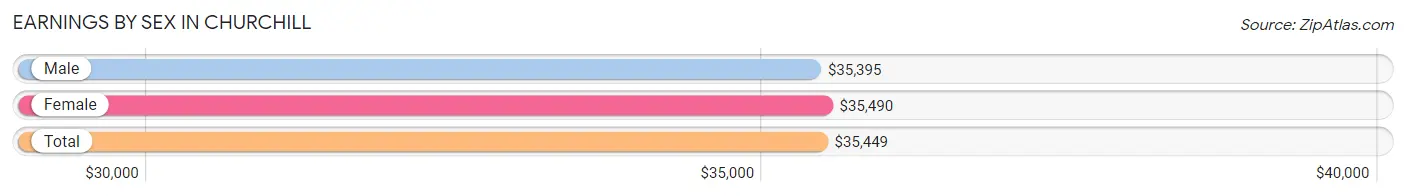
Earnings by Sex in Churchill
Average Earnings in Churchill are $35,449, $35,395 for men and $35,490 for women, a difference of 0.3%.
| Sex | Number | Average Earnings |
| Male | 544 (51.1%) | $35,395 |
| Female | 520 (48.9%) | $35,490 |
| Total | 1,064 (100.0%) | $35,449 |
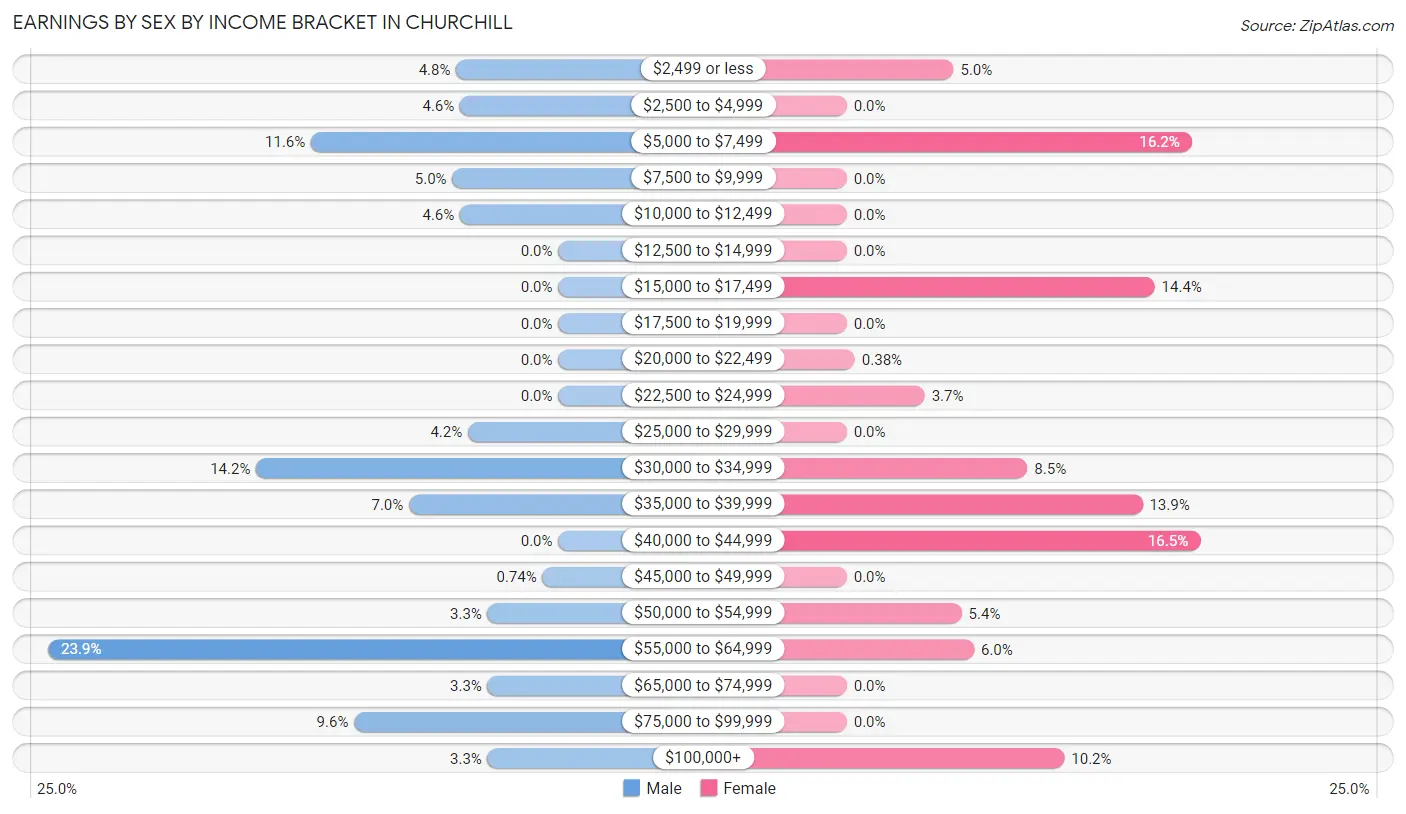
Earnings by Sex by Income Bracket in Churchill
The most common earnings brackets in Churchill are $55,000 to $64,999 for men (130 | 23.9%) and $40,000 to $44,999 for women (86 | 16.5%).
| Income | Male | Female |
| $2,499 or less | 26 (4.8%) | 26 (5.0%) |
| $2,500 to $4,999 | 25 (4.6%) | 0 (0.0%) |
| $5,000 to $7,499 | 63 (11.6%) | 84 (16.2%) |
| $7,500 to $9,999 | 27 (5.0%) | 0 (0.0%) |
| $10,000 to $12,499 | 25 (4.6%) | 0 (0.0%) |
| $12,500 to $14,999 | 0 (0.0%) | 0 (0.0%) |
| $15,000 to $17,499 | 0 (0.0%) | 75 (14.4%) |
| $17,500 to $19,999 | 0 (0.0%) | 0 (0.0%) |
| $20,000 to $22,499 | 0 (0.0%) | 2 (0.4%) |
| $22,500 to $24,999 | 0 (0.0%) | 19 (3.6%) |
| $25,000 to $29,999 | 23 (4.2%) | 0 (0.0%) |
| $30,000 to $34,999 | 77 (14.1%) | 44 (8.5%) |
| $35,000 to $39,999 | 38 (7.0%) | 72 (13.9%) |
| $40,000 to $44,999 | 0 (0.0%) | 86 (16.5%) |
| $45,000 to $49,999 | 4 (0.7%) | 0 (0.0%) |
| $50,000 to $54,999 | 18 (3.3%) | 28 (5.4%) |
| $55,000 to $64,999 | 130 (23.9%) | 31 (6.0%) |
| $65,000 to $74,999 | 18 (3.3%) | 0 (0.0%) |
| $75,000 to $99,999 | 52 (9.6%) | 0 (0.0%) |
| $100,000+ | 18 (3.3%) | 53 (10.2%) |
| Total | 544 (100.0%) | 520 (100.0%) |
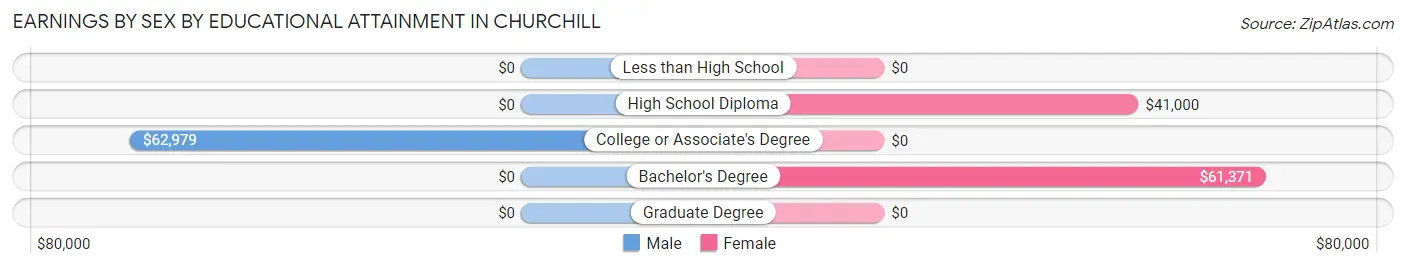
Earnings by Sex by Educational Attainment in Churchill
Average earnings in Churchill are $36,283 for men and $36,544 for women, a difference of 0.7%. Men with an educational attainment of college or associate's degree enjoy the highest average annual earnings of $62,979, while those with college or associate's degree education earn the least with $62,979. Women with an educational attainment of bachelor's degree earn the most with the average annual earnings of $61,371, while those with high school diploma education have the smallest earnings of $41,000.
| Educational Attainment | Male Income | Female Income |
| Less than High School | - | - |
| High School Diploma | - | - |
| College or Associate's Degree | $62,979 | $0 |
| Bachelor's Degree | - | - |
| Graduate Degree | - | - |
| Total | $36,283 | $36,544 |
Family Income in Churchill
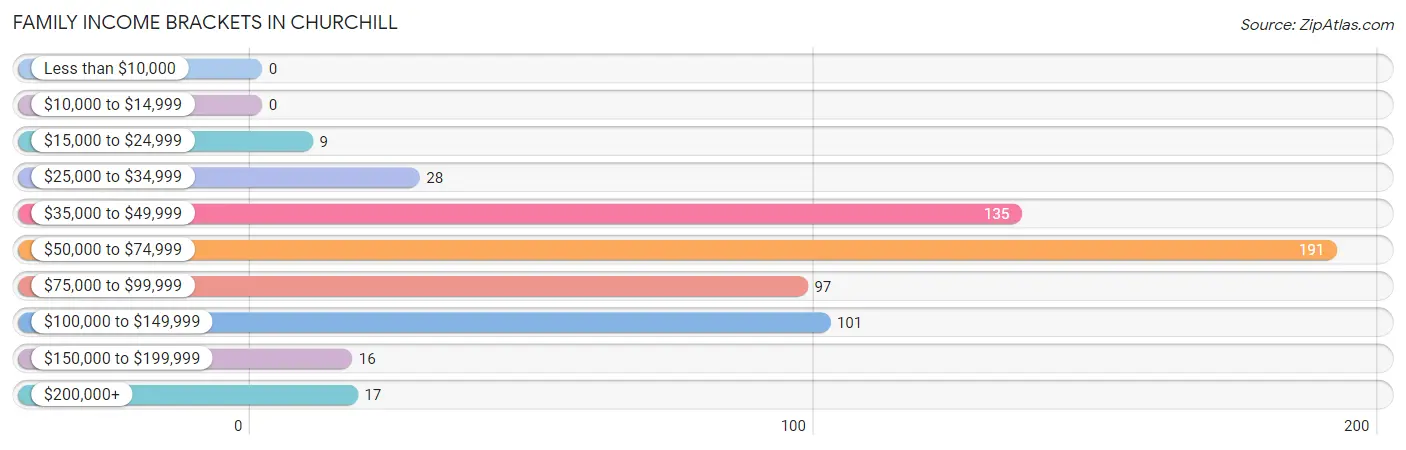
Family Income Brackets in Churchill
According to the Churchill family income data, there are 191 families falling into the $50,000 to $74,999 income range, which is the most common income bracket and makes up 32.2% of all families.
| Income Bracket | # Families | % Families |
| Less than $10,000 | 0 | 0.0% |
| $10,000 to $14,999 | 0 | 0.0% |
| $15,000 to $24,999 | 9 | 1.5% |
| $25,000 to $34,999 | 28 | 4.7% |
| $35,000 to $49,999 | 135 | 22.7% |
| $50,000 to $74,999 | 191 | 32.2% |
| $75,000 to $99,999 | 97 | 16.3% |
| $100,000 to $149,999 | 101 | 17.0% |
| $150,000 to $199,999 | 16 | 2.7% |
| $200,000+ | 17 | 2.9% |
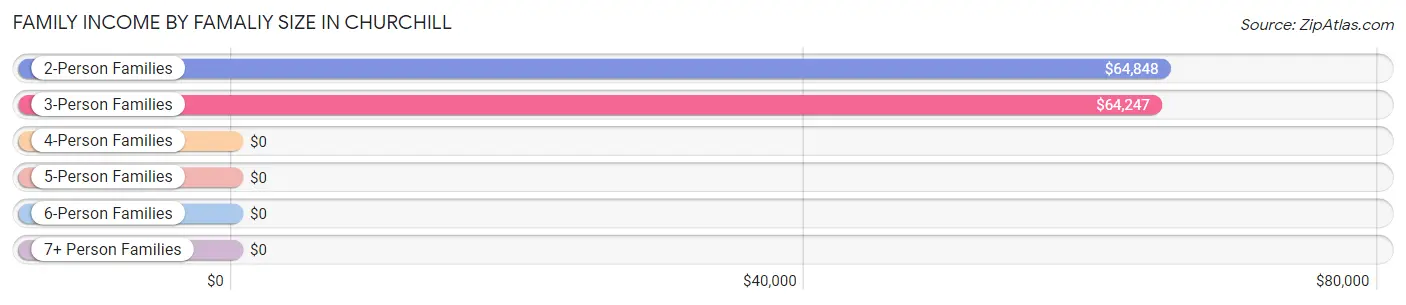
Family Income by Famaliy Size in Churchill
2-person families (345 | 58.1%) account for the highest median family income in Churchill with $64,848 per family, while 2-person families (345 | 58.1%) have the highest median income of $32,424 per family member.
| Income Bracket | # Families | Median Income |
| 2-Person Families | 345 (58.1%) | $64,848 |
| 3-Person Families | 124 (20.9%) | $64,247 |
| 4-Person Families | 21 (3.5%) | $0 |
| 5-Person Families | 57 (9.6%) | $0 |
| 6-Person Families | 26 (4.4%) | $0 |
| 7+ Person Families | 21 (3.5%) | $0 |
| Total | 594 (100.0%) | $64,583 |
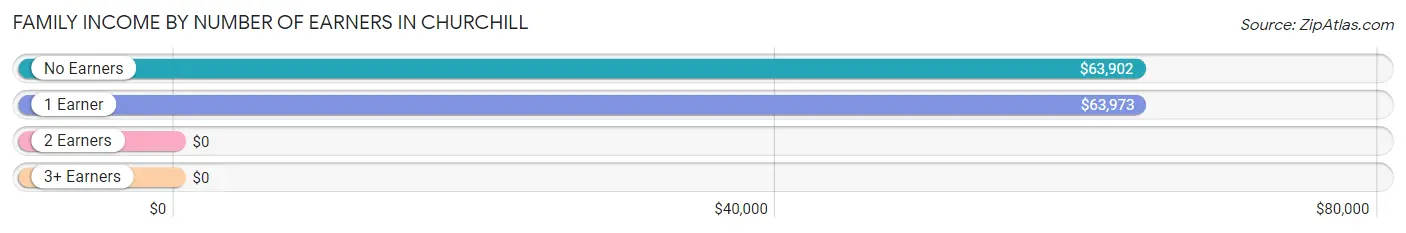
Family Income by Number of Earners in Churchill
| Number of Earners | # Families | Median Income |
| No Earners | 142 (23.9%) | $63,902 |
| 1 Earner | 140 (23.6%) | $63,973 |
| 2 Earners | 265 (44.6%) | $0 |
| 3+ Earners | 47 (7.9%) | $0 |
| Total | 594 (100.0%) | $64,583 |
Household Income in Churchill
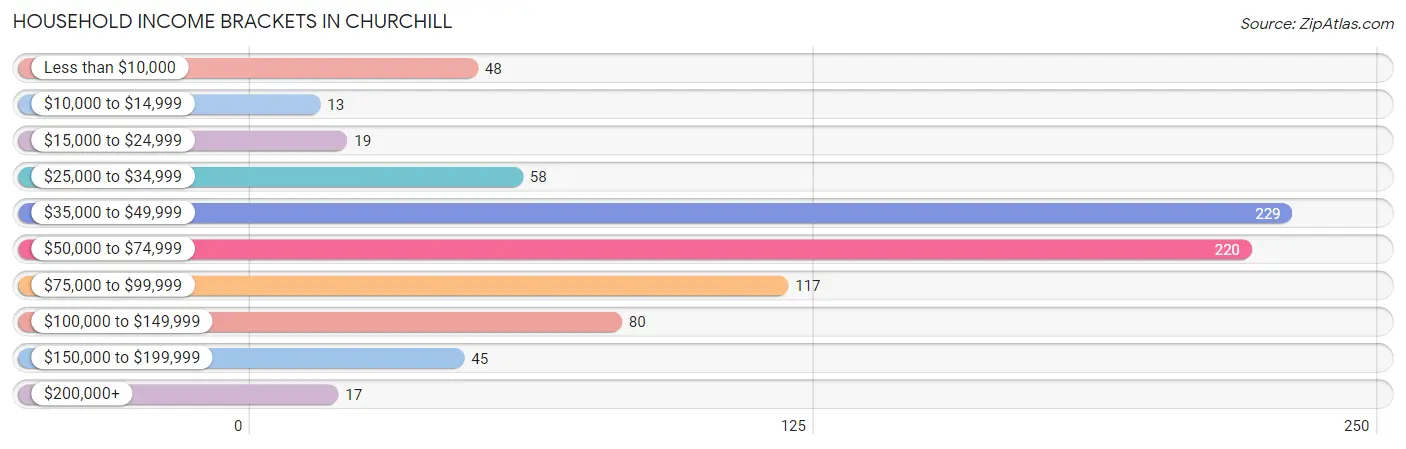
Household Income Brackets in Churchill
With 229 households falling in the category, the $35,000 to $49,999 income range is the most frequent in Churchill, accounting for 27.1% of all households. In contrast, only 13 households (1.5%) fall into the $10,000 to $14,999 income bracket, making it the least populous group.
| Income Bracket | # Households | % Households |
| Less than $10,000 | 48 | 5.7% |
| $10,000 to $14,999 | 13 | 1.5% |
| $15,000 to $24,999 | 19 | 2.2% |
| $25,000 to $34,999 | 58 | 6.9% |
| $35,000 to $49,999 | 229 | 27.1% |
| $50,000 to $74,999 | 220 | 26.0% |
| $75,000 to $99,999 | 117 | 13.8% |
| $100,000 to $149,999 | 80 | 9.5% |
| $150,000 to $199,999 | 45 | 5.3% |
| $200,000+ | 17 | 2.0% |
Household Income by Householder Age in Churchill
The median household income in Churchill is $62,386, with the highest median household income of $64,161 found in the 25 to 44 years age bracket for the primary householder. A total of 211 households (24.9%) fall into this category. Meanwhile, the 15 to 24 years age bracket for the primary householder has the lowest median household income of $0, with 2 households (0.2%) in this group.
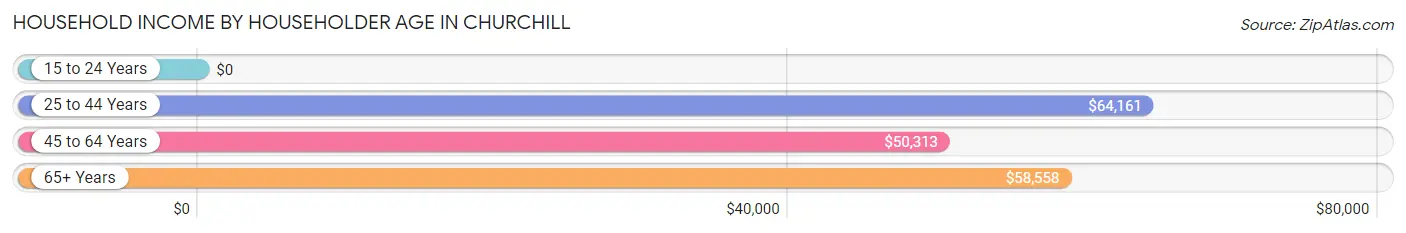
| Income Bracket | # Households | Median Income |
| 15 to 24 Years | 2 (0.2%) | $0 |
| 25 to 44 Years | 211 (24.9%) | $64,161 |
| 45 to 64 Years | 332 (39.2%) | $50,313 |
| 65+ Years | 301 (35.6%) | $58,558 |
| Total | 846 (100.0%) | $62,386 |
Poverty in Churchill
Income Below Poverty by Sex and Age in Churchill
With 4.5% poverty level for males and 7.1% for females among the residents of Churchill, 25 to 34 year old males and 45 to 54 year old females are the most vulnerable to poverty, with 42 males (24.8%) and 48 females (34.8%) in their respective age groups living below the poverty level.
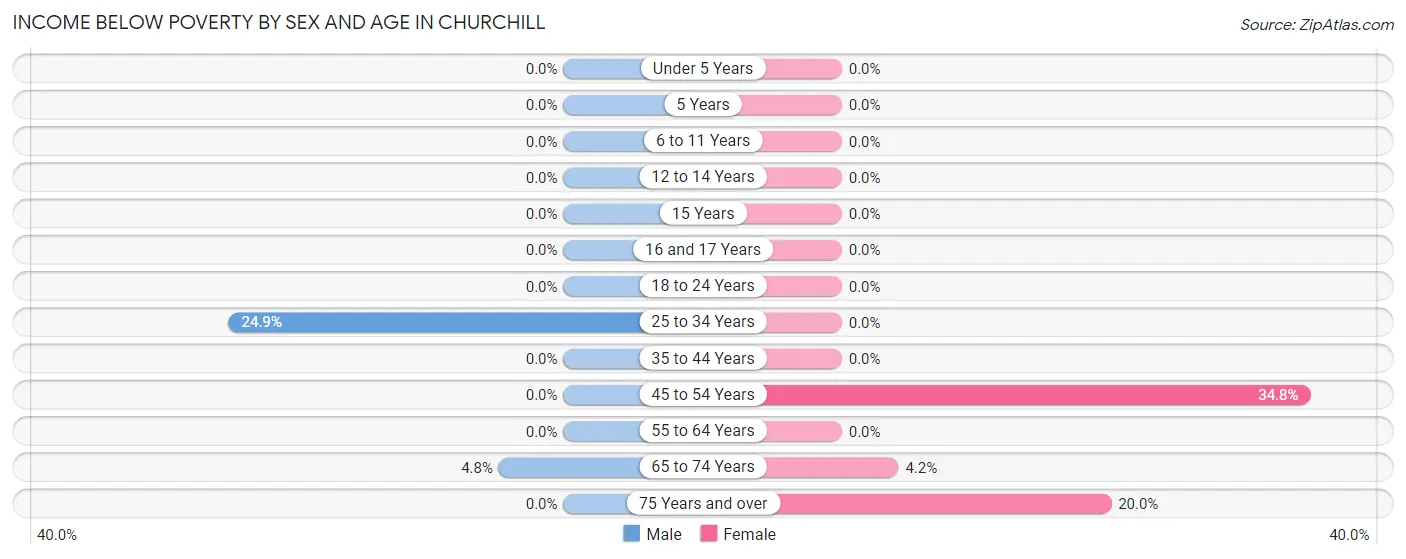
| Age Bracket | Male | Female |
| Under 5 Years | 0 (0.0%) | 0 (0.0%) |
| 5 Years | 0 (0.0%) | 0 (0.0%) |
| 6 to 11 Years | 0 (0.0%) | 0 (0.0%) |
| 12 to 14 Years | 0 (0.0%) | 0 (0.0%) |
| 15 Years | 0 (0.0%) | 0 (0.0%) |
| 16 and 17 Years | 0 (0.0%) | 0 (0.0%) |
| 18 to 24 Years | 0 (0.0%) | 0 (0.0%) |
| 25 to 34 Years | 42 (24.8%) | 0 (0.0%) |
| 35 to 44 Years | 0 (0.0%) | 0 (0.0%) |
| 45 to 54 Years | 0 (0.0%) | 48 (34.8%) |
| 55 to 64 Years | 0 (0.0%) | 0 (0.0%) |
| 65 to 74 Years | 9 (4.8%) | 8 (4.2%) |
| 75 Years and over | 0 (0.0%) | 13 (20.0%) |
| Total | 51 (4.5%) | 69 (7.1%) |
Income Above Poverty by Sex and Age in Churchill
According to the poverty statistics in Churchill, males aged under 5 years and females aged under 5 years are the age groups that are most secure financially, with 100.0% of males and 100.0% of females in these age groups living above the poverty line.
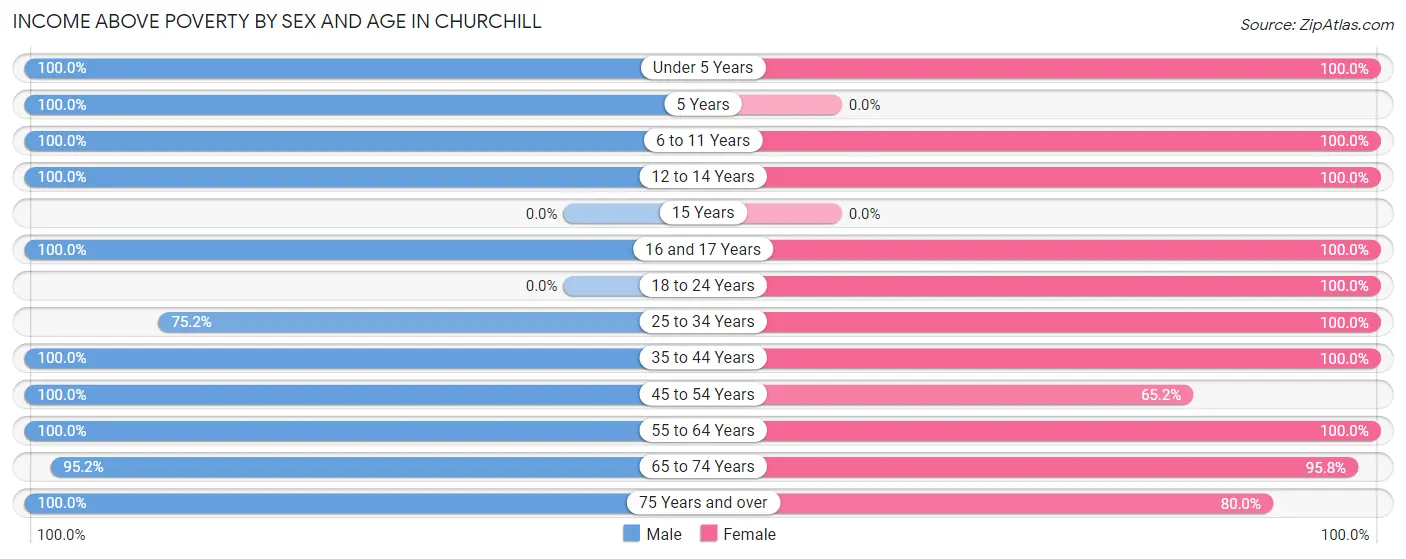
| Age Bracket | Male | Female |
| Under 5 Years | 39 (100.0%) | 15 (100.0%) |
| 5 Years | 42 (100.0%) | 0 (0.0%) |
| 6 to 11 Years | 219 (100.0%) | 21 (100.0%) |
| 12 to 14 Years | 57 (100.0%) | 52 (100.0%) |
| 15 Years | 0 (0.0%) | 0 (0.0%) |
| 16 and 17 Years | 27 (100.0%) | 85 (100.0%) |
| 18 to 24 Years | 0 (0.0%) | 17 (100.0%) |
| 25 to 34 Years | 127 (75.1%) | 85 (100.0%) |
| 35 to 44 Years | 124 (100.0%) | 142 (100.0%) |
| 45 to 54 Years | 117 (100.0%) | 90 (65.2%) |
| 55 to 64 Years | 115 (100.0%) | 162 (100.0%) |
| 65 to 74 Years | 179 (95.2%) | 182 (95.8%) |
| 75 Years and over | 46 (100.0%) | 52 (80.0%) |
| Total | 1,092 (95.5%) | 903 (92.9%) |
Income Below Poverty Among Married-Couple Families in Churchill
The poverty statistics for married-couple families in Churchill show that 2.0% or 9 of the total 452 families live below the poverty line. Families with no children have the highest poverty rate of 2.7%, comprising of 9 families. On the other hand, families with 1 or 2 children have the lowest poverty rate of 0.0%, which includes 0 families.
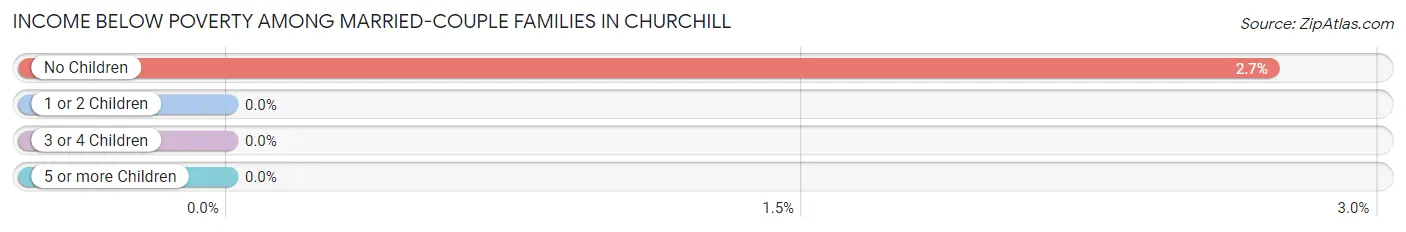
| Children | Above Poverty | Below Poverty |
| No Children | 322 (97.3%) | 9 (2.7%) |
| 1 or 2 Children | 38 (100.0%) | 0 (0.0%) |
| 3 or 4 Children | 83 (100.0%) | 0 (0.0%) |
| 5 or more Children | 0 (0.0%) | 0 (0.0%) |
| Total | 443 (98.0%) | 9 (2.0%) |
Income Below Poverty Among Single-Parent Households in Churchill
| Children | Single Father | Single Mother |
| No Children | 0 (0.0%) | 0 (0.0%) |
| 1 or 2 Children | 0 (0.0%) | 0 (0.0%) |
| 3 or 4 Children | 0 (0.0%) | 0 (0.0%) |
| 5 or more Children | 0 (0.0%) | 0 (0.0%) |
| Total | 0 (0.0%) | 0 (0.0%) |
Income Below Poverty Among Married-Couple vs Single-Parent Households in Churchill
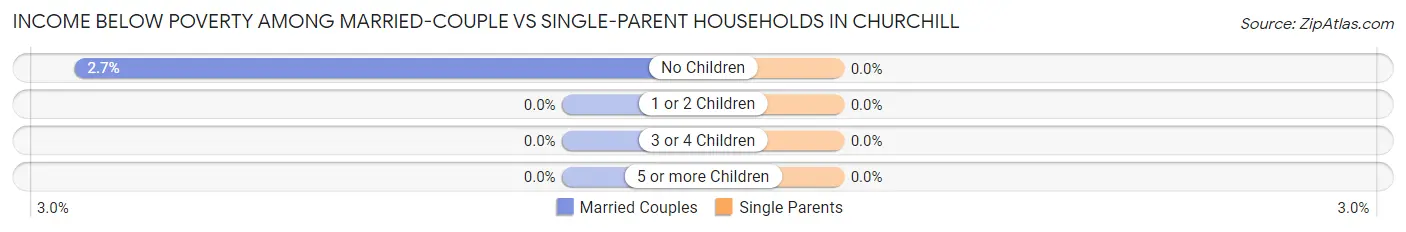
| Children | Married-Couple Families | Single-Parent Households |
| No Children | 9 (2.7%) | 0 (0.0%) |
| 1 or 2 Children | 0 (0.0%) | 0 (0.0%) |
| 3 or 4 Children | 0 (0.0%) | 0 (0.0%) |
| 5 or more Children | 0 (0.0%) | 0 (0.0%) |
| Total | 9 (2.0%) | 0 (0.0%) |
Race in Churchill
The most populous races in Churchill are White / Caucasian (1,921 | 90.8%), Black / African American (143 | 6.8%), and Asian (51 | 2.4%).
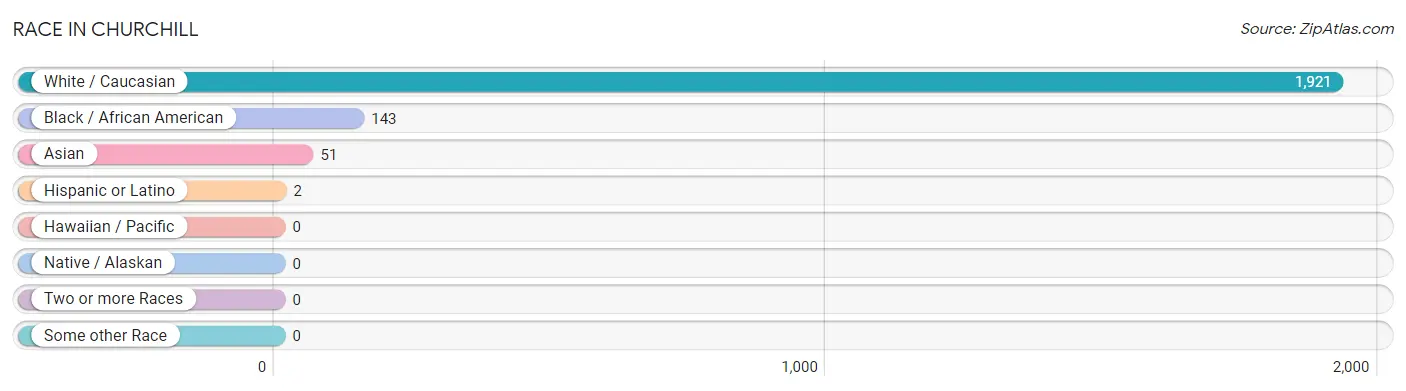
| Race | # Population | % Population |
| Asian | 51 | 2.4% |
| Black / African American | 143 | 6.8% |
| Hawaiian / Pacific | 0 | 0.0% |
| Hispanic or Latino | 2 | 0.1% |
| Native / Alaskan | 0 | 0.0% |
| White / Caucasian | 1,921 | 90.8% |
| Two or more Races | 0 | 0.0% |
| Some other Race | 0 | 0.0% |
| Total | 2,115 | 100.0% |
Ancestry in Churchill
The most populous ancestries reported in Churchill are German (661 | 31.2%), American (335 | 15.8%), Italian (179 | 8.5%), Irish (81 | 3.8%), and English (58 | 2.7%), together accounting for 62.1% of all Churchill residents.
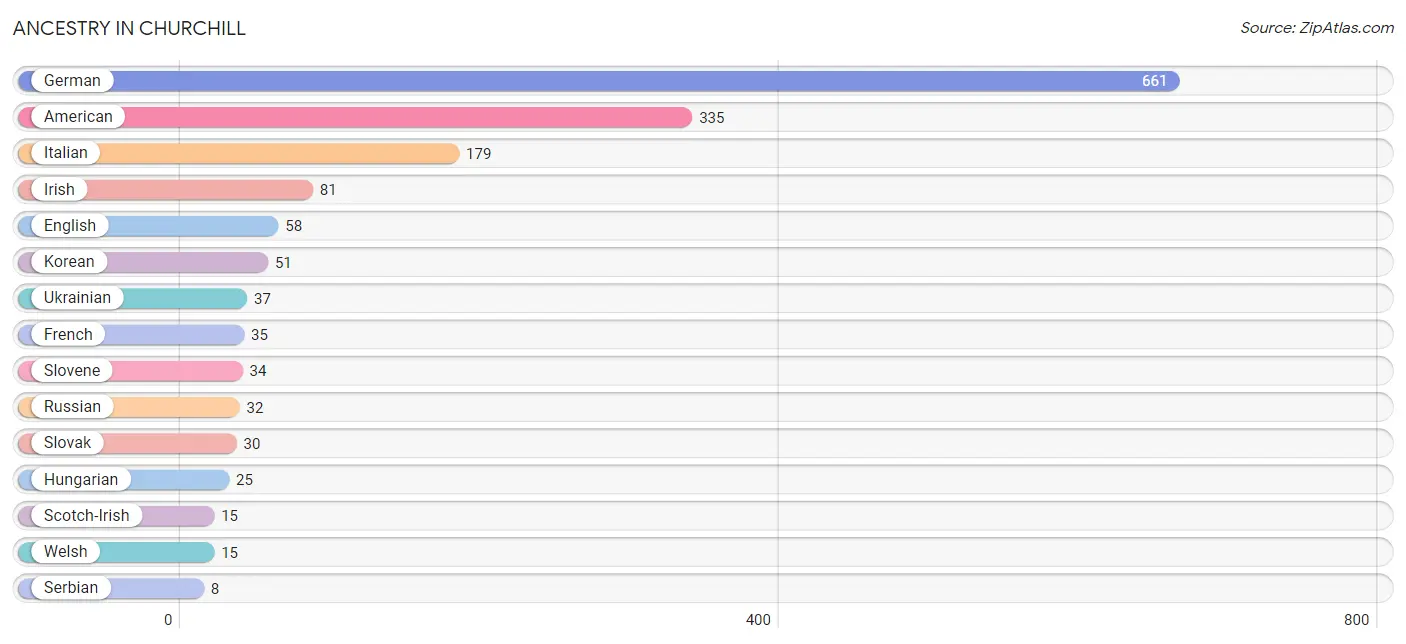
| Ancestry | # Population | % Population |
| American | 335 | 15.8% |
| English | 58 | 2.7% |
| French | 35 | 1.7% |
| German | 661 | 31.2% |
| Hungarian | 25 | 1.2% |
| Irish | 81 | 3.8% |
| Italian | 179 | 8.5% |
| Korean | 51 | 2.4% |
| Polish | 6 | 0.3% |
| Puerto Rican | 2 | 0.1% |
| Russian | 32 | 1.5% |
| Scotch-Irish | 15 | 0.7% |
| Serbian | 8 | 0.4% |
| Slavic | 8 | 0.4% |
| Slovak | 30 | 1.4% |
| Slovene | 34 | 1.6% |
| Ukrainian | 37 | 1.8% |
| Welsh | 15 | 0.7% | View All 18 Rows |
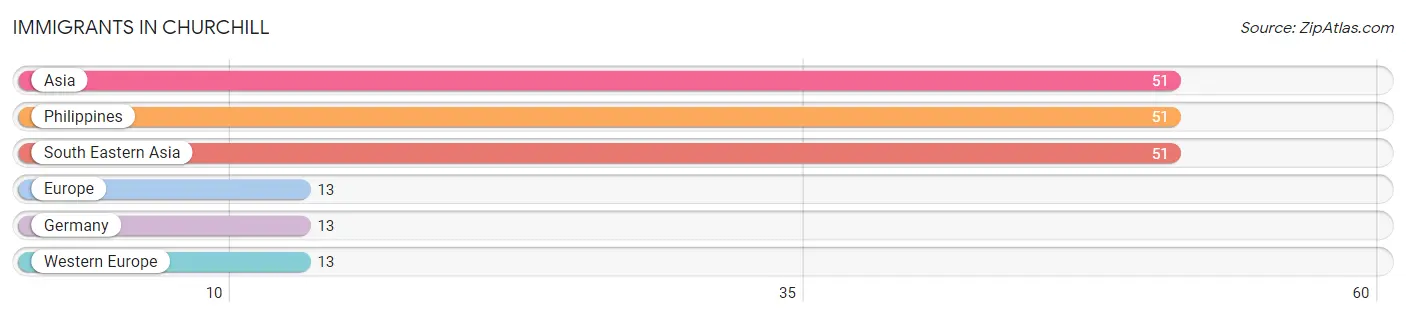
Immigrants in Churchill
The most numerous immigrant groups reported in Churchill came from Asia (51 | 2.4%), Philippines (51 | 2.4%), South Eastern Asia (51 | 2.4%), Europe (13 | 0.6%), and Germany (13 | 0.6%), together accounting for 8.4% of all Churchill residents.
| Immigration Origin | # Population | % Population |
| Asia | 51 | 2.4% |
| Europe | 13 | 0.6% |
| Germany | 13 | 0.6% |
| Philippines | 51 | 2.4% |
| South Eastern Asia | 51 | 2.4% |
| Western Europe | 13 | 0.6% | View All 6 Rows |
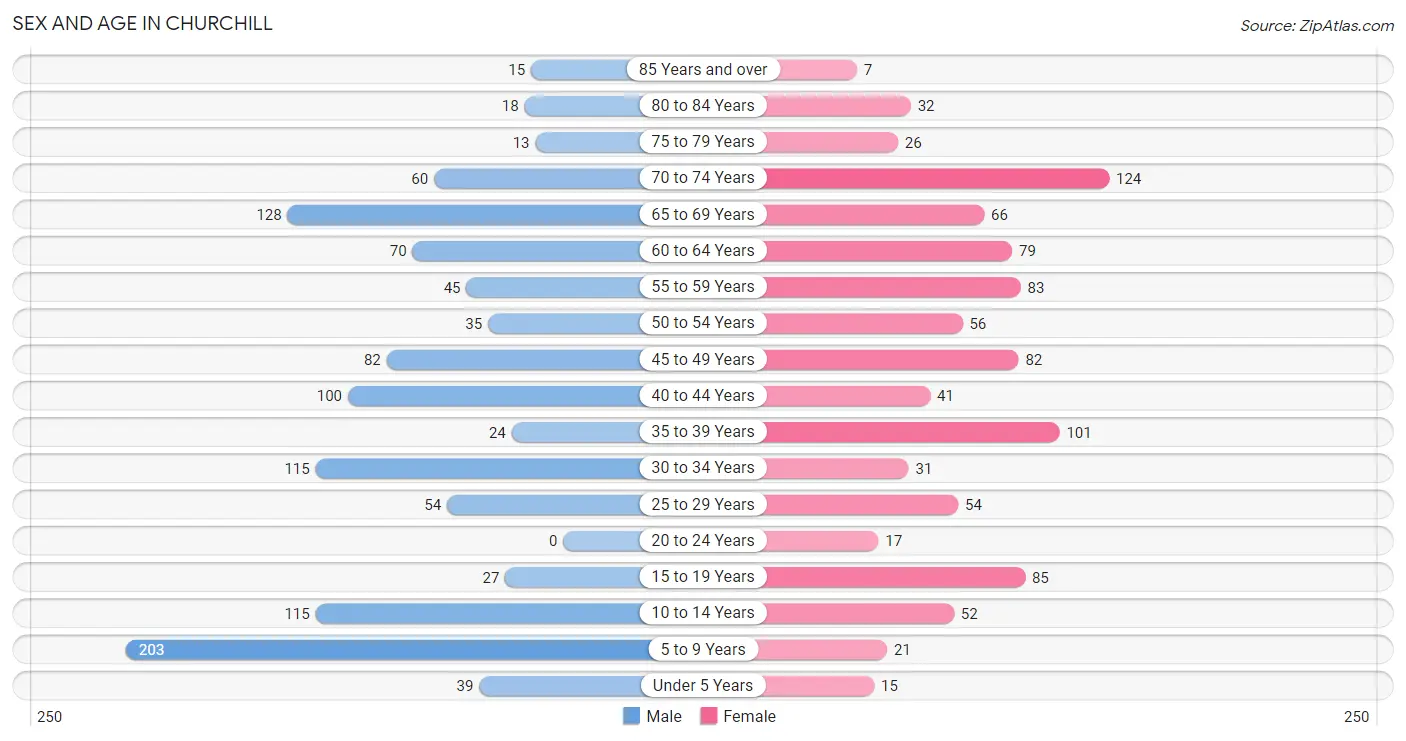
Sex and Age in Churchill
Sex and Age in Churchill
The most populous age groups in Churchill are 5 to 9 Years (203 | 17.8%) for men and 70 to 74 Years (124 | 12.8%) for women.
| Age Bracket | Male | Female |
| Under 5 Years | 39 (3.4%) | 15 (1.5%) |
| 5 to 9 Years | 203 (17.8%) | 21 (2.2%) |
| 10 to 14 Years | 115 (10.1%) | 52 (5.3%) |
| 15 to 19 Years | 27 (2.4%) | 85 (8.7%) |
| 20 to 24 Years | 0 (0.0%) | 17 (1.8%) |
| 25 to 29 Years | 54 (4.7%) | 54 (5.6%) |
| 30 to 34 Years | 115 (10.1%) | 31 (3.2%) |
| 35 to 39 Years | 24 (2.1%) | 101 (10.4%) |
| 40 to 44 Years | 100 (8.7%) | 41 (4.2%) |
| 45 to 49 Years | 82 (7.2%) | 82 (8.4%) |
| 50 to 54 Years | 35 (3.1%) | 56 (5.8%) |
| 55 to 59 Years | 45 (3.9%) | 83 (8.5%) |
| 60 to 64 Years | 70 (6.1%) | 79 (8.1%) |
| 65 to 69 Years | 128 (11.2%) | 66 (6.8%) |
| 70 to 74 Years | 60 (5.2%) | 124 (12.8%) |
| 75 to 79 Years | 13 (1.1%) | 26 (2.7%) |
| 80 to 84 Years | 18 (1.6%) | 32 (3.3%) |
| 85 Years and over | 15 (1.3%) | 7 (0.7%) |
| Total | 1,143 (100.0%) | 972 (100.0%) |
Families and Households in Churchill
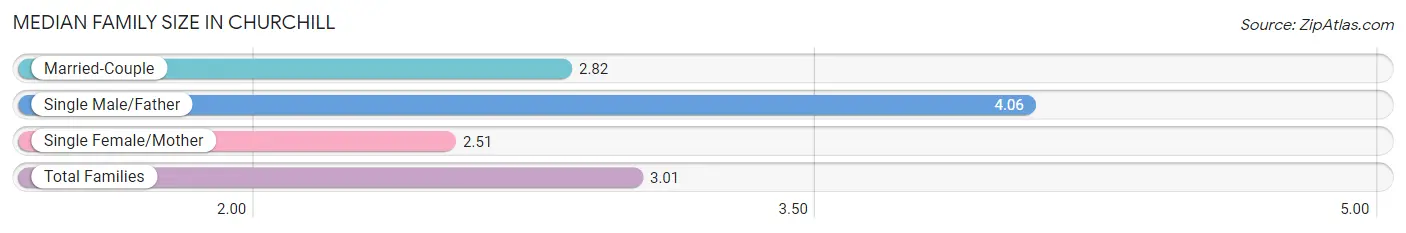
Median Family Size in Churchill
The median family size in Churchill is 3.01 persons per family, with single male/father families (101 | 17.0%) accounting for the largest median family size of 4.06 persons per family. On the other hand, single female/mother families (41 | 6.9%) represent the smallest median family size with 2.51 persons per family.
| Family Type | # Families | Family Size |
| Married-Couple | 452 (76.1%) | 2.82 |
| Single Male/Father | 101 (17.0%) | 4.06 |
| Single Female/Mother | 41 (6.9%) | 2.51 |
| Total Families | 594 (100.0%) | 3.01 |
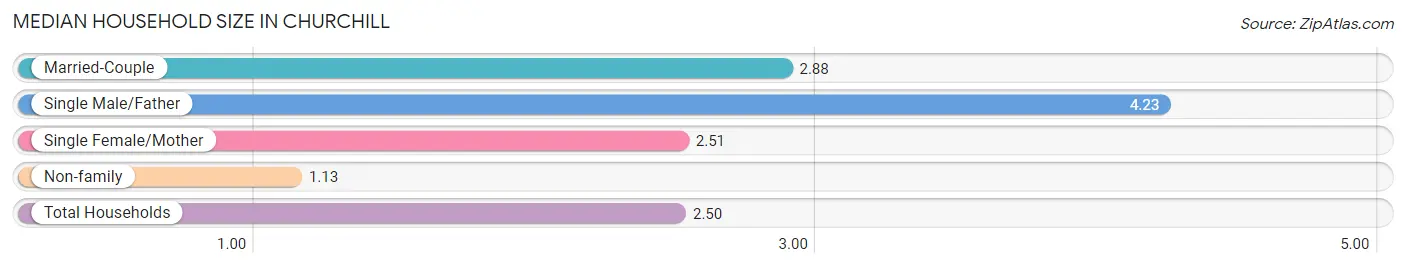
Median Household Size in Churchill
The median household size in Churchill is 2.50 persons per household, with single male/father households (101 | 11.9%) accounting for the largest median household size of 4.23 persons per household. non-family households (252 | 29.8%) represent the smallest median household size with 1.13 persons per household.
| Household Type | # Households | Household Size |
| Married-Couple | 452 (53.4%) | 2.88 |
| Single Male/Father | 101 (11.9%) | 4.23 |
| Single Female/Mother | 41 (4.9%) | 2.51 |
| Non-family | 252 (29.8%) | 1.13 |
| Total Households | 846 (100.0%) | 2.50 |
Household Size by Marriage Status in Churchill
Out of a total of 846 households in Churchill, 594 (70.2%) are family households, while 252 (29.8%) are nonfamily households. The most numerous type of family households are 2-person households, comprising 338, and the most common type of nonfamily households are 1-person households, comprising 222.
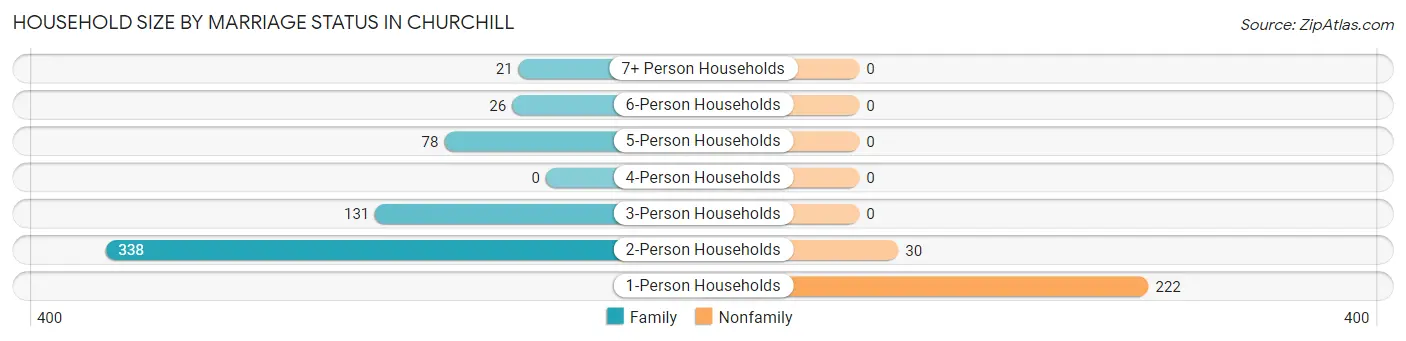
| Household Size | Family Households | Nonfamily Households |
| 1-Person Households | - | 222 (26.2%) |
| 2-Person Households | 338 (40.0%) | 30 (3.5%) |
| 3-Person Households | 131 (15.5%) | 0 (0.0%) |
| 4-Person Households | 0 (0.0%) | 0 (0.0%) |
| 5-Person Households | 78 (9.2%) | 0 (0.0%) |
| 6-Person Households | 26 (3.1%) | 0 (0.0%) |
| 7+ Person Households | 21 (2.5%) | 0 (0.0%) |
| Total | 594 (70.2%) | 252 (29.8%) |
Female Fertility in Churchill
Fertility by Age in Churchill
| Age Bracket | Women with Births | Births / 1,000 Women |
| 15 to 19 years | 0 (0.0%) | 0.0 |
| 20 to 34 years | 0 (0.0%) | 0.0 |
| 35 to 50 years | 0 (0.0%) | 0.0 |
| Total | 0 (0.0%) | 0.0 |
Fertility by Age by Marriage Status in Churchill
| Age Bracket | Married | Unmarried |
| 15 to 19 years | 0 (0.0%) | 0 (0.0%) |
| 20 to 34 years | 0 (0.0%) | 0 (0.0%) |
| 35 to 50 years | 0 (0.0%) | 0 (0.0%) |
| Total | 0 (0.0%) | 0 (0.0%) |
Fertility by Education in Churchill
| Educational Attainment | Women with Births | Births / 1,000 Women |
| Less than High School | 0 (0.0%) | 0.0 |
| High School Diploma | 0 (0.0%) | 0.0 |
| College or Associate's Degree | 0 (0.0%) | 0.0 |
| Bachelor's Degree | 0 (0.0%) | 0.0 |
| Graduate Degree | 0 (0.0%) | 0.0 |
| Total | 0 (0.0%) | 0.0 |
Fertility by Education by Marriage Status in Churchill
| Educational Attainment | Married | Unmarried |
| Less than High School | 0 (0.0%) | 0 (0.0%) |
| High School Diploma | 0 (0.0%) | 0 (0.0%) |
| College or Associate's Degree | 0 (0.0%) | 0 (0.0%) |
| Bachelor's Degree | 0 (0.0%) | 0 (0.0%) |
| Graduate Degree | 0 (0.0%) | 0 (0.0%) |
| Total | 0 (0.0%) | 0 (0.0%) |
Employment Characteristics in Churchill
Employment by Class of Employer in Churchill
Among the 880 employed individuals in Churchill, private company employees (641 | 72.8%), self-employed (not incorporated) (96 | 10.9%), and not-for-profit organizations (67 | 7.6%) make up the most common classes of employment.
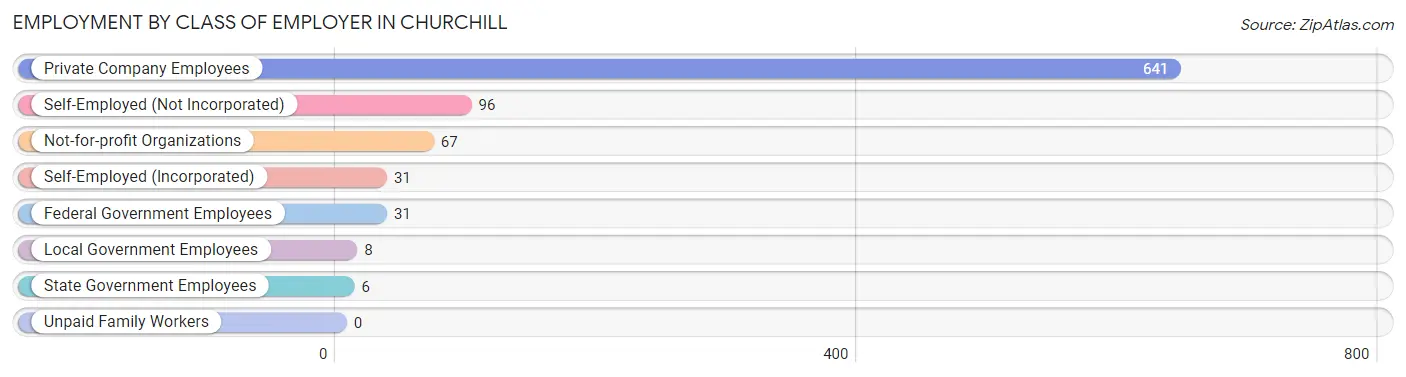
| Employer Class | # Employees | % Employees |
| Private Company Employees | 641 | 72.8% |
| Self-Employed (Incorporated) | 31 | 3.5% |
| Self-Employed (Not Incorporated) | 96 | 10.9% |
| Not-for-profit Organizations | 67 | 7.6% |
| Local Government Employees | 8 | 0.9% |
| State Government Employees | 6 | 0.7% |
| Federal Government Employees | 31 | 3.5% |
| Unpaid Family Workers | 0 | 0.0% |
| Total | 880 | 100.0% |
Employment Status by Age in Churchill
According to the labor force statistics for Churchill, out of the total population over 16 years of age (1,670), 65.0% or 1,086 individuals are in the labor force, with 5.3% or 58 of them unemployed. The age group with the highest labor force participation rate is 20 to 24 years, with 100.0% or 17 individuals in the labor force. Within the labor force, the 45 to 54 years age range has the highest percentage of unemployed individuals, with 22.2% or 48 of them being unemployed.
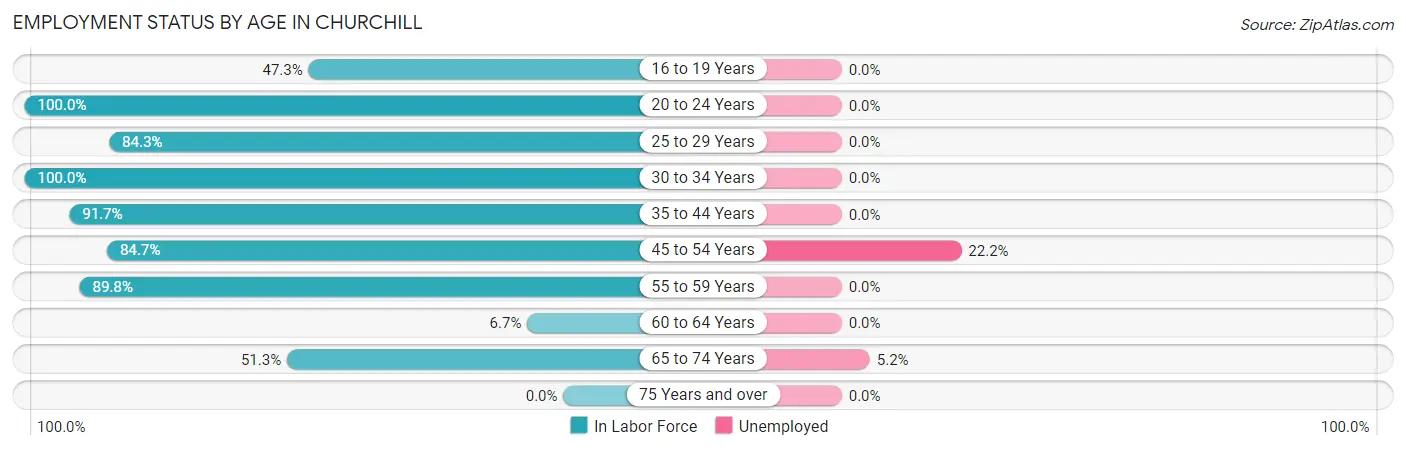
| Age Bracket | In Labor Force | Unemployed |
| 16 to 19 Years | 53 (47.3%) | 0 (0.0%) |
| 20 to 24 Years | 17 (100.0%) | 0 (0.0%) |
| 25 to 29 Years | 91 (84.3%) | 0 (0.0%) |
| 30 to 34 Years | 146 (100.0%) | 0 (0.0%) |
| 35 to 44 Years | 244 (91.7%) | 0 (0.0%) |
| 45 to 54 Years | 216 (84.7%) | 48 (22.2%) |
| 55 to 59 Years | 115 (89.8%) | 0 (0.0%) |
| 60 to 64 Years | 10 (6.7%) | 0 (0.0%) |
| 65 to 74 Years | 194 (51.3%) | 10 (5.2%) |
| 75 Years and over | 0 (0.0%) | 0 (0.0%) |
| Total | 1,086 (65.0%) | 58 (5.3%) |
Employment Status by Educational Attainment in Churchill
According to labor force statistics for Churchill, 78.1% of individuals (822) out of the total population between 25 and 64 years of age (1,052) are in the labor force, with 5.8% or 48 of them being unemployed. The group with the highest labor force participation rate are those with the educational attainment of bachelor's degree or higher, with 100.0% or 167 individuals in the labor force. Within the labor force, individuals with bachelor's degree or higher education have the highest percentage of unemployment, with 28.7% or 48 of them being unemployed.
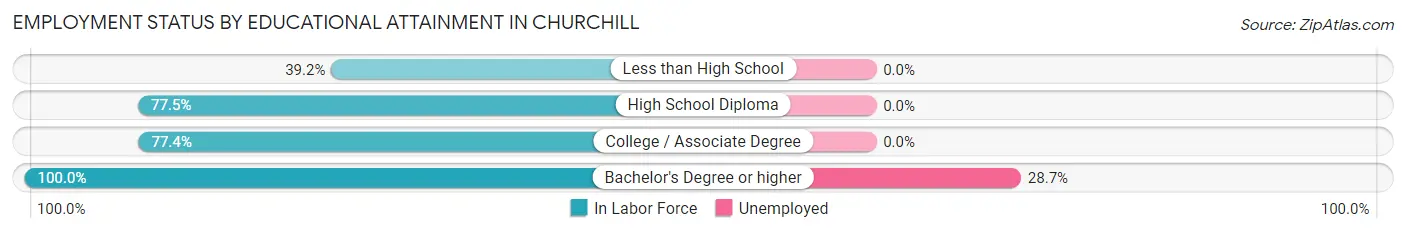
| Educational Attainment | In Labor Force | Unemployed |
| Less than High School | 31 (39.2%) | 0 (0.0%) |
| High School Diploma | 220 (77.5%) | 0 (0.0%) |
| College / Associate Degree | 404 (77.4%) | 0 (0.0%) |
| Bachelor's Degree or higher | 167 (100.0%) | 48 (28.7%) |
| Total | 822 (78.1%) | 61 (5.8%) |
Employment Occupations by Sex in Churchill
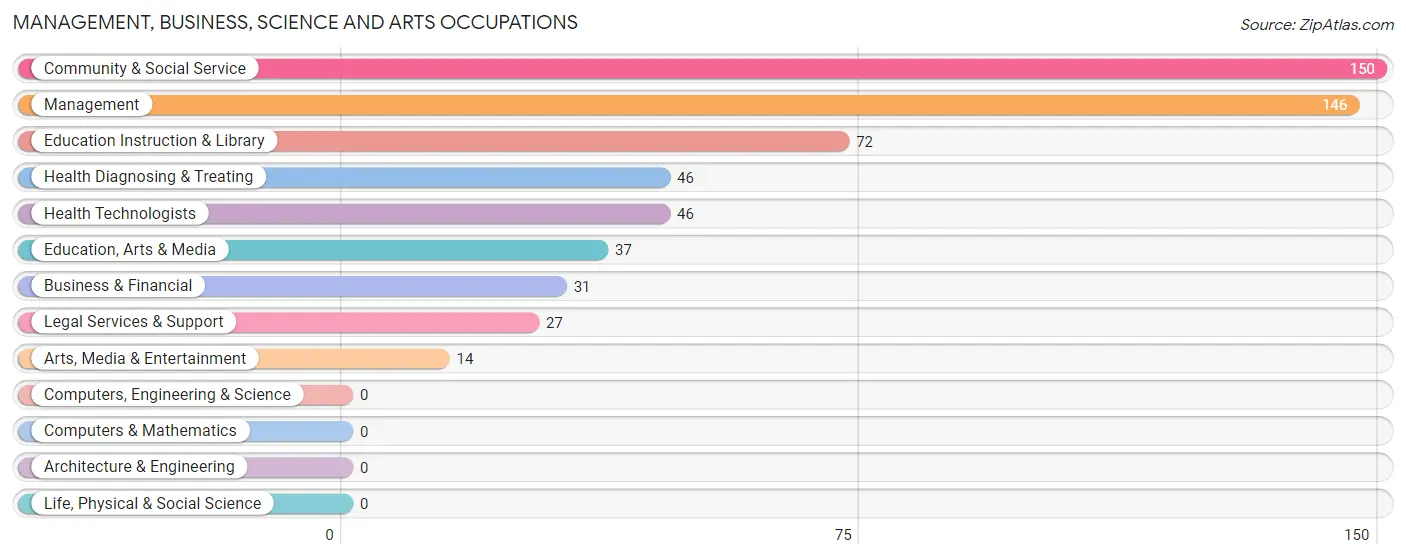
Management, Business, Science and Arts Occupations
The most common Management, Business, Science and Arts occupations in Churchill are Community & Social Service (150 | 14.6%), Management (146 | 14.2%), Education Instruction & Library (72 | 7.0%), Health Diagnosing & Treating (46 | 4.5%), and Health Technologists (46 | 4.5%).
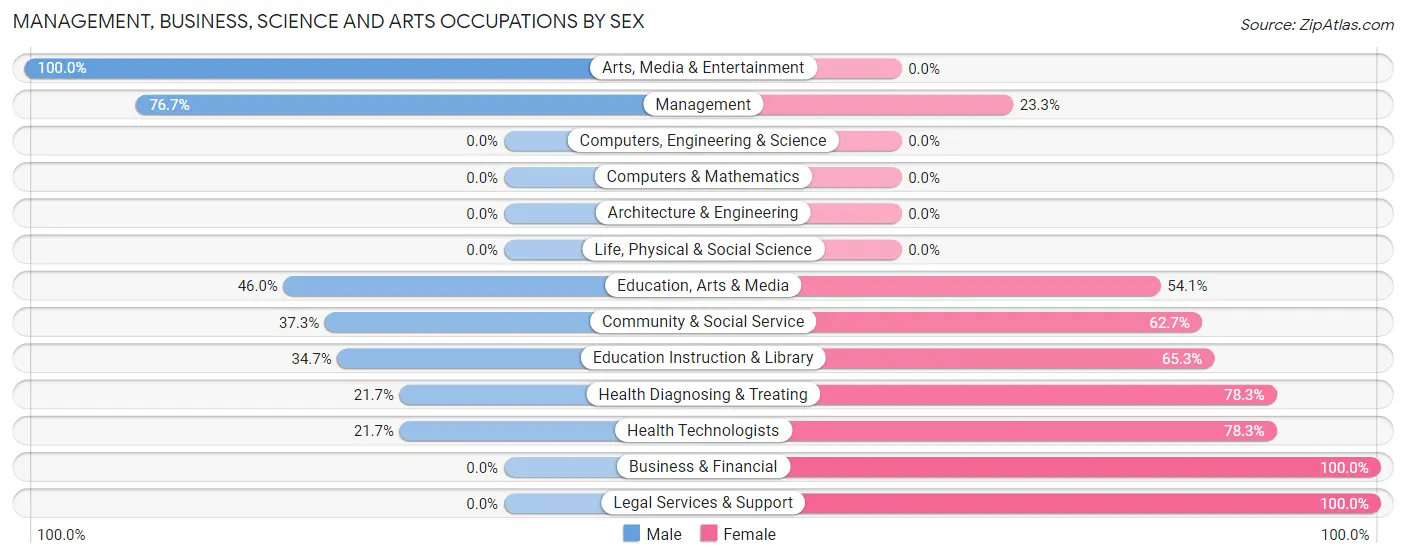
Management, Business, Science and Arts Occupations by Sex
Within the Management, Business, Science and Arts occupations in Churchill, the most male-oriented occupations are Arts, Media & Entertainment (100.0%), Management (76.7%), and Education, Arts & Media (46.0%), while the most female-oriented occupations are Business & Financial (100.0%), Legal Services & Support (100.0%), and Health Diagnosing & Treating (78.3%).
| Occupation | Male | Female |
| Management | 112 (76.7%) | 34 (23.3%) |
| Business & Financial | 0 (0.0%) | 31 (100.0%) |
| Computers, Engineering & Science | 0 (0.0%) | 0 (0.0%) |
| Computers & Mathematics | 0 (0.0%) | 0 (0.0%) |
| Architecture & Engineering | 0 (0.0%) | 0 (0.0%) |
| Life, Physical & Social Science | 0 (0.0%) | 0 (0.0%) |
| Community & Social Service | 56 (37.3%) | 94 (62.7%) |
| Education, Arts & Media | 17 (46.0%) | 20 (54.0%) |
| Legal Services & Support | 0 (0.0%) | 27 (100.0%) |
| Education Instruction & Library | 25 (34.7%) | 47 (65.3%) |
| Arts, Media & Entertainment | 14 (100.0%) | 0 (0.0%) |
| Health Diagnosing & Treating | 10 (21.7%) | 36 (78.3%) |
| Health Technologists | 10 (21.7%) | 36 (78.3%) |
| Total (Category) | 178 (47.7%) | 195 (52.3%) |
| Total (Overall) | 508 (49.4%) | 520 (50.6%) |
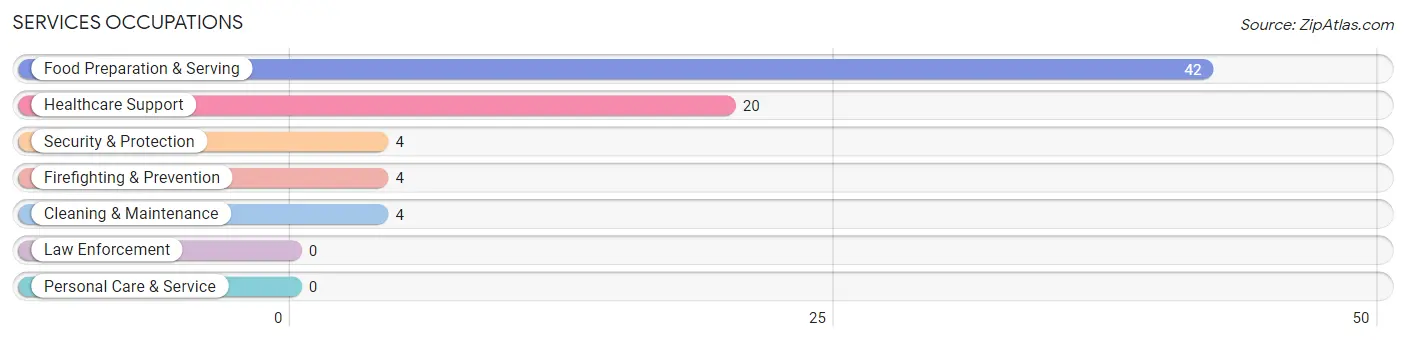
Services Occupations
The most common Services occupations in Churchill are Food Preparation & Serving (42 | 4.1%), Healthcare Support (20 | 1.9%), Security & Protection (4 | 0.4%), Firefighting & Prevention (4 | 0.4%), and Cleaning & Maintenance (4 | 0.4%).
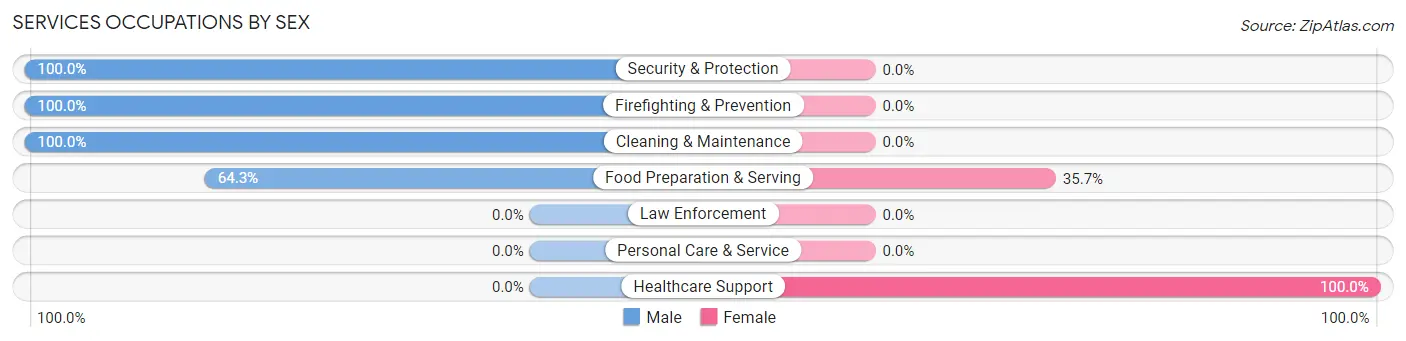
Services Occupations by Sex
Within the Services occupations in Churchill, the most male-oriented occupations are Security & Protection (100.0%), Firefighting & Prevention (100.0%), and Cleaning & Maintenance (100.0%), while the most female-oriented occupations are Healthcare Support (100.0%), and Food Preparation & Serving (35.7%).
| Occupation | Male | Female |
| Healthcare Support | 0 (0.0%) | 20 (100.0%) |
| Security & Protection | 4 (100.0%) | 0 (0.0%) |
| Firefighting & Prevention | 4 (100.0%) | 0 (0.0%) |
| Law Enforcement | 0 (0.0%) | 0 (0.0%) |
| Food Preparation & Serving | 27 (64.3%) | 15 (35.7%) |
| Cleaning & Maintenance | 4 (100.0%) | 0 (0.0%) |
| Personal Care & Service | 0 (0.0%) | 0 (0.0%) |
| Total (Category) | 35 (50.0%) | 35 (50.0%) |
| Total (Overall) | 508 (49.4%) | 520 (50.6%) |
Sales and Office Occupations
The most common Sales and Office occupations in Churchill are Sales & Related (173 | 16.8%), and Office & Administration (23 | 2.2%).
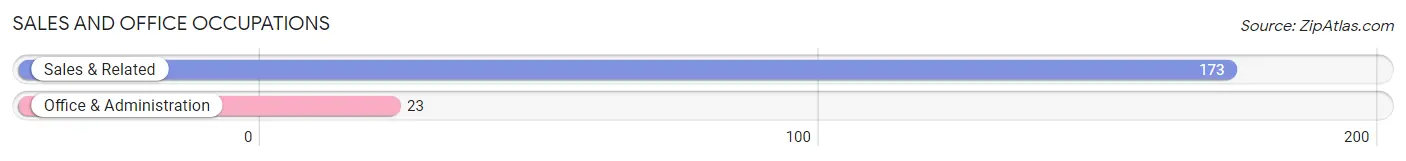
Sales and Office Occupations by Sex
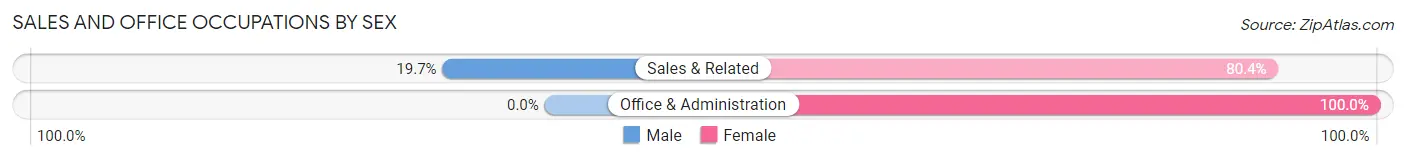
| Occupation | Male | Female |
| Sales & Related | 34 (19.7%) | 139 (80.3%) |
| Office & Administration | 0 (0.0%) | 23 (100.0%) |
| Total (Category) | 34 (17.3%) | 162 (82.7%) |
| Total (Overall) | 508 (49.4%) | 520 (50.6%) |
Natural Resources, Construction and Maintenance Occupations
The most common Natural Resources, Construction and Maintenance occupations in Churchill are Construction & Extraction (63 | 6.1%), and Installation, Maintenance & Repair (25 | 2.4%).
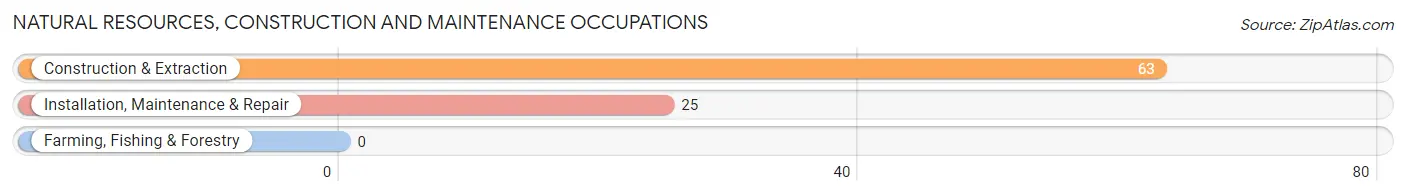
Natural Resources, Construction and Maintenance Occupations by Sex
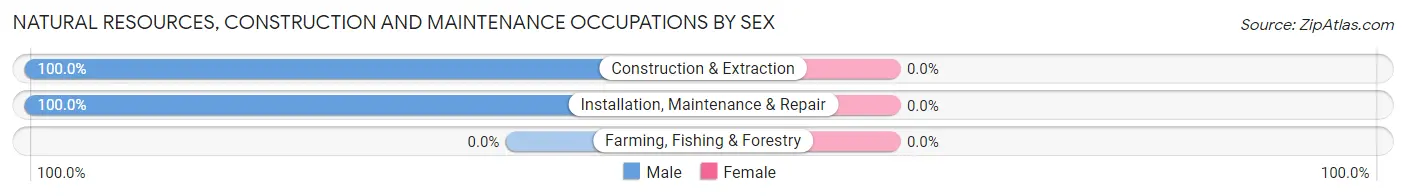
| Occupation | Male | Female |
| Farming, Fishing & Forestry | 0 (0.0%) | 0 (0.0%) |
| Construction & Extraction | 63 (100.0%) | 0 (0.0%) |
| Installation, Maintenance & Repair | 25 (100.0%) | 0 (0.0%) |
| Total (Category) | 88 (100.0%) | 0 (0.0%) |
| Total (Overall) | 508 (49.4%) | 520 (50.6%) |
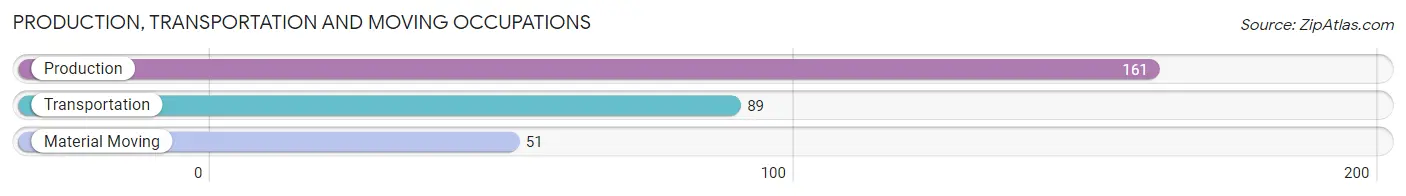
Production, Transportation and Moving Occupations
The most common Production, Transportation and Moving occupations in Churchill are Production (161 | 15.7%), Transportation (89 | 8.7%), and Material Moving (51 | 5.0%).
Production, Transportation and Moving Occupations by Sex
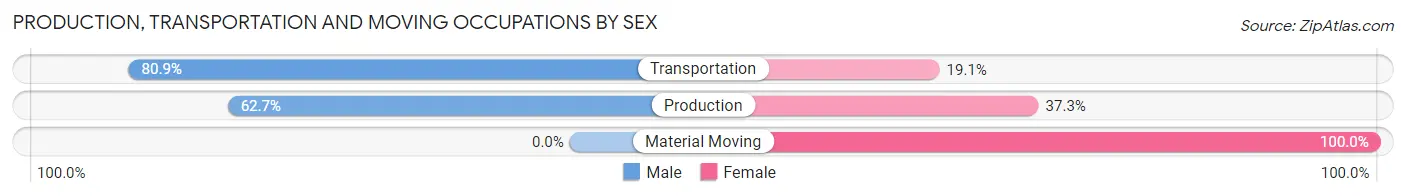
| Occupation | Male | Female |
| Production | 101 (62.7%) | 60 (37.3%) |
| Transportation | 72 (80.9%) | 17 (19.1%) |
| Material Moving | 0 (0.0%) | 51 (100.0%) |
| Total (Category) | 173 (57.5%) | 128 (42.5%) |
| Total (Overall) | 508 (49.4%) | 520 (50.6%) |
Employment Industries by Sex in Churchill
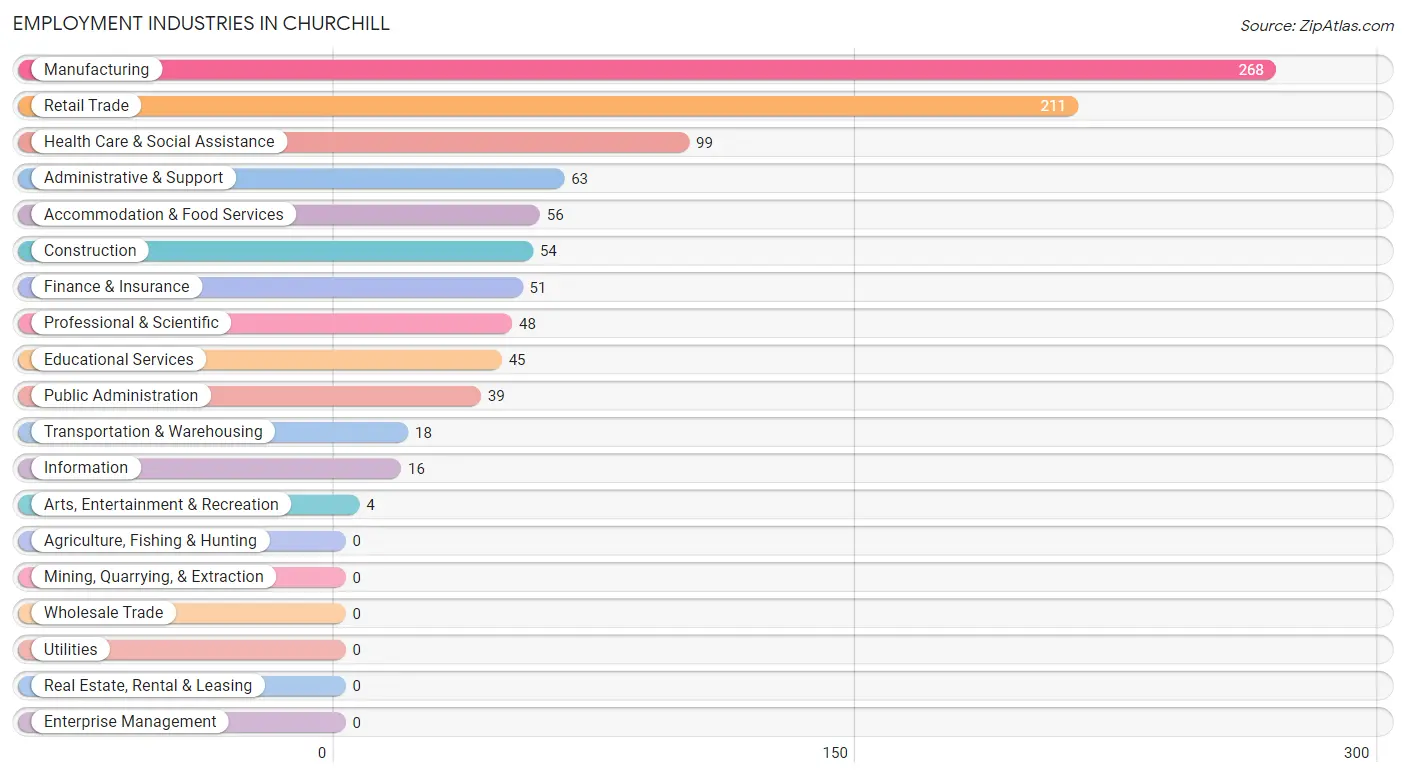
Employment Industries in Churchill
The major employment industries in Churchill include Manufacturing (268 | 26.1%), Retail Trade (211 | 20.5%), Health Care & Social Assistance (99 | 9.6%), Administrative & Support (63 | 6.1%), and Accommodation & Food Services (56 | 5.4%).
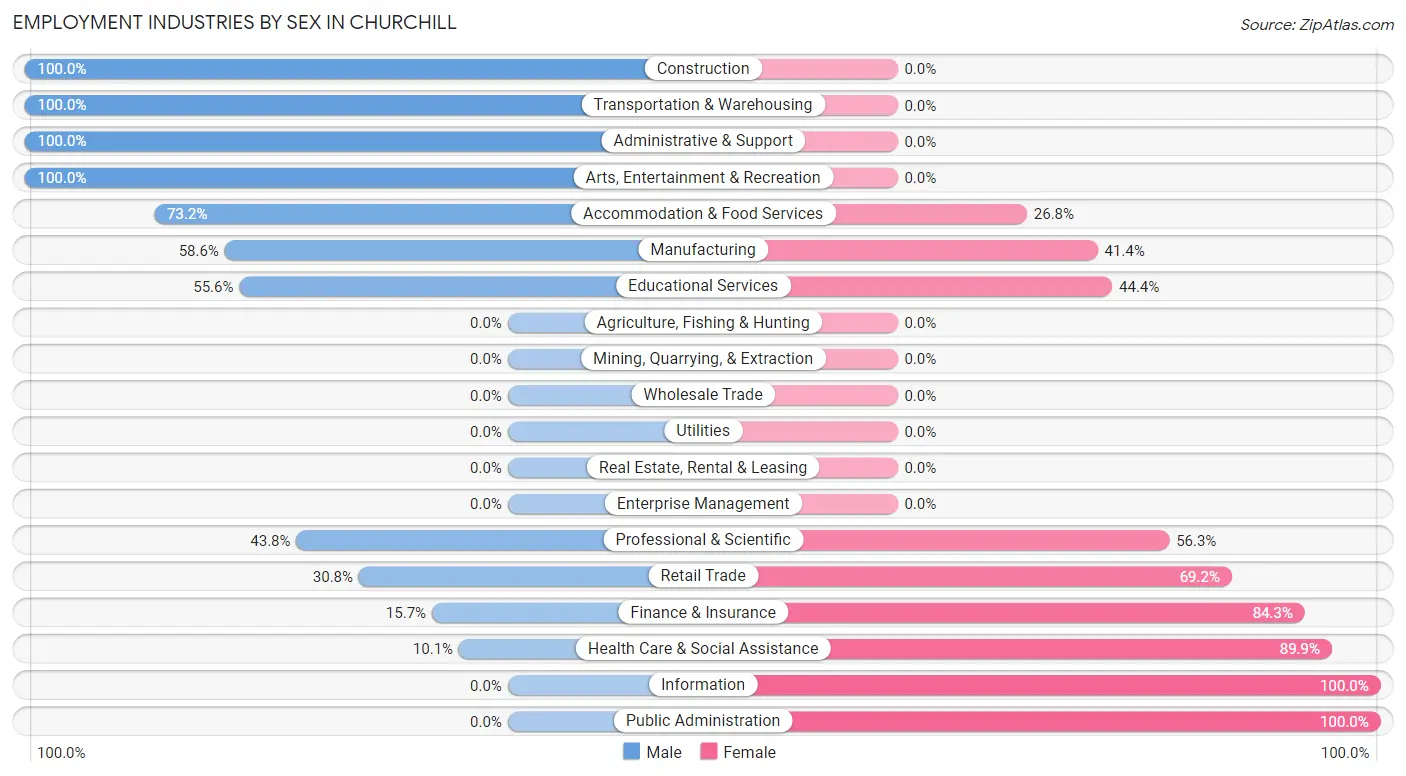
Employment Industries by Sex in Churchill
The Churchill industries that see more men than women are Construction (100.0%), Transportation & Warehousing (100.0%), and Administrative & Support (100.0%), whereas the industries that tend to have a higher number of women are Information (100.0%), Public Administration (100.0%), and Health Care & Social Assistance (89.9%).
| Industry | Male | Female |
| Agriculture, Fishing & Hunting | 0 (0.0%) | 0 (0.0%) |
| Mining, Quarrying, & Extraction | 0 (0.0%) | 0 (0.0%) |
| Construction | 54 (100.0%) | 0 (0.0%) |
| Manufacturing | 157 (58.6%) | 111 (41.4%) |
| Wholesale Trade | 0 (0.0%) | 0 (0.0%) |
| Retail Trade | 65 (30.8%) | 146 (69.2%) |
| Transportation & Warehousing | 18 (100.0%) | 0 (0.0%) |
| Utilities | 0 (0.0%) | 0 (0.0%) |
| Information | 0 (0.0%) | 16 (100.0%) |
| Finance & Insurance | 8 (15.7%) | 43 (84.3%) |
| Real Estate, Rental & Leasing | 0 (0.0%) | 0 (0.0%) |
| Professional & Scientific | 21 (43.8%) | 27 (56.2%) |
| Enterprise Management | 0 (0.0%) | 0 (0.0%) |
| Administrative & Support | 63 (100.0%) | 0 (0.0%) |
| Educational Services | 25 (55.6%) | 20 (44.4%) |
| Health Care & Social Assistance | 10 (10.1%) | 89 (89.9%) |
| Arts, Entertainment & Recreation | 4 (100.0%) | 0 (0.0%) |
| Accommodation & Food Services | 41 (73.2%) | 15 (26.8%) |
| Public Administration | 0 (0.0%) | 39 (100.0%) |
| Total | 508 (49.4%) | 520 (50.6%) |
Education in Churchill
School Enrollment in Churchill
The most common levels of schooling among the 469 students in Churchill are elementary school (219 | 46.7%), high school (138 | 29.4%), and middle school (83 | 17.7%).
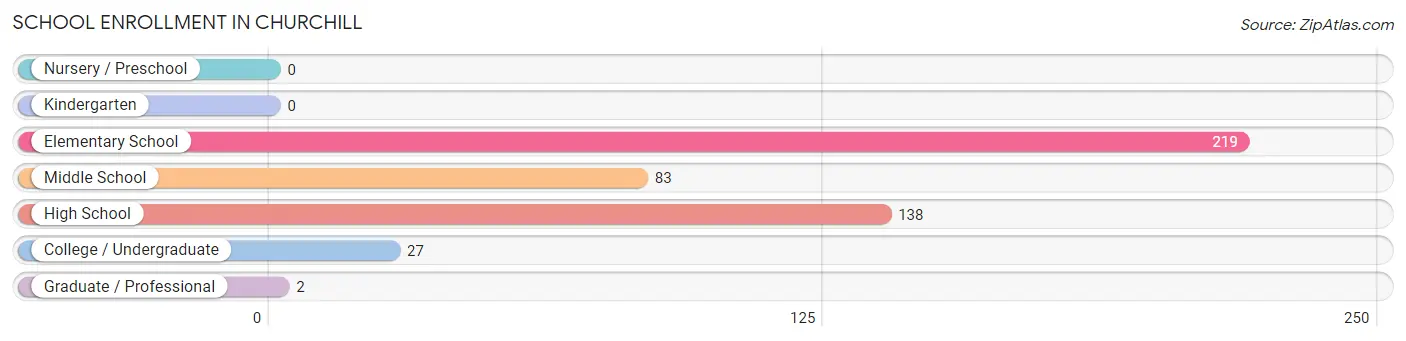
| School Level | # Students | % Students |
| Nursery / Preschool | 0 | 0.0% |
| Kindergarten | 0 | 0.0% |
| Elementary School | 219 | 46.7% |
| Middle School | 83 | 17.7% |
| High School | 138 | 29.4% |
| College / Undergraduate | 27 | 5.8% |
| Graduate / Professional | 2 | 0.4% |
| Total | 469 | 100.0% |
School Enrollment by Age by Funding Source in Churchill
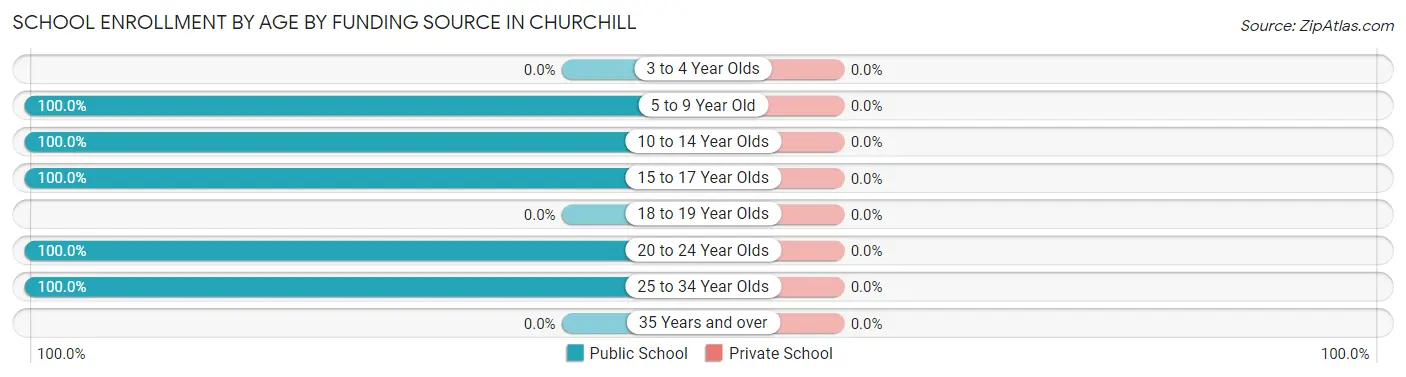
| Age Bracket | Public School | Private School |
| 3 to 4 Year Olds | 0 (0.0%) | 0 (0.0%) |
| 5 to 9 Year Old | 161 (100.0%) | 0 (0.0%) |
| 10 to 14 Year Olds | 167 (100.0%) | 0 (0.0%) |
| 15 to 17 Year Olds | 112 (100.0%) | 0 (0.0%) |
| 18 to 19 Year Olds | 0 (0.0%) | 0 (0.0%) |
| 20 to 24 Year Olds | 2 (100.0%) | 0 (0.0%) |
| 25 to 34 Year Olds | 27 (100.0%) | 0 (0.0%) |
| 35 Years and over | 0 (0.0%) | 0 (0.0%) |
| Total | 469 (100.0%) | 0 (0.0%) |
Educational Attainment by Field of Study in Churchill
Education (112 | 37.5%), liberal arts & history (64 | 21.4%), business (48 | 16.1%), arts & humanities (31 | 10.4%), and science & technology (27 | 9.0%) are the most common fields of study among 299 individuals in Churchill who have obtained a bachelor's degree or higher.
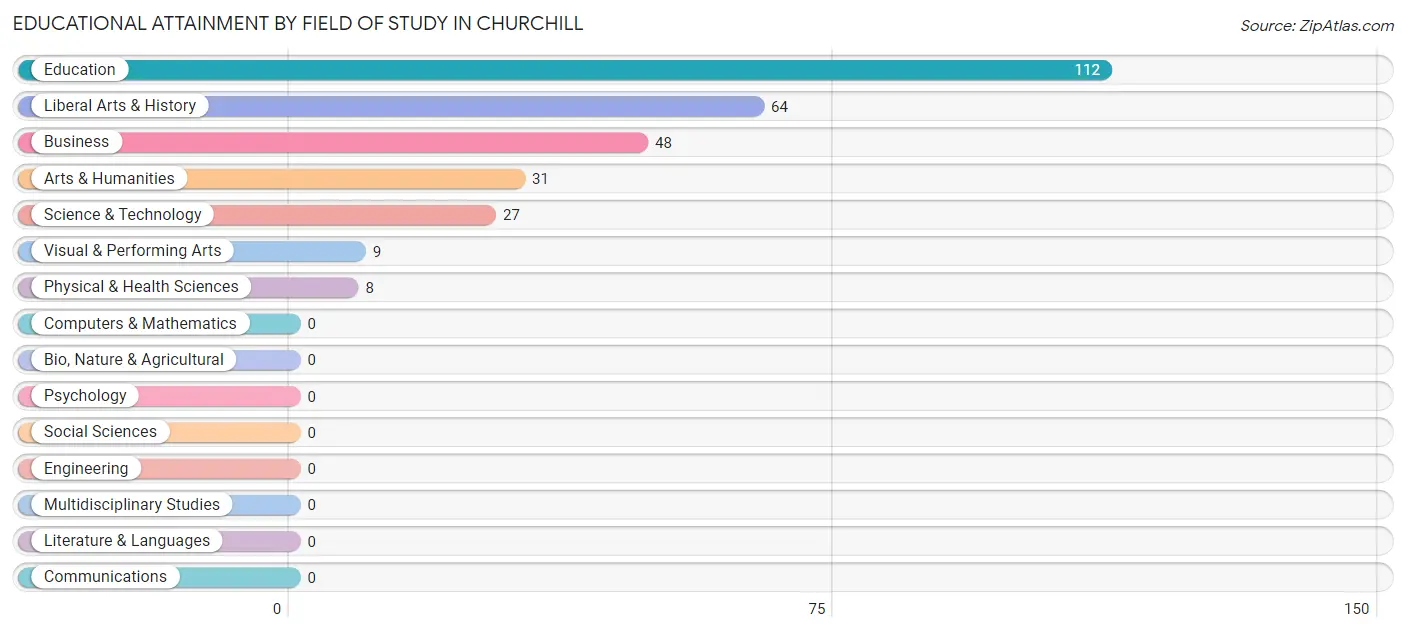
| Field of Study | # Graduates | % Graduates |
| Computers & Mathematics | 0 | 0.0% |
| Bio, Nature & Agricultural | 0 | 0.0% |
| Physical & Health Sciences | 8 | 2.7% |
| Psychology | 0 | 0.0% |
| Social Sciences | 0 | 0.0% |
| Engineering | 0 | 0.0% |
| Multidisciplinary Studies | 0 | 0.0% |
| Science & Technology | 27 | 9.0% |
| Business | 48 | 16.1% |
| Education | 112 | 37.5% |
| Literature & Languages | 0 | 0.0% |
| Liberal Arts & History | 64 | 21.4% |
| Visual & Performing Arts | 9 | 3.0% |
| Communications | 0 | 0.0% |
| Arts & Humanities | 31 | 10.4% |
| Total | 299 | 100.0% |
Transportation & Commute in Churchill
Vehicle Availability by Sex in Churchill
The most prevalent vehicle ownership categories in Churchill are males with 2 vehicles (240, accounting for 57.1%) and females with 2 vehicles (275, making up 52.2%).
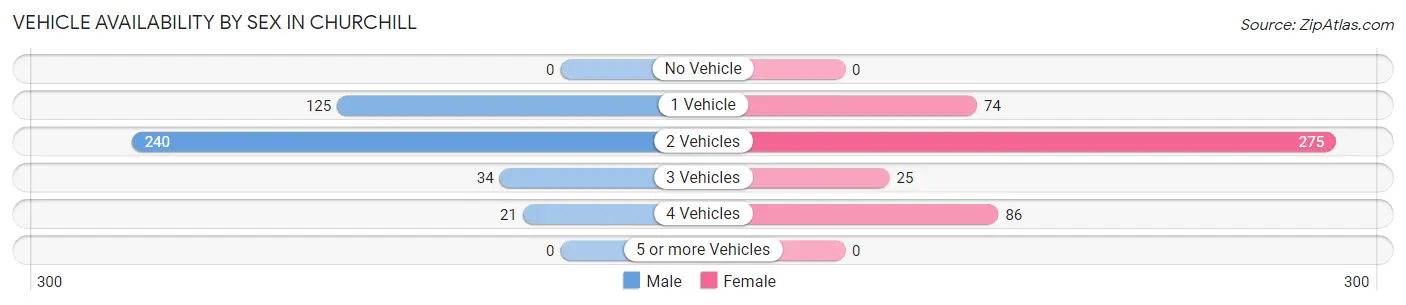
| Vehicles Available | Male | Female |
| No Vehicle | 0 (0.0%) | 0 (0.0%) |
| 1 Vehicle | 125 (29.8%) | 74 (16.1%) |
| 2 Vehicles | 240 (57.1%) | 275 (59.8%) |
| 3 Vehicles | 34 (8.1%) | 25 (5.4%) |
| 4 Vehicles | 21 (5.0%) | 86 (18.7%) |
| 5 or more Vehicles | 0 (0.0%) | 0 (0.0%) |
| Total | 420 (100.0%) | 460 (100.0%) |
Commute Time in Churchill
The most frequently occuring commute durations in Churchill are 15 to 19 minutes (200 commuters, 23.0%), 20 to 24 minutes (194 commuters, 22.3%), and 30 to 34 minutes (127 commuters, 14.6%).
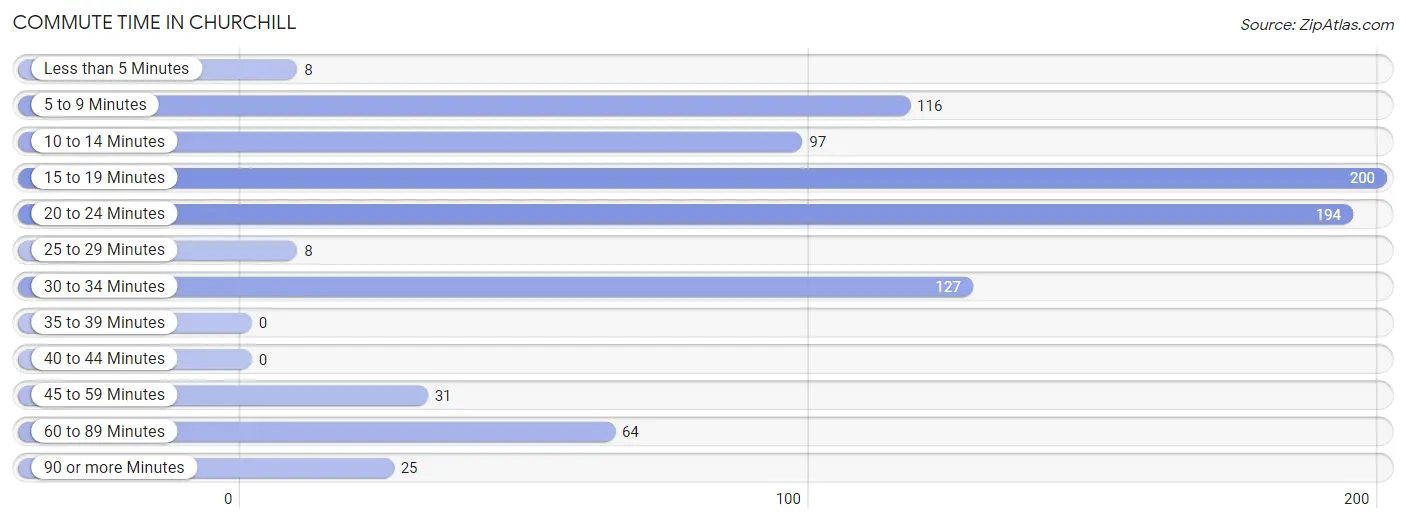
| Commute Time | # Commuters | % Commuters |
| Less than 5 Minutes | 8 | 0.9% |
| 5 to 9 Minutes | 116 | 13.3% |
| 10 to 14 Minutes | 97 | 11.2% |
| 15 to 19 Minutes | 200 | 23.0% |
| 20 to 24 Minutes | 194 | 22.3% |
| 25 to 29 Minutes | 8 | 0.9% |
| 30 to 34 Minutes | 127 | 14.6% |
| 35 to 39 Minutes | 0 | 0.0% |
| 40 to 44 Minutes | 0 | 0.0% |
| 45 to 59 Minutes | 31 | 3.6% |
| 60 to 89 Minutes | 64 | 7.4% |
| 90 or more Minutes | 25 | 2.9% |
Commute Time by Sex in Churchill
The most common commute times in Churchill are 15 to 19 minutes (100 commuters, 23.8%) for males and 20 to 24 minutes (147 commuters, 32.7%) for females.
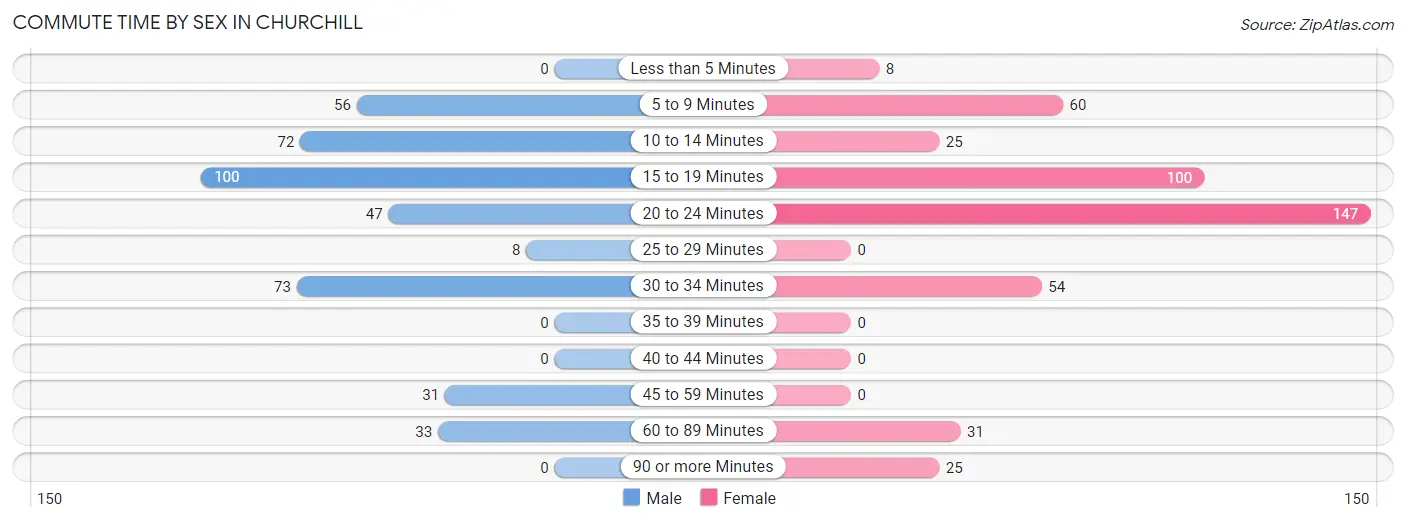
| Commute Time | Male | Female |
| Less than 5 Minutes | 0 (0.0%) | 8 (1.8%) |
| 5 to 9 Minutes | 56 (13.3%) | 60 (13.3%) |
| 10 to 14 Minutes | 72 (17.1%) | 25 (5.6%) |
| 15 to 19 Minutes | 100 (23.8%) | 100 (22.2%) |
| 20 to 24 Minutes | 47 (11.2%) | 147 (32.7%) |
| 25 to 29 Minutes | 8 (1.9%) | 0 (0.0%) |
| 30 to 34 Minutes | 73 (17.4%) | 54 (12.0%) |
| 35 to 39 Minutes | 0 (0.0%) | 0 (0.0%) |
| 40 to 44 Minutes | 0 (0.0%) | 0 (0.0%) |
| 45 to 59 Minutes | 31 (7.4%) | 0 (0.0%) |
| 60 to 89 Minutes | 33 (7.9%) | 31 (6.9%) |
| 90 or more Minutes | 0 (0.0%) | 25 (5.6%) |
Time of Departure to Work by Sex in Churchill
The most frequent times of departure to work in Churchill are 7:30 AM to 7:59 AM (149, 35.5%) for males and 9:00 AM to 9:59 AM (75, 16.7%) for females.
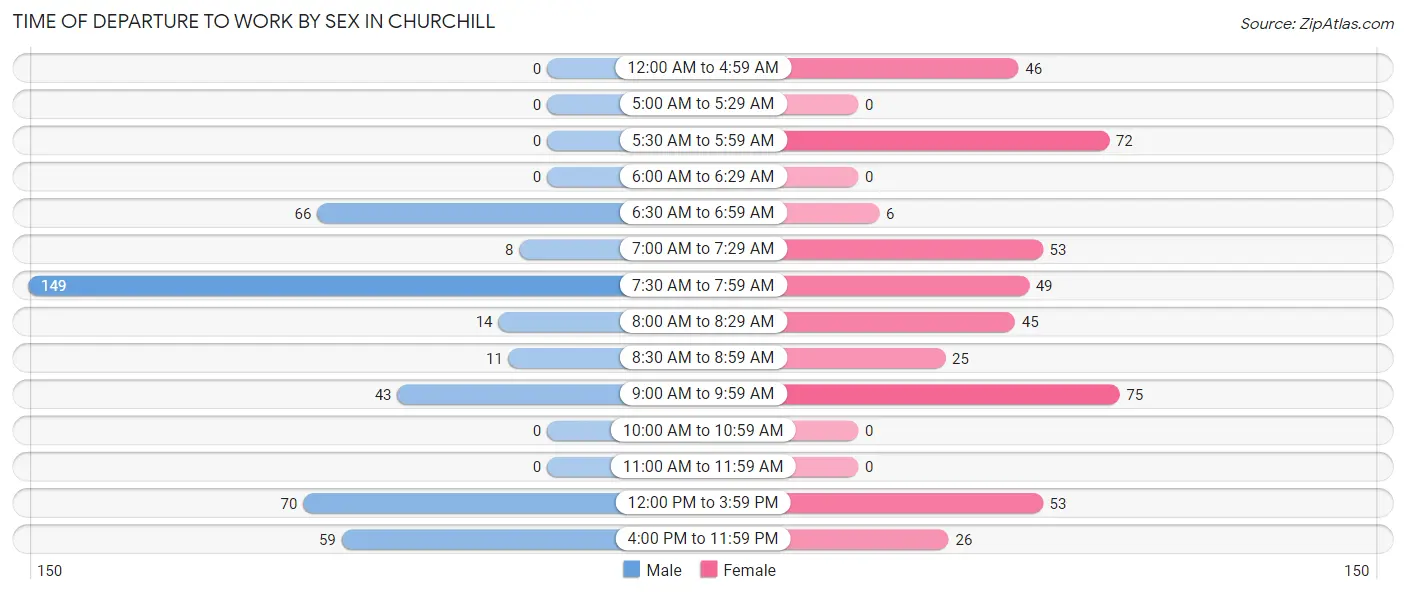
| Time of Departure | Male | Female |
| 12:00 AM to 4:59 AM | 0 (0.0%) | 46 (10.2%) |
| 5:00 AM to 5:29 AM | 0 (0.0%) | 0 (0.0%) |
| 5:30 AM to 5:59 AM | 0 (0.0%) | 72 (16.0%) |
| 6:00 AM to 6:29 AM | 0 (0.0%) | 0 (0.0%) |
| 6:30 AM to 6:59 AM | 66 (15.7%) | 6 (1.3%) |
| 7:00 AM to 7:29 AM | 8 (1.9%) | 53 (11.8%) |
| 7:30 AM to 7:59 AM | 149 (35.5%) | 49 (10.9%) |
| 8:00 AM to 8:29 AM | 14 (3.3%) | 45 (10.0%) |
| 8:30 AM to 8:59 AM | 11 (2.6%) | 25 (5.6%) |
| 9:00 AM to 9:59 AM | 43 (10.2%) | 75 (16.7%) |
| 10:00 AM to 10:59 AM | 0 (0.0%) | 0 (0.0%) |
| 11:00 AM to 11:59 AM | 0 (0.0%) | 0 (0.0%) |
| 12:00 PM to 3:59 PM | 70 (16.7%) | 53 (11.8%) |
| 4:00 PM to 11:59 PM | 59 (14.1%) | 26 (5.8%) |
| Total | 420 (100.0%) | 450 (100.0%) |
Housing Occupancy in Churchill
Occupancy by Ownership in Churchill
Of the total 846 dwellings in Churchill, owner-occupied units account for 715 (84.5%), while renter-occupied units make up 131 (15.5%).
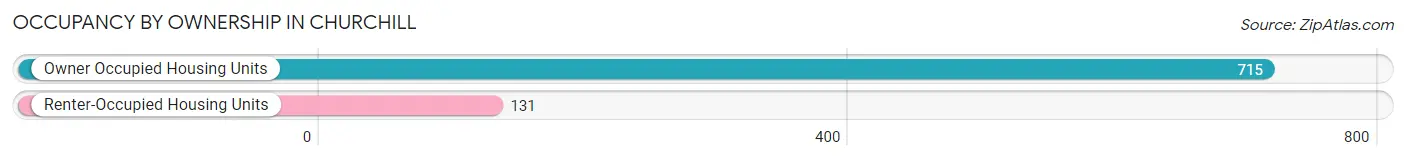
| Occupancy | # Housing Units | % Housing Units |
| Owner Occupied Housing Units | 715 | 84.5% |
| Renter-Occupied Housing Units | 131 | 15.5% |
| Total Occupied Housing Units | 846 | 100.0% |
Occupancy by Household Size in Churchill
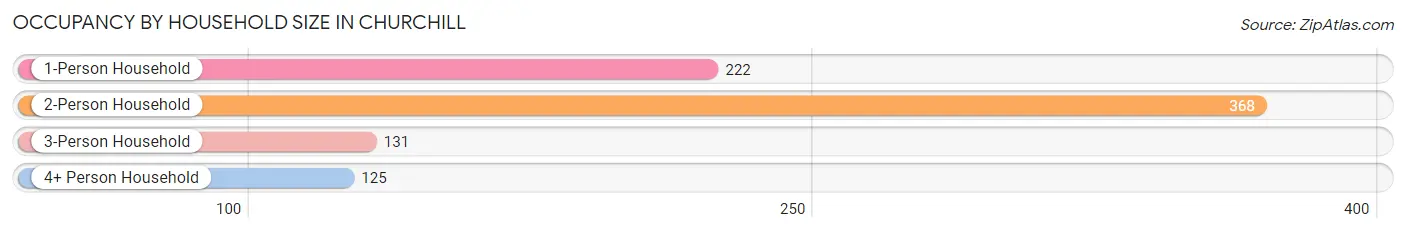
| Household Size | # Housing Units | % Housing Units |
| 1-Person Household | 222 | 26.2% |
| 2-Person Household | 368 | 43.5% |
| 3-Person Household | 131 | 15.5% |
| 4+ Person Household | 125 | 14.8% |
| Total Housing Units | 846 | 100.0% |
Occupancy by Ownership by Household Size in Churchill
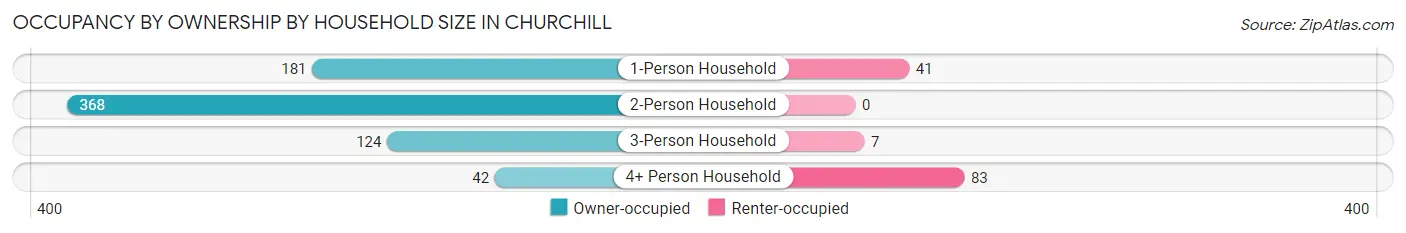
| Household Size | Owner-occupied | Renter-occupied |
| 1-Person Household | 181 (81.5%) | 41 (18.5%) |
| 2-Person Household | 368 (100.0%) | 0 (0.0%) |
| 3-Person Household | 124 (94.7%) | 7 (5.3%) |
| 4+ Person Household | 42 (33.6%) | 83 (66.4%) |
| Total Housing Units | 715 (84.5%) | 131 (15.5%) |
Occupancy by Educational Attainment in Churchill
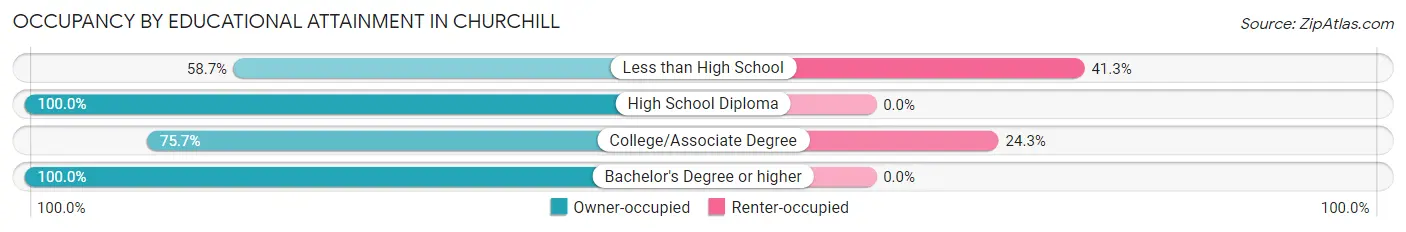
| Household Size | Owner-occupied | Renter-occupied |
| Less than High School | 54 (58.7%) | 38 (41.3%) |
| High School Diploma | 193 (100.0%) | 0 (0.0%) |
| College/Associate Degree | 290 (75.7%) | 93 (24.3%) |
| Bachelor's Degree or higher | 178 (100.0%) | 0 (0.0%) |
Occupancy by Age of Householder in Churchill
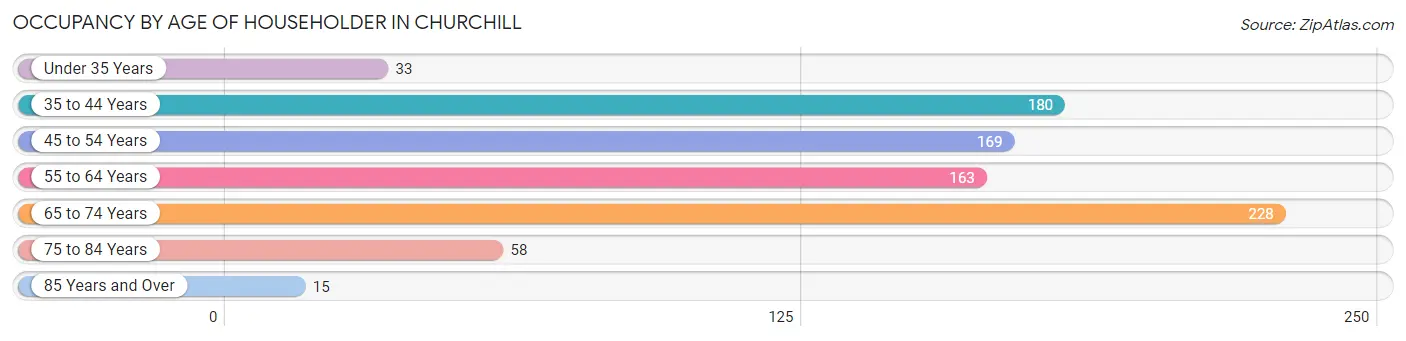
| Age Bracket | # Households | % Households |
| Under 35 Years | 33 | 3.9% |
| 35 to 44 Years | 180 | 21.3% |
| 45 to 54 Years | 169 | 20.0% |
| 55 to 64 Years | 163 | 19.3% |
| 65 to 74 Years | 228 | 27.0% |
| 75 to 84 Years | 58 | 6.9% |
| 85 Years and Over | 15 | 1.8% |
| Total | 846 | 100.0% |
Housing Finances in Churchill
Median Income by Occupancy in Churchill
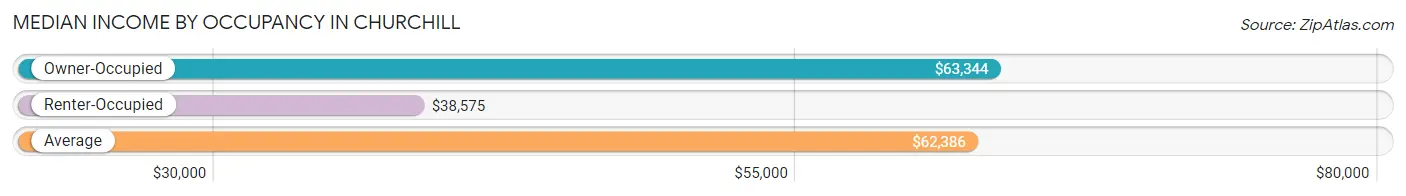
| Occupancy Type | # Households | Median Income |
| Owner-Occupied | 715 (84.5%) | $63,344 |
| Renter-Occupied | 131 (15.5%) | $38,575 |
| Average | 846 (100.0%) | $62,386 |
Occupancy by Householder Income Bracket in Churchill
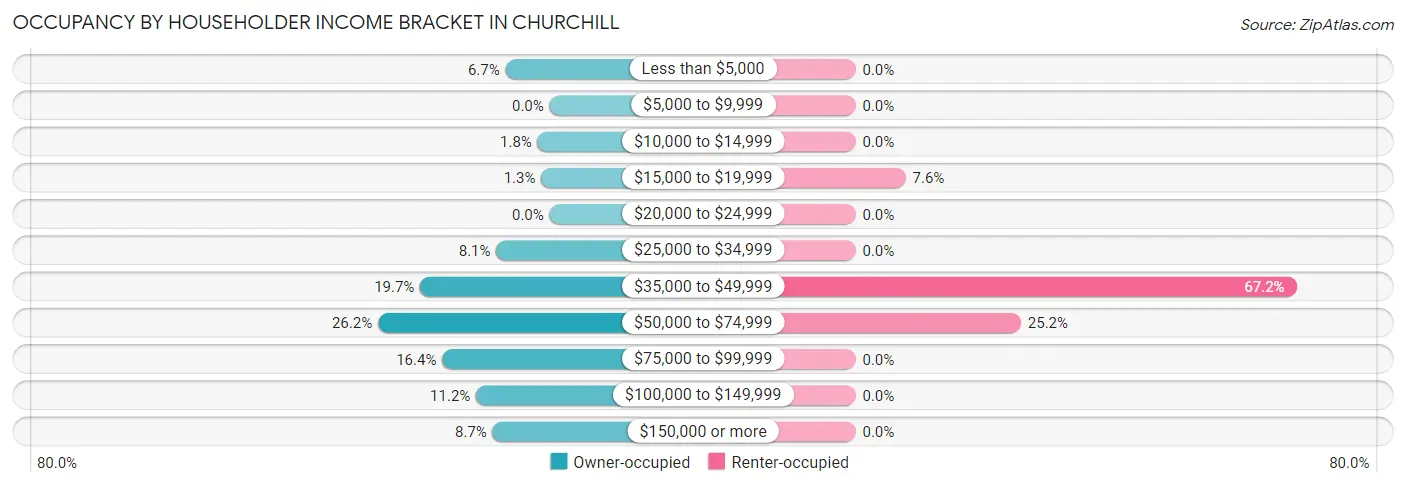
| Income Bracket | Owner-occupied | Renter-occupied |
| Less than $5,000 | 48 (6.7%) | 0 (0.0%) |
| $5,000 to $9,999 | 0 (0.0%) | 0 (0.0%) |
| $10,000 to $14,999 | 13 (1.8%) | 0 (0.0%) |
| $15,000 to $19,999 | 9 (1.3%) | 10 (7.6%) |
| $20,000 to $24,999 | 0 (0.0%) | 0 (0.0%) |
| $25,000 to $34,999 | 58 (8.1%) | 0 (0.0%) |
| $35,000 to $49,999 | 141 (19.7%) | 88 (67.2%) |
| $50,000 to $74,999 | 187 (26.2%) | 33 (25.2%) |
| $75,000 to $99,999 | 117 (16.4%) | 0 (0.0%) |
| $100,000 to $149,999 | 80 (11.2%) | 0 (0.0%) |
| $150,000 or more | 62 (8.7%) | 0 (0.0%) |
| Total | 715 (100.0%) | 131 (100.0%) |
Monthly Housing Cost Tiers in Churchill
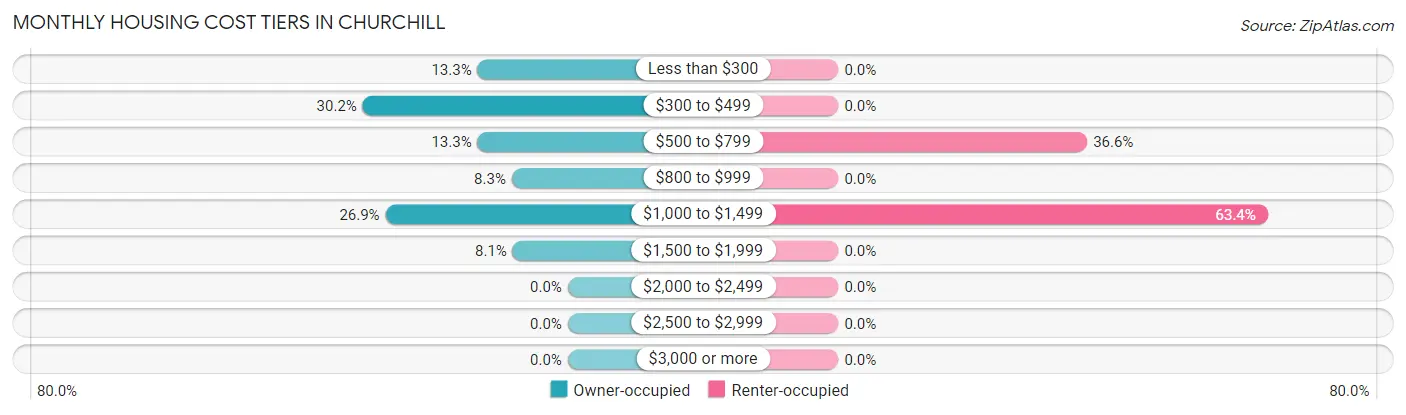
| Monthly Cost | Owner-occupied | Renter-occupied |
| Less than $300 | 95 (13.3%) | 0 (0.0%) |
| $300 to $499 | 216 (30.2%) | 0 (0.0%) |
| $500 to $799 | 95 (13.3%) | 48 (36.6%) |
| $800 to $999 | 59 (8.3%) | 0 (0.0%) |
| $1,000 to $1,499 | 192 (26.9%) | 83 (63.4%) |
| $1,500 to $1,999 | 58 (8.1%) | 0 (0.0%) |
| $2,000 to $2,499 | 0 (0.0%) | 0 (0.0%) |
| $2,500 to $2,999 | 0 (0.0%) | 0 (0.0%) |
| $3,000 or more | 0 (0.0%) | 0 (0.0%) |
| Total | 715 (100.0%) | 131 (100.0%) |
Physical Housing Characteristics in Churchill
Housing Structures in Churchill
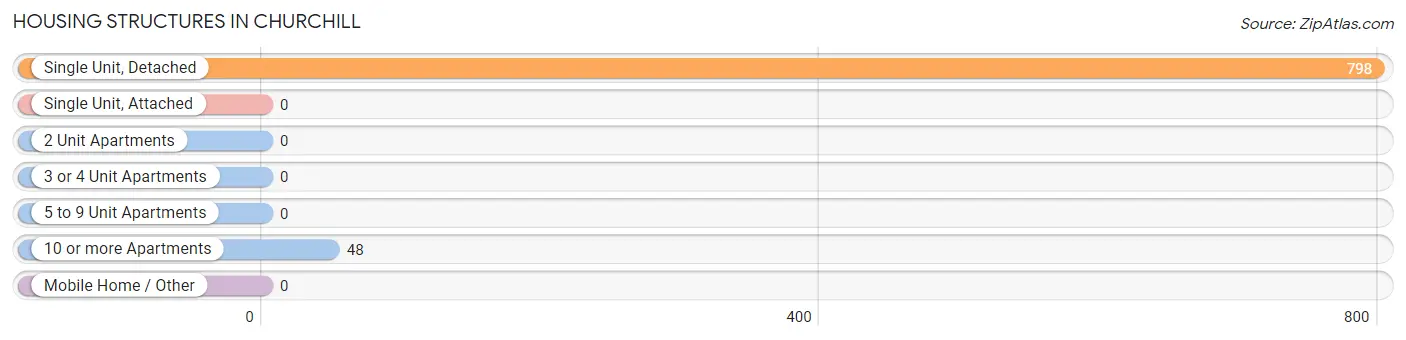
| Structure Type | # Housing Units | % Housing Units |
| Single Unit, Detached | 798 | 94.3% |
| Single Unit, Attached | 0 | 0.0% |
| 2 Unit Apartments | 0 | 0.0% |
| 3 or 4 Unit Apartments | 0 | 0.0% |
| 5 to 9 Unit Apartments | 0 | 0.0% |
| 10 or more Apartments | 48 | 5.7% |
| Mobile Home / Other | 0 | 0.0% |
| Total | 846 | 100.0% |
Housing Structures by Occupancy in Churchill
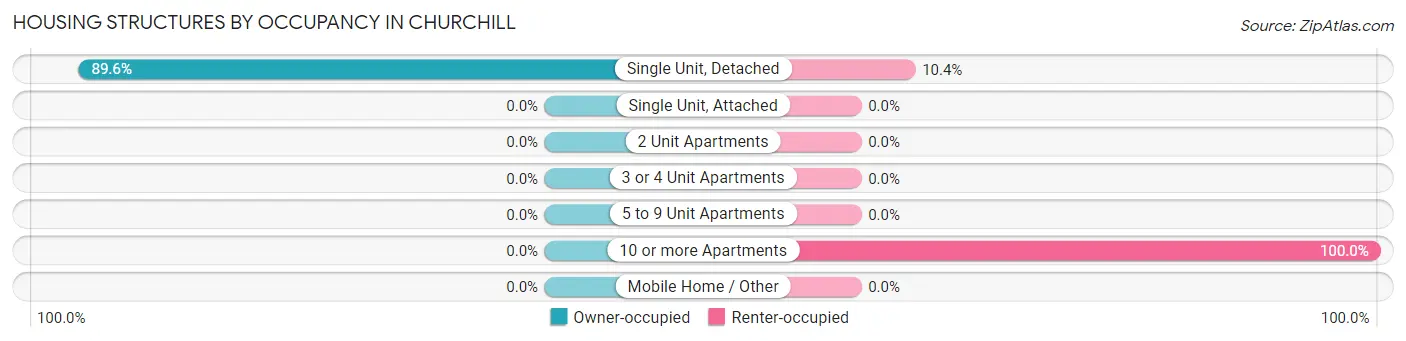
| Structure Type | Owner-occupied | Renter-occupied |
| Single Unit, Detached | 715 (89.6%) | 83 (10.4%) |
| Single Unit, Attached | 0 (0.0%) | 0 (0.0%) |
| 2 Unit Apartments | 0 (0.0%) | 0 (0.0%) |
| 3 or 4 Unit Apartments | 0 (0.0%) | 0 (0.0%) |
| 5 to 9 Unit Apartments | 0 (0.0%) | 0 (0.0%) |
| 10 or more Apartments | 0 (0.0%) | 48 (100.0%) |
| Mobile Home / Other | 0 (0.0%) | 0 (0.0%) |
| Total | 715 (84.5%) | 131 (15.5%) |
Housing Structures by Number of Rooms in Churchill
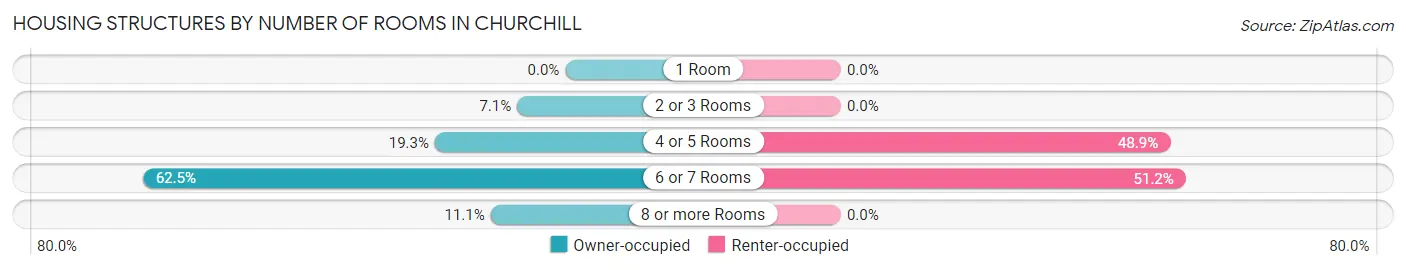
| Number of Rooms | Owner-occupied | Renter-occupied |
| 1 Room | 0 (0.0%) | 0 (0.0%) |
| 2 or 3 Rooms | 51 (7.1%) | 0 (0.0%) |
| 4 or 5 Rooms | 138 (19.3%) | 64 (48.8%) |
| 6 or 7 Rooms | 447 (62.5%) | 67 (51.1%) |
| 8 or more Rooms | 79 (11.1%) | 0 (0.0%) |
| Total | 715 (100.0%) | 131 (100.0%) |
Housing Structure by Heating Type in Churchill
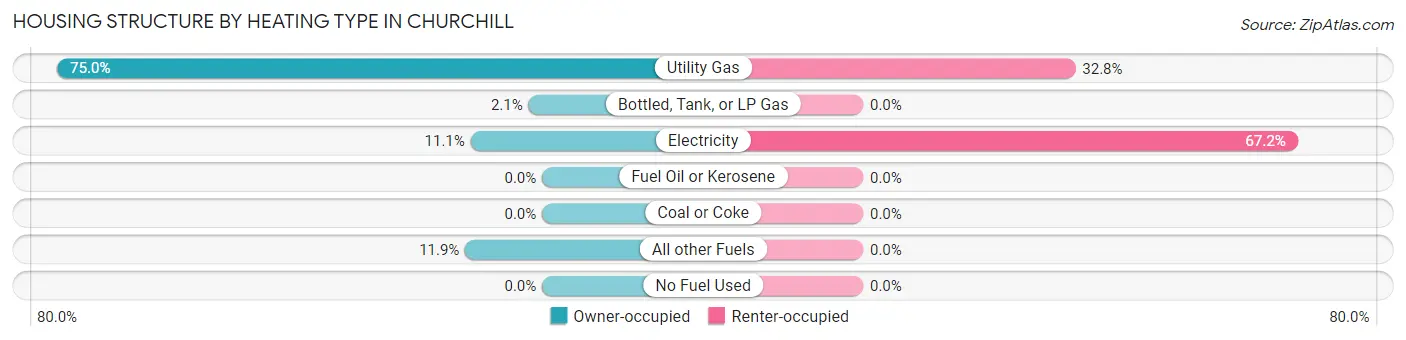
| Heating Type | Owner-occupied | Renter-occupied |
| Utility Gas | 536 (75.0%) | 43 (32.8%) |
| Bottled, Tank, or LP Gas | 15 (2.1%) | 0 (0.0%) |
| Electricity | 79 (11.1%) | 88 (67.2%) |
| Fuel Oil or Kerosene | 0 (0.0%) | 0 (0.0%) |
| Coal or Coke | 0 (0.0%) | 0 (0.0%) |
| All other Fuels | 85 (11.9%) | 0 (0.0%) |
| No Fuel Used | 0 (0.0%) | 0 (0.0%) |
| Total | 715 (100.0%) | 131 (100.0%) |
Household Vehicle Usage in Churchill
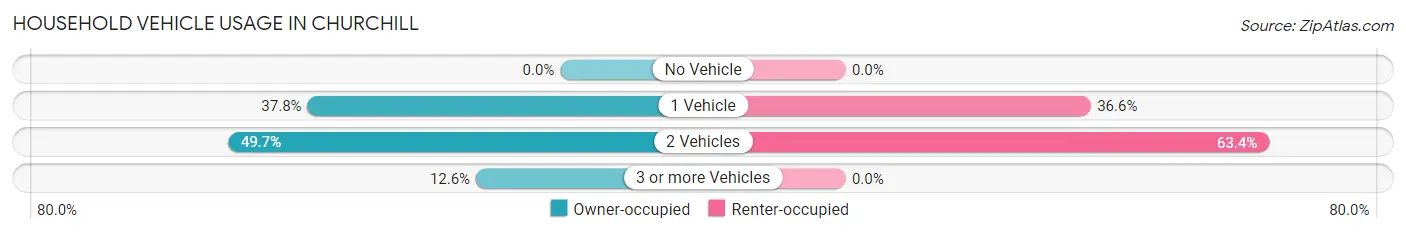
| Vehicles per Household | Owner-occupied | Renter-occupied |
| No Vehicle | 0 (0.0%) | 0 (0.0%) |
| 1 Vehicle | 270 (37.8%) | 48 (36.6%) |
| 2 Vehicles | 355 (49.6%) | 83 (63.4%) |
| 3 or more Vehicles | 90 (12.6%) | 0 (0.0%) |
| Total | 715 (100.0%) | 131 (100.0%) |
Real Estate & Mortgages in Churchill
Real Estate and Mortgage Overview in Churchill
| Characteristic | Without Mortgage | With Mortgage |
| Housing Units | 423 | 292 |
| Median Property Value | $87,400 | $116,700 |
| Median Household Income | $54,375 | $37 |
| Monthly Housing Costs | $388 | $0 |
| Real Estate Taxes | $1,704 | $0 |
Property Value by Mortgage Status in Churchill
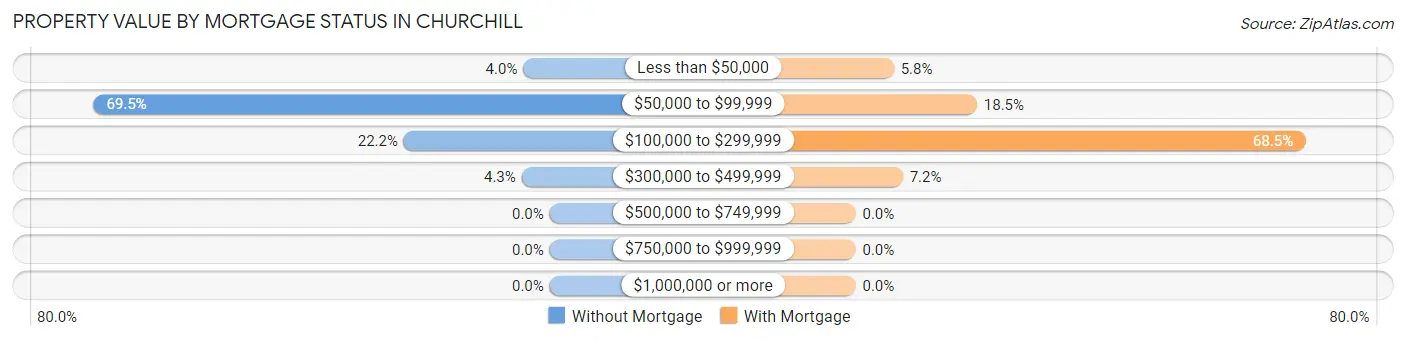
| Property Value | Without Mortgage | With Mortgage |
| Less than $50,000 | 17 (4.0%) | 17 (5.8%) |
| $50,000 to $99,999 | 294 (69.5%) | 54 (18.5%) |
| $100,000 to $299,999 | 94 (22.2%) | 200 (68.5%) |
| $300,000 to $499,999 | 18 (4.3%) | 21 (7.2%) |
| $500,000 to $749,999 | 0 (0.0%) | 0 (0.0%) |
| $750,000 to $999,999 | 0 (0.0%) | 0 (0.0%) |
| $1,000,000 or more | 0 (0.0%) | 0 (0.0%) |
| Total | 423 (100.0%) | 292 (100.0%) |
Household Income by Mortgage Status in Churchill
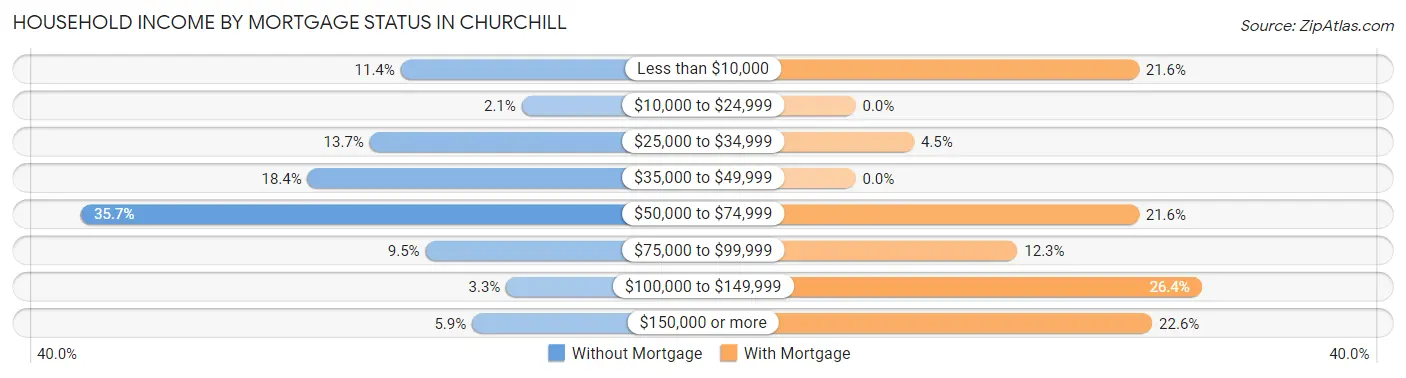
| Household Income | Without Mortgage | With Mortgage |
| Less than $10,000 | 48 (11.4%) | 63 (21.6%) |
| $10,000 to $24,999 | 9 (2.1%) | 0 (0.0%) |
| $25,000 to $34,999 | 58 (13.7%) | 13 (4.4%) |
| $35,000 to $49,999 | 78 (18.4%) | 0 (0.0%) |
| $50,000 to $74,999 | 151 (35.7%) | 63 (21.6%) |
| $75,000 to $99,999 | 40 (9.5%) | 36 (12.3%) |
| $100,000 to $149,999 | 14 (3.3%) | 77 (26.4%) |
| $150,000 or more | 25 (5.9%) | 66 (22.6%) |
| Total | 423 (100.0%) | 292 (100.0%) |
Property Value to Household Income Ratio in Churchill
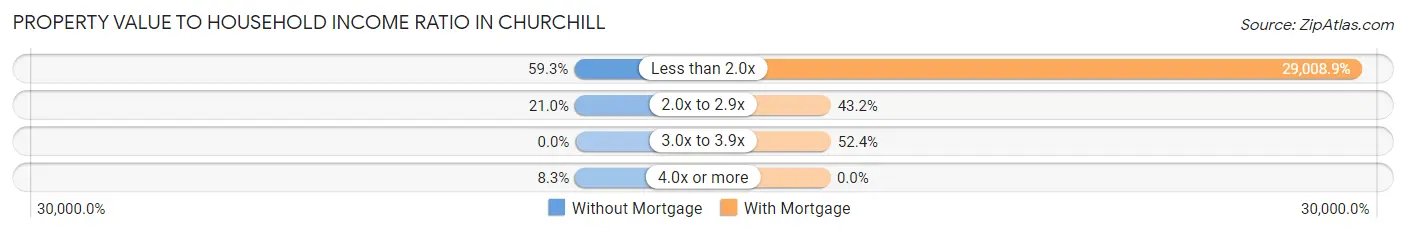
| Value-to-Income Ratio | Without Mortgage | With Mortgage |
| Less than 2.0x | 251 (59.3%) | 84,706 (29,008.9%) |
| 2.0x to 2.9x | 89 (21.0%) | 126 (43.1%) |
| 3.0x to 3.9x | 0 (0.0%) | 153 (52.4%) |
| 4.0x or more | 35 (8.3%) | 0 (0.0%) |
| Total | 423 (100.0%) | 292 (100.0%) |
Real Estate Taxes by Mortgage Status in Churchill
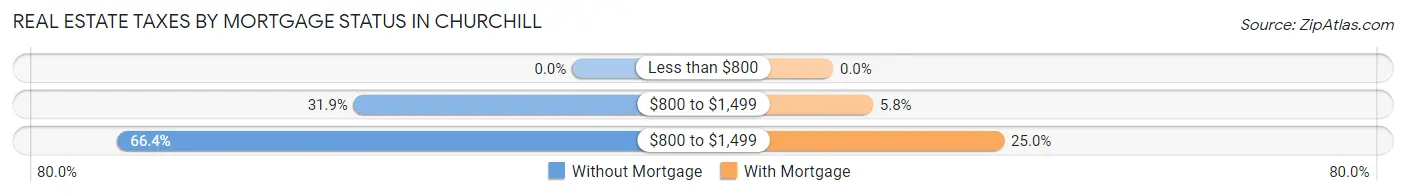
| Property Taxes | Without Mortgage | With Mortgage |
| Less than $800 | 0 (0.0%) | 0 (0.0%) |
| $800 to $1,499 | 135 (31.9%) | 17 (5.8%) |
| $800 to $1,499 | 281 (66.4%) | 73 (25.0%) |
| Total | 423 (100.0%) | 292 (100.0%) |
Health & Disability in Churchill
Health Insurance Coverage by Age in Churchill
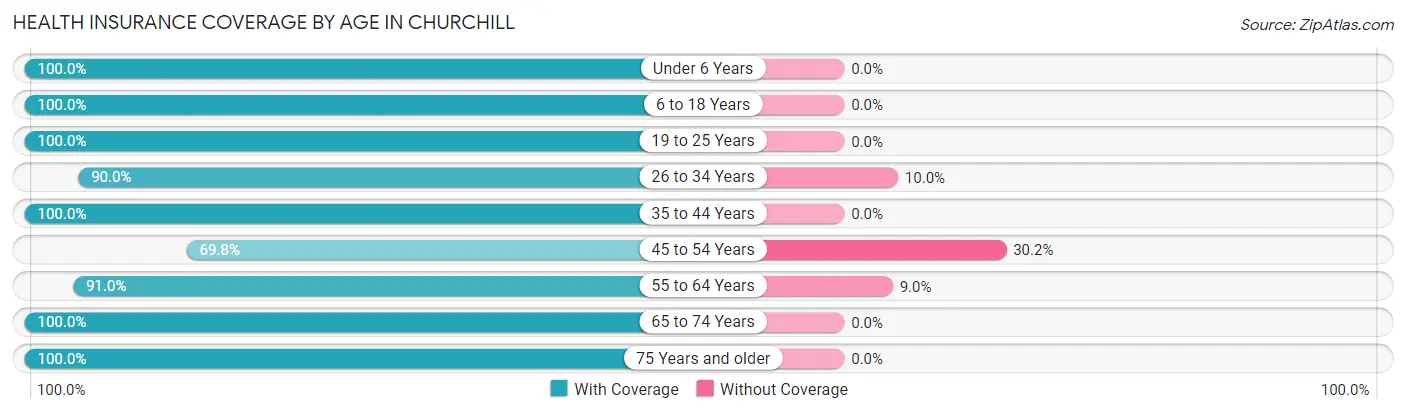
| Age Bracket | With Coverage | Without Coverage |
| Under 6 Years | 96 (100.0%) | 0 (0.0%) |
| 6 to 18 Years | 461 (100.0%) | 0 (0.0%) |
| 19 to 25 Years | 21 (100.0%) | 0 (0.0%) |
| 26 to 34 Years | 225 (90.0%) | 25 (10.0%) |
| 35 to 44 Years | 266 (100.0%) | 0 (0.0%) |
| 45 to 54 Years | 178 (69.8%) | 77 (30.2%) |
| 55 to 64 Years | 252 (91.0%) | 25 (9.0%) |
| 65 to 74 Years | 378 (100.0%) | 0 (0.0%) |
| 75 Years and older | 111 (100.0%) | 0 (0.0%) |
| Total | 1,988 (94.0%) | 127 (6.0%) |
Health Insurance Coverage by Citizenship Status in Churchill
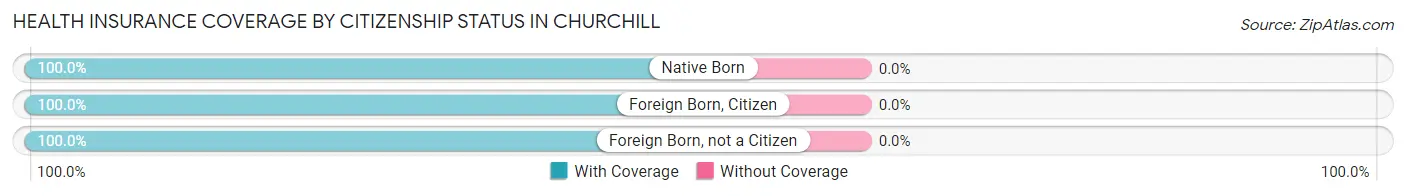
| Citizenship Status | With Coverage | Without Coverage |
| Native Born | 96 (100.0%) | 0 (0.0%) |
| Foreign Born, Citizen | 461 (100.0%) | 0 (0.0%) |
| Foreign Born, not a Citizen | 21 (100.0%) | 0 (0.0%) |
Health Insurance Coverage by Household Income in Churchill
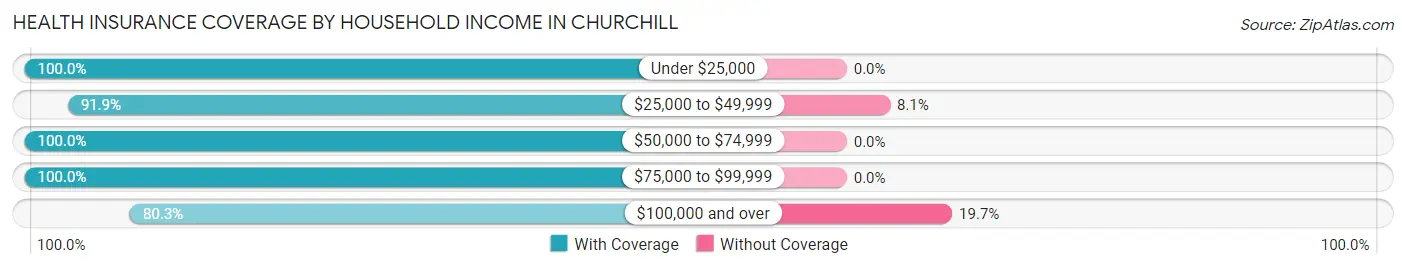
| Household Income | With Coverage | Without Coverage |
| Under $25,000 | 88 (100.0%) | 0 (0.0%) |
| $25,000 to $49,999 | 579 (91.9%) | 51 (8.1%) |
| $50,000 to $74,999 | 659 (100.0%) | 0 (0.0%) |
| $75,000 to $99,999 | 353 (100.0%) | 0 (0.0%) |
| $100,000 and over | 309 (80.3%) | 76 (19.7%) |
Public vs Private Health Insurance Coverage by Age in Churchill
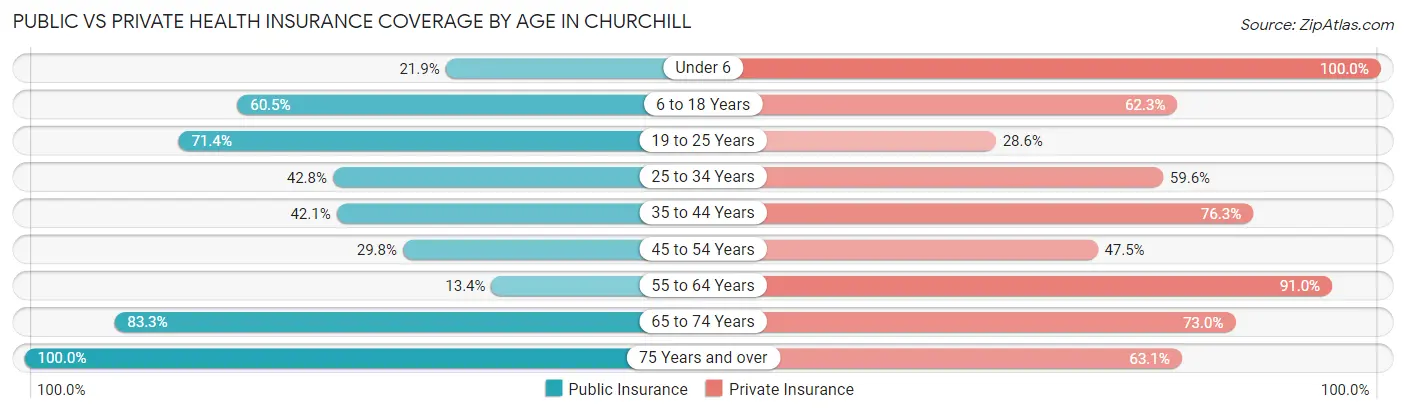
| Age Bracket | Public Insurance | Private Insurance |
| Under 6 | 21 (21.9%) | 96 (100.0%) |
| 6 to 18 Years | 279 (60.5%) | 287 (62.3%) |
| 19 to 25 Years | 15 (71.4%) | 6 (28.6%) |
| 25 to 34 Years | 107 (42.8%) | 149 (59.6%) |
| 35 to 44 Years | 112 (42.1%) | 203 (76.3%) |
| 45 to 54 Years | 76 (29.8%) | 121 (47.4%) |
| 55 to 64 Years | 37 (13.4%) | 252 (91.0%) |
| 65 to 74 Years | 315 (83.3%) | 276 (73.0%) |
| 75 Years and over | 111 (100.0%) | 70 (63.1%) |
| Total | 1,073 (50.7%) | 1,460 (69.0%) |
Disability Status by Sex by Age in Churchill
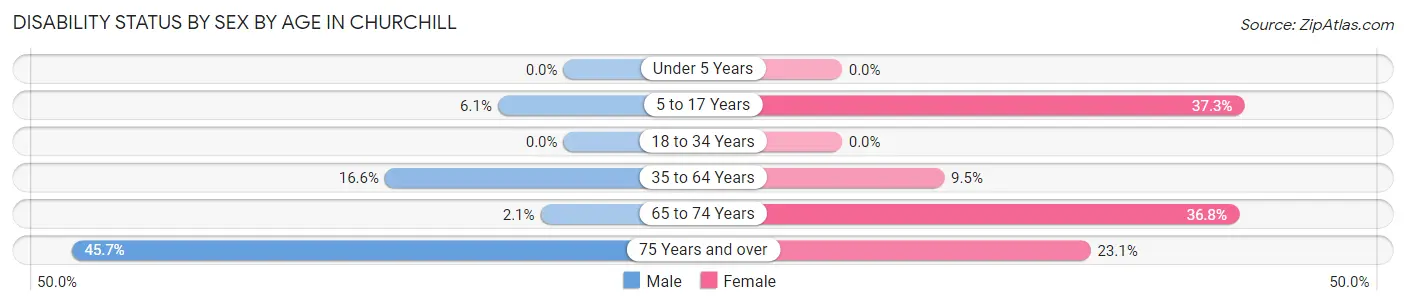
| Age Bracket | Male | Female |
| Under 5 Years | 0 (0.0%) | 0 (0.0%) |
| 5 to 17 Years | 21 (6.1%) | 59 (37.3%) |
| 18 to 34 Years | 0 (0.0%) | 0 (0.0%) |
| 35 to 64 Years | 59 (16.6%) | 42 (9.5%) |
| 65 to 74 Years | 4 (2.1%) | 70 (36.8%) |
| 75 Years and over | 21 (45.7%) | 15 (23.1%) |
Disability Class by Sex by Age in Churchill
Disability Class: Hearing Difficulty
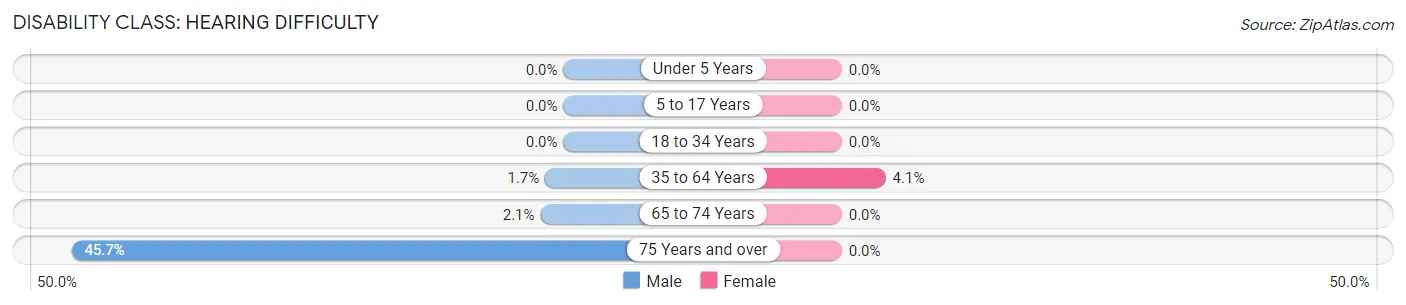
| Age Bracket | Male | Female |
| Under 5 Years | 0 (0.0%) | 0 (0.0%) |
| 5 to 17 Years | 0 (0.0%) | 0 (0.0%) |
| 18 to 34 Years | 0 (0.0%) | 0 (0.0%) |
| 35 to 64 Years | 6 (1.7%) | 18 (4.1%) |
| 65 to 74 Years | 4 (2.1%) | 0 (0.0%) |
| 75 Years and over | 21 (45.7%) | 0 (0.0%) |
Disability Class: Vision Difficulty
| Age Bracket | Male | Female |
| Under 5 Years | 0 (0.0%) | 0 (0.0%) |
| 5 to 17 Years | 0 (0.0%) | 0 (0.0%) |
| 18 to 34 Years | 0 (0.0%) | 0 (0.0%) |
| 35 to 64 Years | 0 (0.0%) | 0 (0.0%) |
| 65 to 74 Years | 0 (0.0%) | 0 (0.0%) |
| 75 Years and over | 0 (0.0%) | 0 (0.0%) |
Disability Class: Cognitive Difficulty
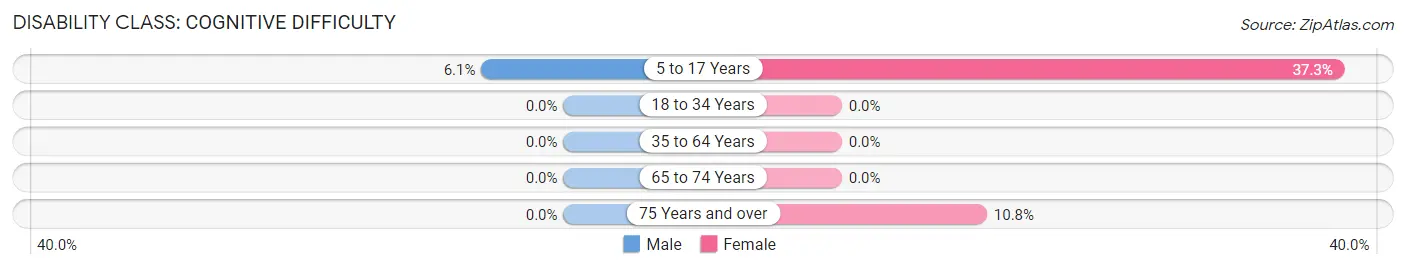
| Age Bracket | Male | Female |
| 5 to 17 Years | 21 (6.1%) | 59 (37.3%) |
| 18 to 34 Years | 0 (0.0%) | 0 (0.0%) |
| 35 to 64 Years | 0 (0.0%) | 0 (0.0%) |
| 65 to 74 Years | 0 (0.0%) | 0 (0.0%) |
| 75 Years and over | 0 (0.0%) | 7 (10.8%) |
Disability Class: Ambulatory Difficulty
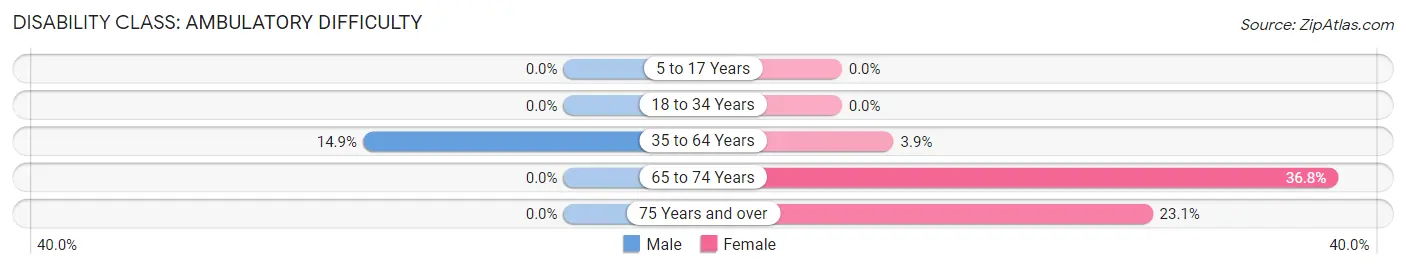
| Age Bracket | Male | Female |
| 5 to 17 Years | 0 (0.0%) | 0 (0.0%) |
| 18 to 34 Years | 0 (0.0%) | 0 (0.0%) |
| 35 to 64 Years | 53 (14.9%) | 17 (3.8%) |
| 65 to 74 Years | 0 (0.0%) | 70 (36.8%) |
| 75 Years and over | 0 (0.0%) | 15 (23.1%) |
Disability Class: Self-Care Difficulty
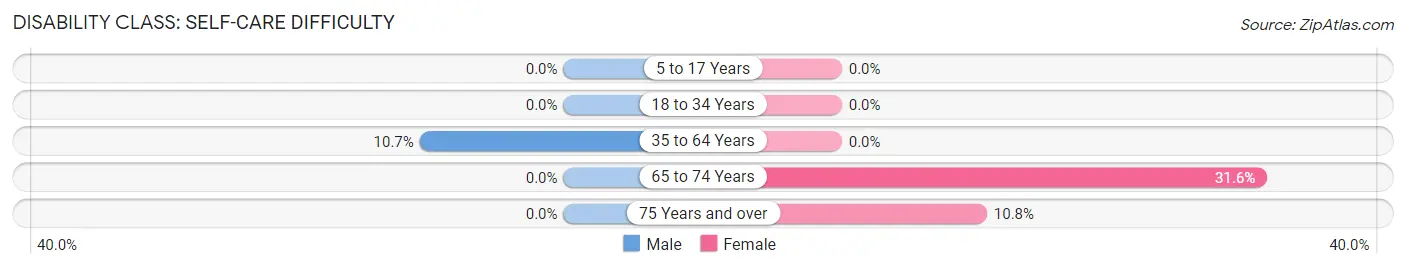
| Age Bracket | Male | Female |
| 5 to 17 Years | 0 (0.0%) | 0 (0.0%) |
| 18 to 34 Years | 0 (0.0%) | 0 (0.0%) |
| 35 to 64 Years | 38 (10.7%) | 0 (0.0%) |
| 65 to 74 Years | 0 (0.0%) | 60 (31.6%) |
| 75 Years and over | 0 (0.0%) | 7 (10.8%) |
Technology Access in Churchill
Computing Device Access in Churchill
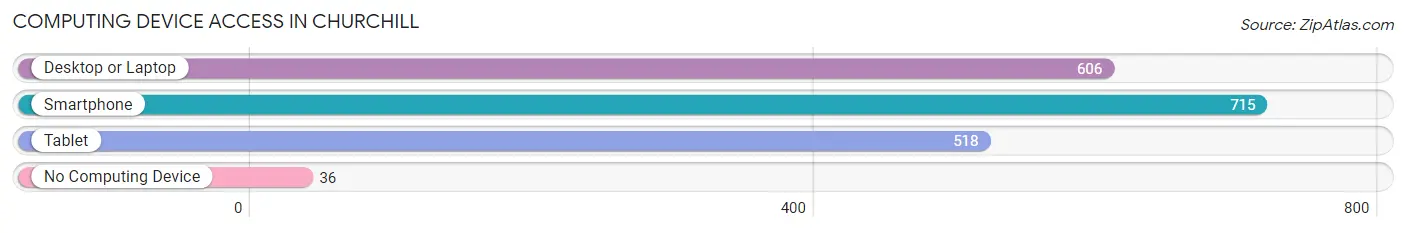
| Device Type | # Households | % Households |
| Desktop or Laptop | 606 | 71.6% |
| Smartphone | 715 | 84.5% |
| Tablet | 518 | 61.2% |
| No Computing Device | 36 | 4.3% |
| Total | 846 | 100.0% |
Internet Access in Churchill
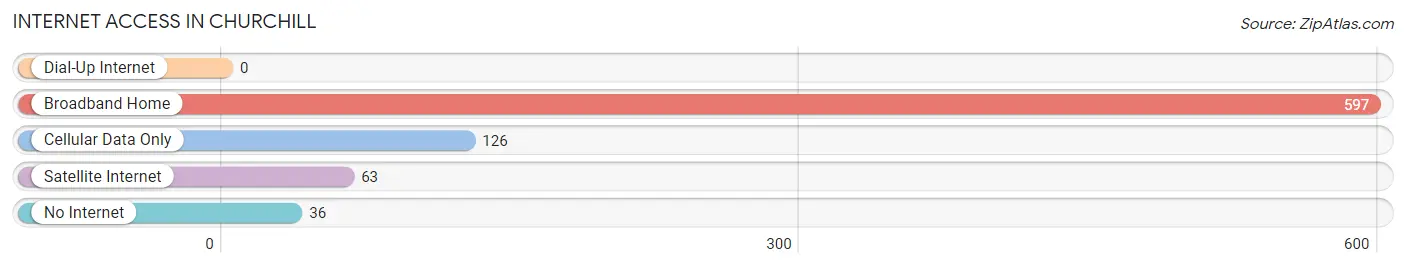
| Internet Type | # Households | % Households |
| Dial-Up Internet | 0 | 0.0% |
| Broadband Home | 597 | 70.6% |
| Cellular Data Only | 126 | 14.9% |
| Satellite Internet | 63 | 7.4% |
| No Internet | 36 | 4.3% |
| Total | 846 | 100.0% |
Churchill Summary
Churchill, Ohio is a small village located in the southeastern corner of the state, in the county of Belmont. It is situated on the Ohio River, just south of the city of Wheeling, West Virginia. The village has a population of just over 500 people, and is part of the Wheeling Metropolitan Statistical Area.
History
Churchill was founded in 1817 by a group of settlers from Pennsylvania. The village was named after the British statesman, Winston Churchill. The village was originally a farming community, and the main crops grown were corn, wheat, and oats. The village was also home to a number of small businesses, including a general store, a blacksmith, and a sawmill.
In the late 19th century, the village began to grow and develop. The railroad was extended to the village, and a number of new businesses opened up. The village also became a popular tourist destination, as it was located on the Ohio River.
Geography
Churchill is located in the southeastern corner of the state of Ohio, in Belmont County. It is situated on the Ohio River, just south of the city of Wheeling, West Virginia. The village is located in a rural area, and is surrounded by rolling hills and farmland. The village is located at an elevation of 845 feet above sea level.
The climate in Churchill is humid continental, with hot summers and cold winters. The average annual temperature is around 50 degrees Fahrenheit, and the average annual precipitation is around 40 inches.
Economy
The economy of Churchill is largely based on agriculture. The main crops grown in the area are corn, wheat, and oats. The village is also home to a number of small businesses, including a general store, a blacksmith, and a sawmill.
The village is also home to a number of tourist attractions, including the Ohio River Museum, the Belmont County Historical Society, and the Belmont County Courthouse. The village is also home to a number of restaurants and bars.
Demographics
As of the 2010 census, the population of Churchill was 514. The racial makeup of the village was 97.3% White, 0.6% African American, 0.2% Native American, 0.2% Asian, 0.4% from other races, and 1.3% from two or more races. Hispanic or Latino of any race were 0.8% of the population.
The median household income in Churchill was $37,500, and the median family income was $41,250. The per capita income in the village was $17,845. About 11.3% of families and 13.2% of the population were below the poverty line, including 17.2% of those under age 18 and 8.3% of those age 65 or over.
Common Questions
What is Per Capita Income in Churchill?
Per Capita income in Churchill is $27,330.
What is the Median Family Income in Churchill?
Median Family Income in Churchill is $64,583.
What is the Median Household income in Churchill?
Median Household Income in Churchill is $62,386.
What is Income or Wage Gap in Churchill?
Income or Wage Gap in Churchill is 0.3%.
Women in Churchill earn 99.7 cents for every dollar earned by a man.
What is Inequality or Gini Index in Churchill?
Inequality or Gini Index in Churchill is 0.36.
What is the Total Population of Churchill?
Total Population of Churchill is 2,115.
What is the Total Male Population of Churchill?
Total Male Population of Churchill is 1,143.
What is the Total Female Population of Churchill?
Total Female Population of Churchill is 972.
What is the Ratio of Males per 100 Females in Churchill?
There are 117.59 Males per 100 Females in Churchill.
What is the Ratio of Females per 100 Males in Churchill?
There are 85.04 Females per 100 Males in Churchill.
What is the Median Population Age in Churchill?
Median Population Age in Churchill is 43.8 Years.
What is the Average Family Size in Churchill
Average Family Size in Churchill is 3.0 People.
What is the Average Household Size in Churchill
Average Household Size in Churchill is 2.5 People.
How Large is the Labor Force in Churchill?
There are 1,086 People in the Labor Forcein in Churchill.
What is the Percentage of People in the Labor Force in Churchill?
65.0% of People are in the Labor Force in Churchill.
What is the Unemployment Rate in Churchill?
Unemployment Rate in Churchill is 5.3%.