Chillicothe, OH Map & Demographics
Chillicothe Map
Chillicothe Overview
$34,323
PER CAPITA INCOME
$71,554
AVG FAMILY INCOME
$50,839
AVG HOUSEHOLD INCOME
34.1%
WAGE / INCOME GAP [ % ]
65.9¢/ $1
WAGE / INCOME GAP [ $ ]
0.49
INEQUALITY / GINI INDEX
22,002
TOTAL POPULATION
10,549
MALE POPULATION
11,453
FEMALE POPULATION
92.11
MALES / 100 FEMALES
108.57
FEMALES / 100 MALES
43.0
MEDIAN AGE
3.0
AVG FAMILY SIZE
2.2
AVG HOUSEHOLD SIZE
10,066
LABOR FORCE [ PEOPLE ]
55.7%
PERCENT IN LABOR FORCE
7.5%
UNEMPLOYMENT RATE
Chillicothe Zip Codes
Chillicothe Area Codes
Income in Chillicothe
Income Overview in Chillicothe
Per Capita Income in Chillicothe is $34,323, while median incomes of families and households are $71,554 and $50,839 respectively.
| Characteristic | Number | Measure |
| Per Capita Income | 22,002 | $34,323 |
| Median Family Income | 5,268 | $71,554 |
| Mean Family Income | 5,268 | $96,936 |
| Median Household Income | 9,679 | $50,839 |
| Mean Household Income | 9,679 | $73,693 |
| Income Deficit | 5,268 | $0 |
| Wage / Income Gap (%) | 22,002 | 34.14% |
| Wage / Income Gap ($) | 22,002 | 65.86¢ per $1 |
| Gini / Inequality Index | 22,002 | 0.49 |
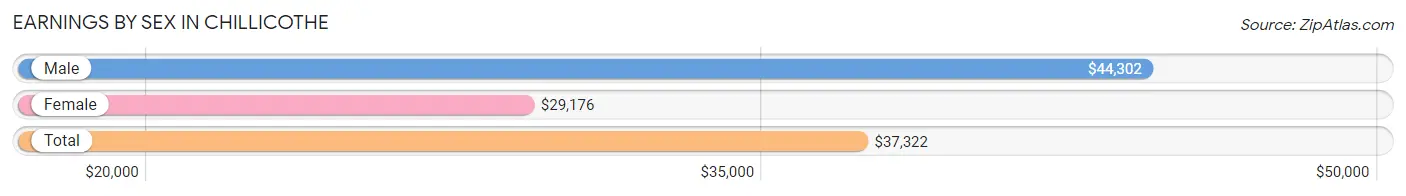
Earnings by Sex in Chillicothe
Average Earnings in Chillicothe are $37,322, $44,302 for men and $29,176 for women, a difference of 34.1%.
| Sex | Number | Average Earnings |
| Male | 5,241 (51.2%) | $44,302 |
| Female | 4,988 (48.8%) | $29,176 |
| Total | 10,229 (100.0%) | $37,322 |
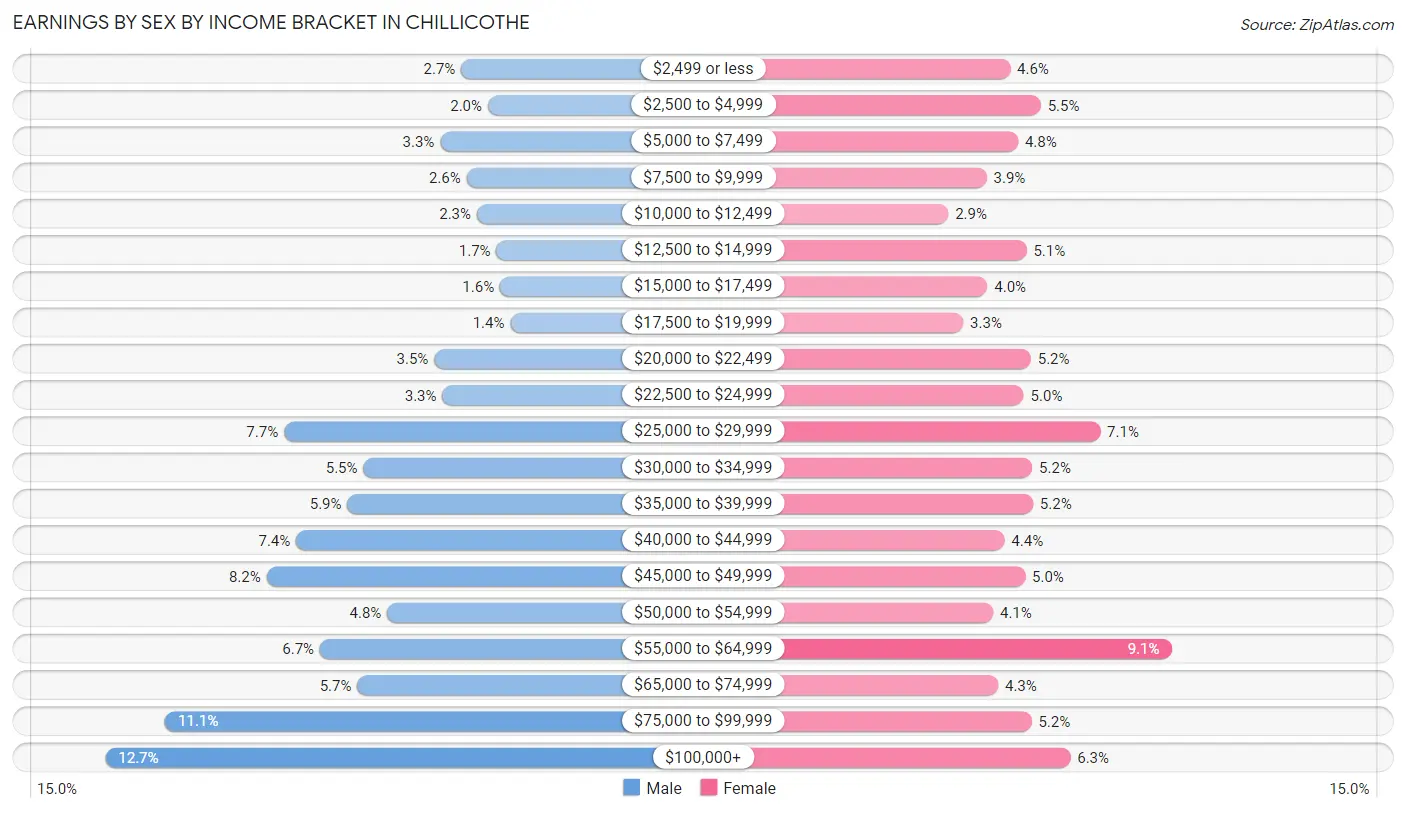
Earnings by Sex by Income Bracket in Chillicothe
The most common earnings brackets in Chillicothe are $100,000+ for men (667 | 12.7%) and $55,000 to $64,999 for women (455 | 9.1%).
| Income | Male | Female |
| $2,499 or less | 143 (2.7%) | 229 (4.6%) |
| $2,500 to $4,999 | 104 (2.0%) | 272 (5.4%) |
| $5,000 to $7,499 | 174 (3.3%) | 240 (4.8%) |
| $7,500 to $9,999 | 135 (2.6%) | 196 (3.9%) |
| $10,000 to $12,499 | 120 (2.3%) | 142 (2.9%) |
| $12,500 to $14,999 | 91 (1.7%) | 252 (5.1%) |
| $15,000 to $17,499 | 86 (1.6%) | 197 (4.0%) |
| $17,500 to $19,999 | 71 (1.3%) | 163 (3.3%) |
| $20,000 to $22,499 | 183 (3.5%) | 258 (5.2%) |
| $22,500 to $24,999 | 171 (3.3%) | 248 (5.0%) |
| $25,000 to $29,999 | 404 (7.7%) | 355 (7.1%) |
| $30,000 to $34,999 | 287 (5.5%) | 260 (5.2%) |
| $35,000 to $39,999 | 311 (5.9%) | 261 (5.2%) |
| $40,000 to $44,999 | 386 (7.4%) | 221 (4.4%) |
| $45,000 to $49,999 | 430 (8.2%) | 250 (5.0%) |
| $50,000 to $54,999 | 252 (4.8%) | 205 (4.1%) |
| $55,000 to $64,999 | 351 (6.7%) | 455 (9.1%) |
| $65,000 to $74,999 | 296 (5.7%) | 212 (4.3%) |
| $75,000 to $99,999 | 579 (11.1%) | 259 (5.2%) |
| $100,000+ | 667 (12.7%) | 313 (6.3%) |
| Total | 5,241 (100.0%) | 4,988 (100.0%) |
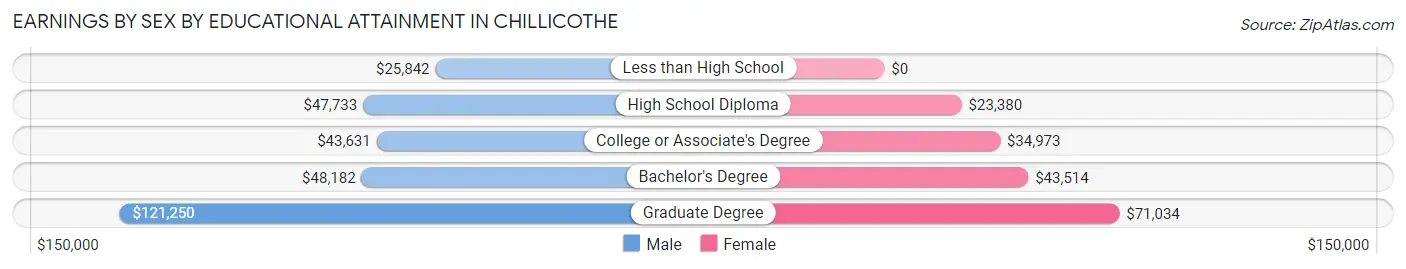
Earnings by Sex by Educational Attainment in Chillicothe
Average earnings in Chillicothe are $47,858 for men and $34,672 for women, a difference of 27.6%. Men with an educational attainment of graduate degree enjoy the highest average annual earnings of $121,250, while those with less than high school education earn the least with $25,842. Women with an educational attainment of graduate degree earn the most with the average annual earnings of $71,034, while those with high school diploma education have the smallest earnings of $23,380.
| Educational Attainment | Male Income | Female Income |
| Less than High School | $25,842 | $0 |
| High School Diploma | $47,733 | $23,380 |
| College or Associate's Degree | $43,631 | $34,973 |
| Bachelor's Degree | $48,182 | $43,514 |
| Graduate Degree | $121,250 | $71,034 |
| Total | $47,858 | $34,672 |
Family Income in Chillicothe
Family Income Brackets in Chillicothe
According to the Chillicothe family income data, there are 1,122 families falling into the $100,000 to $149,999 income range, which is the most common income bracket and makes up 21.3% of all families. Conversely, the less than $10,000 income bracket is the least frequent group with only 163 families (3.1%) belonging to this category.
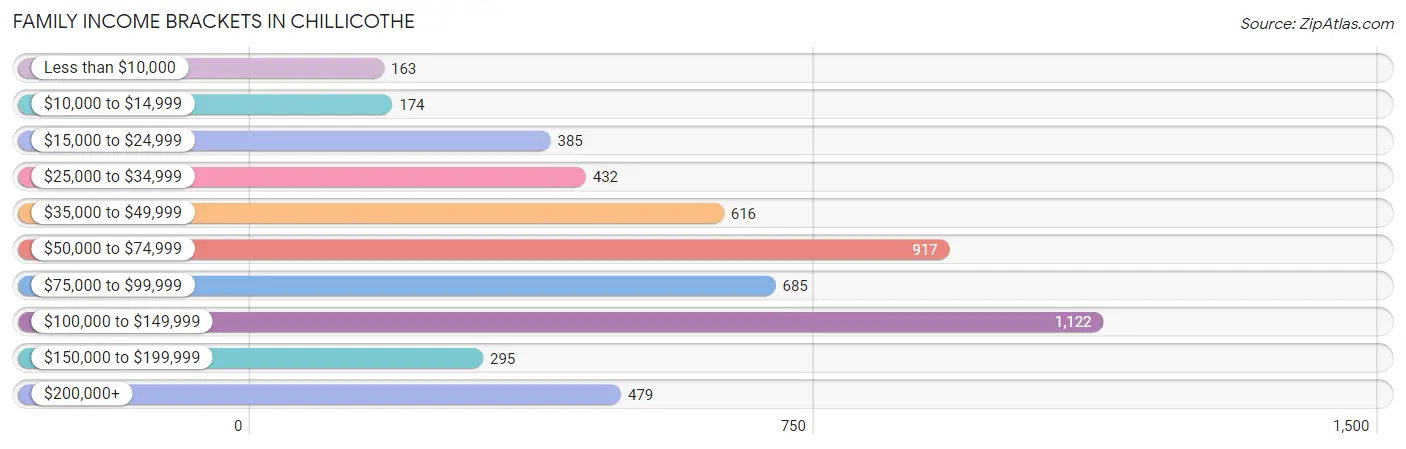
| Income Bracket | # Families | % Families |
| Less than $10,000 | 163 | 3.1% |
| $10,000 to $14,999 | 174 | 3.3% |
| $15,000 to $24,999 | 385 | 7.3% |
| $25,000 to $34,999 | 432 | 8.2% |
| $35,000 to $49,999 | 616 | 11.7% |
| $50,000 to $74,999 | 917 | 17.4% |
| $75,000 to $99,999 | 685 | 13.0% |
| $100,000 to $149,999 | 1,122 | 21.3% |
| $150,000 to $199,999 | 295 | 5.6% |
| $200,000+ | 479 | 9.1% |
Family Income by Famaliy Size in Chillicothe
5-person families (340 | 6.5%) account for the highest median family income in Chillicothe with $108,875 per family, while 2-person families (2,861 | 54.3%) have the highest median income of $33,034 per family member.
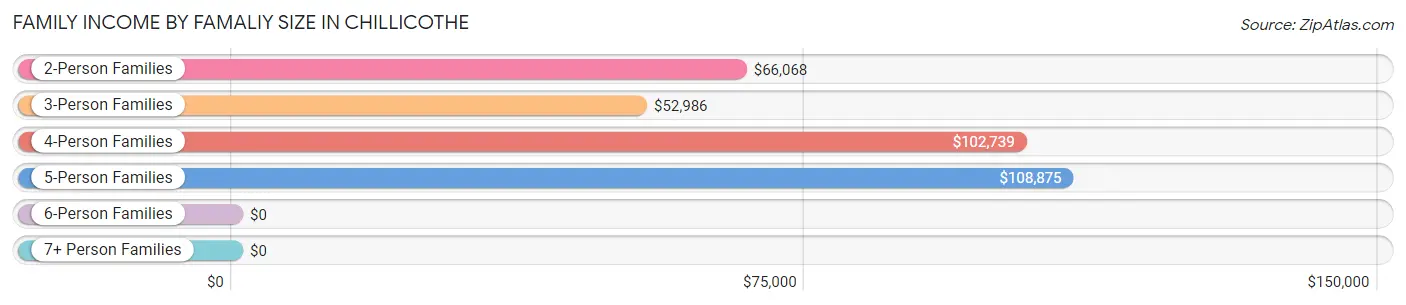
| Income Bracket | # Families | Median Income |
| 2-Person Families | 2,861 (54.3%) | $66,068 |
| 3-Person Families | 1,124 (21.3%) | $52,986 |
| 4-Person Families | 703 (13.3%) | $102,739 |
| 5-Person Families | 340 (6.5%) | $108,875 |
| 6-Person Families | 206 (3.9%) | $0 |
| 7+ Person Families | 34 (0.6%) | $0 |
| Total | 5,268 (100.0%) | $71,554 |
Family Income by Number of Earners in Chillicothe
The median family income in Chillicothe is $71,554, with families comprising 3+ earners (414) having the highest median family income of $109,375, while families with no earners (1,103) have the lowest median family income of $40,208, accounting for 7.9% and 20.9% of families, respectively.
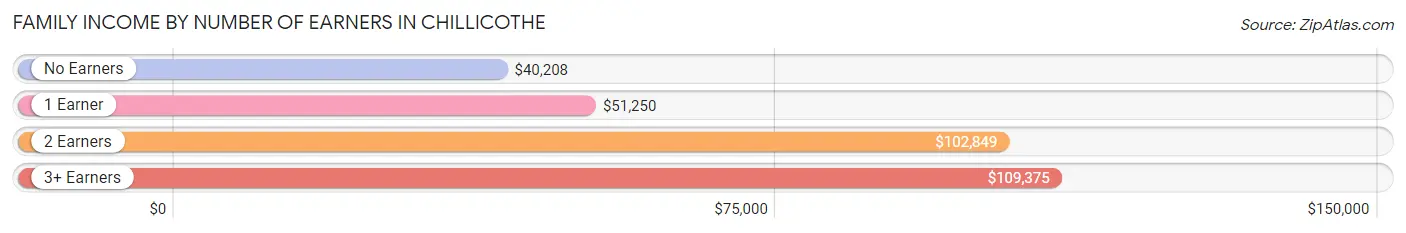
| Number of Earners | # Families | Median Income |
| No Earners | 1,103 (20.9%) | $40,208 |
| 1 Earner | 1,854 (35.2%) | $51,250 |
| 2 Earners | 1,897 (36.0%) | $102,849 |
| 3+ Earners | 414 (7.9%) | $109,375 |
| Total | 5,268 (100.0%) | $71,554 |
Household Income in Chillicothe
Household Income Brackets in Chillicothe
With 1,655 households falling in the category, the $50,000 to $74,999 income range is the most frequent in Chillicothe, accounting for 17.1% of all households. In contrast, only 348 households (3.6%) fall into the $150,000 to $199,999 income bracket, making it the least populous group.
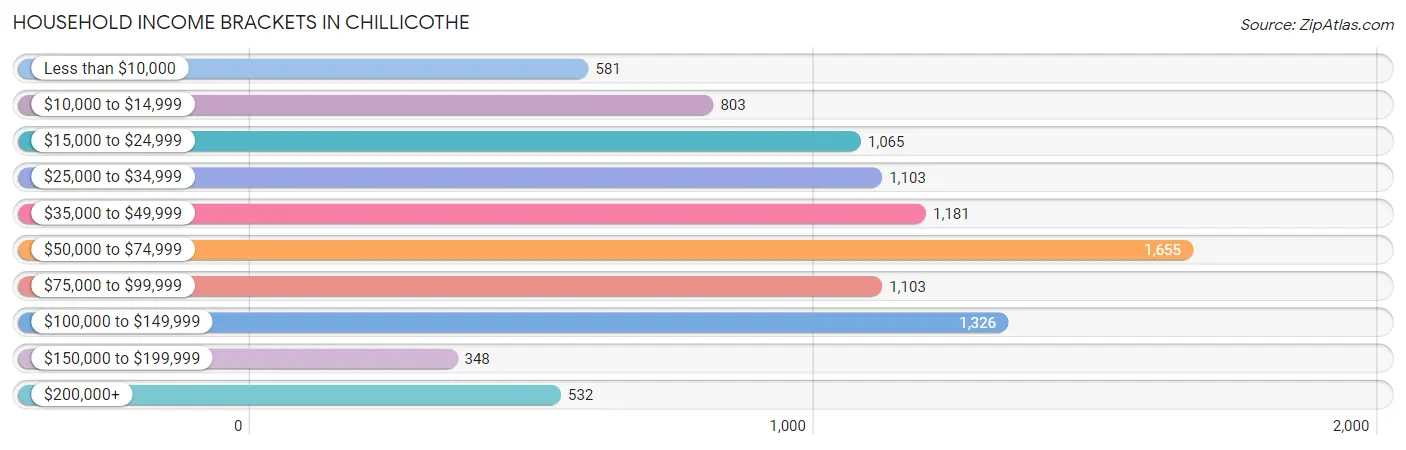
| Income Bracket | # Households | % Households |
| Less than $10,000 | 581 | 6.0% |
| $10,000 to $14,999 | 803 | 8.3% |
| $15,000 to $24,999 | 1,065 | 11.0% |
| $25,000 to $34,999 | 1,103 | 11.4% |
| $35,000 to $49,999 | 1,181 | 12.2% |
| $50,000 to $74,999 | 1,655 | 17.1% |
| $75,000 to $99,999 | 1,103 | 11.4% |
| $100,000 to $149,999 | 1,326 | 13.7% |
| $150,000 to $199,999 | 348 | 3.6% |
| $200,000+ | 532 | 5.5% |
Household Income by Householder Age in Chillicothe
The median household income in Chillicothe is $50,839, with the highest median household income of $62,143 found in the 25 to 44 years age bracket for the primary householder. A total of 2,496 households (25.8%) fall into this category. Meanwhile, the 15 to 24 years age bracket for the primary householder has the lowest median household income of $37,056, with 540 households (5.6%) in this group.
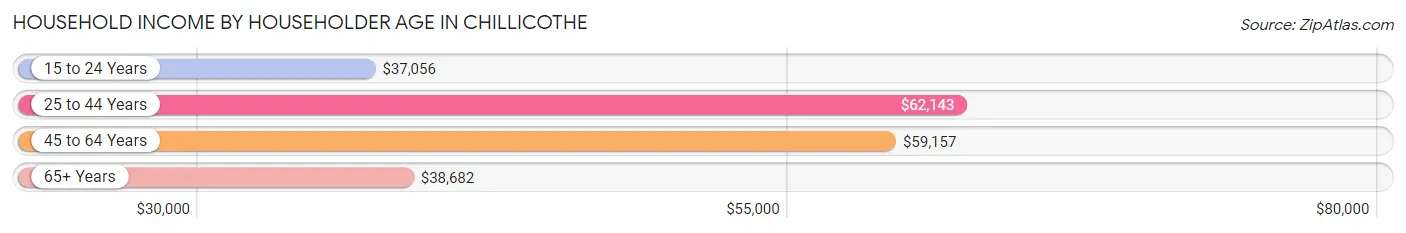
| Income Bracket | # Households | Median Income |
| 15 to 24 Years | 540 (5.6%) | $37,056 |
| 25 to 44 Years | 2,496 (25.8%) | $62,143 |
| 45 to 64 Years | 3,390 (35.0%) | $59,157 |
| 65+ Years | 3,253 (33.6%) | $38,682 |
| Total | 9,679 (100.0%) | $50,839 |
Poverty in Chillicothe
Income Below Poverty by Sex and Age in Chillicothe
With 13.8% poverty level for males and 22.4% for females among the residents of Chillicothe, 16 and 17 year old males and 12 to 14 year old females are the most vulnerable to poverty, with 72 males (29.0%) and 274 females (49.0%) in their respective age groups living below the poverty level.
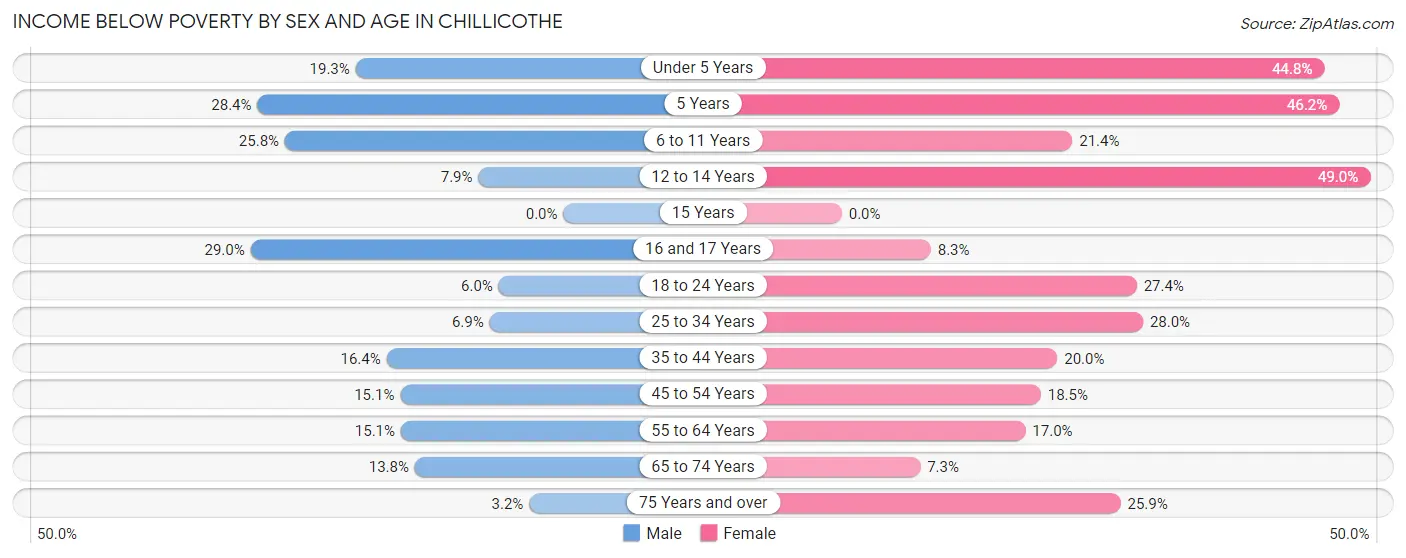
| Age Bracket | Male | Female |
| Under 5 Years | 151 (19.3%) | 248 (44.8%) |
| 5 Years | 23 (28.4%) | 30 (46.2%) |
| 6 to 11 Years | 185 (25.8%) | 117 (21.4%) |
| 12 to 14 Years | 40 (7.9%) | 274 (49.0%) |
| 15 Years | 0 (0.0%) | 0 (0.0%) |
| 16 and 17 Years | 72 (29.0%) | 9 (8.3%) |
| 18 to 24 Years | 50 (6.0%) | 260 (27.4%) |
| 25 to 34 Years | 78 (6.9%) | 341 (28.0%) |
| 35 to 44 Years | 262 (16.4%) | 289 (20.0%) |
| 45 to 54 Years | 198 (15.1%) | 282 (18.5%) |
| 55 to 64 Years | 201 (15.1%) | 233 (17.0%) |
| 65 to 74 Years | 147 (13.8%) | 120 (7.3%) |
| 75 Years and over | 20 (3.2%) | 283 (25.9%) |
| Total | 1,427 (13.8%) | 2,486 (22.4%) |
Income Above Poverty by Sex and Age in Chillicothe
According to the poverty statistics in Chillicothe, males aged 15 years and females aged 15 years are the age groups that are most secure financially, with 100.0% of males and 100.0% of females in these age groups living above the poverty line.
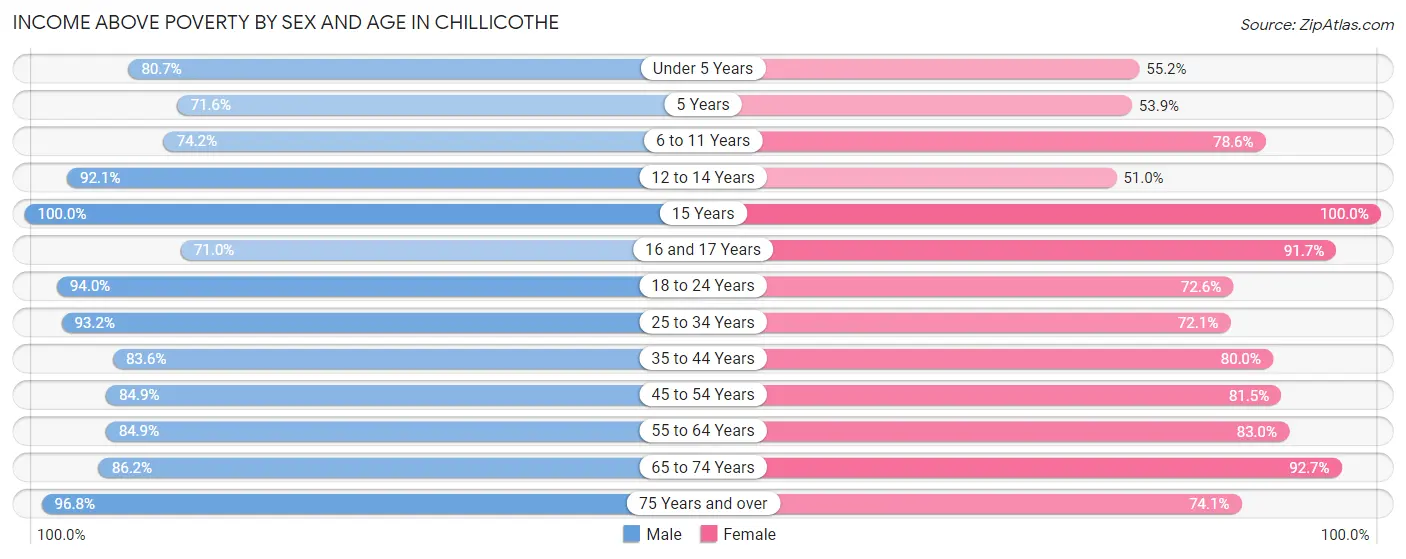
| Age Bracket | Male | Female |
| Under 5 Years | 632 (80.7%) | 306 (55.2%) |
| 5 Years | 58 (71.6%) | 35 (53.8%) |
| 6 to 11 Years | 531 (74.2%) | 430 (78.6%) |
| 12 to 14 Years | 467 (92.1%) | 285 (51.0%) |
| 15 Years | 91 (100.0%) | 27 (100.0%) |
| 16 and 17 Years | 176 (71.0%) | 100 (91.7%) |
| 18 to 24 Years | 784 (94.0%) | 690 (72.6%) |
| 25 to 34 Years | 1,060 (93.1%) | 879 (72.1%) |
| 35 to 44 Years | 1,335 (83.6%) | 1,156 (80.0%) |
| 45 to 54 Years | 1,110 (84.9%) | 1,245 (81.5%) |
| 55 to 64 Years | 1,132 (84.9%) | 1,134 (83.0%) |
| 65 to 74 Years | 919 (86.2%) | 1,529 (92.7%) |
| 75 Years and over | 611 (96.8%) | 811 (74.1%) |
| Total | 8,906 (86.2%) | 8,627 (77.6%) |
Income Below Poverty Among Married-Couple Families in Chillicothe
The poverty statistics for married-couple families in Chillicothe show that 7.1% or 243 of the total 3,438 families live below the poverty line. Families with 3 or 4 children have the highest poverty rate of 38.8%, comprising of 118 families. On the other hand, families with 5 or more children have the lowest poverty rate of 0.0%, which includes 0 families.
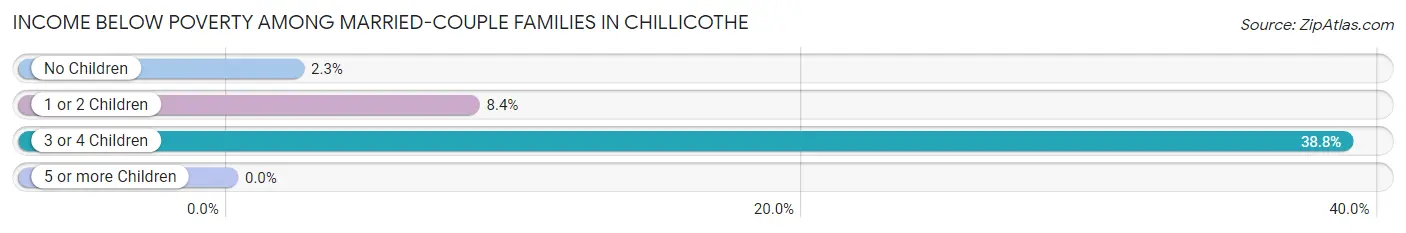
| Children | Above Poverty | Below Poverty |
| No Children | 2,207 (97.7%) | 52 (2.3%) |
| 1 or 2 Children | 795 (91.6%) | 73 (8.4%) |
| 3 or 4 Children | 186 (61.2%) | 118 (38.8%) |
| 5 or more Children | 7 (100.0%) | 0 (0.0%) |
| Total | 3,195 (92.9%) | 243 (7.1%) |
Income Below Poverty Among Single-Parent Households in Chillicothe
According to the poverty data in Chillicothe, 4.7% or 24 single-father households and 25.0% or 330 single-mother households are living below the poverty line. Among single-father households, those with 1 or 2 children have the highest poverty rate, with 24 households (7.4%) experiencing poverty. Likewise, among single-mother households, those with 3 or 4 children have the highest poverty rate, with 57 households (45.6%) falling below the poverty line.
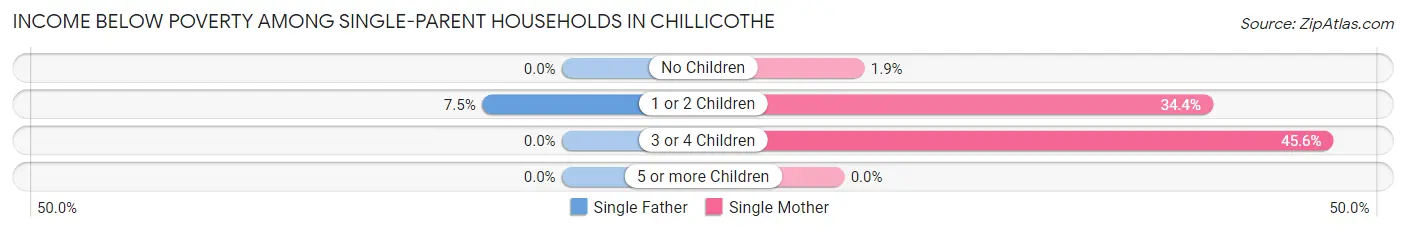
| Children | Single Father | Single Mother |
| No Children | 0 (0.0%) | 8 (1.9%) |
| 1 or 2 Children | 24 (7.4%) | 265 (34.4%) |
| 3 or 4 Children | 0 (0.0%) | 57 (45.6%) |
| 5 or more Children | 0 (0.0%) | 0 (0.0%) |
| Total | 24 (4.7%) | 330 (25.0%) |
Income Below Poverty Among Married-Couple vs Single-Parent Households in Chillicothe
The poverty data for Chillicothe shows that 243 of the married-couple family households (7.1%) and 354 of the single-parent households (19.3%) are living below the poverty level. Within the married-couple family households, those with 3 or 4 children have the highest poverty rate, with 118 households (38.8%) falling below the poverty line. Among the single-parent households, those with 3 or 4 children have the highest poverty rate, with 57 household (39.3%) living below poverty.
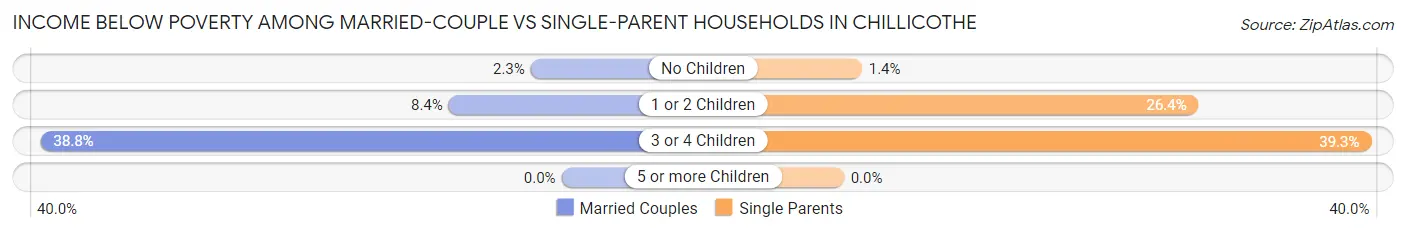
| Children | Married-Couple Families | Single-Parent Households |
| No Children | 52 (2.3%) | 8 (1.3%) |
| 1 or 2 Children | 73 (8.4%) | 289 (26.4%) |
| 3 or 4 Children | 118 (38.8%) | 57 (39.3%) |
| 5 or more Children | 0 (0.0%) | 0 (0.0%) |
| Total | 243 (7.1%) | 354 (19.3%) |
Race in Chillicothe
The most populous races in Chillicothe are White / Caucasian (18,745 | 85.2%), Black / African American (1,794 | 8.2%), and Two or more Races (1,345 | 6.1%).
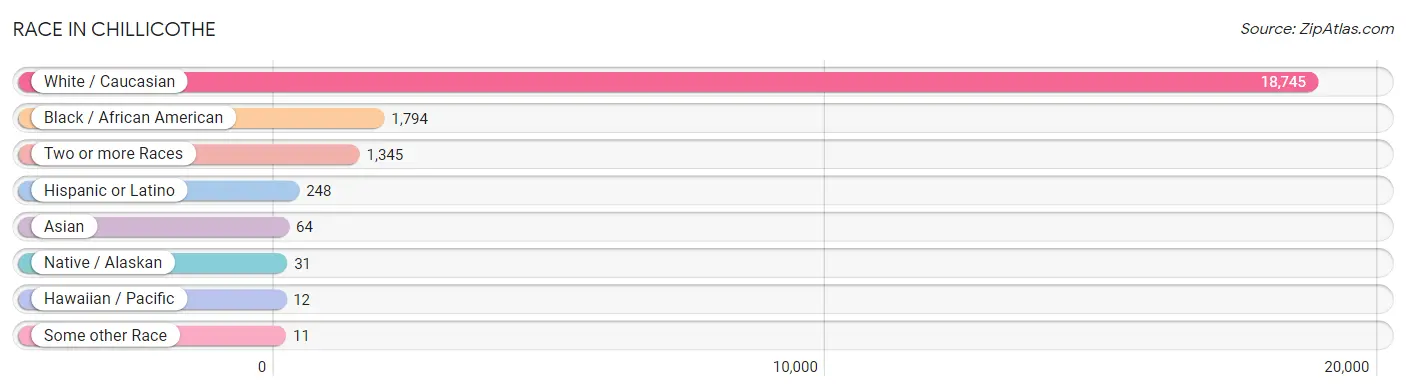
| Race | # Population | % Population |
| Asian | 64 | 0.3% |
| Black / African American | 1,794 | 8.2% |
| Hawaiian / Pacific | 12 | 0.1% |
| Hispanic or Latino | 248 | 1.1% |
| Native / Alaskan | 31 | 0.1% |
| White / Caucasian | 18,745 | 85.2% |
| Two or more Races | 1,345 | 6.1% |
| Some other Race | 11 | 0.1% |
| Total | 22,002 | 100.0% |
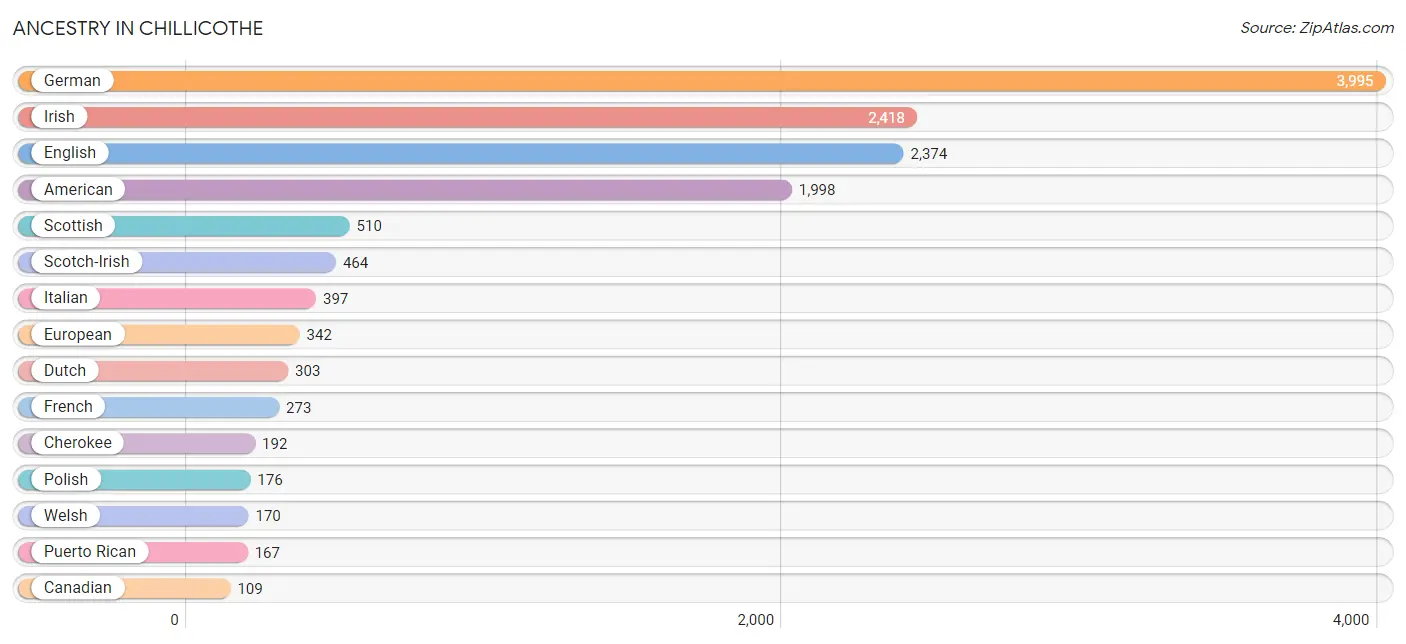
Ancestry in Chillicothe
The most populous ancestries reported in Chillicothe are German (3,995 | 18.2%), Irish (2,418 | 11.0%), English (2,374 | 10.8%), American (1,998 | 9.1%), and Scottish (510 | 2.3%), together accounting for 51.3% of all Chillicothe residents.
| Ancestry | # Population | % Population |
| African | 3 | 0.0% |
| American | 1,998 | 9.1% |
| Arab | 8 | 0.0% |
| Barbadian | 7 | 0.0% |
| Belgian | 31 | 0.1% |
| Bhutanese | 50 | 0.2% |
| Blackfeet | 9 | 0.0% |
| British | 97 | 0.4% |
| Canadian | 109 | 0.5% |
| Cherokee | 192 | 0.9% |
| Chippewa | 19 | 0.1% |
| Cree | 4 | 0.0% |
| Croatian | 9 | 0.0% |
| Czech | 33 | 0.2% |
| Czechoslovakian | 11 | 0.1% |
| Delaware | 14 | 0.1% |
| Dutch | 303 | 1.4% |
| English | 2,374 | 10.8% |
| European | 342 | 1.5% |
| French | 273 | 1.2% |
| French American Indian | 10 | 0.1% |
| French Canadian | 34 | 0.2% |
| German | 3,995 | 18.2% |
| Greek | 9 | 0.0% |
| Hungarian | 20 | 0.1% |
| Iranian | 10 | 0.1% |
| Irish | 2,418 | 11.0% |
| Iroquois | 23 | 0.1% |
| Italian | 397 | 1.8% |
| Japanese | 27 | 0.1% |
| Korean | 44 | 0.2% |
| Lebanese | 8 | 0.0% |
| Lithuanian | 10 | 0.1% |
| Mexican | 67 | 0.3% |
| Native Hawaiian | 15 | 0.1% |
| Navajo | 19 | 0.1% |
| Northern European | 5 | 0.0% |
| Norwegian | 70 | 0.3% |
| Polish | 176 | 0.8% |
| Puerto Rican | 167 | 0.8% |
| Russian | 4 | 0.0% |
| Scandinavian | 8 | 0.0% |
| Scotch-Irish | 464 | 2.1% |
| Scottish | 510 | 2.3% |
| Seminole | 7 | 0.0% |
| Slovak | 1 | 0.0% |
| Spanish | 5 | 0.0% |
| Sri Lankan | 28 | 0.1% |
| Subsaharan African | 3 | 0.0% |
| Swedish | 60 | 0.3% |
| Swiss | 10 | 0.1% |
| Thai | 28 | 0.1% |
| Turkish | 12 | 0.1% |
| Ukrainian | 56 | 0.3% |
| Welsh | 170 | 0.8% |
| West Indian | 7 | 0.0% |
| Yugoslavian | 12 | 0.1% | View All 57 Rows |
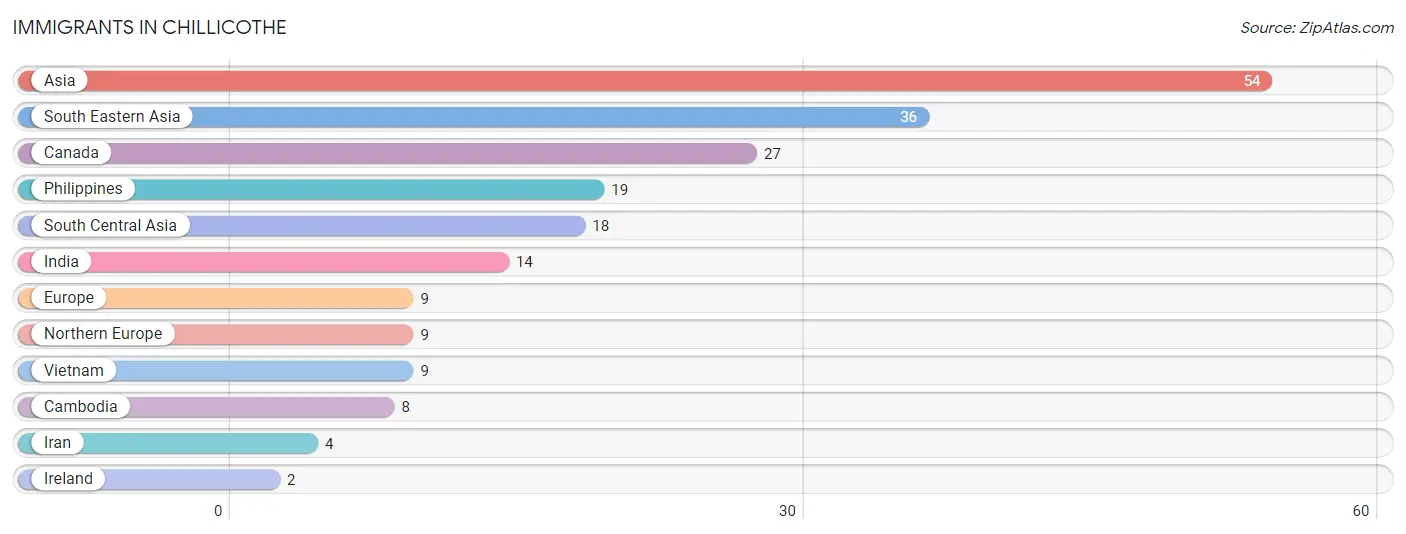
Immigrants in Chillicothe
The most numerous immigrant groups reported in Chillicothe came from Asia (54 | 0.3%), South Eastern Asia (36 | 0.2%), Canada (27 | 0.1%), Philippines (19 | 0.1%), and South Central Asia (18 | 0.1%), together accounting for 0.7% of all Chillicothe residents.
| Immigration Origin | # Population | % Population |
| Asia | 54 | 0.3% |
| Cambodia | 8 | 0.0% |
| Canada | 27 | 0.1% |
| Europe | 9 | 0.0% |
| India | 14 | 0.1% |
| Iran | 4 | 0.0% |
| Ireland | 2 | 0.0% |
| Northern Europe | 9 | 0.0% |
| Philippines | 19 | 0.1% |
| South Central Asia | 18 | 0.1% |
| South Eastern Asia | 36 | 0.2% |
| Vietnam | 9 | 0.0% | View All 12 Rows |
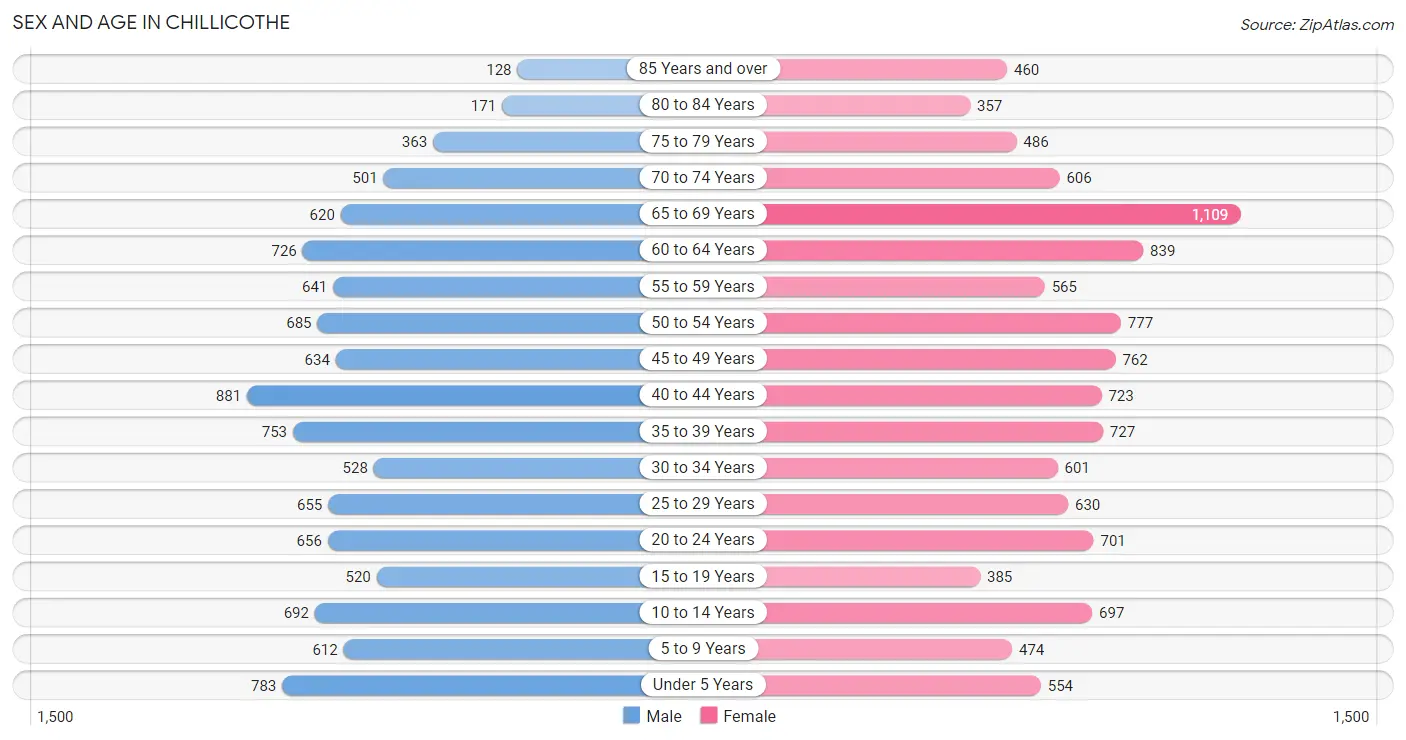
Sex and Age in Chillicothe
Sex and Age in Chillicothe
The most populous age groups in Chillicothe are 40 to 44 Years (881 | 8.4%) for men and 65 to 69 Years (1,109 | 9.7%) for women.
| Age Bracket | Male | Female |
| Under 5 Years | 783 (7.4%) | 554 (4.8%) |
| 5 to 9 Years | 612 (5.8%) | 474 (4.1%) |
| 10 to 14 Years | 692 (6.6%) | 697 (6.1%) |
| 15 to 19 Years | 520 (4.9%) | 385 (3.4%) |
| 20 to 24 Years | 656 (6.2%) | 701 (6.1%) |
| 25 to 29 Years | 655 (6.2%) | 630 (5.5%) |
| 30 to 34 Years | 528 (5.0%) | 601 (5.2%) |
| 35 to 39 Years | 753 (7.1%) | 727 (6.4%) |
| 40 to 44 Years | 881 (8.4%) | 723 (6.3%) |
| 45 to 49 Years | 634 (6.0%) | 762 (6.7%) |
| 50 to 54 Years | 685 (6.5%) | 777 (6.8%) |
| 55 to 59 Years | 641 (6.1%) | 565 (4.9%) |
| 60 to 64 Years | 726 (6.9%) | 839 (7.3%) |
| 65 to 69 Years | 620 (5.9%) | 1,109 (9.7%) |
| 70 to 74 Years | 501 (4.8%) | 606 (5.3%) |
| 75 to 79 Years | 363 (3.4%) | 486 (4.2%) |
| 80 to 84 Years | 171 (1.6%) | 357 (3.1%) |
| 85 Years and over | 128 (1.2%) | 460 (4.0%) |
| Total | 10,549 (100.0%) | 11,453 (100.0%) |
Families and Households in Chillicothe
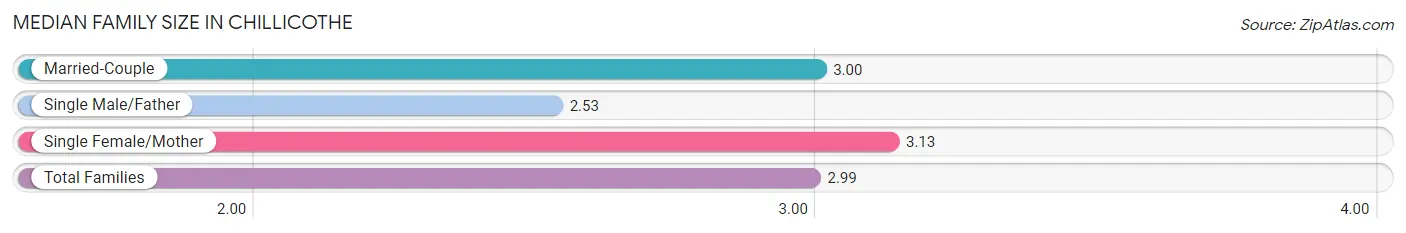
Median Family Size in Chillicothe
The median family size in Chillicothe is 2.99 persons per family, with single female/mother families (1,322 | 25.1%) accounting for the largest median family size of 3.13 persons per family. On the other hand, single male/father families (508 | 9.6%) represent the smallest median family size with 2.53 persons per family.
| Family Type | # Families | Family Size |
| Married-Couple | 3,438 (65.3%) | 3.00 |
| Single Male/Father | 508 (9.6%) | 2.53 |
| Single Female/Mother | 1,322 (25.1%) | 3.13 |
| Total Families | 5,268 (100.0%) | 2.99 |
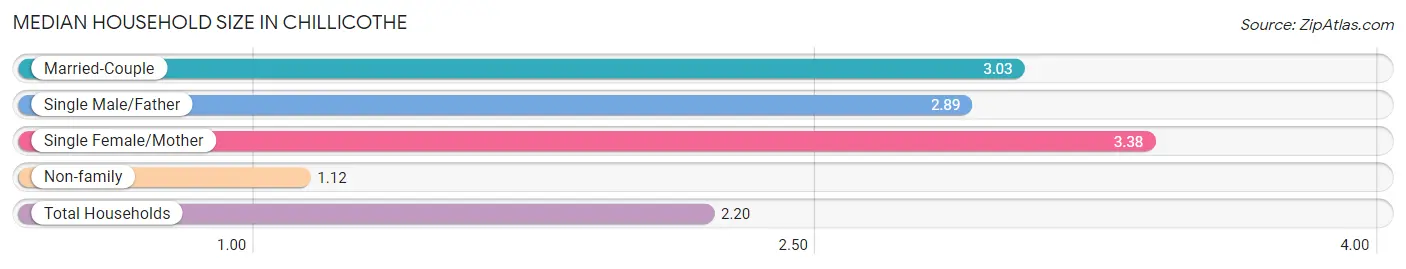
Median Household Size in Chillicothe
The median household size in Chillicothe is 2.20 persons per household, with single female/mother households (1,322 | 13.7%) accounting for the largest median household size of 3.38 persons per household. non-family households (4,411 | 45.6%) represent the smallest median household size with 1.12 persons per household.
| Household Type | # Households | Household Size |
| Married-Couple | 3,438 (35.5%) | 3.03 |
| Single Male/Father | 508 (5.2%) | 2.89 |
| Single Female/Mother | 1,322 (13.7%) | 3.38 |
| Non-family | 4,411 (45.6%) | 1.12 |
| Total Households | 9,679 (100.0%) | 2.20 |
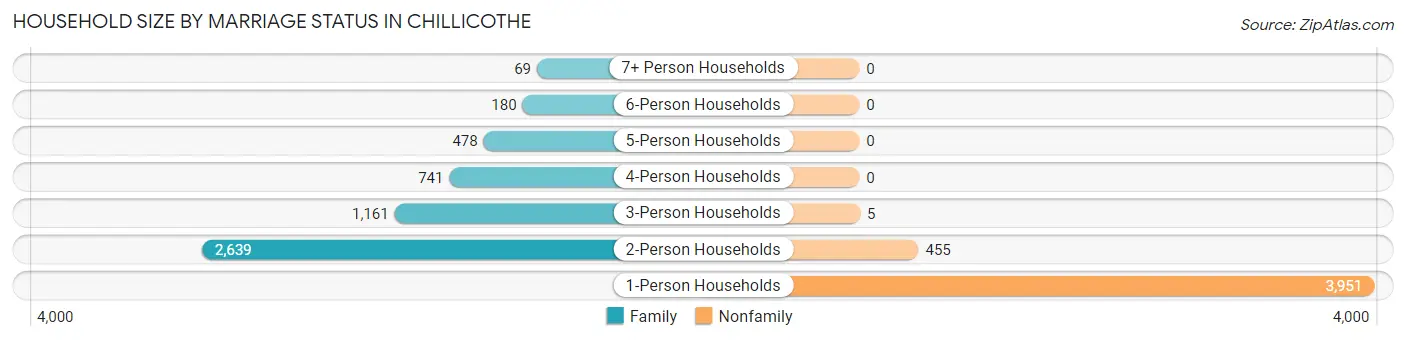
Household Size by Marriage Status in Chillicothe
Out of a total of 9,679 households in Chillicothe, 5,268 (54.4%) are family households, while 4,411 (45.6%) are nonfamily households. The most numerous type of family households are 2-person households, comprising 2,639, and the most common type of nonfamily households are 1-person households, comprising 3,951.
| Household Size | Family Households | Nonfamily Households |
| 1-Person Households | - | 3,951 (40.8%) |
| 2-Person Households | 2,639 (27.3%) | 455 (4.7%) |
| 3-Person Households | 1,161 (12.0%) | 5 (0.1%) |
| 4-Person Households | 741 (7.7%) | 0 (0.0%) |
| 5-Person Households | 478 (4.9%) | 0 (0.0%) |
| 6-Person Households | 180 (1.9%) | 0 (0.0%) |
| 7+ Person Households | 69 (0.7%) | 0 (0.0%) |
| Total | 5,268 (54.4%) | 4,411 (45.6%) |
Female Fertility in Chillicothe
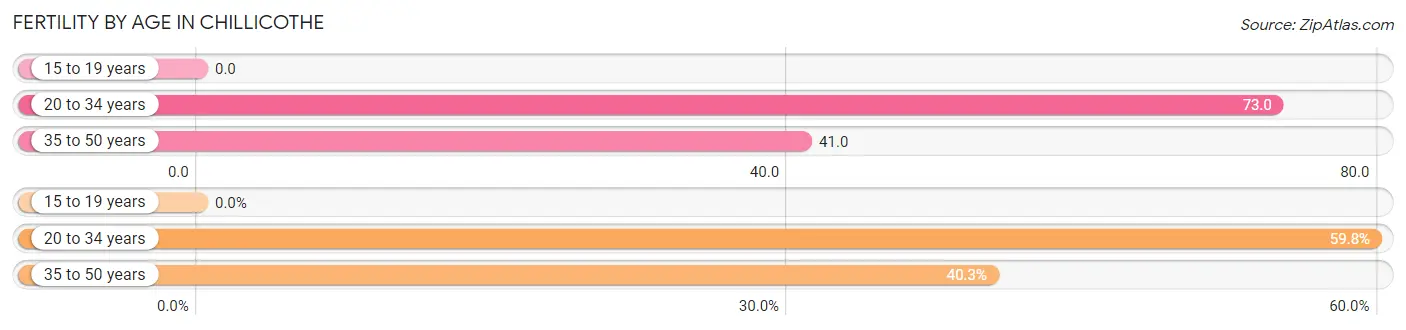
Fertility by Age in Chillicothe
Average fertility rate in Chillicothe is 51.0 births per 1,000 women. Women in the age bracket of 20 to 34 years have the highest fertility rate with 73.0 births per 1,000 women. Women in the age bracket of 20 to 34 years acount for 59.8% of all women with births.
| Age Bracket | Women with Births | Births / 1,000 Women |
| 15 to 19 years | 0 (0.0%) | 0.0 |
| 20 to 34 years | 141 (59.8%) | 73.0 |
| 35 to 50 years | 95 (40.3%) | 41.0 |
| Total | 236 (100.0%) | 51.0 |
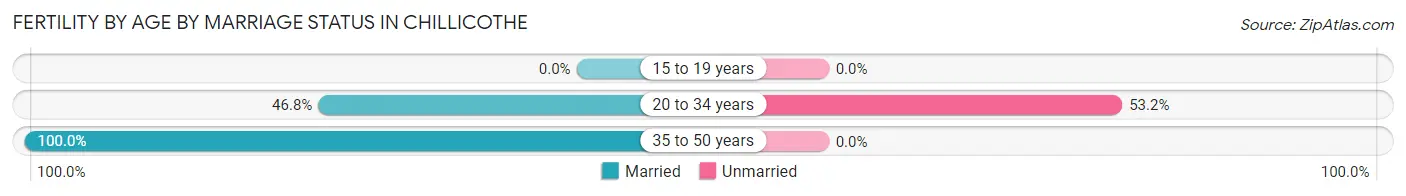
Fertility by Age by Marriage Status in Chillicothe
68.2% of women with births (236) in Chillicothe are married. The highest percentage of unmarried women with births falls into 20 to 34 years age bracket with 53.2% of them unmarried at the time of birth, while the lowest percentage of unmarried women with births belong to 35 to 50 years age bracket with 0.0% of them unmarried.
| Age Bracket | Married | Unmarried |
| 15 to 19 years | 0 (0.0%) | 0 (0.0%) |
| 20 to 34 years | 66 (46.8%) | 75 (53.2%) |
| 35 to 50 years | 95 (100.0%) | 0 (0.0%) |
| Total | 161 (68.2%) | 75 (31.8%) |
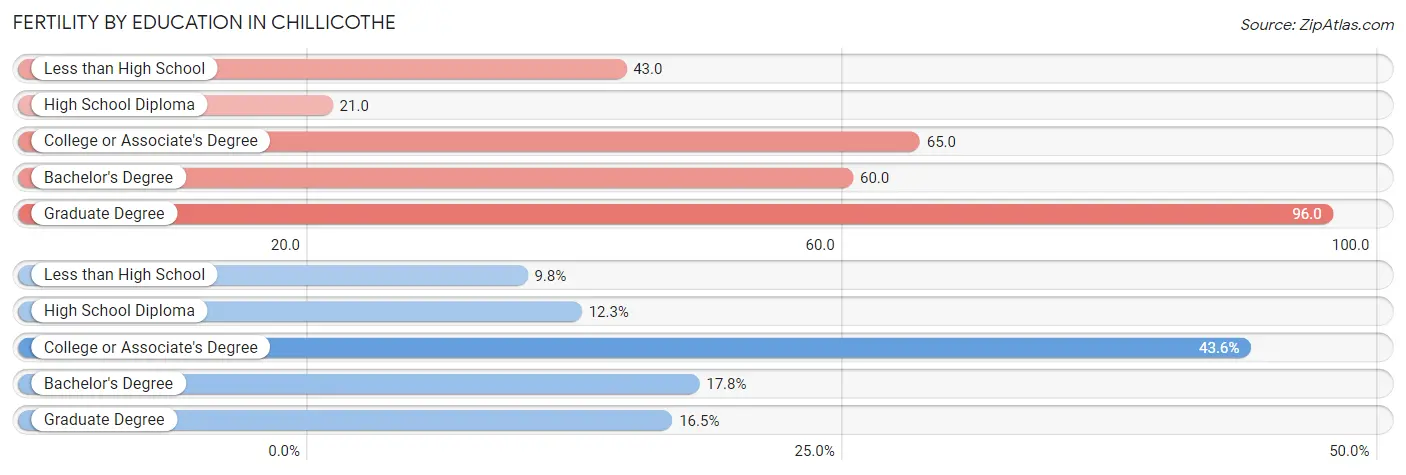
Fertility by Education in Chillicothe
Average fertility rate in Chillicothe is 51.0 births per 1,000 women. Women with the education attainment of graduate degree have the highest fertility rate of 96.0 births per 1,000 women, while women with the education attainment of high school diploma have the lowest fertility at 21.0 births per 1,000 women. Women with the education attainment of college or associate's degree represent 43.6% of all women with births.
| Educational Attainment | Women with Births | Births / 1,000 Women |
| Less than High School | 23 (9.8%) | 43.0 |
| High School Diploma | 29 (12.3%) | 21.0 |
| College or Associate's Degree | 103 (43.6%) | 65.0 |
| Bachelor's Degree | 42 (17.8%) | 60.0 |
| Graduate Degree | 39 (16.5%) | 96.0 |
| Total | 236 (100.0%) | 51.0 |
Fertility by Education by Marriage Status in Chillicothe
31.8% of women with births in Chillicothe are unmarried. Women with the educational attainment of bachelor's degree are most likely to be married with 100.0% of them married at childbirth, while women with the educational attainment of less than high school are least likely to be married with 100.0% of them unmarried at childbirth.
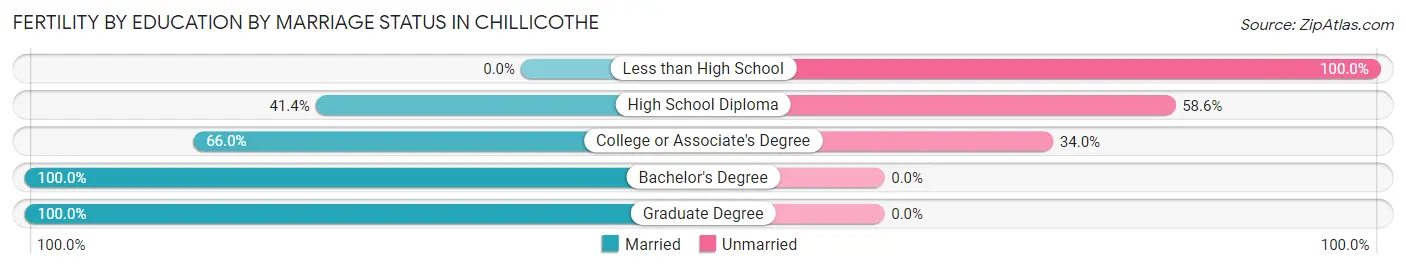
| Educational Attainment | Married | Unmarried |
| Less than High School | 0 (0.0%) | 23 (100.0%) |
| High School Diploma | 12 (41.4%) | 17 (58.6%) |
| College or Associate's Degree | 68 (66.0%) | 35 (34.0%) |
| Bachelor's Degree | 42 (100.0%) | 0 (0.0%) |
| Graduate Degree | 39 (100.0%) | 0 (0.0%) |
| Total | 161 (68.2%) | 75 (31.8%) |
Employment Characteristics in Chillicothe
Employment by Class of Employer in Chillicothe
Among the 8,975 employed individuals in Chillicothe, private company employees (5,518 | 61.5%), not-for-profit organizations (969 | 10.8%), and state government employees (660 | 7.3%) make up the most common classes of employment.
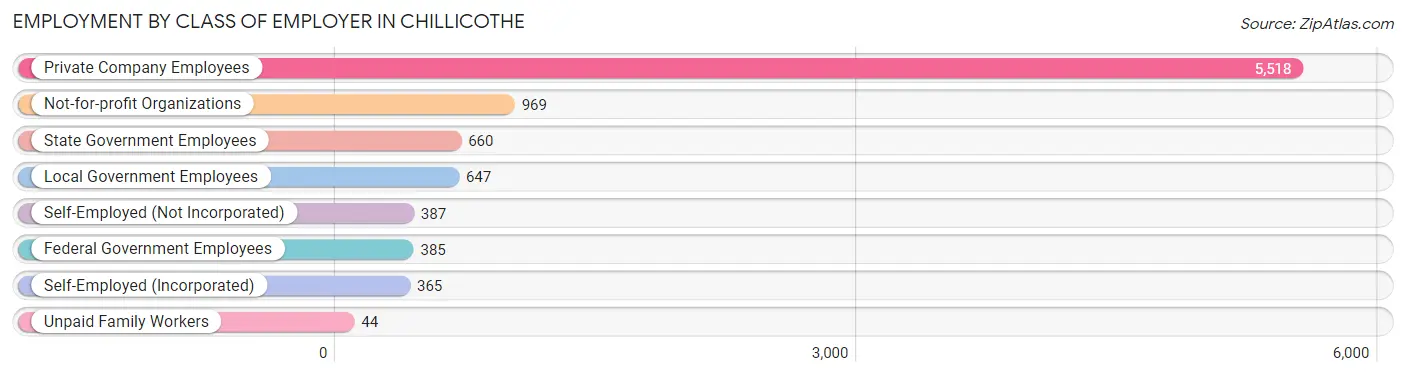
| Employer Class | # Employees | % Employees |
| Private Company Employees | 5,518 | 61.5% |
| Self-Employed (Incorporated) | 365 | 4.1% |
| Self-Employed (Not Incorporated) | 387 | 4.3% |
| Not-for-profit Organizations | 969 | 10.8% |
| Local Government Employees | 647 | 7.2% |
| State Government Employees | 660 | 7.3% |
| Federal Government Employees | 385 | 4.3% |
| Unpaid Family Workers | 44 | 0.5% |
| Total | 8,975 | 100.0% |
Employment Status by Age in Chillicothe
According to the labor force statistics for Chillicothe, out of the total population over 16 years of age (18,072), 55.7% or 10,066 individuals are in the labor force, with 7.5% or 755 of them unemployed. The age group with the highest labor force participation rate is 25 to 29 years, with 87.5% or 1,124 individuals in the labor force. Within the labor force, the 20 to 24 years age range has the highest percentage of unemployed individuals, with 12.6% or 144 of them being unemployed.
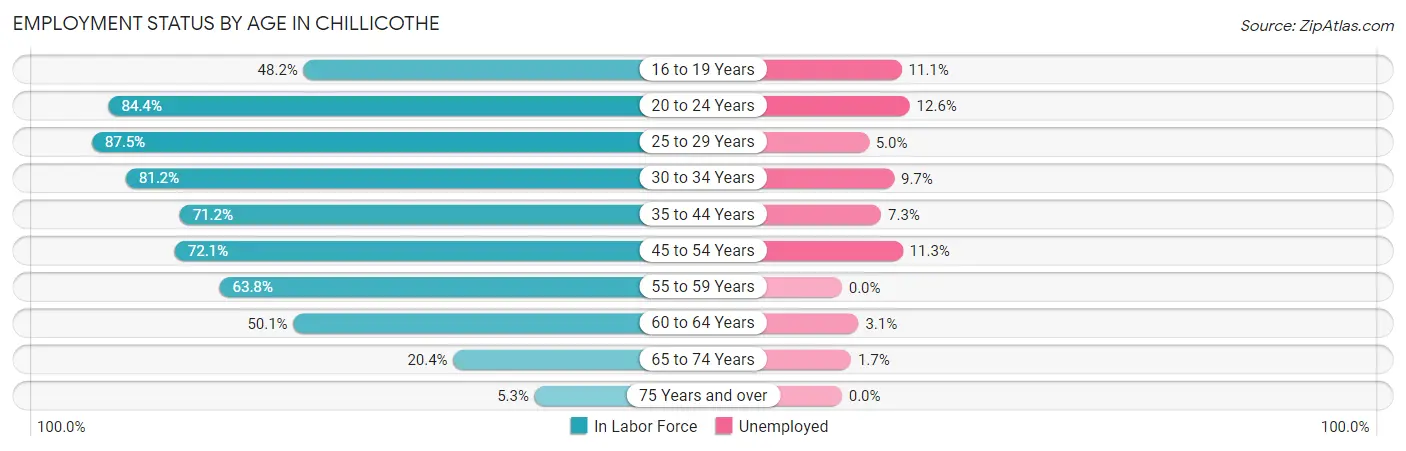
| Age Bracket | In Labor Force | Unemployed |
| 16 to 19 Years | 379 (48.2%) | 42 (11.1%) |
| 20 to 24 Years | 1,145 (84.4%) | 144 (12.6%) |
| 25 to 29 Years | 1,124 (87.5%) | 56 (5.0%) |
| 30 to 34 Years | 917 (81.2%) | 89 (9.7%) |
| 35 to 44 Years | 2,196 (71.2%) | 160 (7.3%) |
| 45 to 54 Years | 2,061 (72.1%) | 233 (11.3%) |
| 55 to 59 Years | 769 (63.8%) | 0 (0.0%) |
| 60 to 64 Years | 784 (50.1%) | 24 (3.1%) |
| 65 to 74 Years | 579 (20.4%) | 10 (1.7%) |
| 75 Years and over | 104 (5.3%) | 0 (0.0%) |
| Total | 10,066 (55.7%) | 755 (7.5%) |
Employment Status by Educational Attainment in Chillicothe
According to labor force statistics for Chillicothe, 70.5% of individuals (7,845) out of the total population between 25 and 64 years of age (11,127) are in the labor force, with 7.2% or 565 of them being unemployed. The group with the highest labor force participation rate are those with the educational attainment of bachelor's degree or higher, with 86.1% or 1,767 individuals in the labor force. Within the labor force, individuals with less than high school education have the highest percentage of unemployment, with 17.4% or 62 of them being unemployed.
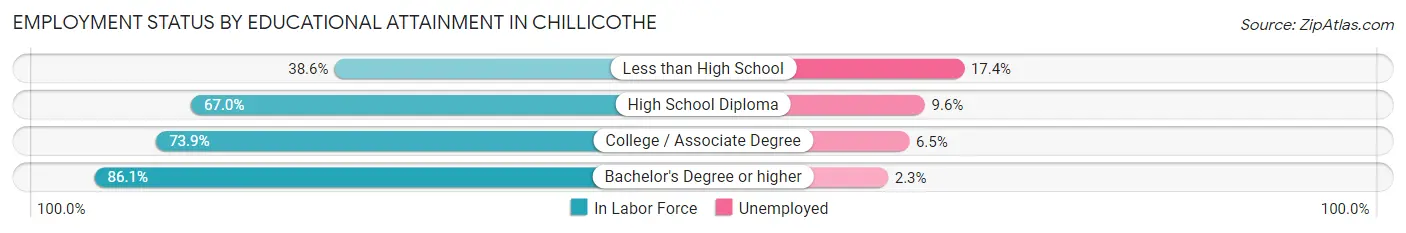
| Educational Attainment | In Labor Force | Unemployed |
| Less than High School | 357 (38.6%) | 161 (17.4%) |
| High School Diploma | 2,847 (67.0%) | 408 (9.6%) |
| College / Associate Degree | 2,882 (73.9%) | 254 (6.5%) |
| Bachelor's Degree or higher | 1,767 (86.1%) | 47 (2.3%) |
| Total | 7,845 (70.5%) | 801 (7.2%) |
Employment Occupations by Sex in Chillicothe
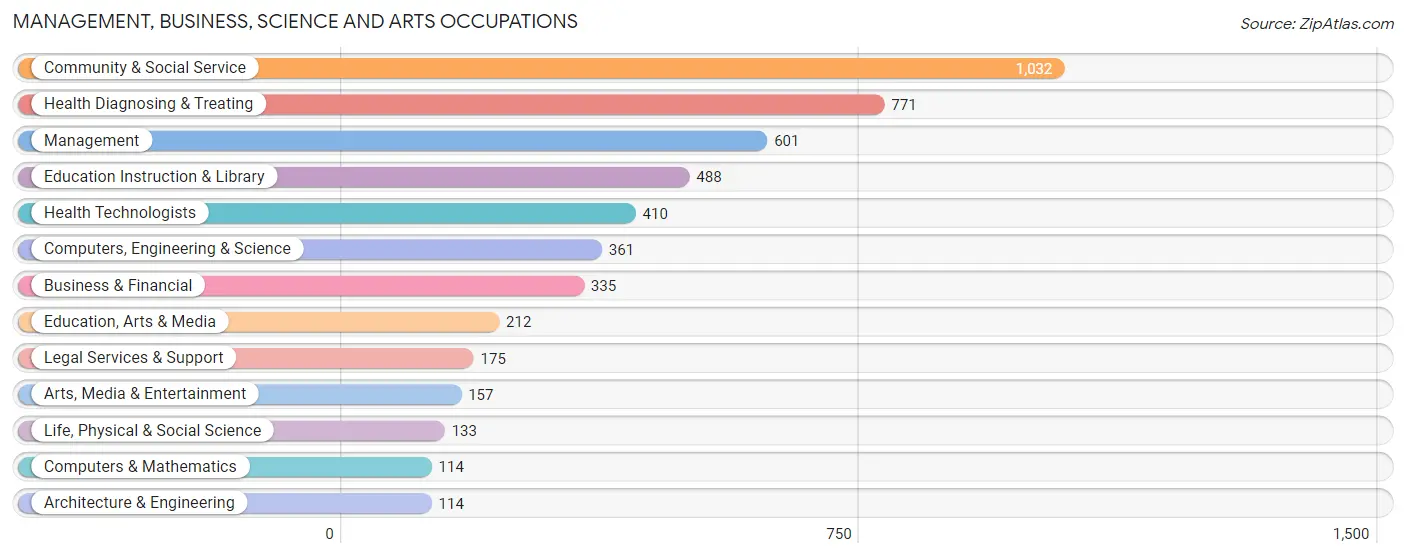
Management, Business, Science and Arts Occupations
The most common Management, Business, Science and Arts occupations in Chillicothe are Community & Social Service (1,032 | 11.1%), Health Diagnosing & Treating (771 | 8.3%), Management (601 | 6.5%), Education Instruction & Library (488 | 5.2%), and Health Technologists (410 | 4.4%).
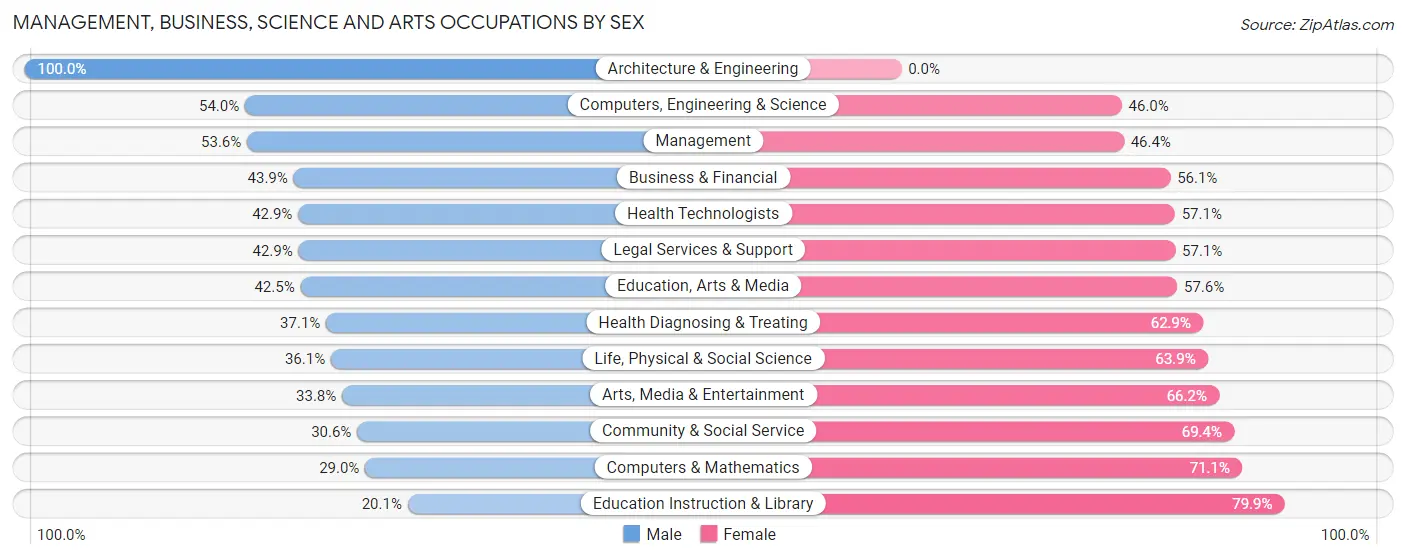
Management, Business, Science and Arts Occupations by Sex
Within the Management, Business, Science and Arts occupations in Chillicothe, the most male-oriented occupations are Architecture & Engineering (100.0%), Computers, Engineering & Science (54.0%), and Management (53.6%), while the most female-oriented occupations are Education Instruction & Library (79.9%), Computers & Mathematics (71.1%), and Community & Social Service (69.4%).
| Occupation | Male | Female |
| Management | 322 (53.6%) | 279 (46.4%) |
| Business & Financial | 147 (43.9%) | 188 (56.1%) |
| Computers, Engineering & Science | 195 (54.0%) | 166 (46.0%) |
| Computers & Mathematics | 33 (28.9%) | 81 (71.1%) |
| Architecture & Engineering | 114 (100.0%) | 0 (0.0%) |
| Life, Physical & Social Science | 48 (36.1%) | 85 (63.9%) |
| Community & Social Service | 316 (30.6%) | 716 (69.4%) |
| Education, Arts & Media | 90 (42.4%) | 122 (57.6%) |
| Legal Services & Support | 75 (42.9%) | 100 (57.1%) |
| Education Instruction & Library | 98 (20.1%) | 390 (79.9%) |
| Arts, Media & Entertainment | 53 (33.8%) | 104 (66.2%) |
| Health Diagnosing & Treating | 286 (37.1%) | 485 (62.9%) |
| Health Technologists | 176 (42.9%) | 234 (57.1%) |
| Total (Category) | 1,266 (40.8%) | 1,834 (59.2%) |
| Total (Overall) | 4,827 (51.9%) | 4,472 (48.1%) |
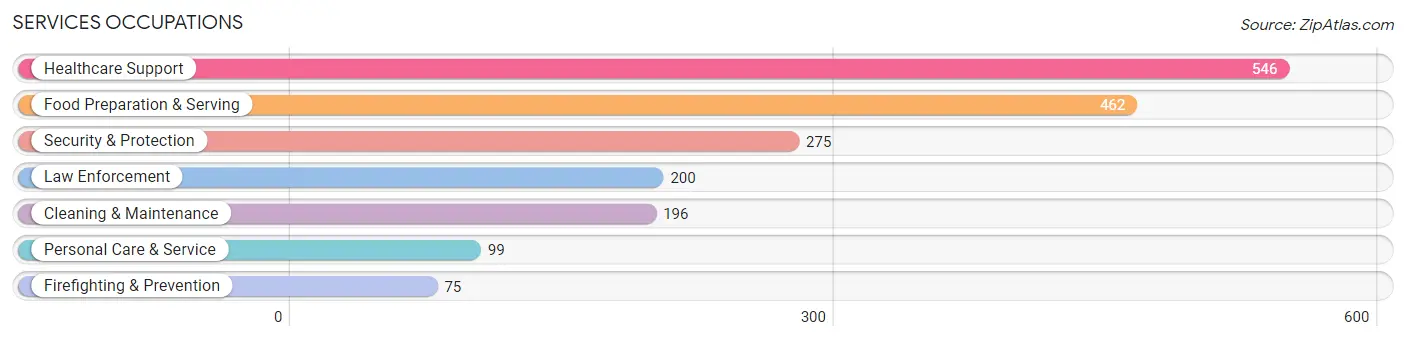
Services Occupations
The most common Services occupations in Chillicothe are Healthcare Support (546 | 5.9%), Food Preparation & Serving (462 | 5.0%), Security & Protection (275 | 3.0%), Law Enforcement (200 | 2.1%), and Cleaning & Maintenance (196 | 2.1%).
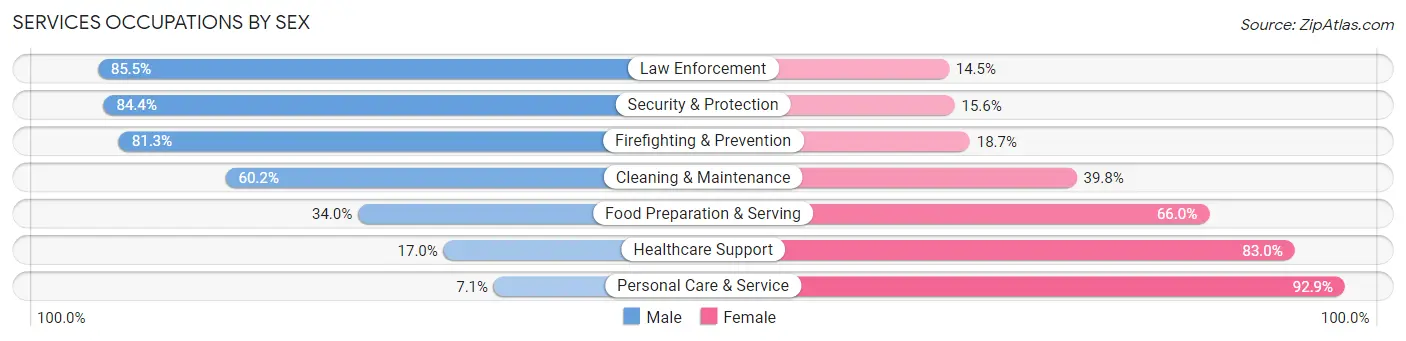
Services Occupations by Sex
Within the Services occupations in Chillicothe, the most male-oriented occupations are Law Enforcement (85.5%), Security & Protection (84.4%), and Firefighting & Prevention (81.3%), while the most female-oriented occupations are Personal Care & Service (92.9%), Healthcare Support (83.0%), and Food Preparation & Serving (66.0%).
| Occupation | Male | Female |
| Healthcare Support | 93 (17.0%) | 453 (83.0%) |
| Security & Protection | 232 (84.4%) | 43 (15.6%) |
| Firefighting & Prevention | 61 (81.3%) | 14 (18.7%) |
| Law Enforcement | 171 (85.5%) | 29 (14.5%) |
| Food Preparation & Serving | 157 (34.0%) | 305 (66.0%) |
| Cleaning & Maintenance | 118 (60.2%) | 78 (39.8%) |
| Personal Care & Service | 7 (7.1%) | 92 (92.9%) |
| Total (Category) | 607 (38.5%) | 971 (61.5%) |
| Total (Overall) | 4,827 (51.9%) | 4,472 (48.1%) |
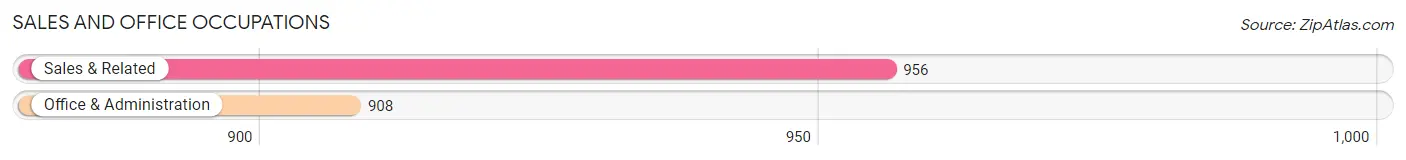
Sales and Office Occupations
The most common Sales and Office occupations in Chillicothe are Sales & Related (956 | 10.3%), and Office & Administration (908 | 9.8%).
Sales and Office Occupations by Sex
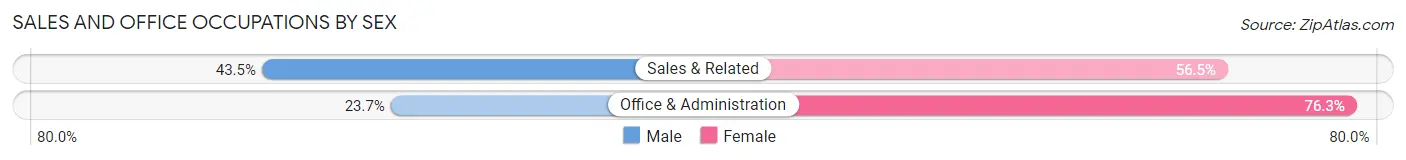
| Occupation | Male | Female |
| Sales & Related | 416 (43.5%) | 540 (56.5%) |
| Office & Administration | 215 (23.7%) | 693 (76.3%) |
| Total (Category) | 631 (33.9%) | 1,233 (66.1%) |
| Total (Overall) | 4,827 (51.9%) | 4,472 (48.1%) |
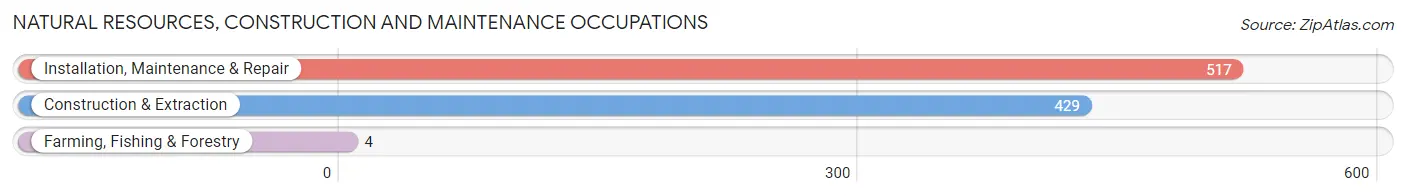
Natural Resources, Construction and Maintenance Occupations
The most common Natural Resources, Construction and Maintenance occupations in Chillicothe are Installation, Maintenance & Repair (517 | 5.6%), Construction & Extraction (429 | 4.6%), and Farming, Fishing & Forestry (4 | 0.0%).
Natural Resources, Construction and Maintenance Occupations by Sex
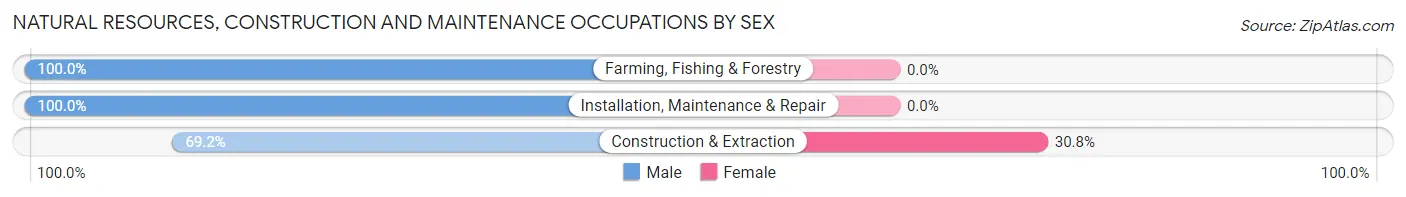
| Occupation | Male | Female |
| Farming, Fishing & Forestry | 4 (100.0%) | 0 (0.0%) |
| Construction & Extraction | 297 (69.2%) | 132 (30.8%) |
| Installation, Maintenance & Repair | 517 (100.0%) | 0 (0.0%) |
| Total (Category) | 818 (86.1%) | 132 (13.9%) |
| Total (Overall) | 4,827 (51.9%) | 4,472 (48.1%) |
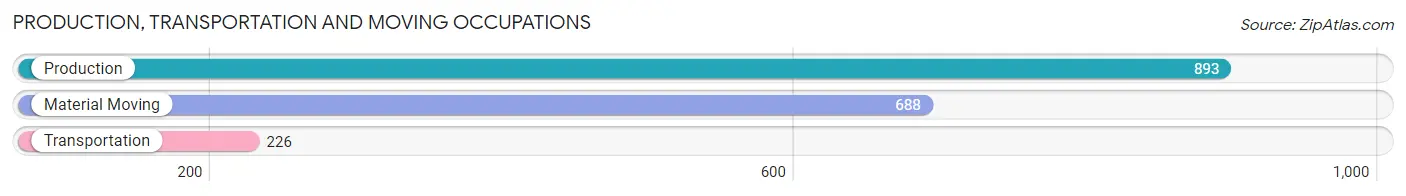
Production, Transportation and Moving Occupations
The most common Production, Transportation and Moving occupations in Chillicothe are Production (893 | 9.6%), Material Moving (688 | 7.4%), and Transportation (226 | 2.4%).
Production, Transportation and Moving Occupations by Sex
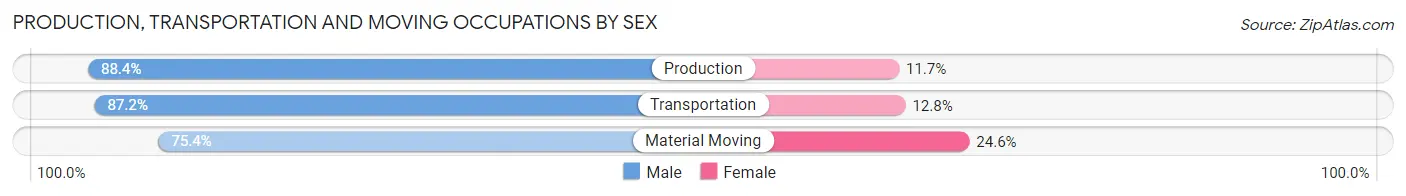
| Occupation | Male | Female |
| Production | 789 (88.3%) | 104 (11.7%) |
| Transportation | 197 (87.2%) | 29 (12.8%) |
| Material Moving | 519 (75.4%) | 169 (24.6%) |
| Total (Category) | 1,505 (83.3%) | 302 (16.7%) |
| Total (Overall) | 4,827 (51.9%) | 4,472 (48.1%) |
Employment Industries by Sex in Chillicothe
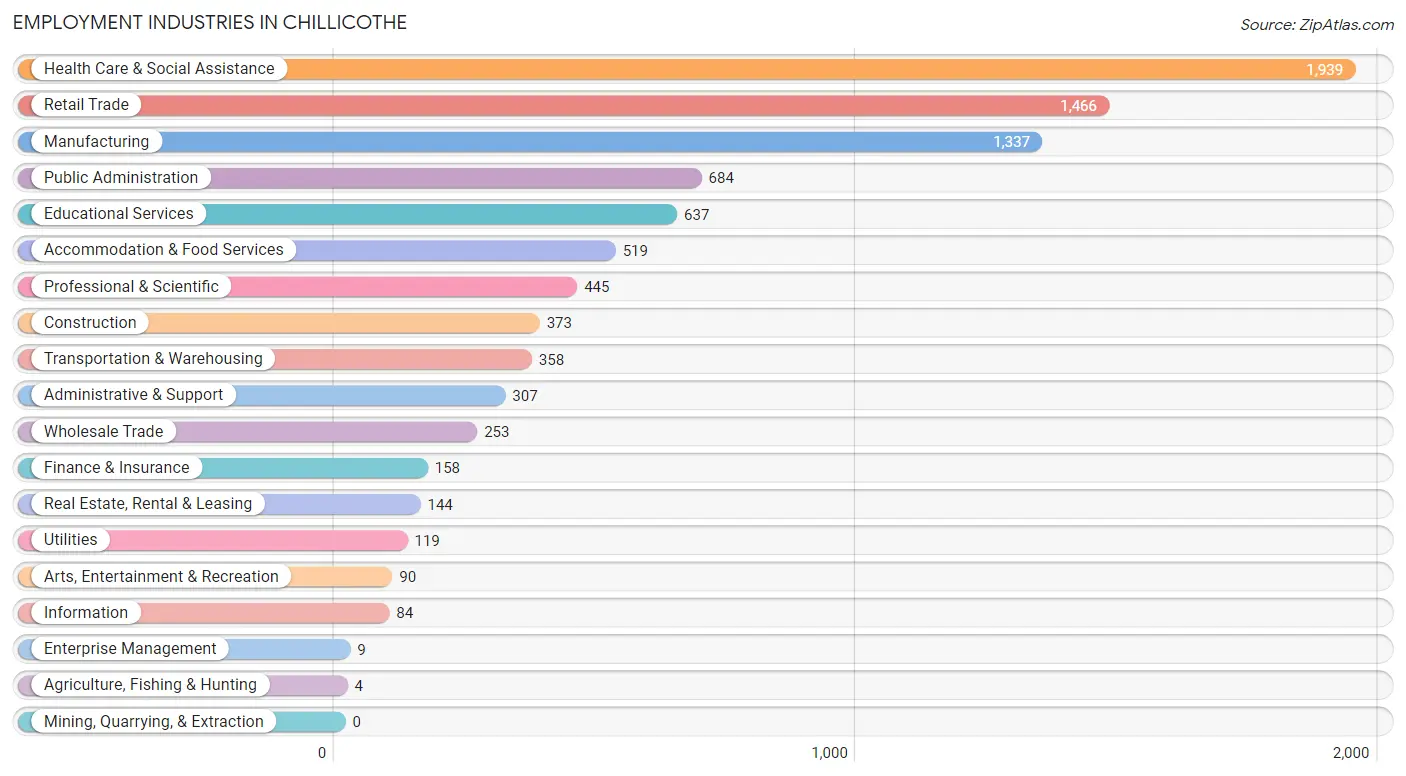
Employment Industries in Chillicothe
The major employment industries in Chillicothe include Health Care & Social Assistance (1,939 | 20.8%), Retail Trade (1,466 | 15.8%), Manufacturing (1,337 | 14.4%), Public Administration (684 | 7.4%), and Educational Services (637 | 6.9%).
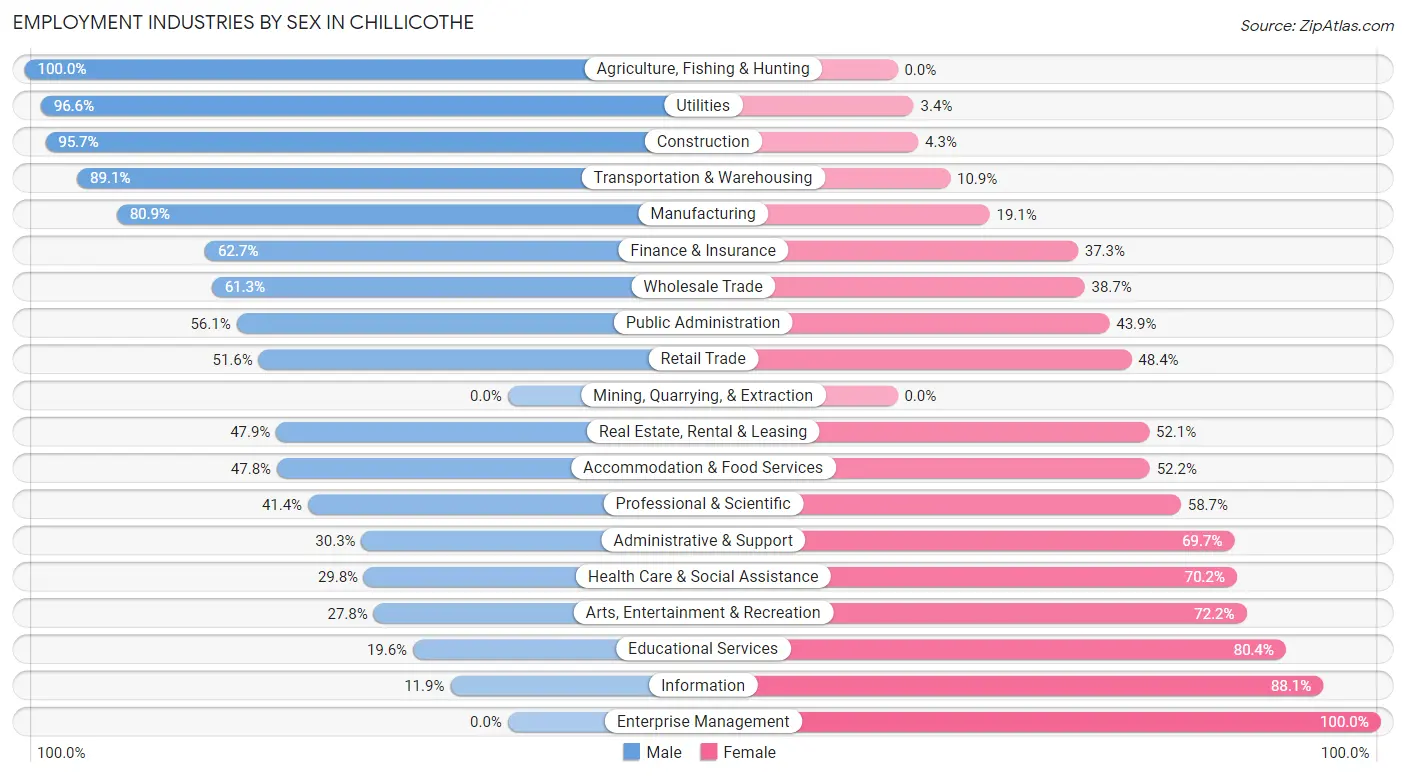
Employment Industries by Sex in Chillicothe
The Chillicothe industries that see more men than women are Agriculture, Fishing & Hunting (100.0%), Utilities (96.6%), and Construction (95.7%), whereas the industries that tend to have a higher number of women are Enterprise Management (100.0%), Information (88.1%), and Educational Services (80.4%).
| Industry | Male | Female |
| Agriculture, Fishing & Hunting | 4 (100.0%) | 0 (0.0%) |
| Mining, Quarrying, & Extraction | 0 (0.0%) | 0 (0.0%) |
| Construction | 357 (95.7%) | 16 (4.3%) |
| Manufacturing | 1,082 (80.9%) | 255 (19.1%) |
| Wholesale Trade | 155 (61.3%) | 98 (38.7%) |
| Retail Trade | 756 (51.6%) | 710 (48.4%) |
| Transportation & Warehousing | 319 (89.1%) | 39 (10.9%) |
| Utilities | 115 (96.6%) | 4 (3.4%) |
| Information | 10 (11.9%) | 74 (88.1%) |
| Finance & Insurance | 99 (62.7%) | 59 (37.3%) |
| Real Estate, Rental & Leasing | 69 (47.9%) | 75 (52.1%) |
| Professional & Scientific | 184 (41.3%) | 261 (58.7%) |
| Enterprise Management | 0 (0.0%) | 9 (100.0%) |
| Administrative & Support | 93 (30.3%) | 214 (69.7%) |
| Educational Services | 125 (19.6%) | 512 (80.4%) |
| Health Care & Social Assistance | 577 (29.8%) | 1,362 (70.2%) |
| Arts, Entertainment & Recreation | 25 (27.8%) | 65 (72.2%) |
| Accommodation & Food Services | 248 (47.8%) | 271 (52.2%) |
| Public Administration | 384 (56.1%) | 300 (43.9%) |
| Total | 4,827 (51.9%) | 4,472 (48.1%) |
Education in Chillicothe
School Enrollment in Chillicothe
The most common levels of schooling among the 4,028 students in Chillicothe are middle school (1,246 | 30.9%), elementary school (761 | 18.9%), and high school (735 | 18.2%).
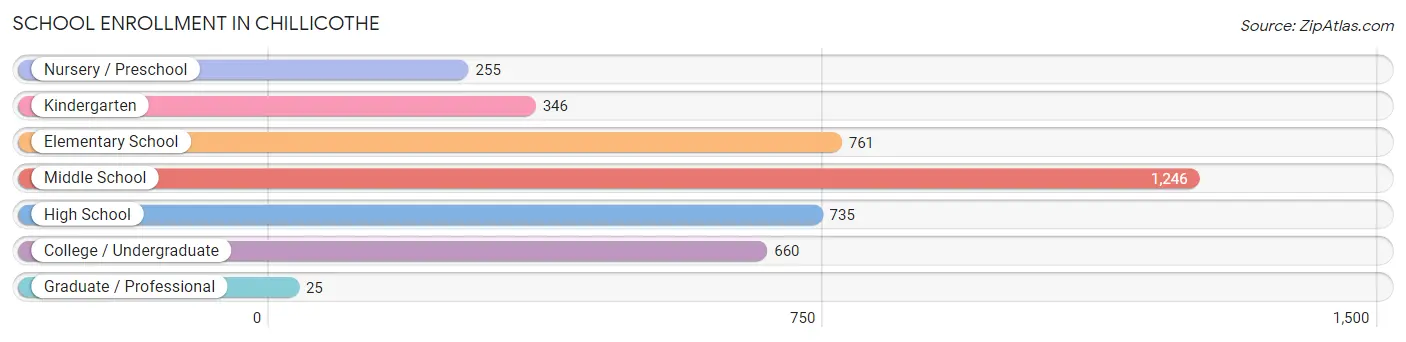
| School Level | # Students | % Students |
| Nursery / Preschool | 255 | 6.3% |
| Kindergarten | 346 | 8.6% |
| Elementary School | 761 | 18.9% |
| Middle School | 1,246 | 30.9% |
| High School | 735 | 18.2% |
| College / Undergraduate | 660 | 16.4% |
| Graduate / Professional | 25 | 0.6% |
| Total | 4,028 | 100.0% |
School Enrollment by Age by Funding Source in Chillicothe
Out of a total of 4,028 students who are enrolled in schools in Chillicothe, 314 (7.8%) attend a private institution, while the remaining 3,714 (92.2%) are enrolled in public schools. The age group of 35 years and over has the highest likelihood of being enrolled in private schools, with 68 (28.8% in the age bracket) enrolled. Conversely, the age group of 18 to 19 year olds has the lowest likelihood of being enrolled in a private school, with 213 (100.0% in the age bracket) attending a public institution.
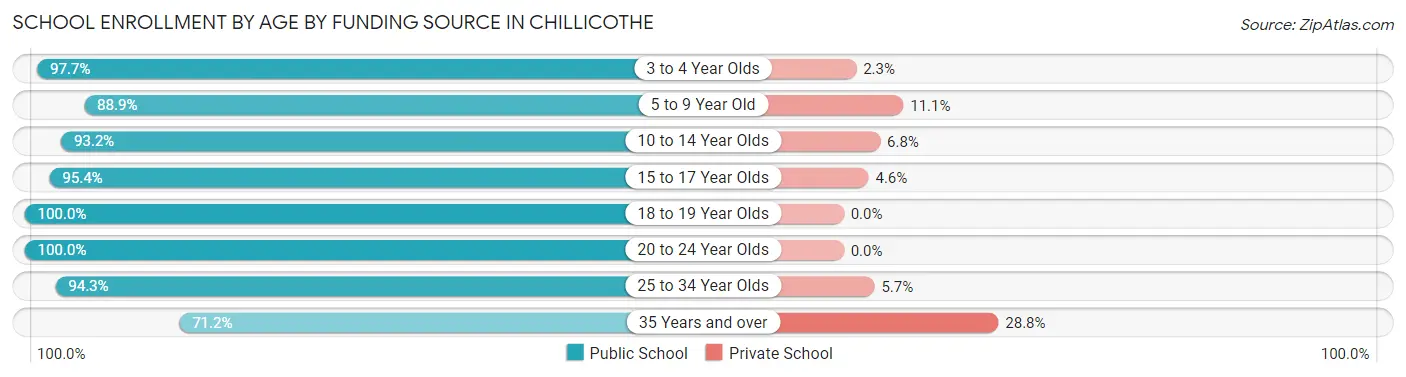
| Age Bracket | Public School | Private School |
| 3 to 4 Year Olds | 252 (97.7%) | 6 (2.3%) |
| 5 to 9 Year Old | 937 (88.9%) | 117 (11.1%) |
| 10 to 14 Year Olds | 1,279 (93.2%) | 93 (6.8%) |
| 15 to 17 Year Olds | 412 (95.4%) | 20 (4.6%) |
| 18 to 19 Year Olds | 213 (100.0%) | 0 (0.0%) |
| 20 to 24 Year Olds | 306 (100.0%) | 0 (0.0%) |
| 25 to 34 Year Olds | 148 (94.3%) | 9 (5.7%) |
| 35 Years and over | 168 (71.2%) | 68 (28.8%) |
| Total | 3,714 (92.2%) | 314 (7.8%) |
Educational Attainment by Field of Study in Chillicothe
Education (871 | 25.3%), business (501 | 14.5%), bio, nature & agricultural (319 | 9.3%), science & technology (298 | 8.6%), and social sciences (236 | 6.9%) are the most common fields of study among 3,446 individuals in Chillicothe who have obtained a bachelor's degree or higher.
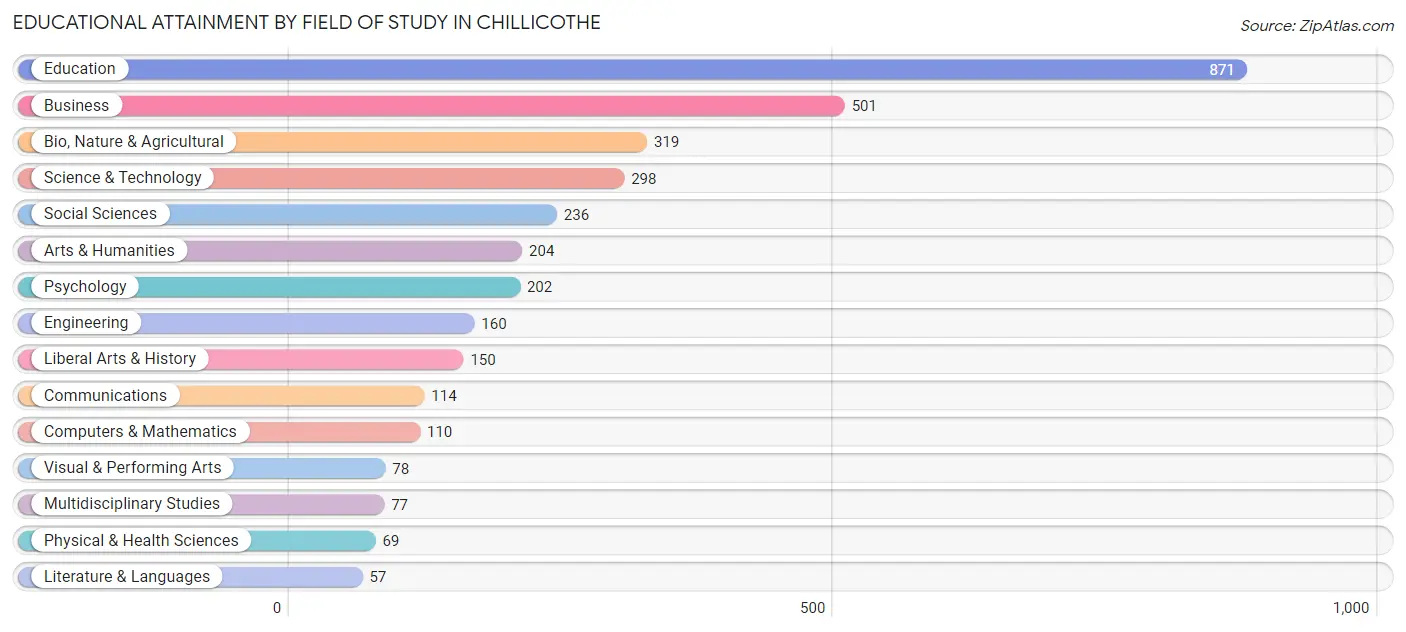
| Field of Study | # Graduates | % Graduates |
| Computers & Mathematics | 110 | 3.2% |
| Bio, Nature & Agricultural | 319 | 9.3% |
| Physical & Health Sciences | 69 | 2.0% |
| Psychology | 202 | 5.9% |
| Social Sciences | 236 | 6.9% |
| Engineering | 160 | 4.6% |
| Multidisciplinary Studies | 77 | 2.2% |
| Science & Technology | 298 | 8.6% |
| Business | 501 | 14.5% |
| Education | 871 | 25.3% |
| Literature & Languages | 57 | 1.7% |
| Liberal Arts & History | 150 | 4.3% |
| Visual & Performing Arts | 78 | 2.3% |
| Communications | 114 | 3.3% |
| Arts & Humanities | 204 | 5.9% |
| Total | 3,446 | 100.0% |
Transportation & Commute in Chillicothe
Vehicle Availability by Sex in Chillicothe
The most prevalent vehicle ownership categories in Chillicothe are males with 2 vehicles (2,035, accounting for 42.5%) and females with 2 vehicles (1,637, making up 49.5%).
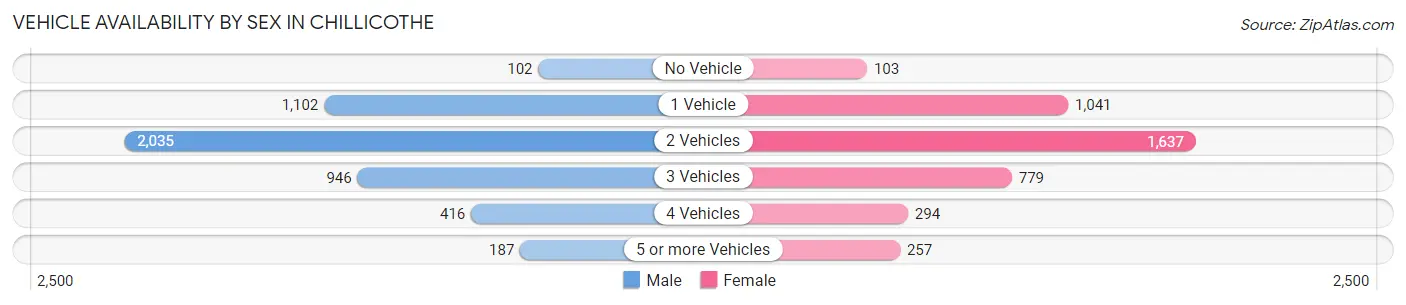
| Vehicles Available | Male | Female |
| No Vehicle | 102 (2.1%) | 103 (2.5%) |
| 1 Vehicle | 1,102 (23.0%) | 1,041 (25.3%) |
| 2 Vehicles | 2,035 (42.5%) | 1,637 (39.8%) |
| 3 Vehicles | 946 (19.8%) | 779 (19.0%) |
| 4 Vehicles | 416 (8.7%) | 294 (7.1%) |
| 5 or more Vehicles | 187 (3.9%) | 257 (6.2%) |
| Total | 4,788 (100.0%) | 4,111 (100.0%) |
Commute Time in Chillicothe
The most frequently occuring commute durations in Chillicothe are 10 to 14 minutes (2,239 commuters, 26.4%), 15 to 19 minutes (1,434 commuters, 16.9%), and 5 to 9 minutes (1,257 commuters, 14.8%).
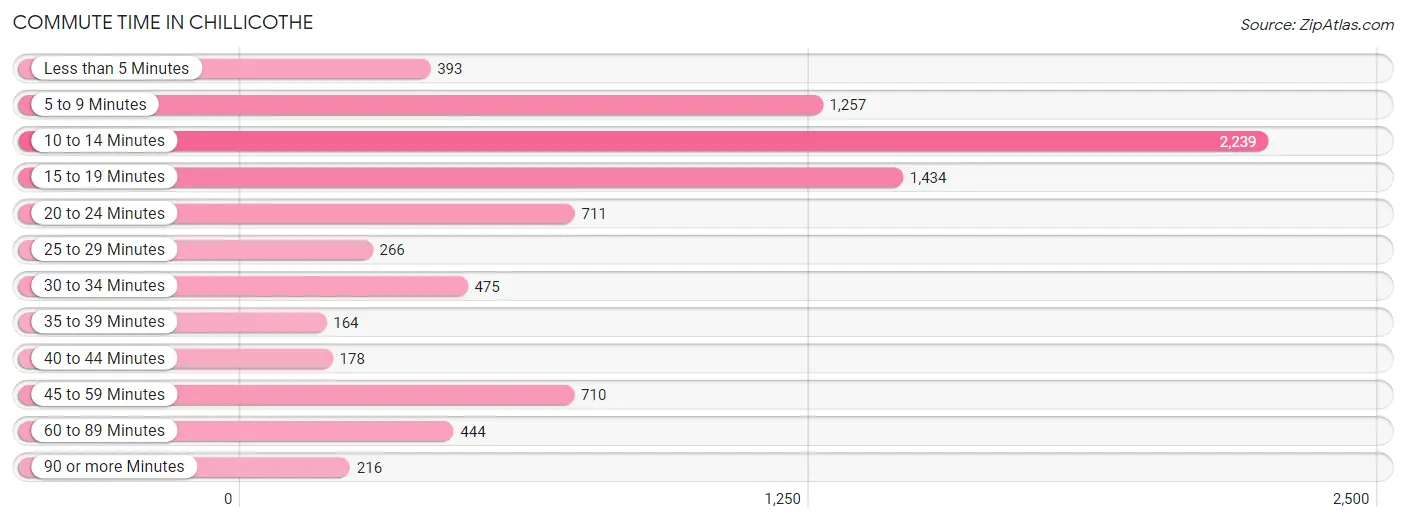
| Commute Time | # Commuters | % Commuters |
| Less than 5 Minutes | 393 | 4.6% |
| 5 to 9 Minutes | 1,257 | 14.8% |
| 10 to 14 Minutes | 2,239 | 26.4% |
| 15 to 19 Minutes | 1,434 | 16.9% |
| 20 to 24 Minutes | 711 | 8.4% |
| 25 to 29 Minutes | 266 | 3.1% |
| 30 to 34 Minutes | 475 | 5.6% |
| 35 to 39 Minutes | 164 | 1.9% |
| 40 to 44 Minutes | 178 | 2.1% |
| 45 to 59 Minutes | 710 | 8.4% |
| 60 to 89 Minutes | 444 | 5.2% |
| 90 or more Minutes | 216 | 2.5% |
Commute Time by Sex in Chillicothe
The most common commute times in Chillicothe are 10 to 14 minutes (1,211 commuters, 26.6%) for males and 10 to 14 minutes (1,028 commuters, 26.1%) for females.
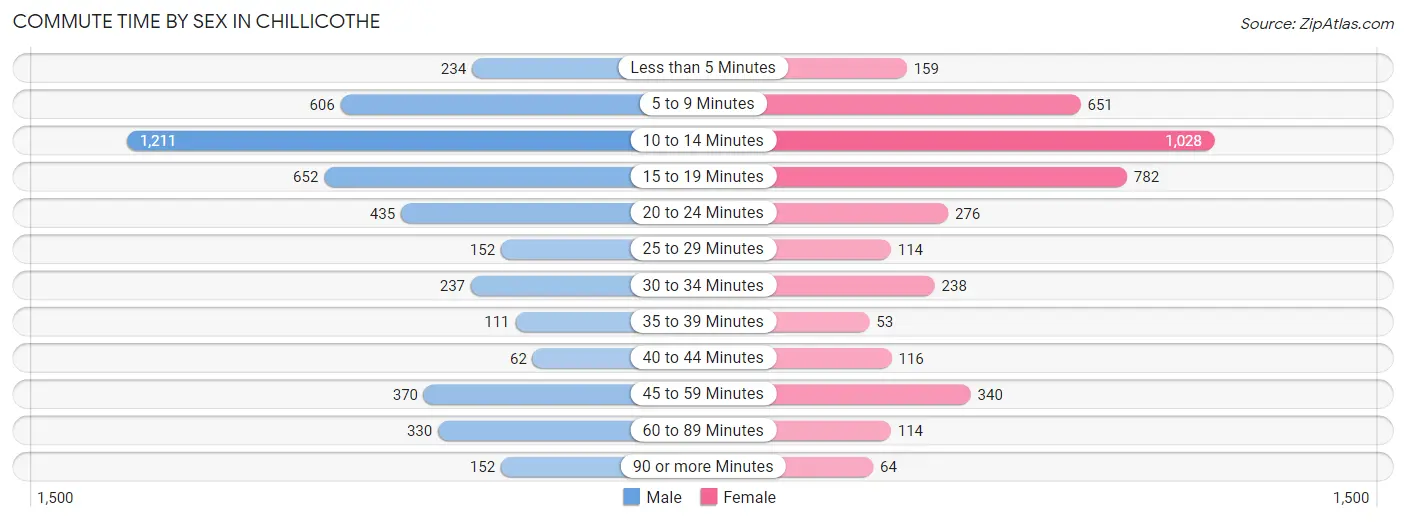
| Commute Time | Male | Female |
| Less than 5 Minutes | 234 (5.1%) | 159 (4.0%) |
| 5 to 9 Minutes | 606 (13.3%) | 651 (16.5%) |
| 10 to 14 Minutes | 1,211 (26.6%) | 1,028 (26.1%) |
| 15 to 19 Minutes | 652 (14.3%) | 782 (19.9%) |
| 20 to 24 Minutes | 435 (9.6%) | 276 (7.0%) |
| 25 to 29 Minutes | 152 (3.3%) | 114 (2.9%) |
| 30 to 34 Minutes | 237 (5.2%) | 238 (6.0%) |
| 35 to 39 Minutes | 111 (2.4%) | 53 (1.3%) |
| 40 to 44 Minutes | 62 (1.4%) | 116 (2.9%) |
| 45 to 59 Minutes | 370 (8.1%) | 340 (8.6%) |
| 60 to 89 Minutes | 330 (7.2%) | 114 (2.9%) |
| 90 or more Minutes | 152 (3.3%) | 64 (1.6%) |
Time of Departure to Work by Sex in Chillicothe
The most frequent times of departure to work in Chillicothe are 6:00 AM to 6:29 AM (703, 15.4%) for males and 7:30 AM to 7:59 AM (724, 18.4%) for females.
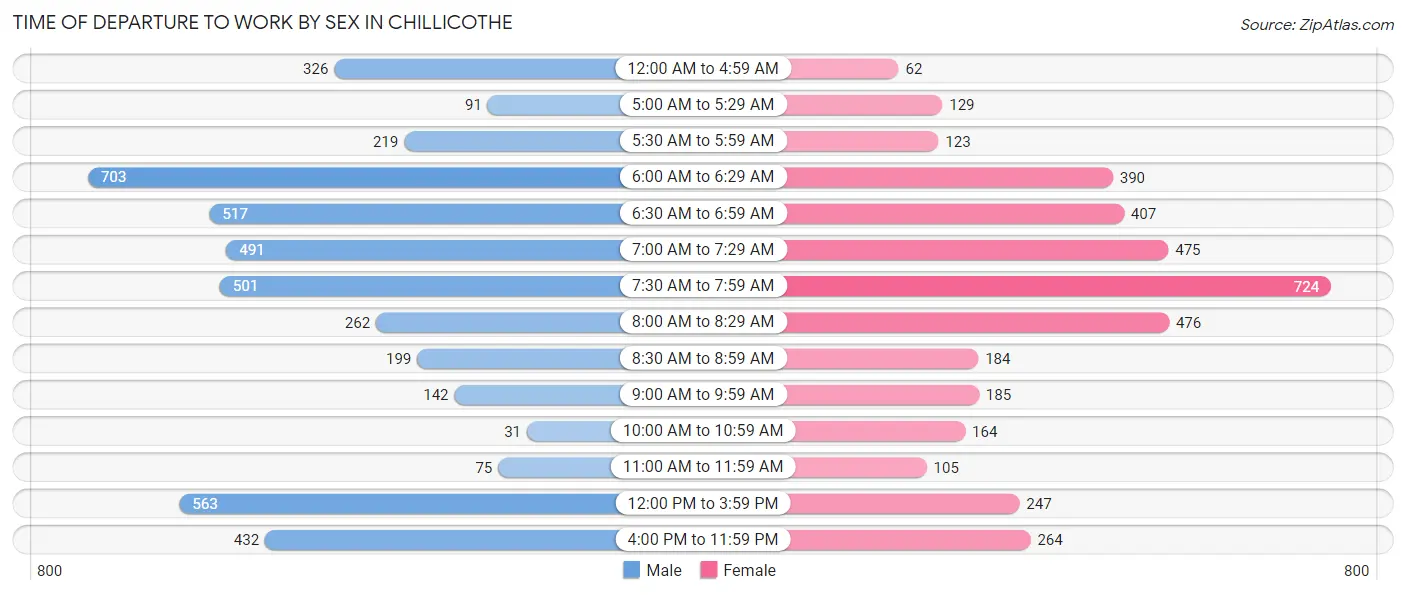
| Time of Departure | Male | Female |
| 12:00 AM to 4:59 AM | 326 (7.2%) | 62 (1.6%) |
| 5:00 AM to 5:29 AM | 91 (2.0%) | 129 (3.3%) |
| 5:30 AM to 5:59 AM | 219 (4.8%) | 123 (3.1%) |
| 6:00 AM to 6:29 AM | 703 (15.4%) | 390 (9.9%) |
| 6:30 AM to 6:59 AM | 517 (11.4%) | 407 (10.3%) |
| 7:00 AM to 7:29 AM | 491 (10.8%) | 475 (12.1%) |
| 7:30 AM to 7:59 AM | 501 (11.0%) | 724 (18.4%) |
| 8:00 AM to 8:29 AM | 262 (5.8%) | 476 (12.1%) |
| 8:30 AM to 8:59 AM | 199 (4.4%) | 184 (4.7%) |
| 9:00 AM to 9:59 AM | 142 (3.1%) | 185 (4.7%) |
| 10:00 AM to 10:59 AM | 31 (0.7%) | 164 (4.2%) |
| 11:00 AM to 11:59 AM | 75 (1.7%) | 105 (2.7%) |
| 12:00 PM to 3:59 PM | 563 (12.4%) | 247 (6.3%) |
| 4:00 PM to 11:59 PM | 432 (9.5%) | 264 (6.7%) |
| Total | 4,552 (100.0%) | 3,935 (100.0%) |
Housing Occupancy in Chillicothe
Occupancy by Ownership in Chillicothe
Of the total 9,679 dwellings in Chillicothe, owner-occupied units account for 5,815 (60.1%), while renter-occupied units make up 3,864 (39.9%).
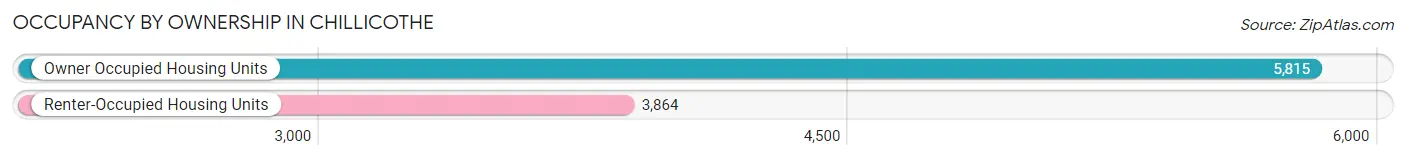
| Occupancy | # Housing Units | % Housing Units |
| Owner Occupied Housing Units | 5,815 | 60.1% |
| Renter-Occupied Housing Units | 3,864 | 39.9% |
| Total Occupied Housing Units | 9,679 | 100.0% |
Occupancy by Household Size in Chillicothe
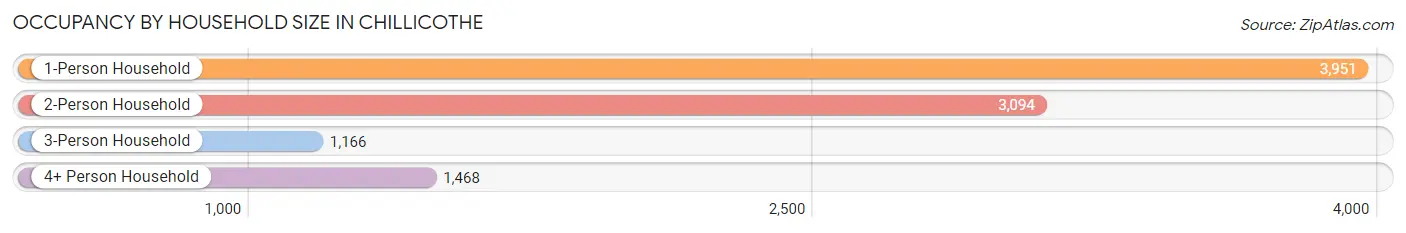
| Household Size | # Housing Units | % Housing Units |
| 1-Person Household | 3,951 | 40.8% |
| 2-Person Household | 3,094 | 32.0% |
| 3-Person Household | 1,166 | 12.0% |
| 4+ Person Household | 1,468 | 15.2% |
| Total Housing Units | 9,679 | 100.0% |
Occupancy by Ownership by Household Size in Chillicothe
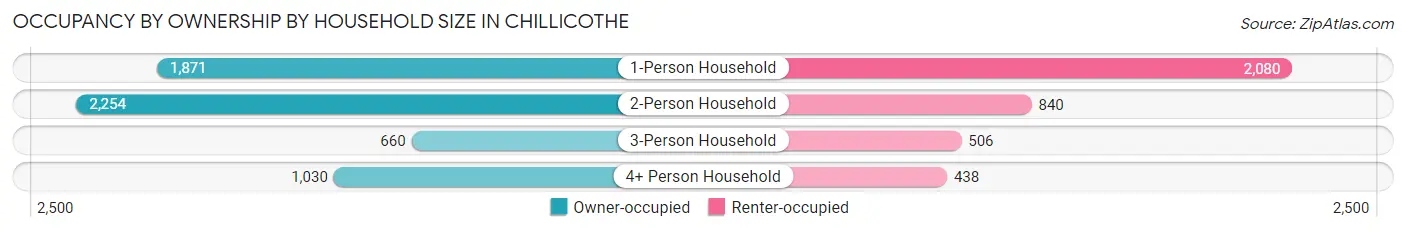
| Household Size | Owner-occupied | Renter-occupied |
| 1-Person Household | 1,871 (47.4%) | 2,080 (52.6%) |
| 2-Person Household | 2,254 (72.9%) | 840 (27.2%) |
| 3-Person Household | 660 (56.6%) | 506 (43.4%) |
| 4+ Person Household | 1,030 (70.2%) | 438 (29.8%) |
| Total Housing Units | 5,815 (60.1%) | 3,864 (39.9%) |
Occupancy by Educational Attainment in Chillicothe
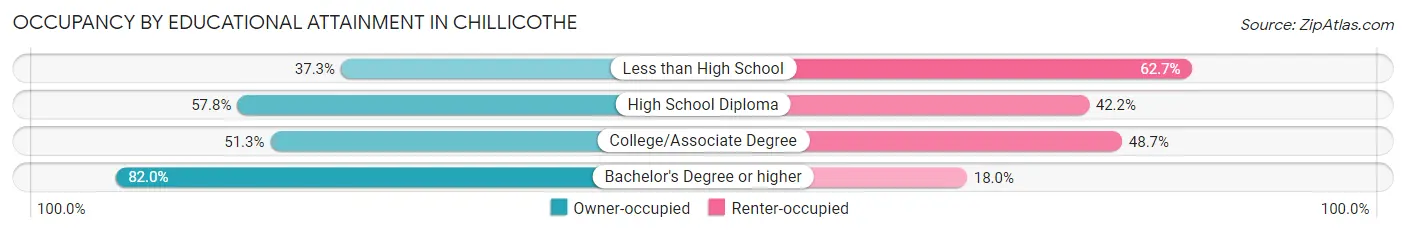
| Household Size | Owner-occupied | Renter-occupied |
| Less than High School | 232 (37.3%) | 390 (62.7%) |
| High School Diploma | 2,161 (57.8%) | 1,575 (42.2%) |
| College/Associate Degree | 1,573 (51.3%) | 1,494 (48.7%) |
| Bachelor's Degree or higher | 1,849 (82.0%) | 405 (18.0%) |
Occupancy by Age of Householder in Chillicothe
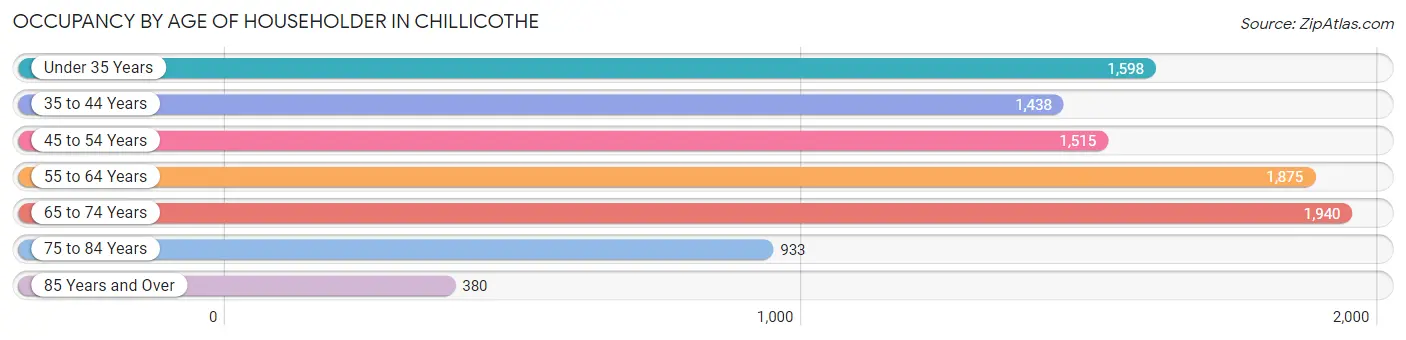
| Age Bracket | # Households | % Households |
| Under 35 Years | 1,598 | 16.5% |
| 35 to 44 Years | 1,438 | 14.9% |
| 45 to 54 Years | 1,515 | 15.7% |
| 55 to 64 Years | 1,875 | 19.4% |
| 65 to 74 Years | 1,940 | 20.0% |
| 75 to 84 Years | 933 | 9.6% |
| 85 Years and Over | 380 | 3.9% |
| Total | 9,679 | 100.0% |
Housing Finances in Chillicothe
Median Income by Occupancy in Chillicothe
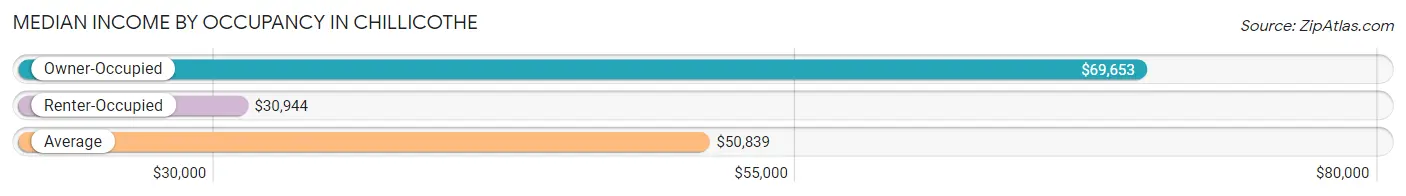
| Occupancy Type | # Households | Median Income |
| Owner-Occupied | 5,815 (60.1%) | $69,653 |
| Renter-Occupied | 3,864 (39.9%) | $30,944 |
| Average | 9,679 (100.0%) | $50,839 |
Occupancy by Householder Income Bracket in Chillicothe
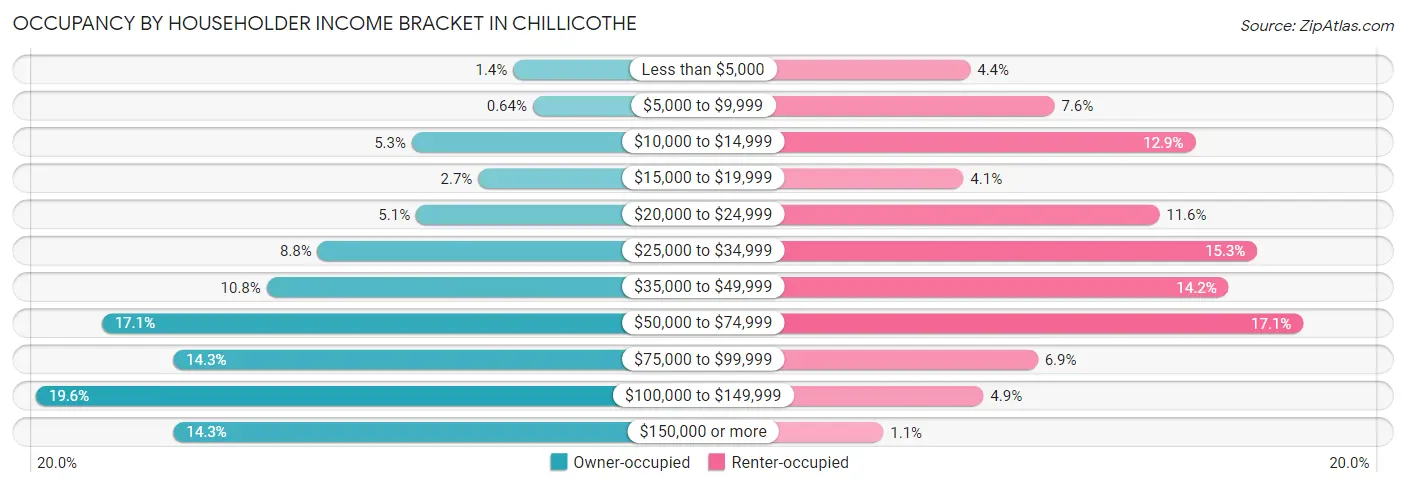
| Income Bracket | Owner-occupied | Renter-occupied |
| Less than $5,000 | 81 (1.4%) | 169 (4.4%) |
| $5,000 to $9,999 | 37 (0.6%) | 293 (7.6%) |
| $10,000 to $14,999 | 305 (5.2%) | 500 (12.9%) |
| $15,000 to $19,999 | 158 (2.7%) | 159 (4.1%) |
| $20,000 to $24,999 | 296 (5.1%) | 447 (11.6%) |
| $25,000 to $34,999 | 514 (8.8%) | 591 (15.3%) |
| $35,000 to $49,999 | 627 (10.8%) | 549 (14.2%) |
| $50,000 to $74,999 | 992 (17.1%) | 659 (17.1%) |
| $75,000 to $99,999 | 834 (14.3%) | 268 (6.9%) |
| $100,000 to $149,999 | 1,138 (19.6%) | 188 (4.9%) |
| $150,000 or more | 833 (14.3%) | 41 (1.1%) |
| Total | 5,815 (100.0%) | 3,864 (100.0%) |
Monthly Housing Cost Tiers in Chillicothe
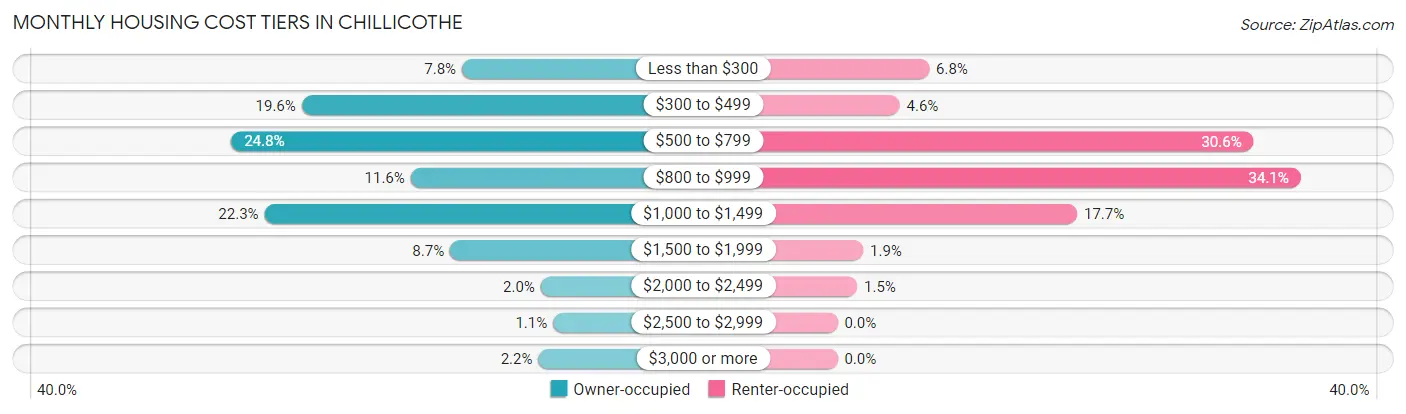
| Monthly Cost | Owner-occupied | Renter-occupied |
| Less than $300 | 453 (7.8%) | 261 (6.8%) |
| $300 to $499 | 1,140 (19.6%) | 177 (4.6%) |
| $500 to $799 | 1,441 (24.8%) | 1,184 (30.6%) |
| $800 to $999 | 673 (11.6%) | 1,318 (34.1%) |
| $1,000 to $1,499 | 1,299 (22.3%) | 682 (17.6%) |
| $1,500 to $1,999 | 504 (8.7%) | 73 (1.9%) |
| $2,000 to $2,499 | 116 (2.0%) | 56 (1.5%) |
| $2,500 to $2,999 | 63 (1.1%) | 0 (0.0%) |
| $3,000 or more | 126 (2.2%) | 0 (0.0%) |
| Total | 5,815 (100.0%) | 3,864 (100.0%) |
Physical Housing Characteristics in Chillicothe
Housing Structures in Chillicothe
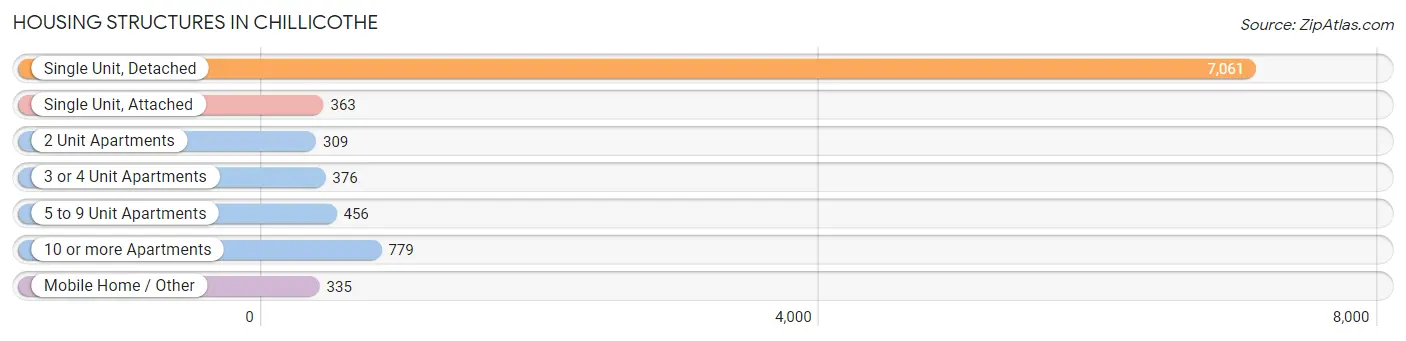
| Structure Type | # Housing Units | % Housing Units |
| Single Unit, Detached | 7,061 | 73.0% |
| Single Unit, Attached | 363 | 3.7% |
| 2 Unit Apartments | 309 | 3.2% |
| 3 or 4 Unit Apartments | 376 | 3.9% |
| 5 to 9 Unit Apartments | 456 | 4.7% |
| 10 or more Apartments | 779 | 8.1% |
| Mobile Home / Other | 335 | 3.5% |
| Total | 9,679 | 100.0% |
Housing Structures by Occupancy in Chillicothe
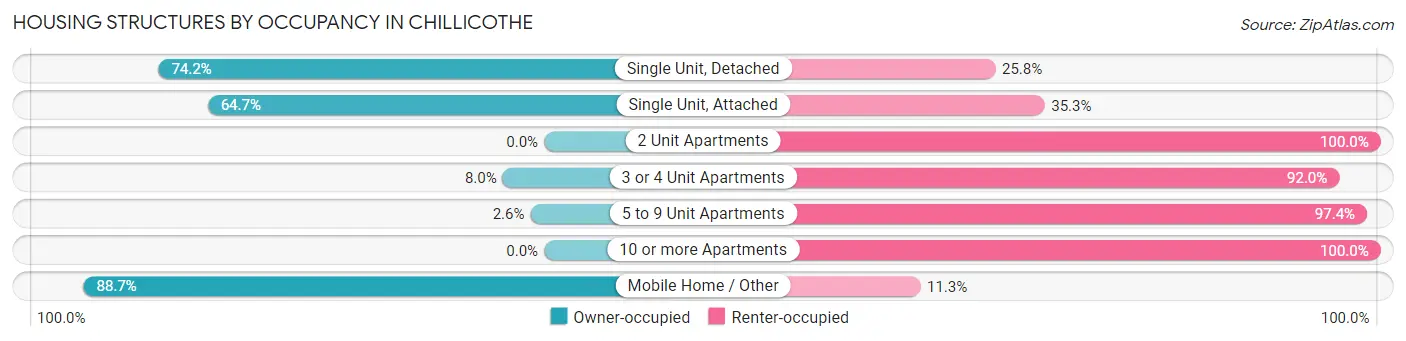
| Structure Type | Owner-occupied | Renter-occupied |
| Single Unit, Detached | 5,241 (74.2%) | 1,820 (25.8%) |
| Single Unit, Attached | 235 (64.7%) | 128 (35.3%) |
| 2 Unit Apartments | 0 (0.0%) | 309 (100.0%) |
| 3 or 4 Unit Apartments | 30 (8.0%) | 346 (92.0%) |
| 5 to 9 Unit Apartments | 12 (2.6%) | 444 (97.4%) |
| 10 or more Apartments | 0 (0.0%) | 779 (100.0%) |
| Mobile Home / Other | 297 (88.7%) | 38 (11.3%) |
| Total | 5,815 (60.1%) | 3,864 (39.9%) |
Housing Structures by Number of Rooms in Chillicothe
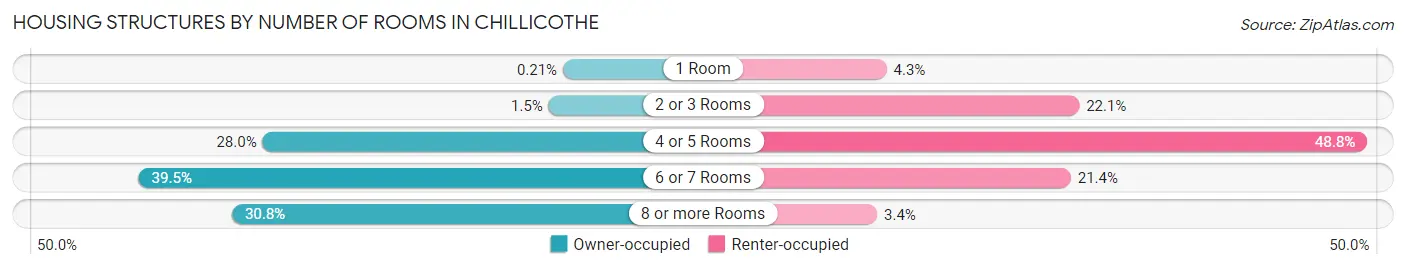
| Number of Rooms | Owner-occupied | Renter-occupied |
| 1 Room | 12 (0.2%) | 167 (4.3%) |
| 2 or 3 Rooms | 89 (1.5%) | 855 (22.1%) |
| 4 or 5 Rooms | 1,628 (28.0%) | 1,884 (48.8%) |
| 6 or 7 Rooms | 2,294 (39.5%) | 825 (21.3%) |
| 8 or more Rooms | 1,792 (30.8%) | 133 (3.4%) |
| Total | 5,815 (100.0%) | 3,864 (100.0%) |
Housing Structure by Heating Type in Chillicothe
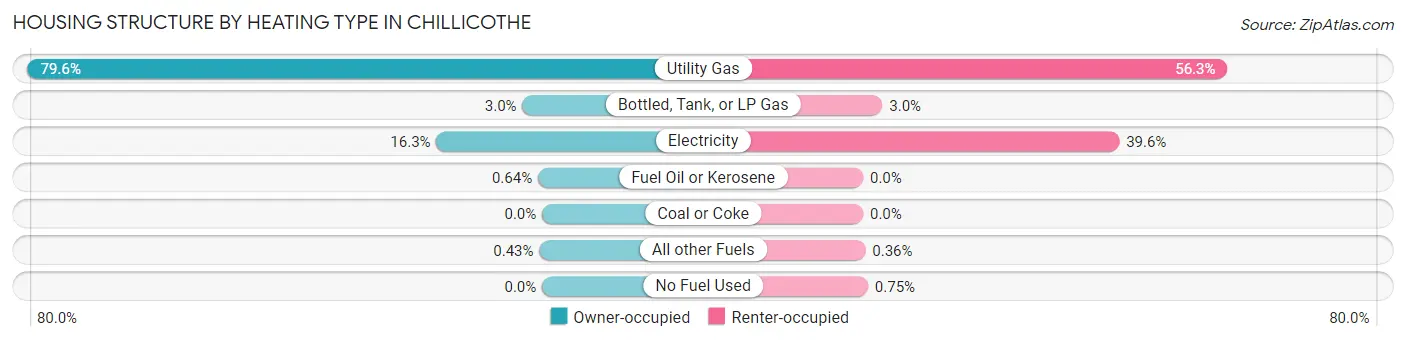
| Heating Type | Owner-occupied | Renter-occupied |
| Utility Gas | 4,626 (79.5%) | 2,176 (56.3%) |
| Bottled, Tank, or LP Gas | 177 (3.0%) | 115 (3.0%) |
| Electricity | 950 (16.3%) | 1,530 (39.6%) |
| Fuel Oil or Kerosene | 37 (0.6%) | 0 (0.0%) |
| Coal or Coke | 0 (0.0%) | 0 (0.0%) |
| All other Fuels | 25 (0.4%) | 14 (0.4%) |
| No Fuel Used | 0 (0.0%) | 29 (0.7%) |
| Total | 5,815 (100.0%) | 3,864 (100.0%) |
Household Vehicle Usage in Chillicothe
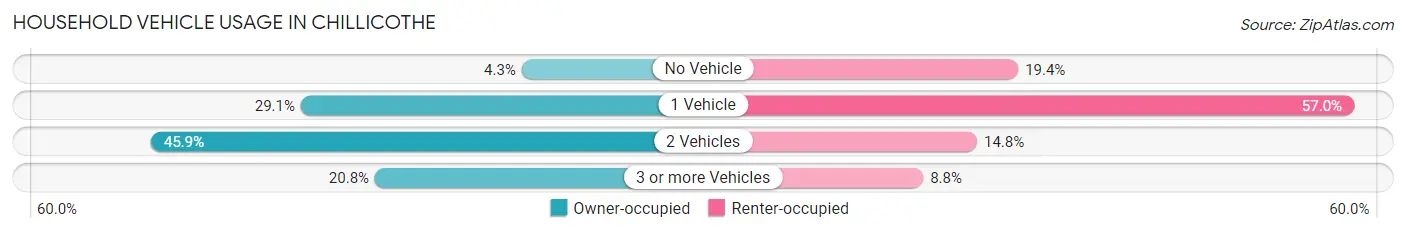
| Vehicles per Household | Owner-occupied | Renter-occupied |
| No Vehicle | 251 (4.3%) | 750 (19.4%) |
| 1 Vehicle | 1,690 (29.1%) | 2,203 (57.0%) |
| 2 Vehicles | 2,667 (45.9%) | 572 (14.8%) |
| 3 or more Vehicles | 1,207 (20.8%) | 339 (8.8%) |
| Total | 5,815 (100.0%) | 3,864 (100.0%) |
Real Estate & Mortgages in Chillicothe
Real Estate and Mortgage Overview in Chillicothe
| Characteristic | Without Mortgage | With Mortgage |
| Housing Units | 2,852 | 2,963 |
| Median Property Value | $130,800 | $151,400 |
| Median Household Income | $52,116 | $507 |
| Monthly Housing Costs | $480 | $126 |
| Real Estate Taxes | $1,784 | $34 |
Property Value by Mortgage Status in Chillicothe
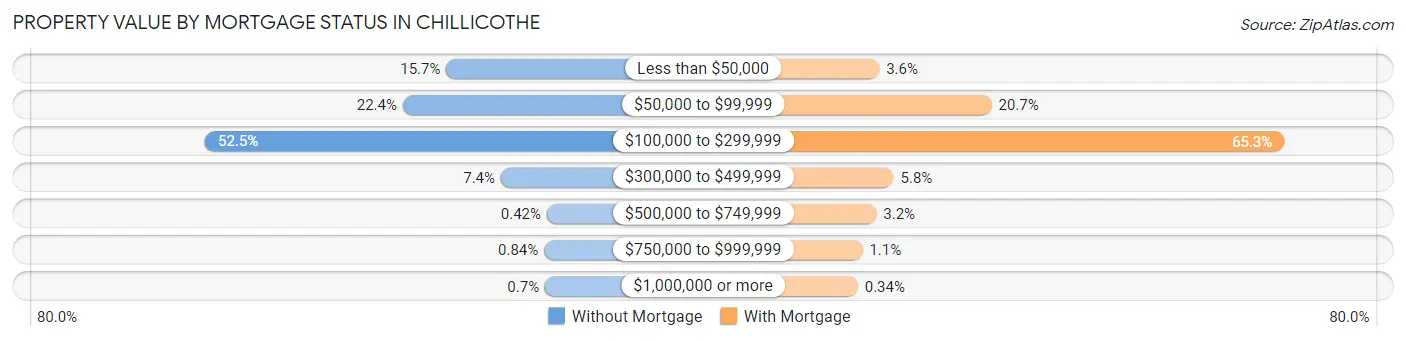
| Property Value | Without Mortgage | With Mortgage |
| Less than $50,000 | 449 (15.7%) | 107 (3.6%) |
| $50,000 to $99,999 | 638 (22.4%) | 614 (20.7%) |
| $100,000 to $299,999 | 1,497 (52.5%) | 1,935 (65.3%) |
| $300,000 to $499,999 | 212 (7.4%) | 172 (5.8%) |
| $500,000 to $749,999 | 12 (0.4%) | 94 (3.2%) |
| $750,000 to $999,999 | 24 (0.8%) | 31 (1.1%) |
| $1,000,000 or more | 20 (0.7%) | 10 (0.3%) |
| Total | 2,852 (100.0%) | 2,963 (100.0%) |
Household Income by Mortgage Status in Chillicothe
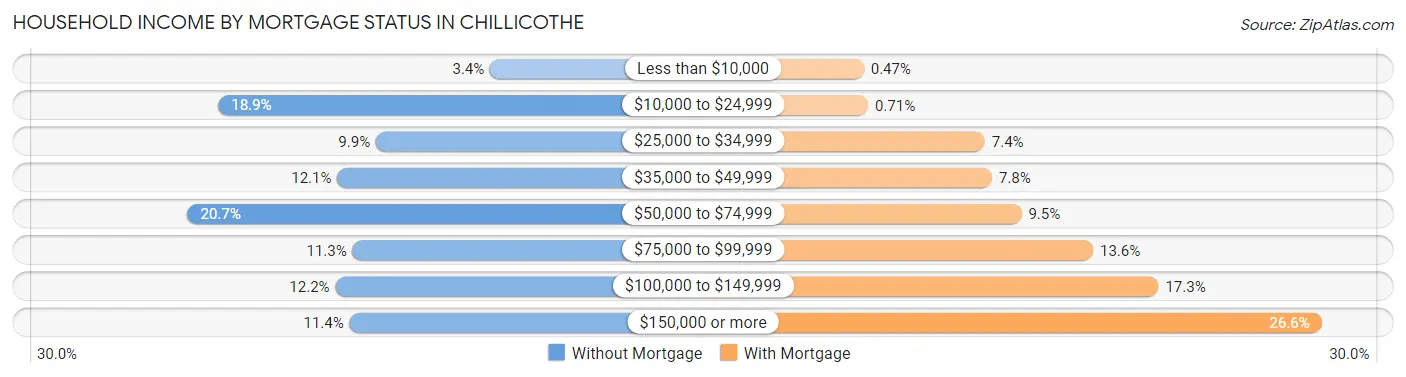
| Household Income | Without Mortgage | With Mortgage |
| Less than $10,000 | 97 (3.4%) | 14 (0.5%) |
| $10,000 to $24,999 | 540 (18.9%) | 21 (0.7%) |
| $25,000 to $34,999 | 283 (9.9%) | 219 (7.4%) |
| $35,000 to $49,999 | 346 (12.1%) | 231 (7.8%) |
| $50,000 to $74,999 | 590 (20.7%) | 281 (9.5%) |
| $75,000 to $99,999 | 321 (11.3%) | 402 (13.6%) |
| $100,000 to $149,999 | 349 (12.2%) | 513 (17.3%) |
| $150,000 or more | 326 (11.4%) | 789 (26.6%) |
| Total | 2,852 (100.0%) | 2,963 (100.0%) |
Property Value to Household Income Ratio in Chillicothe
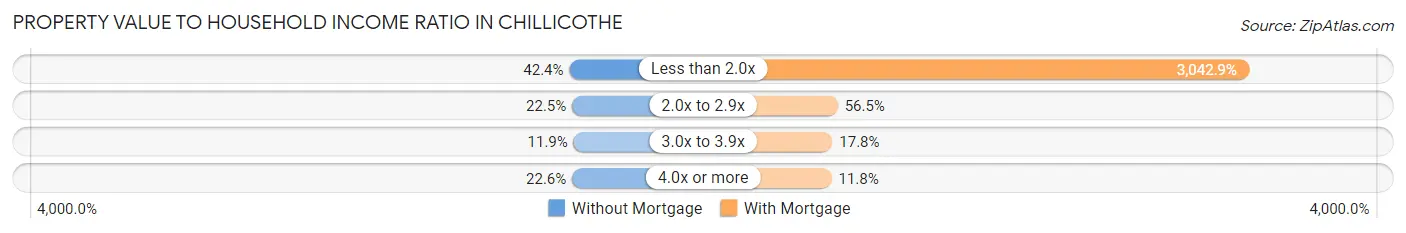
| Value-to-Income Ratio | Without Mortgage | With Mortgage |
| Less than 2.0x | 1,210 (42.4%) | 90,161 (3,042.9%) |
| 2.0x to 2.9x | 641 (22.5%) | 1,675 (56.5%) |
| 3.0x to 3.9x | 338 (11.8%) | 527 (17.8%) |
| 4.0x or more | 645 (22.6%) | 350 (11.8%) |
| Total | 2,852 (100.0%) | 2,963 (100.0%) |
Real Estate Taxes by Mortgage Status in Chillicothe
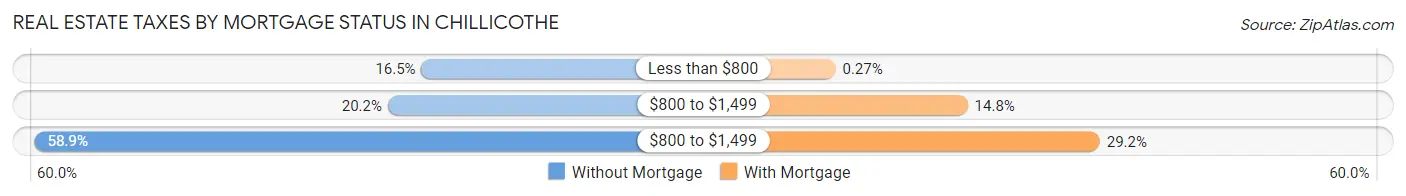
| Property Taxes | Without Mortgage | With Mortgage |
| Less than $800 | 471 (16.5%) | 8 (0.3%) |
| $800 to $1,499 | 576 (20.2%) | 437 (14.7%) |
| $800 to $1,499 | 1,680 (58.9%) | 866 (29.2%) |
| Total | 2,852 (100.0%) | 2,963 (100.0%) |
Health & Disability in Chillicothe
Health Insurance Coverage by Age in Chillicothe
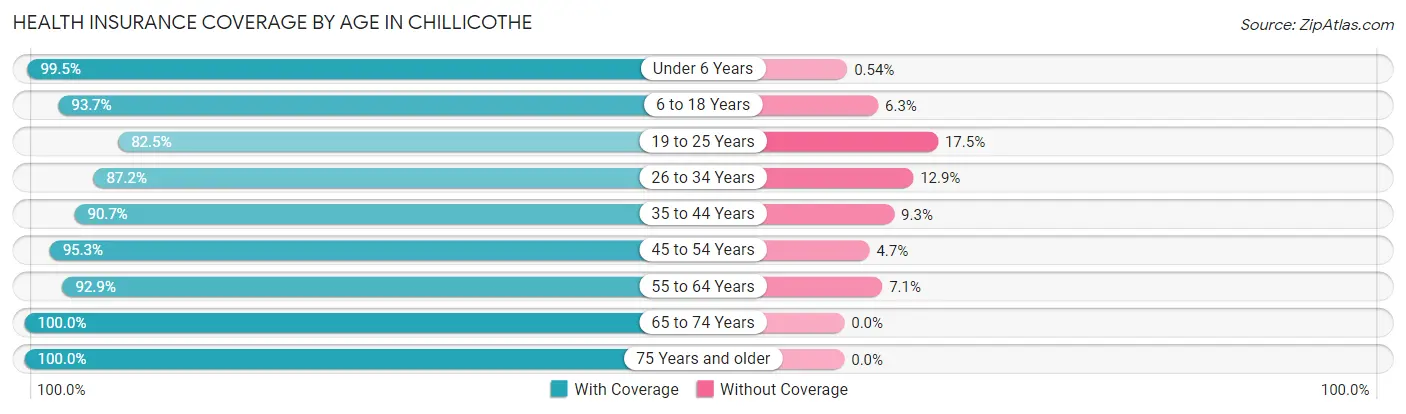
| Age Bracket | With Coverage | Without Coverage |
| Under 6 Years | 1,475 (99.5%) | 8 (0.5%) |
| 6 to 18 Years | 2,826 (93.7%) | 190 (6.3%) |
| 19 to 25 Years | 1,554 (82.5%) | 329 (17.5%) |
| 26 to 34 Years | 1,784 (87.2%) | 263 (12.9%) |
| 35 to 44 Years | 2,759 (90.7%) | 283 (9.3%) |
| 45 to 54 Years | 2,702 (95.3%) | 133 (4.7%) |
| 55 to 64 Years | 2,509 (92.9%) | 191 (7.1%) |
| 65 to 74 Years | 2,715 (100.0%) | 0 (0.0%) |
| 75 Years and older | 1,725 (100.0%) | 0 (0.0%) |
| Total | 20,049 (93.5%) | 1,397 (6.5%) |
Health Insurance Coverage by Citizenship Status in Chillicothe
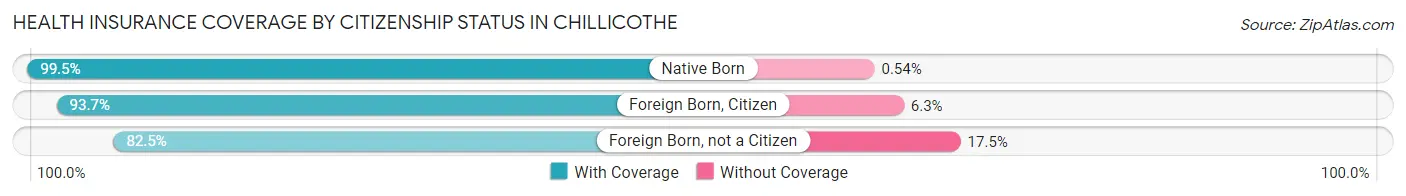
| Citizenship Status | With Coverage | Without Coverage |
| Native Born | 1,475 (99.5%) | 8 (0.5%) |
| Foreign Born, Citizen | 2,826 (93.7%) | 190 (6.3%) |
| Foreign Born, not a Citizen | 1,554 (82.5%) | 329 (17.5%) |
Health Insurance Coverage by Household Income in Chillicothe
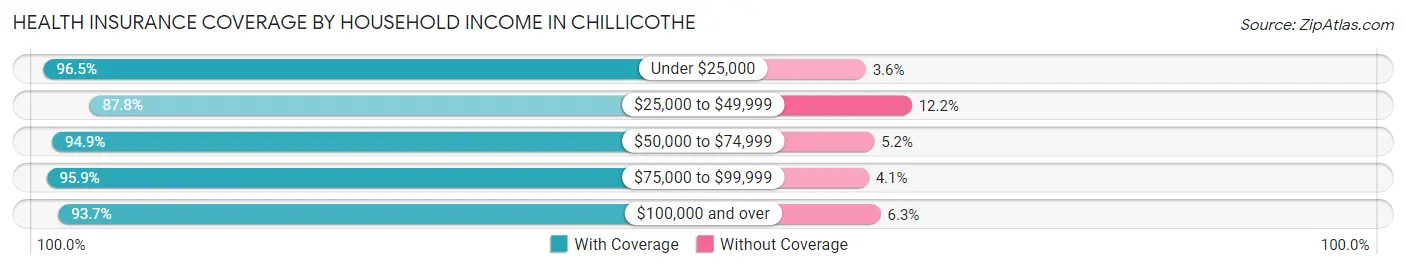
| Household Income | With Coverage | Without Coverage |
| Under $25,000 | 3,776 (96.5%) | 139 (3.5%) |
| $25,000 to $49,999 | 3,881 (87.8%) | 538 (12.2%) |
| $50,000 to $74,999 | 3,203 (94.9%) | 174 (5.1%) |
| $75,000 to $99,999 | 2,552 (95.9%) | 109 (4.1%) |
| $100,000 and over | 6,466 (93.7%) | 437 (6.3%) |
Public vs Private Health Insurance Coverage by Age in Chillicothe
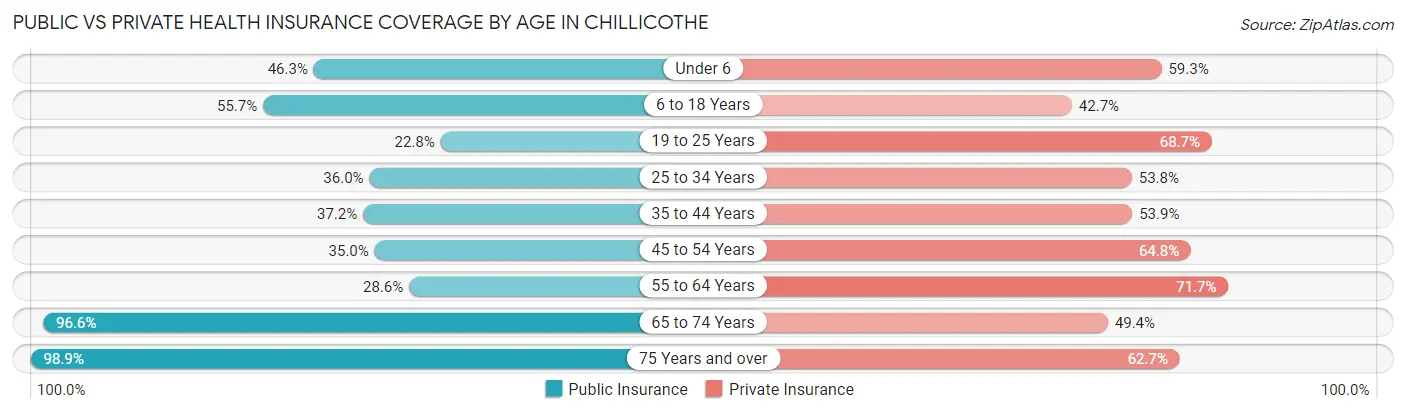
| Age Bracket | Public Insurance | Private Insurance |
| Under 6 | 687 (46.3%) | 880 (59.3%) |
| 6 to 18 Years | 1,681 (55.7%) | 1,288 (42.7%) |
| 19 to 25 Years | 429 (22.8%) | 1,293 (68.7%) |
| 25 to 34 Years | 737 (36.0%) | 1,102 (53.8%) |
| 35 to 44 Years | 1,131 (37.2%) | 1,640 (53.9%) |
| 45 to 54 Years | 993 (35.0%) | 1,838 (64.8%) |
| 55 to 64 Years | 773 (28.6%) | 1,937 (71.7%) |
| 65 to 74 Years | 2,622 (96.6%) | 1,341 (49.4%) |
| 75 Years and over | 1,706 (98.9%) | 1,082 (62.7%) |
| Total | 10,759 (50.2%) | 12,401 (57.8%) |
Disability Status by Sex by Age in Chillicothe
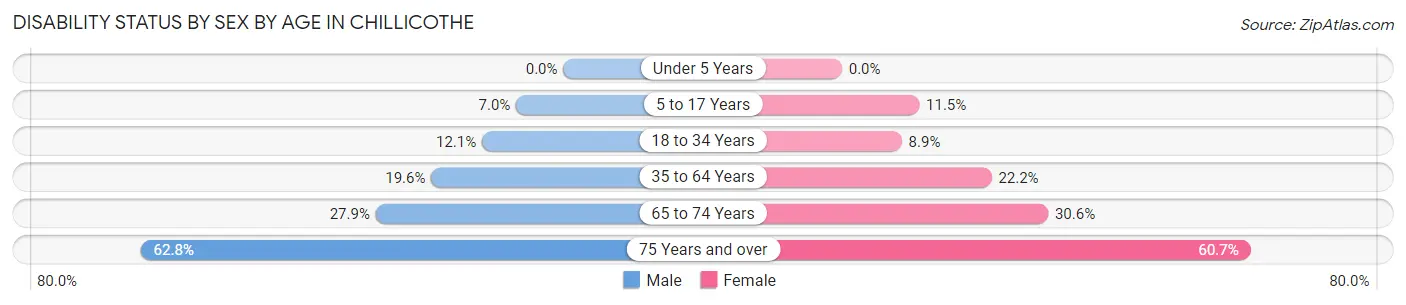
| Age Bracket | Male | Female |
| Under 5 Years | 0 (0.0%) | 0 (0.0%) |
| 5 to 17 Years | 115 (7.0%) | 150 (11.5%) |
| 18 to 34 Years | 238 (12.1%) | 193 (8.9%) |
| 35 to 64 Years | 831 (19.6%) | 964 (22.2%) |
| 65 to 74 Years | 297 (27.9%) | 505 (30.6%) |
| 75 Years and over | 396 (62.8%) | 664 (60.7%) |
Disability Class by Sex by Age in Chillicothe
Disability Class: Hearing Difficulty
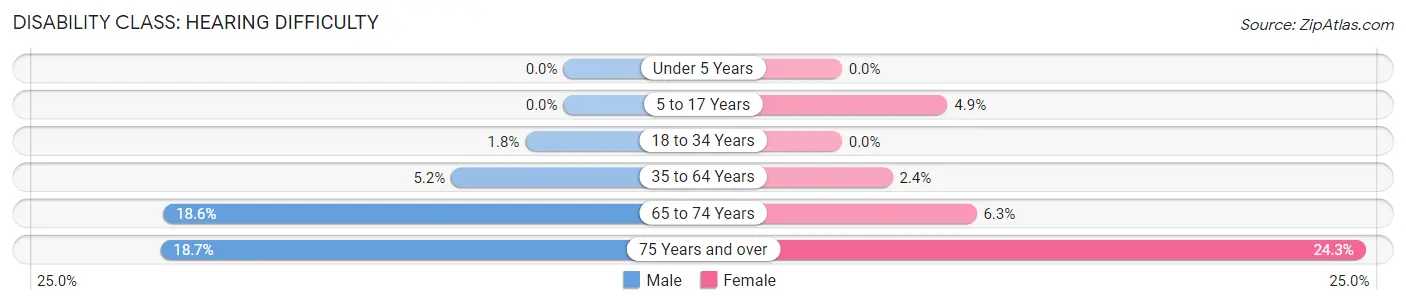
| Age Bracket | Male | Female |
| Under 5 Years | 0 (0.0%) | 0 (0.0%) |
| 5 to 17 Years | 0 (0.0%) | 64 (4.9%) |
| 18 to 34 Years | 35 (1.8%) | 0 (0.0%) |
| 35 to 64 Years | 221 (5.2%) | 102 (2.4%) |
| 65 to 74 Years | 198 (18.6%) | 103 (6.2%) |
| 75 Years and over | 118 (18.7%) | 266 (24.3%) |
Disability Class: Vision Difficulty
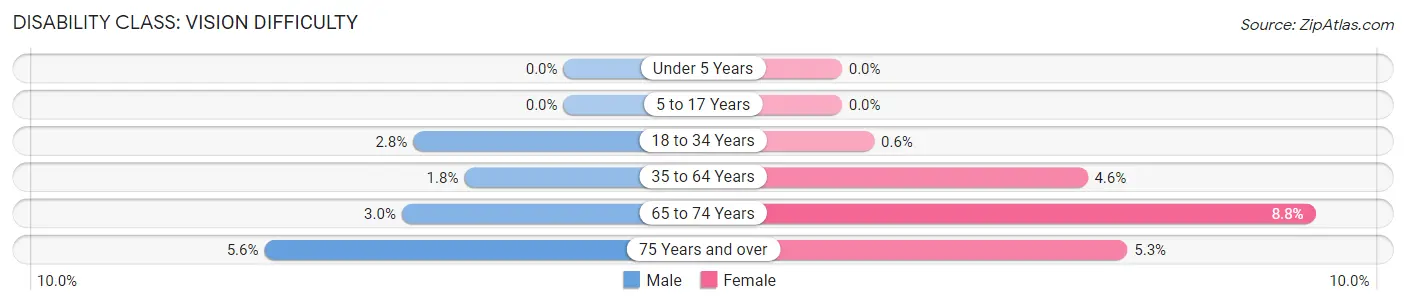
| Age Bracket | Male | Female |
| Under 5 Years | 0 (0.0%) | 0 (0.0%) |
| 5 to 17 Years | 0 (0.0%) | 0 (0.0%) |
| 18 to 34 Years | 55 (2.8%) | 13 (0.6%) |
| 35 to 64 Years | 78 (1.8%) | 198 (4.6%) |
| 65 to 74 Years | 32 (3.0%) | 145 (8.8%) |
| 75 Years and over | 35 (5.6%) | 58 (5.3%) |
Disability Class: Cognitive Difficulty
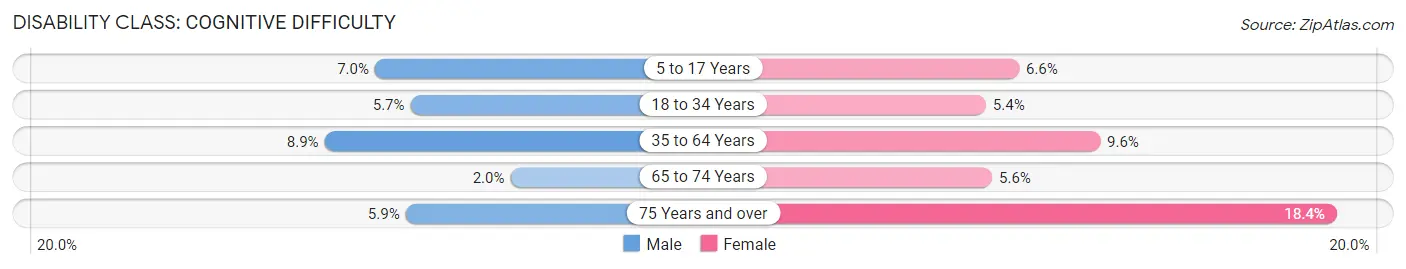
| Age Bracket | Male | Female |
| 5 to 17 Years | 115 (7.0%) | 86 (6.6%) |
| 18 to 34 Years | 112 (5.7%) | 116 (5.3%) |
| 35 to 64 Years | 376 (8.9%) | 416 (9.6%) |
| 65 to 74 Years | 21 (2.0%) | 92 (5.6%) |
| 75 Years and over | 37 (5.9%) | 201 (18.4%) |
Disability Class: Ambulatory Difficulty
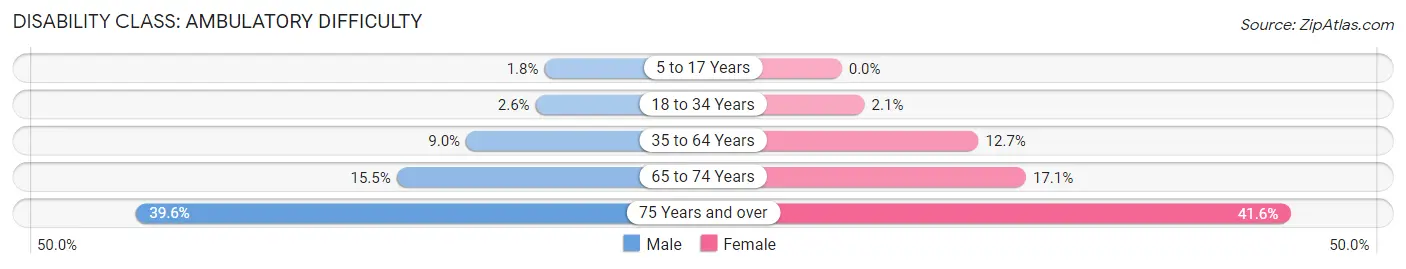
| Age Bracket | Male | Female |
| 5 to 17 Years | 29 (1.8%) | 0 (0.0%) |
| 18 to 34 Years | 51 (2.6%) | 46 (2.1%) |
| 35 to 64 Years | 383 (9.0%) | 551 (12.7%) |
| 65 to 74 Years | 165 (15.5%) | 282 (17.1%) |
| 75 Years and over | 250 (39.6%) | 455 (41.6%) |
Disability Class: Self-Care Difficulty
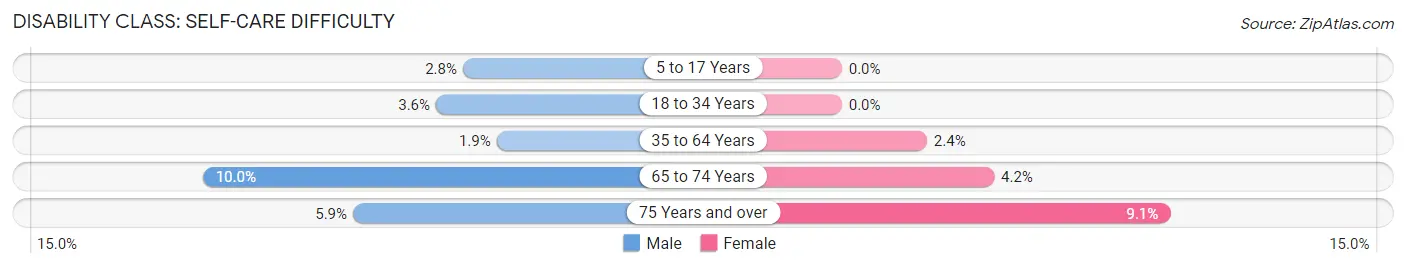
| Age Bracket | Male | Female |
| 5 to 17 Years | 46 (2.8%) | 0 (0.0%) |
| 18 to 34 Years | 70 (3.5%) | 0 (0.0%) |
| 35 to 64 Years | 79 (1.9%) | 103 (2.4%) |
| 65 to 74 Years | 107 (10.0%) | 70 (4.2%) |
| 75 Years and over | 37 (5.9%) | 100 (9.1%) |
Technology Access in Chillicothe
Computing Device Access in Chillicothe
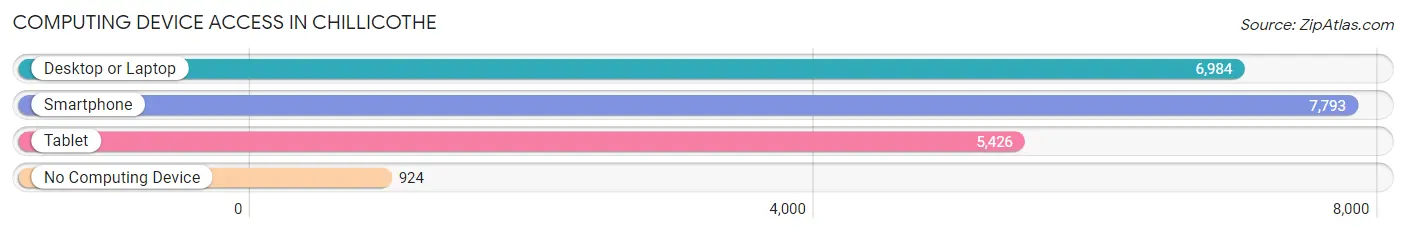
| Device Type | # Households | % Households |
| Desktop or Laptop | 6,984 | 72.2% |
| Smartphone | 7,793 | 80.5% |
| Tablet | 5,426 | 56.1% |
| No Computing Device | 924 | 9.6% |
| Total | 9,679 | 100.0% |
Internet Access in Chillicothe
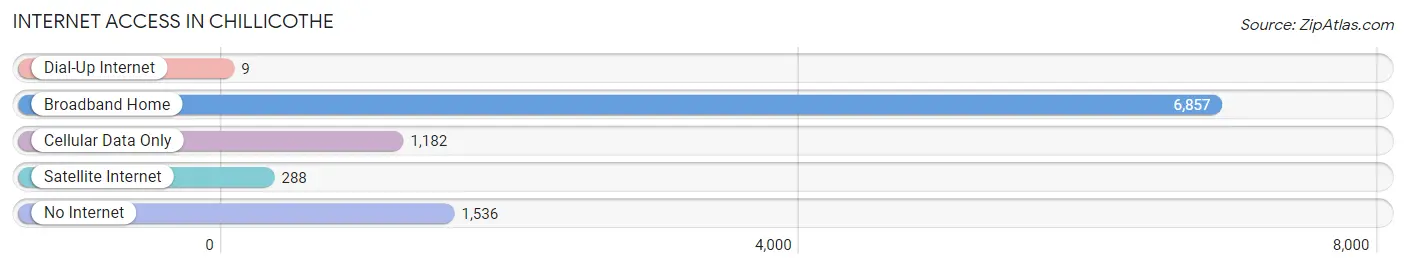
| Internet Type | # Households | % Households |
| Dial-Up Internet | 9 | 0.1% |
| Broadband Home | 6,857 | 70.8% |
| Cellular Data Only | 1,182 | 12.2% |
| Satellite Internet | 288 | 3.0% |
| No Internet | 1,536 | 15.9% |
| Total | 9,679 | 100.0% |
Chillicothe Summary
Chillicothe, Ohio is a city located in Ross County, Ohio, United States. It is the county seat of Ross County and the center of the Chillicothe Micropolitan Statistical Area (MSA). The population was estimated to be 21,901 in 2019.
History
Chillicothe was founded in 1796 by a group of settlers from Kentucky led by Nathaniel Massie. The town was named after the Shawnee Indian Chief, Chillicothe, who had a village nearby. The town was laid out in a grid pattern and was the first capital of the Northwest Territory. It was also the first capital of the state of Ohio from 1803 to 1810.
The town was an important stop on the Underground Railroad, and was home to many abolitionists. During the Civil War, Chillicothe was a major supply center for the Union Army.
Geography
Chillicothe is located in the Scioto River Valley in southern Ohio. It is situated at the confluence of the Scioto and Ohio Rivers. The city is located about 50 miles south of Columbus and about 60 miles north of Cincinnati.
The city has a total area of 8.3 square miles, of which 8.2 square miles is land and 0.1 square miles is water. The city is located in the Appalachian Plateau region of Ohio.
Economy
Chillicothe's economy is largely based on manufacturing and services. The city is home to several large manufacturing companies, including Adena Corporation, a manufacturer of medical equipment, and the Chillicothe Baking Company, a producer of baked goods.
The city is also home to several large retail stores, including Walmart, Target, and Kohl's. The city is also home to several restaurants, including Bob Evans, Applebee's, and Olive Garden.
Demographics
As of the 2010 census, the population of Chillicothe was 21,901. The racial makeup of the city was 90.2% White, 6.2% African American, 0.3% Native American, 0.7% Asian, 0.1% Pacific Islander, 0.7% from other races, and 1.9% from two or more races. Hispanic or Latino of any race were 2.2% of the population.
The median income for a household in the city was $31,945, and the median income for a family was $41,945. The per capita income for the city was $17,945. About 17.2% of families and 20.3% of the population were below the poverty line, including 28.3% of those under age 18 and 11.2% of those age 65 or over.
Common Questions
What is Per Capita Income in Chillicothe?
Per Capita income in Chillicothe is $34,323.
What is the Median Family Income in Chillicothe?
Median Family Income in Chillicothe is $71,554.
What is the Median Household income in Chillicothe?
Median Household Income in Chillicothe is $50,839.
What is Income or Wage Gap in Chillicothe?
Income or Wage Gap in Chillicothe is 34.1%.
Women in Chillicothe earn 65.9 cents for every dollar earned by a man.
What is Inequality or Gini Index in Chillicothe?
Inequality or Gini Index in Chillicothe is 0.49.
What is the Total Population of Chillicothe?
Total Population of Chillicothe is 22,002.
What is the Total Male Population of Chillicothe?
Total Male Population of Chillicothe is 10,549.
What is the Total Female Population of Chillicothe?
Total Female Population of Chillicothe is 11,453.
What is the Ratio of Males per 100 Females in Chillicothe?
There are 92.11 Males per 100 Females in Chillicothe.
What is the Ratio of Females per 100 Males in Chillicothe?
There are 108.57 Females per 100 Males in Chillicothe.
What is the Median Population Age in Chillicothe?
Median Population Age in Chillicothe is 43.0 Years.
What is the Average Family Size in Chillicothe
Average Family Size in Chillicothe is 3.0 People.
What is the Average Household Size in Chillicothe
Average Household Size in Chillicothe is 2.2 People.
How Large is the Labor Force in Chillicothe?
There are 10,066 People in the Labor Forcein in Chillicothe.
What is the Percentage of People in the Labor Force in Chillicothe?
55.7% of People are in the Labor Force in Chillicothe.
What is the Unemployment Rate in Chillicothe?
Unemployment Rate in Chillicothe is 7.5%.