Centerburg, OH Map & Demographics
Centerburg Map
Centerburg Overview
$32,381
PER CAPITA INCOME
$86,771
AVG FAMILY INCOME
$62,794
AVG HOUSEHOLD INCOME
39.7%
WAGE / INCOME GAP [ % ]
60.3¢/ $1
WAGE / INCOME GAP [ $ ]
0.43
INEQUALITY / GINI INDEX
1,875
TOTAL POPULATION
1,058
MALE POPULATION
817
FEMALE POPULATION
129.50
MALES / 100 FEMALES
77.22
FEMALES / 100 MALES
41.6
MEDIAN AGE
3.1
AVG FAMILY SIZE
2.5
AVG HOUSEHOLD SIZE
821
LABOR FORCE [ PEOPLE ]
56.8%
PERCENT IN LABOR FORCE
2.7%
UNEMPLOYMENT RATE
Centerburg Zip Codes
Centerburg Area Codes
Income in Centerburg
Income Overview in Centerburg
Per Capita Income in Centerburg is $32,381, while median incomes of families and households are $86,771 and $62,794 respectively.
| Characteristic | Number | Measure |
| Per Capita Income | 1,875 | $32,381 |
| Median Family Income | 475 | $86,771 |
| Mean Family Income | 475 | $95,427 |
| Median Household Income | 714 | $62,794 |
| Mean Household Income | 714 | $78,993 |
| Income Deficit | 475 | $0 |
| Wage / Income Gap (%) | 1,875 | 39.73% |
| Wage / Income Gap ($) | 1,875 | 60.27¢ per $1 |
| Gini / Inequality Index | 1,875 | 0.43 |
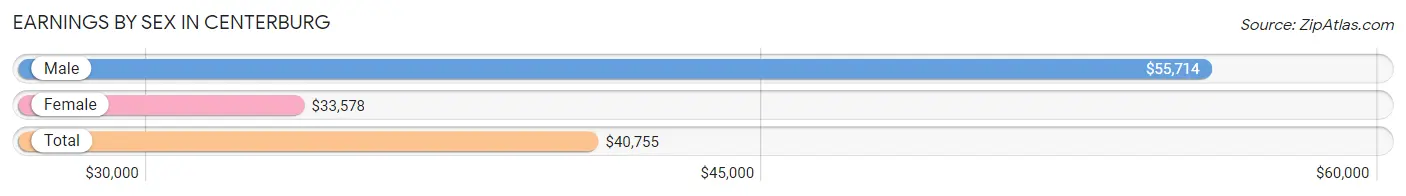
Earnings by Sex in Centerburg
Average Earnings in Centerburg are $40,755, $55,714 for men and $33,578 for women, a difference of 39.7%.
| Sex | Number | Average Earnings |
| Male | 514 (58.8%) | $55,714 |
| Female | 360 (41.2%) | $33,578 |
| Total | 874 (100.0%) | $40,755 |
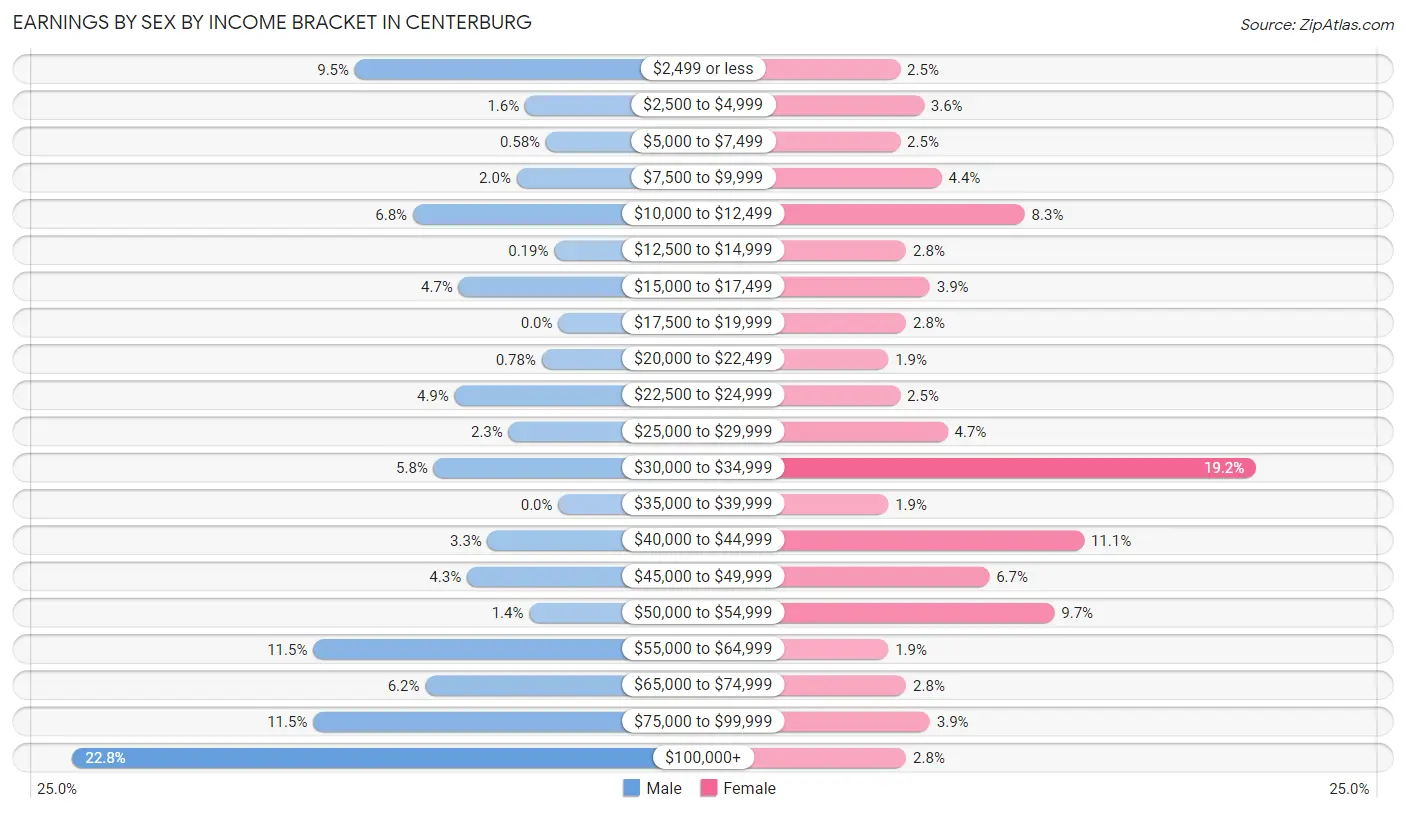
Earnings by Sex by Income Bracket in Centerburg
The most common earnings brackets in Centerburg are $100,000+ for men (117 | 22.8%) and $30,000 to $34,999 for women (69 | 19.2%).
| Income | Male | Female |
| $2,499 or less | 49 (9.5%) | 9 (2.5%) |
| $2,500 to $4,999 | 8 (1.6%) | 13 (3.6%) |
| $5,000 to $7,499 | 3 (0.6%) | 9 (2.5%) |
| $7,500 to $9,999 | 10 (1.9%) | 16 (4.4%) |
| $10,000 to $12,499 | 35 (6.8%) | 30 (8.3%) |
| $12,500 to $14,999 | 1 (0.2%) | 10 (2.8%) |
| $15,000 to $17,499 | 24 (4.7%) | 14 (3.9%) |
| $17,500 to $19,999 | 0 (0.0%) | 10 (2.8%) |
| $20,000 to $22,499 | 4 (0.8%) | 7 (1.9%) |
| $22,500 to $24,999 | 25 (4.9%) | 9 (2.5%) |
| $25,000 to $29,999 | 12 (2.3%) | 17 (4.7%) |
| $30,000 to $34,999 | 30 (5.8%) | 69 (19.2%) |
| $35,000 to $39,999 | 0 (0.0%) | 7 (1.9%) |
| $40,000 to $44,999 | 17 (3.3%) | 40 (11.1%) |
| $45,000 to $49,999 | 22 (4.3%) | 24 (6.7%) |
| $50,000 to $54,999 | 7 (1.4%) | 35 (9.7%) |
| $55,000 to $64,999 | 59 (11.5%) | 7 (1.9%) |
| $65,000 to $74,999 | 32 (6.2%) | 10 (2.8%) |
| $75,000 to $99,999 | 59 (11.5%) | 14 (3.9%) |
| $100,000+ | 117 (22.8%) | 10 (2.8%) |
| Total | 514 (100.0%) | 360 (100.0%) |
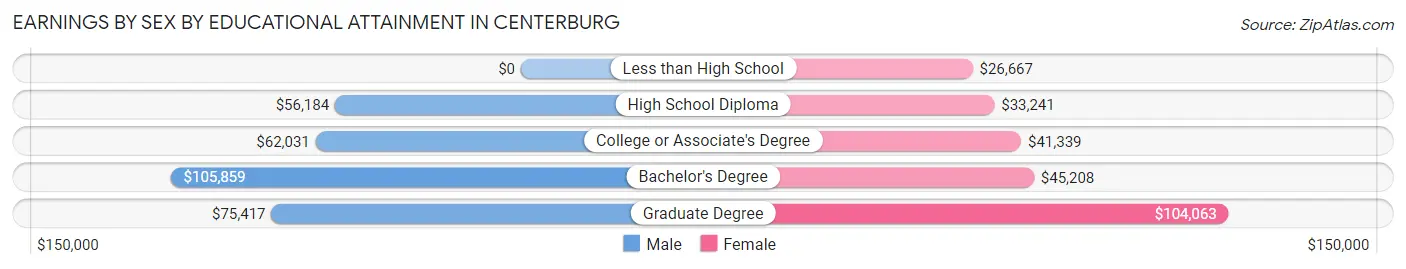
Earnings by Sex by Educational Attainment in Centerburg
Average earnings in Centerburg are $61,875 for men and $33,879 for women, a difference of 45.3%. Men with an educational attainment of bachelor's degree enjoy the highest average annual earnings of $105,859, while those with high school diploma education earn the least with $56,184. Women with an educational attainment of graduate degree earn the most with the average annual earnings of $104,063, while those with less than high school education have the smallest earnings of $26,667.
| Educational Attainment | Male Income | Female Income |
| Less than High School | - | - |
| High School Diploma | $56,184 | $33,241 |
| College or Associate's Degree | $62,031 | $41,339 |
| Bachelor's Degree | $105,859 | $45,208 |
| Graduate Degree | $75,417 | $104,063 |
| Total | $61,875 | $33,879 |
Family Income in Centerburg
Family Income Brackets in Centerburg
According to the Centerburg family income data, there are 131 families falling into the $100,000 to $149,999 income range, which is the most common income bracket and makes up 27.6% of all families. Conversely, the $10,000 to $14,999 income bracket is the least frequent group with only 6 families (1.3%) belonging to this category.
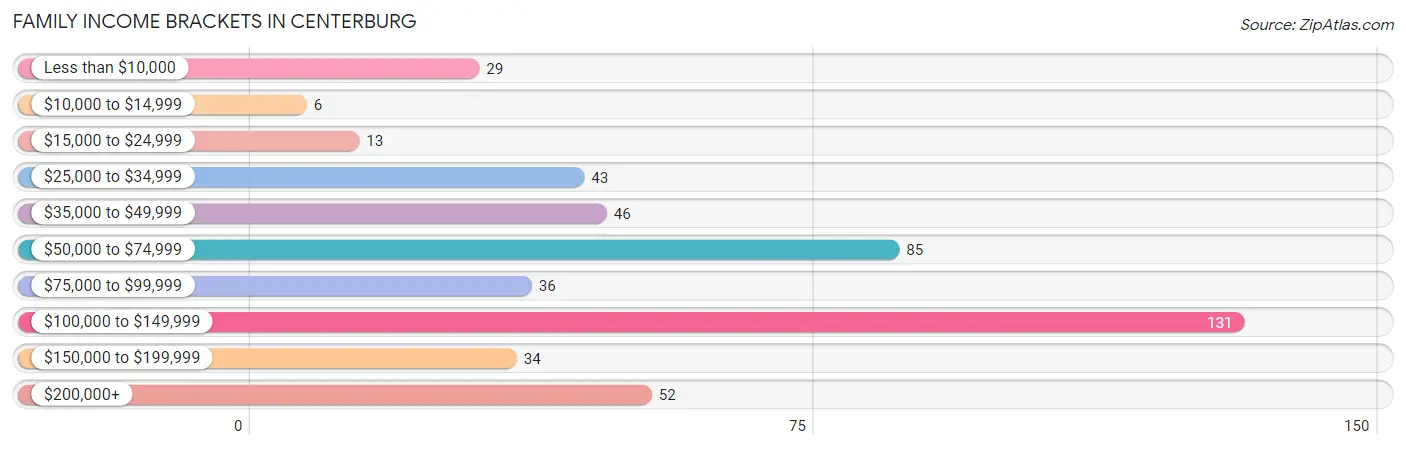
| Income Bracket | # Families | % Families |
| Less than $10,000 | 29 | 6.1% |
| $10,000 to $14,999 | 6 | 1.3% |
| $15,000 to $24,999 | 13 | 2.7% |
| $25,000 to $34,999 | 43 | 9.1% |
| $35,000 to $49,999 | 46 | 9.7% |
| $50,000 to $74,999 | 85 | 17.9% |
| $75,000 to $99,999 | 36 | 7.6% |
| $100,000 to $149,999 | 131 | 27.6% |
| $150,000 to $199,999 | 34 | 7.2% |
| $200,000+ | 52 | 10.9% |
Family Income by Famaliy Size in Centerburg
4-person families (124 | 26.1%) account for the highest median family income in Centerburg with $108,194 per family, while 3-person families (95 | 20.0%) have the highest median income of $30,625 per family member.
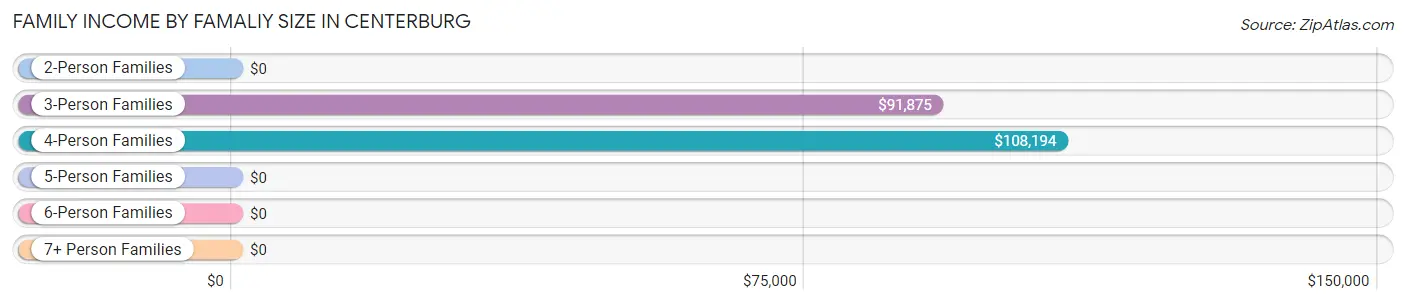
| Income Bracket | # Families | Median Income |
| 2-Person Families | 226 (47.6%) | $0 |
| 3-Person Families | 95 (20.0%) | $91,875 |
| 4-Person Families | 124 (26.1%) | $108,194 |
| 5-Person Families | 19 (4.0%) | $0 |
| 6-Person Families | 8 (1.7%) | $0 |
| 7+ Person Families | 3 (0.6%) | $0 |
| Total | 475 (100.0%) | $86,771 |
Family Income by Number of Earners in Centerburg
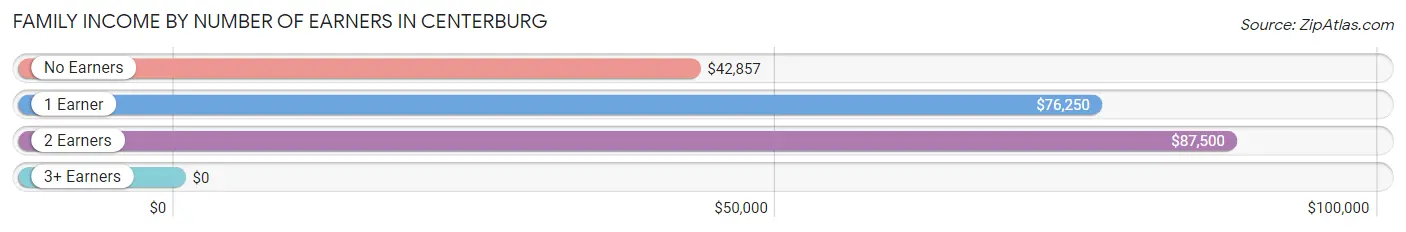
| Number of Earners | # Families | Median Income |
| No Earners | 98 (20.6%) | $42,857 |
| 1 Earner | 146 (30.7%) | $76,250 |
| 2 Earners | 180 (37.9%) | $87,500 |
| 3+ Earners | 51 (10.7%) | $0 |
| Total | 475 (100.0%) | $86,771 |
Household Income in Centerburg
Household Income Brackets in Centerburg
With 170 households falling in the category, the $100,000 to $149,999 income range is the most frequent in Centerburg, accounting for 23.8% of all households. In contrast, only 32 households (4.5%) fall into the less than $10,000 income bracket, making it the least populous group.
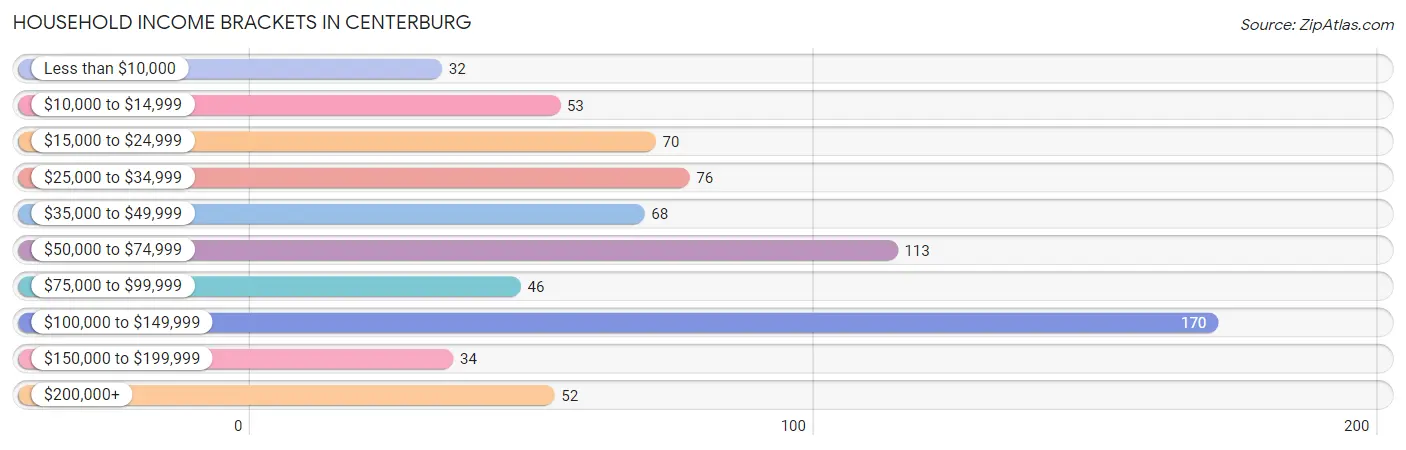
| Income Bracket | # Households | % Households |
| Less than $10,000 | 32 | 4.5% |
| $10,000 to $14,999 | 53 | 7.4% |
| $15,000 to $24,999 | 70 | 9.8% |
| $25,000 to $34,999 | 76 | 10.6% |
| $35,000 to $49,999 | 68 | 9.5% |
| $50,000 to $74,999 | 113 | 15.8% |
| $75,000 to $99,999 | 46 | 6.4% |
| $100,000 to $149,999 | 170 | 23.8% |
| $150,000 to $199,999 | 34 | 4.8% |
| $200,000+ | 52 | 7.3% |
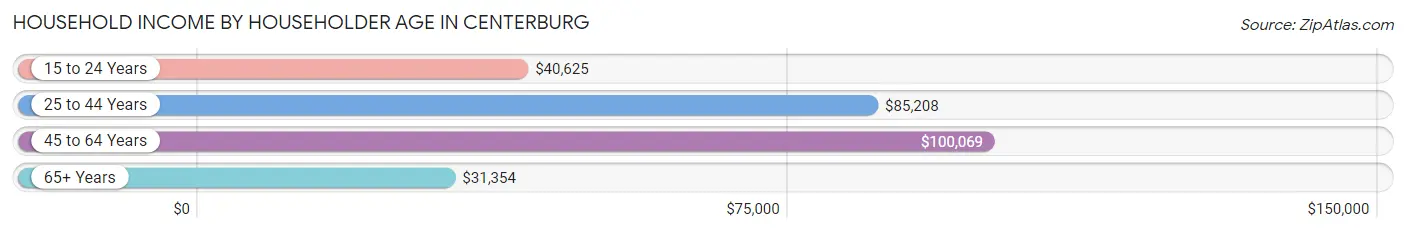
Household Income by Householder Age in Centerburg
The median household income in Centerburg is $62,794, with the highest median household income of $100,069 found in the 45 to 64 years age bracket for the primary householder. A total of 279 households (39.1%) fall into this category. Meanwhile, the 65+ years age bracket for the primary householder has the lowest median household income of $31,354, with 225 households (31.5%) in this group.
| Income Bracket | # Households | Median Income |
| 15 to 24 Years | 20 (2.8%) | $40,625 |
| 25 to 44 Years | 190 (26.6%) | $85,208 |
| 45 to 64 Years | 279 (39.1%) | $100,069 |
| 65+ Years | 225 (31.5%) | $31,354 |
| Total | 714 (100.0%) | $62,794 |
Poverty in Centerburg
Income Below Poverty by Sex and Age in Centerburg
With 9.6% poverty level for males and 13.0% for females among the residents of Centerburg, 55 to 64 year old males and under 5 year old females are the most vulnerable to poverty, with 26 males (24.8%) and 24 females (50.0%) in their respective age groups living below the poverty level.
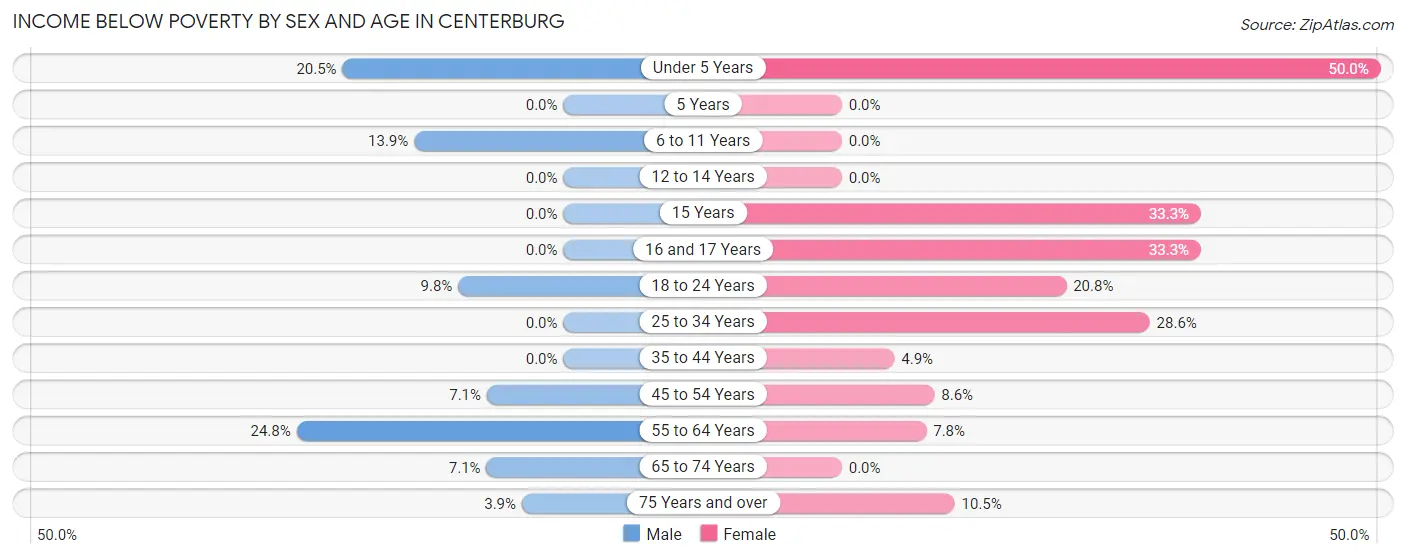
| Age Bracket | Male | Female |
| Under 5 Years | 33 (20.5%) | 24 (50.0%) |
| 5 Years | 0 (0.0%) | 0 (0.0%) |
| 6 to 11 Years | 9 (13.9%) | 0 (0.0%) |
| 12 to 14 Years | 0 (0.0%) | 0 (0.0%) |
| 15 Years | 0 (0.0%) | 2 (33.3%) |
| 16 and 17 Years | 0 (0.0%) | 5 (33.3%) |
| 18 to 24 Years | 8 (9.8%) | 10 (20.8%) |
| 25 to 34 Years | 0 (0.0%) | 32 (28.6%) |
| 35 to 44 Years | 0 (0.0%) | 4 (4.9%) |
| 45 to 54 Years | 11 (7.1%) | 11 (8.6%) |
| 55 to 64 Years | 26 (24.8%) | 4 (7.8%) |
| 65 to 74 Years | 4 (7.1%) | 0 (0.0%) |
| 75 Years and over | 3 (3.8%) | 9 (10.5%) |
| Total | 94 (9.6%) | 101 (13.0%) |
Income Above Poverty by Sex and Age in Centerburg
According to the poverty statistics in Centerburg, males aged 5 years and females aged 6 to 11 years are the age groups that are most secure financially, with 100.0% of males and 100.0% of females in these age groups living above the poverty line.
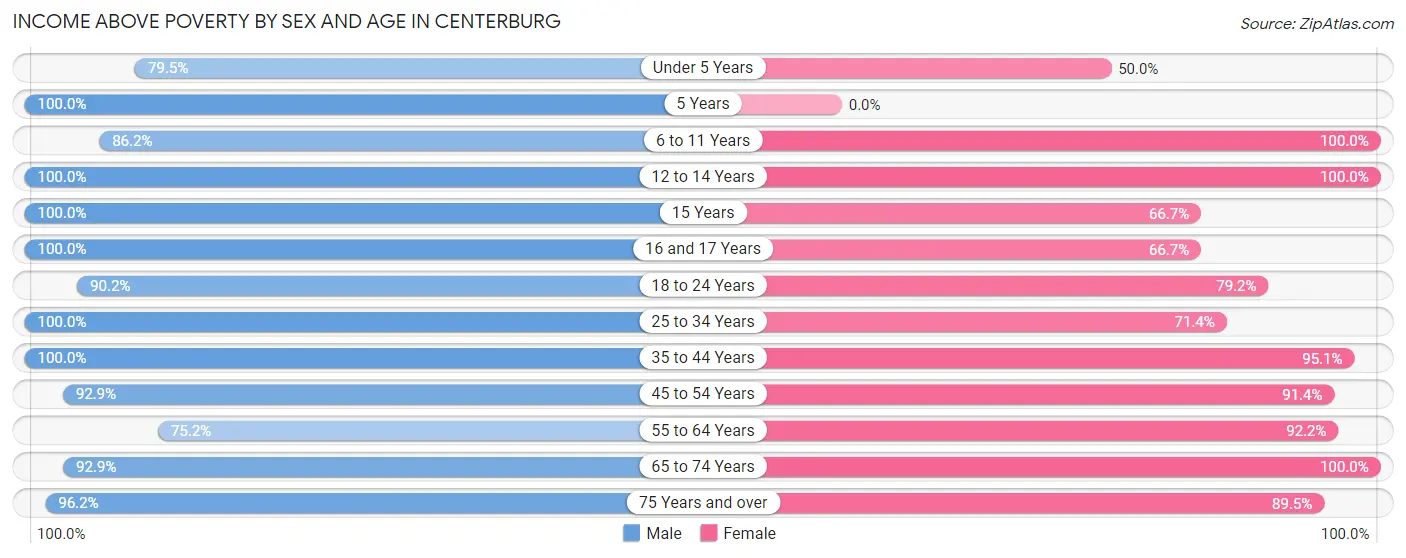
| Age Bracket | Male | Female |
| Under 5 Years | 128 (79.5%) | 24 (50.0%) |
| 5 Years | 8 (100.0%) | 0 (0.0%) |
| 6 to 11 Years | 56 (86.2%) | 73 (100.0%) |
| 12 to 14 Years | 39 (100.0%) | 20 (100.0%) |
| 15 Years | 10 (100.0%) | 4 (66.7%) |
| 16 and 17 Years | 30 (100.0%) | 10 (66.7%) |
| 18 to 24 Years | 74 (90.2%) | 38 (79.2%) |
| 25 to 34 Years | 94 (100.0%) | 80 (71.4%) |
| 35 to 44 Years | 92 (100.0%) | 78 (95.1%) |
| 45 to 54 Years | 144 (92.9%) | 117 (91.4%) |
| 55 to 64 Years | 79 (75.2%) | 47 (92.2%) |
| 65 to 74 Years | 52 (92.9%) | 110 (100.0%) |
| 75 Years and over | 75 (96.2%) | 77 (89.5%) |
| Total | 881 (90.4%) | 678 (87.0%) |
Income Below Poverty Among Married-Couple Families in Centerburg
The poverty statistics for married-couple families in Centerburg show that 1.7% or 6 of the total 358 families live below the poverty line. Families with 1 or 2 children have the highest poverty rate of 3.9%, comprising of 6 families. On the other hand, families with no children have the lowest poverty rate of 0.0%, which includes 0 families.
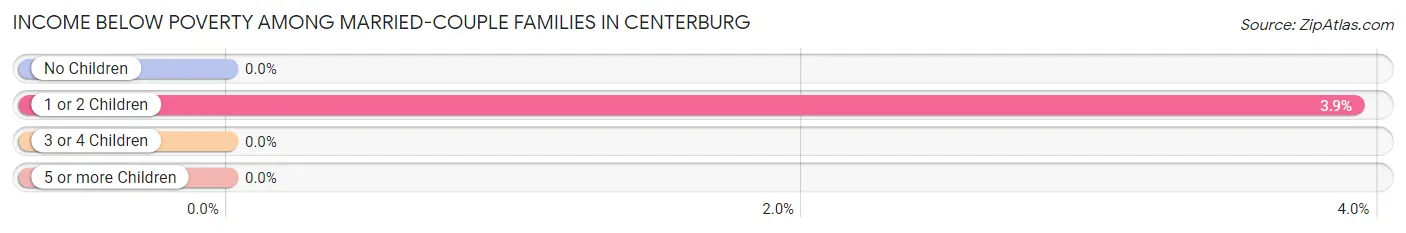
| Children | Above Poverty | Below Poverty |
| No Children | 175 (100.0%) | 0 (0.0%) |
| 1 or 2 Children | 147 (96.1%) | 6 (3.9%) |
| 3 or 4 Children | 27 (100.0%) | 0 (0.0%) |
| 5 or more Children | 3 (100.0%) | 0 (0.0%) |
| Total | 352 (98.3%) | 6 (1.7%) |
Income Below Poverty Among Single-Parent Households in Centerburg
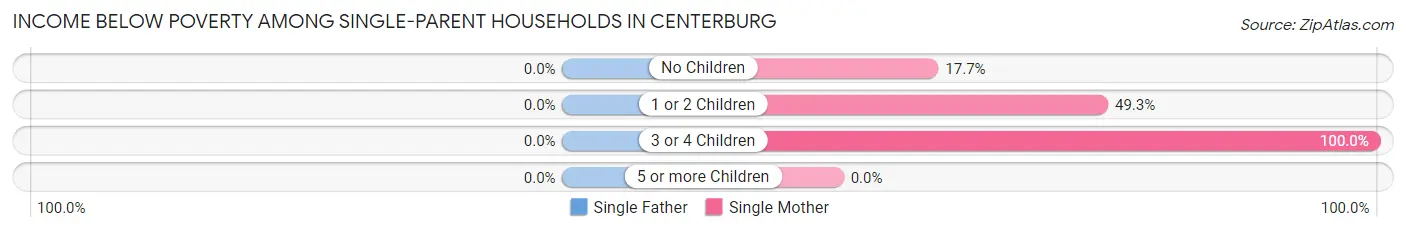
| Children | Single Father | Single Mother |
| No Children | 0 (0.0%) | 3 (17.6%) |
| 1 or 2 Children | 0 (0.0%) | 33 (49.2%) |
| 3 or 4 Children | 0 (0.0%) | 4 (100.0%) |
| 5 or more Children | 0 (0.0%) | 0 (0.0%) |
| Total | 0 (0.0%) | 40 (45.5%) |
Income Below Poverty Among Married-Couple vs Single-Parent Households in Centerburg
The poverty data for Centerburg shows that 6 of the married-couple family households (1.7%) and 40 of the single-parent households (34.2%) are living below the poverty level. Within the married-couple family households, those with 1 or 2 children have the highest poverty rate, with 6 households (3.9%) falling below the poverty line. Among the single-parent households, those with 3 or 4 children have the highest poverty rate, with 4 household (100.0%) living below poverty.
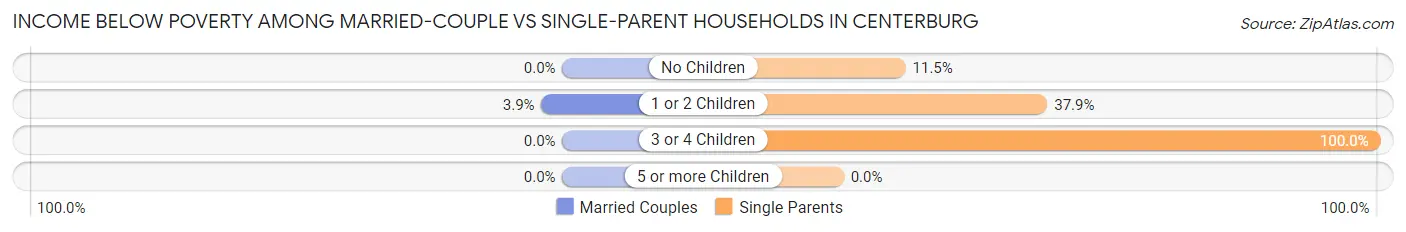
| Children | Married-Couple Families | Single-Parent Households |
| No Children | 0 (0.0%) | 3 (11.5%) |
| 1 or 2 Children | 6 (3.9%) | 33 (37.9%) |
| 3 or 4 Children | 0 (0.0%) | 4 (100.0%) |
| 5 or more Children | 0 (0.0%) | 0 (0.0%) |
| Total | 6 (1.7%) | 40 (34.2%) |
Race in Centerburg
The most populous races in Centerburg are White / Caucasian (1,819 | 97.0%), Two or more Races (38 | 2.0%), and Hispanic or Latino (37 | 2.0%).
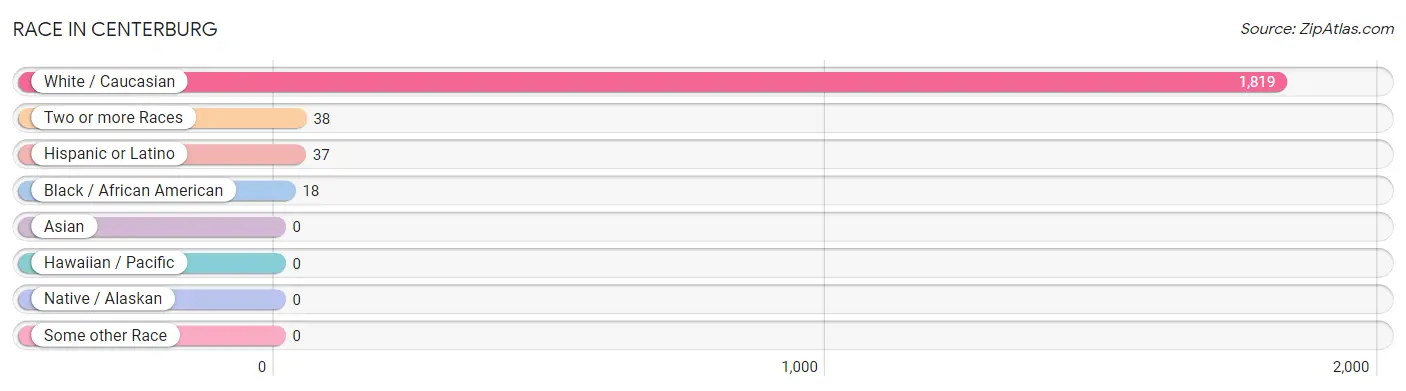
| Race | # Population | % Population |
| Asian | 0 | 0.0% |
| Black / African American | 18 | 1.0% |
| Hawaiian / Pacific | 0 | 0.0% |
| Hispanic or Latino | 37 | 2.0% |
| Native / Alaskan | 0 | 0.0% |
| White / Caucasian | 1,819 | 97.0% |
| Two or more Races | 38 | 2.0% |
| Some other Race | 0 | 0.0% |
| Total | 1,875 | 100.0% |
Ancestry in Centerburg
The most populous ancestries reported in Centerburg are German (443 | 23.6%), Irish (288 | 15.4%), English (262 | 14.0%), American (99 | 5.3%), and Italian (95 | 5.1%), together accounting for 63.3% of all Centerburg residents.
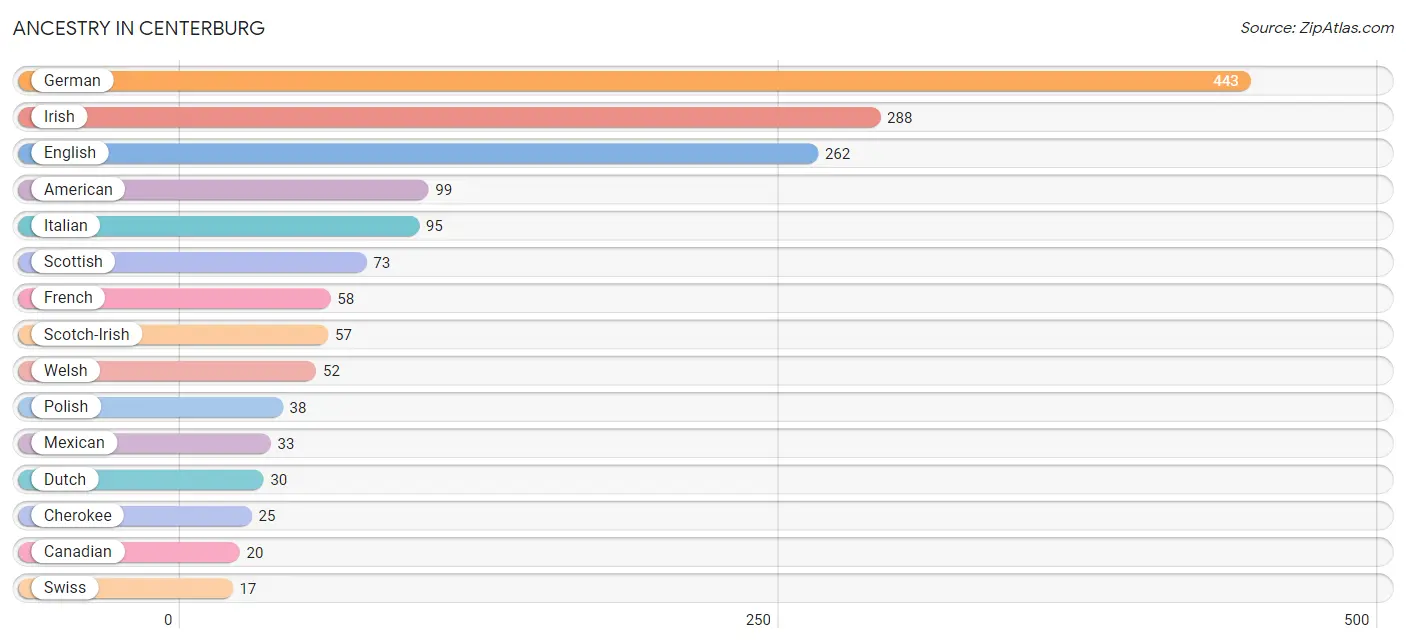
| Ancestry | # Population | % Population |
| American | 99 | 5.3% |
| Bolivian | 4 | 0.2% |
| Canadian | 20 | 1.1% |
| Cherokee | 25 | 1.3% |
| Chippewa | 2 | 0.1% |
| Czech | 6 | 0.3% |
| Dutch | 30 | 1.6% |
| English | 262 | 14.0% |
| Finnish | 2 | 0.1% |
| French | 58 | 3.1% |
| German | 443 | 23.6% |
| Indian (Asian) | 5 | 0.3% |
| Irish | 288 | 15.4% |
| Italian | 95 | 5.1% |
| Korean | 5 | 0.3% |
| Mexican | 33 | 1.8% |
| Pennsylvania German | 6 | 0.3% |
| Polish | 38 | 2.0% |
| Portuguese | 7 | 0.4% |
| Scotch-Irish | 57 | 3.0% |
| Scottish | 73 | 3.9% |
| South American | 4 | 0.2% |
| Swedish | 11 | 0.6% |
| Swiss | 17 | 0.9% |
| Welsh | 52 | 2.8% | View All 25 Rows |
Immigrants in Centerburg
The most numerous immigrant groups reported in Centerburg came from , and Canada (24 | 1.3%), together accounting for 1.3% of all Centerburg residents.

| Immigration Origin | # Population | % Population |
| Canada | 24 | 1.3% | View All 1 Rows |
Sex and Age in Centerburg
Sex and Age in Centerburg
The most populous age groups in Centerburg are Under 5 Years (161 | 15.2%) for men and 30 to 34 Years (78 | 9.6%) for women.
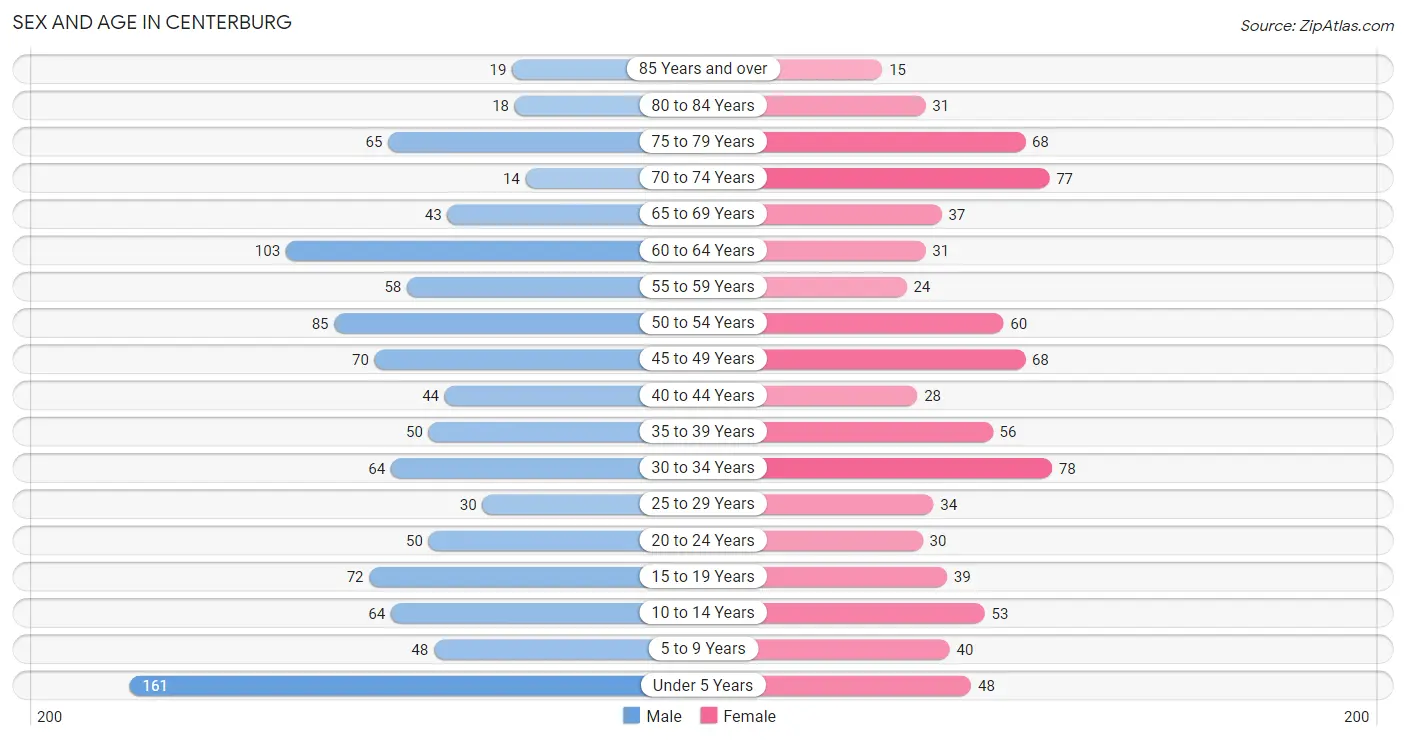
| Age Bracket | Male | Female |
| Under 5 Years | 161 (15.2%) | 48 (5.9%) |
| 5 to 9 Years | 48 (4.5%) | 40 (4.9%) |
| 10 to 14 Years | 64 (6.0%) | 53 (6.5%) |
| 15 to 19 Years | 72 (6.8%) | 39 (4.8%) |
| 20 to 24 Years | 50 (4.7%) | 30 (3.7%) |
| 25 to 29 Years | 30 (2.8%) | 34 (4.2%) |
| 30 to 34 Years | 64 (6.0%) | 78 (9.6%) |
| 35 to 39 Years | 50 (4.7%) | 56 (6.9%) |
| 40 to 44 Years | 44 (4.2%) | 28 (3.4%) |
| 45 to 49 Years | 70 (6.6%) | 68 (8.3%) |
| 50 to 54 Years | 85 (8.0%) | 60 (7.3%) |
| 55 to 59 Years | 58 (5.5%) | 24 (2.9%) |
| 60 to 64 Years | 103 (9.7%) | 31 (3.8%) |
| 65 to 69 Years | 43 (4.1%) | 37 (4.5%) |
| 70 to 74 Years | 14 (1.3%) | 77 (9.4%) |
| 75 to 79 Years | 65 (6.1%) | 68 (8.3%) |
| 80 to 84 Years | 18 (1.7%) | 31 (3.8%) |
| 85 Years and over | 19 (1.8%) | 15 (1.8%) |
| Total | 1,058 (100.0%) | 817 (100.0%) |
Families and Households in Centerburg
Median Family Size in Centerburg
The median family size in Centerburg is 3.06 persons per family, with married-couple families (358 | 75.4%) accounting for the largest median family size of 3.31 persons per family. On the other hand, single female/mother families (88 | 18.5%) represent the smallest median family size with 2.28 persons per family.
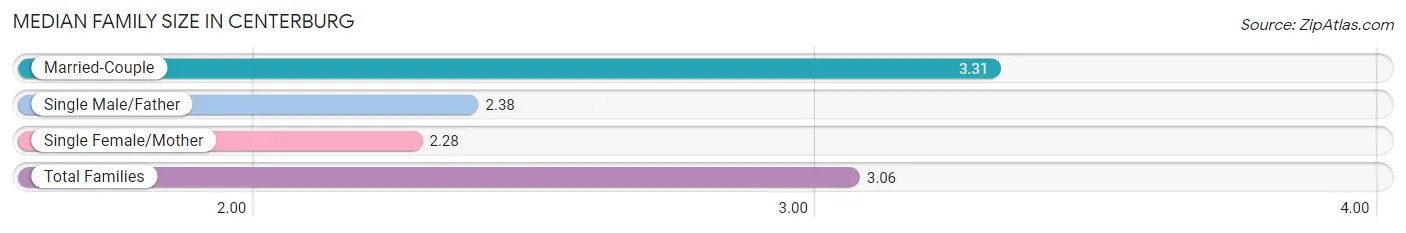
| Family Type | # Families | Family Size |
| Married-Couple | 358 (75.4%) | 3.31 |
| Single Male/Father | 29 (6.1%) | 2.38 |
| Single Female/Mother | 88 (18.5%) | 2.28 |
| Total Families | 475 (100.0%) | 3.06 |
Median Household Size in Centerburg
The median household size in Centerburg is 2.46 persons per household, with married-couple households (358 | 50.1%) accounting for the largest median household size of 3.31 persons per household. non-family households (239 | 33.5%) represent the smallest median household size with 1.11 persons per household.
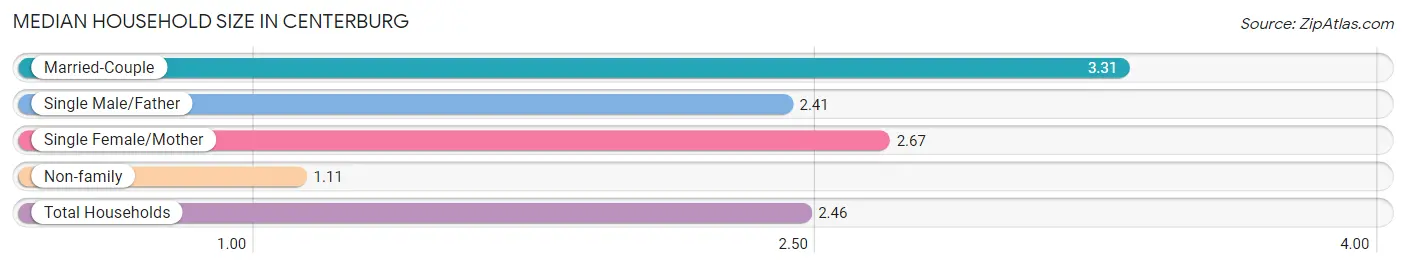
| Household Type | # Households | Household Size |
| Married-Couple | 358 (50.1%) | 3.31 |
| Single Male/Father | 29 (4.1%) | 2.41 |
| Single Female/Mother | 88 (12.3%) | 2.67 |
| Non-family | 239 (33.5%) | 1.11 |
| Total Households | 714 (100.0%) | 2.46 |
Household Size by Marriage Status in Centerburg
Out of a total of 714 households in Centerburg, 475 (66.5%) are family households, while 239 (33.5%) are nonfamily households. The most numerous type of family households are 2-person households, comprising 198, and the most common type of nonfamily households are 1-person households, comprising 220.
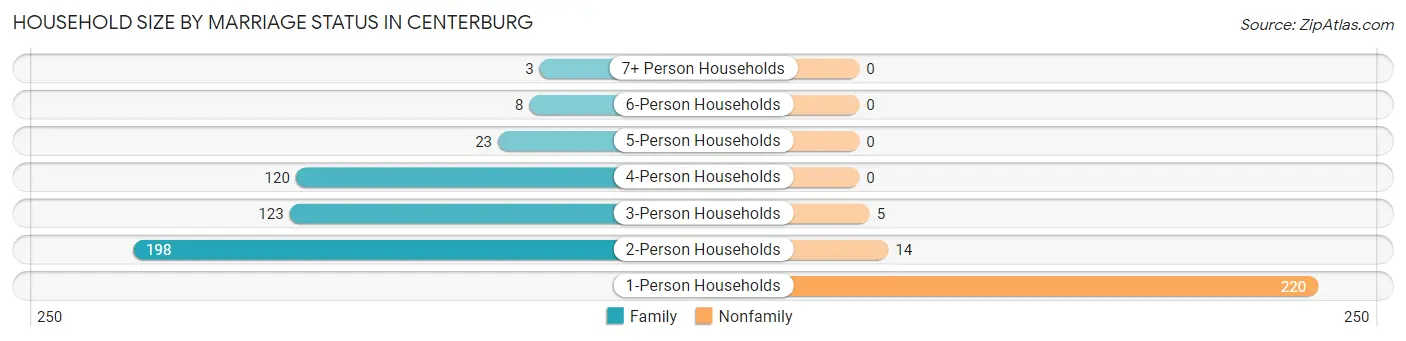
| Household Size | Family Households | Nonfamily Households |
| 1-Person Households | - | 220 (30.8%) |
| 2-Person Households | 198 (27.7%) | 14 (2.0%) |
| 3-Person Households | 123 (17.2%) | 5 (0.7%) |
| 4-Person Households | 120 (16.8%) | 0 (0.0%) |
| 5-Person Households | 23 (3.2%) | 0 (0.0%) |
| 6-Person Households | 8 (1.1%) | 0 (0.0%) |
| 7+ Person Households | 3 (0.4%) | 0 (0.0%) |
| Total | 475 (66.5%) | 239 (33.5%) |
Female Fertility in Centerburg
Fertility by Age in Centerburg
Average fertility rate in Centerburg is 132.0 births per 1,000 women. Women in the age bracket of 20 to 34 years have the highest fertility rate with 246.0 births per 1,000 women. Women in the age bracket of 20 to 34 years acount for 77.8% of all women with births.
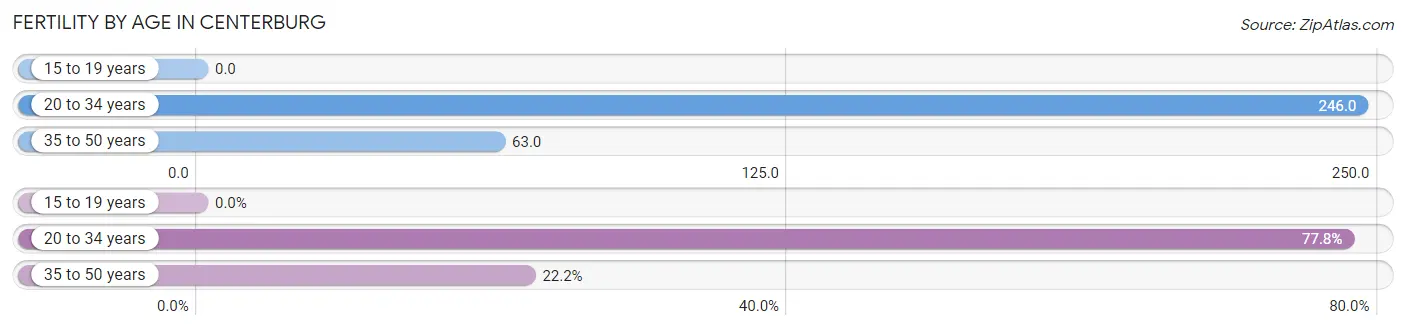
| Age Bracket | Women with Births | Births / 1,000 Women |
| 15 to 19 years | 0 (0.0%) | 0.0 |
| 20 to 34 years | 35 (77.8%) | 246.0 |
| 35 to 50 years | 10 (22.2%) | 63.0 |
| Total | 45 (100.0%) | 132.0 |
Fertility by Age by Marriage Status in Centerburg
91.1% of women with births (45) in Centerburg are married. The highest percentage of unmarried women with births falls into 20 to 34 years age bracket with 11.4% of them unmarried at the time of birth, while the lowest percentage of unmarried women with births belong to 35 to 50 years age bracket with 0.0% of them unmarried.
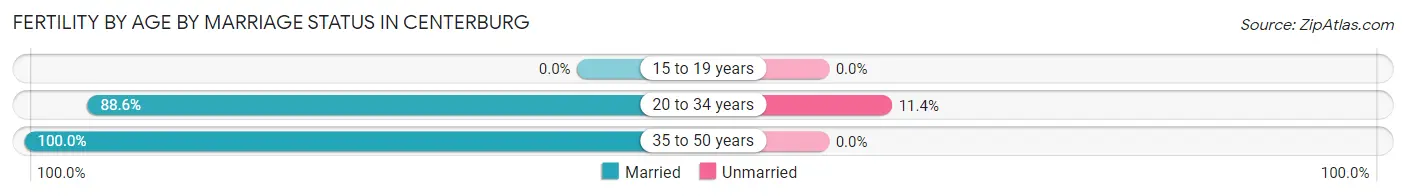
| Age Bracket | Married | Unmarried |
| 15 to 19 years | 0 (0.0%) | 0 (0.0%) |
| 20 to 34 years | 31 (88.6%) | 4 (11.4%) |
| 35 to 50 years | 10 (100.0%) | 0 (0.0%) |
| Total | 41 (91.1%) | 4 (8.9%) |
Fertility by Education in Centerburg
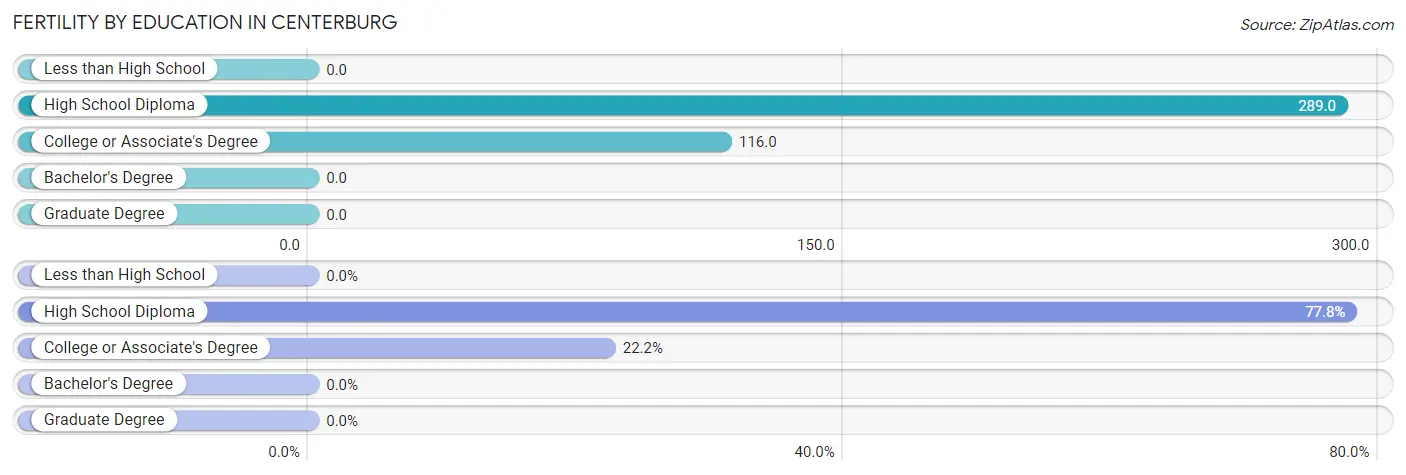
| Educational Attainment | Women with Births | Births / 1,000 Women |
| Less than High School | 0 (0.0%) | 0.0 |
| High School Diploma | 35 (77.8%) | 289.0 |
| College or Associate's Degree | 10 (22.2%) | 116.0 |
| Bachelor's Degree | 0 (0.0%) | 0.0 |
| Graduate Degree | 0 (0.0%) | 0.0 |
| Total | 45 (100.0%) | 132.0 |
Fertility by Education by Marriage Status in Centerburg
8.9% of women with births in Centerburg are unmarried. Women with the educational attainment of college or associate's degree are most likely to be married with 100.0% of them married at childbirth, while women with the educational attainment of high school diploma are least likely to be married with 11.4% of them unmarried at childbirth.
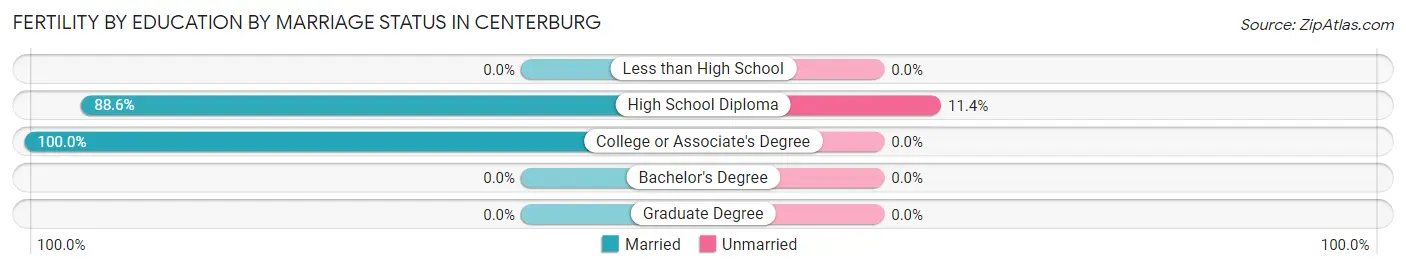
| Educational Attainment | Married | Unmarried |
| Less than High School | 0 (0.0%) | 0 (0.0%) |
| High School Diploma | 31 (88.6%) | 4 (11.4%) |
| College or Associate's Degree | 10 (100.0%) | 0 (0.0%) |
| Bachelor's Degree | 0 (0.0%) | 0 (0.0%) |
| Graduate Degree | 0 (0.0%) | 0 (0.0%) |
| Total | 41 (91.1%) | 4 (8.9%) |
Employment Characteristics in Centerburg
Employment by Class of Employer in Centerburg
Among the 773 employed individuals in Centerburg, private company employees (570 | 73.7%), not-for-profit organizations (60 | 7.8%), and local government employees (60 | 7.8%) make up the most common classes of employment.
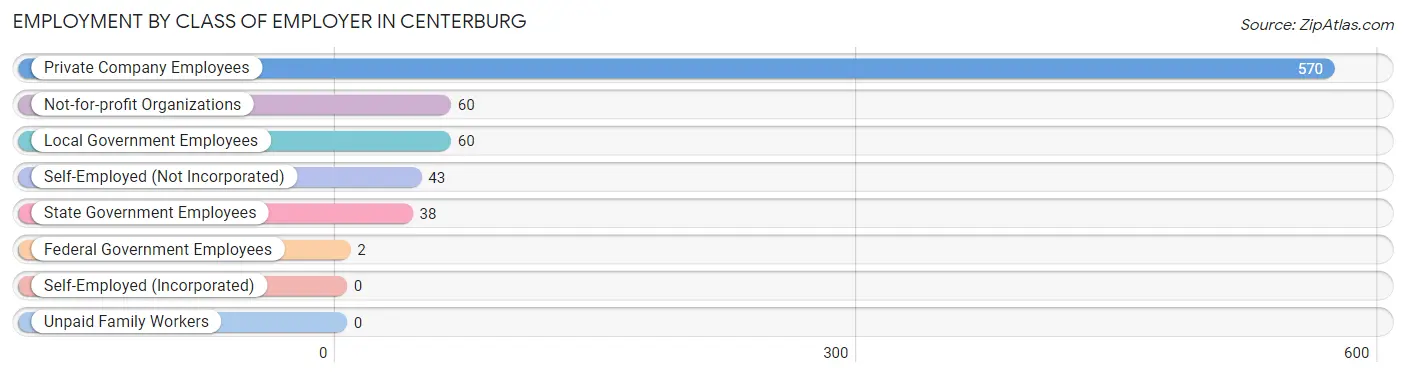
| Employer Class | # Employees | % Employees |
| Private Company Employees | 570 | 73.7% |
| Self-Employed (Incorporated) | 0 | 0.0% |
| Self-Employed (Not Incorporated) | 43 | 5.6% |
| Not-for-profit Organizations | 60 | 7.8% |
| Local Government Employees | 60 | 7.8% |
| State Government Employees | 38 | 4.9% |
| Federal Government Employees | 2 | 0.3% |
| Unpaid Family Workers | 0 | 0.0% |
| Total | 773 | 100.0% |
Employment Status by Age in Centerburg
According to the labor force statistics for Centerburg, out of the total population over 16 years of age (1,445), 56.8% or 821 individuals are in the labor force, with 2.7% or 22 of them unemployed. The age group with the highest labor force participation rate is 25 to 29 years, with 92.2% or 59 individuals in the labor force. Within the labor force, the 16 to 19 years age range has the highest percentage of unemployed individuals, with 11.3% or 7 of them being unemployed.
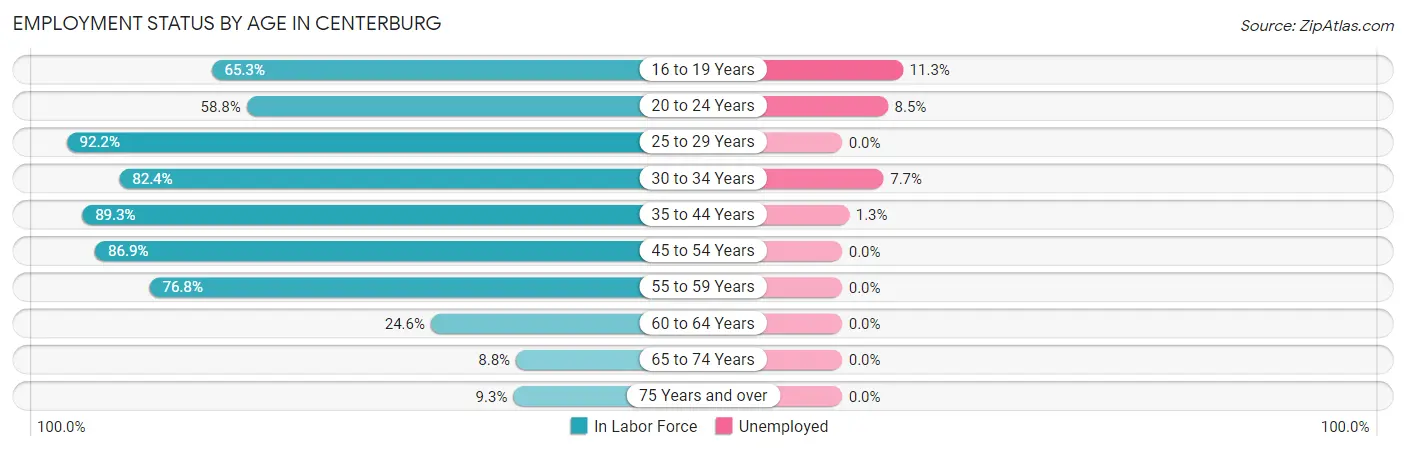
| Age Bracket | In Labor Force | Unemployed |
| 16 to 19 Years | 62 (65.3%) | 7 (11.3%) |
| 20 to 24 Years | 47 (58.8%) | 4 (8.5%) |
| 25 to 29 Years | 59 (92.2%) | 0 (0.0%) |
| 30 to 34 Years | 117 (82.4%) | 9 (7.7%) |
| 35 to 44 Years | 159 (89.3%) | 2 (1.3%) |
| 45 to 54 Years | 246 (86.9%) | 0 (0.0%) |
| 55 to 59 Years | 63 (76.8%) | 0 (0.0%) |
| 60 to 64 Years | 33 (24.6%) | 0 (0.0%) |
| 65 to 74 Years | 15 (8.8%) | 0 (0.0%) |
| 75 Years and over | 20 (9.3%) | 0 (0.0%) |
| Total | 821 (56.8%) | 22 (2.7%) |
Employment Status by Educational Attainment in Centerburg
According to labor force statistics for Centerburg, 76.7% of individuals (677) out of the total population between 25 and 64 years of age (883) are in the labor force, with 1.6% or 11 of them being unemployed. The group with the highest labor force participation rate are those with the educational attainment of college / associate degree, with 86.0% or 215 individuals in the labor force. Within the labor force, individuals with bachelor's degree or higher education have the highest percentage of unemployment, with 6.0% or 9 of them being unemployed.
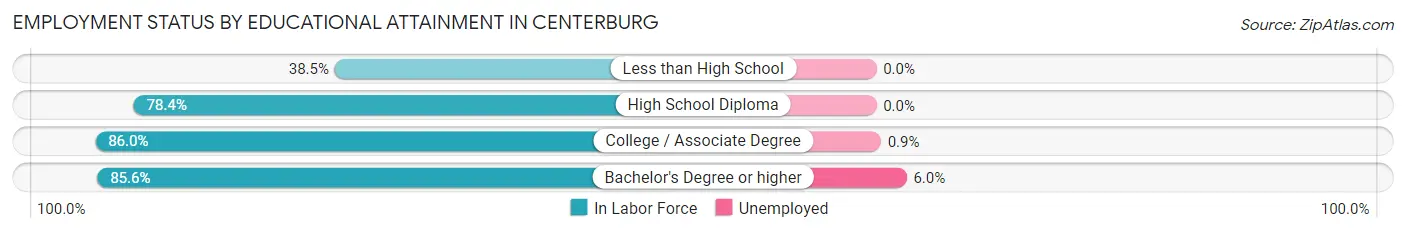
| Educational Attainment | In Labor Force | Unemployed |
| Less than High School | 45 (38.5%) | 0 (0.0%) |
| High School Diploma | 268 (78.4%) | 0 (0.0%) |
| College / Associate Degree | 215 (86.0%) | 2 (0.9%) |
| Bachelor's Degree or higher | 149 (85.6%) | 10 (6.0%) |
| Total | 677 (76.7%) | 14 (1.6%) |
Employment Occupations by Sex in Centerburg
Management, Business, Science and Arts Occupations
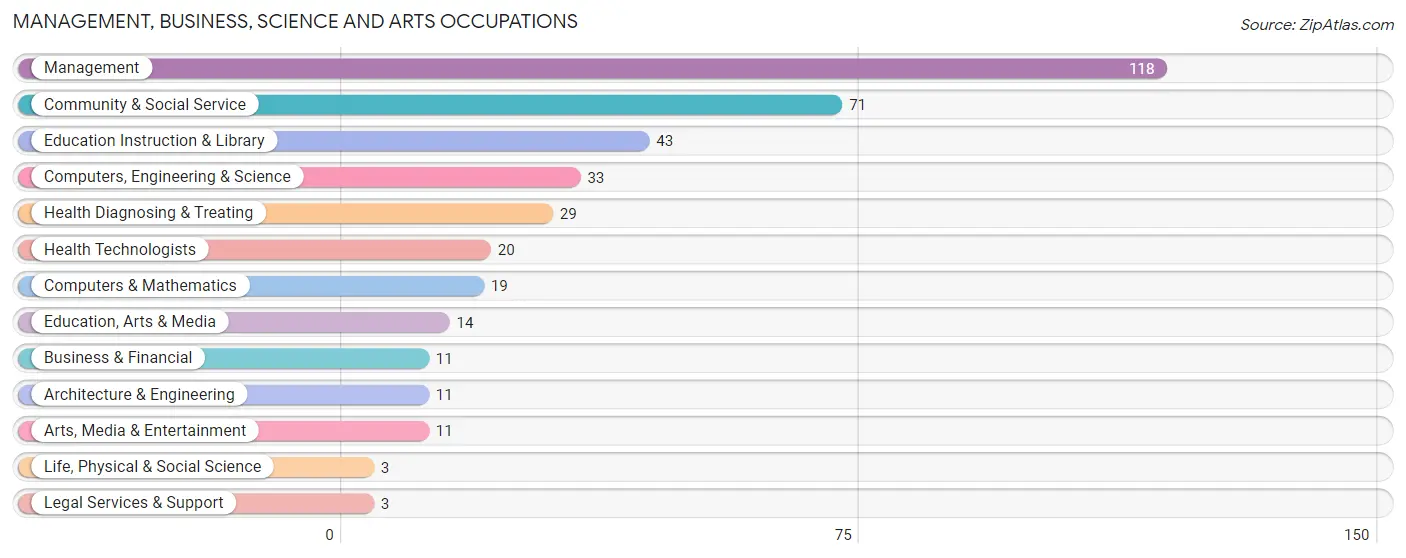
The most common Management, Business, Science and Arts occupations in Centerburg are Management (118 | 14.8%), Community & Social Service (71 | 8.9%), Education Instruction & Library (43 | 5.4%), Computers, Engineering & Science (33 | 4.1%), and Health Diagnosing & Treating (29 | 3.6%).
Management, Business, Science and Arts Occupations by Sex
Within the Management, Business, Science and Arts occupations in Centerburg, the most male-oriented occupations are Architecture & Engineering (100.0%), Life, Physical & Social Science (100.0%), and Computers, Engineering & Science (90.9%), while the most female-oriented occupations are Business & Financial (100.0%), Legal Services & Support (100.0%), and Arts, Media & Entertainment (100.0%).
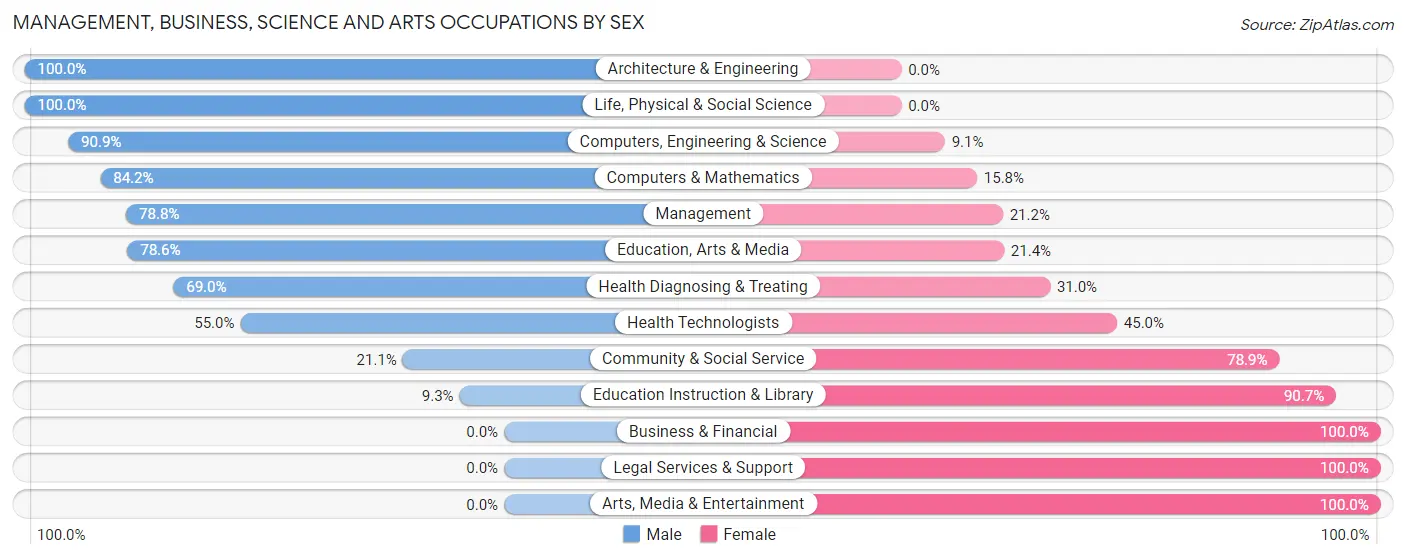
| Occupation | Male | Female |
| Management | 93 (78.8%) | 25 (21.2%) |
| Business & Financial | 0 (0.0%) | 11 (100.0%) |
| Computers, Engineering & Science | 30 (90.9%) | 3 (9.1%) |
| Computers & Mathematics | 16 (84.2%) | 3 (15.8%) |
| Architecture & Engineering | 11 (100.0%) | 0 (0.0%) |
| Life, Physical & Social Science | 3 (100.0%) | 0 (0.0%) |
| Community & Social Service | 15 (21.1%) | 56 (78.9%) |
| Education, Arts & Media | 11 (78.6%) | 3 (21.4%) |
| Legal Services & Support | 0 (0.0%) | 3 (100.0%) |
| Education Instruction & Library | 4 (9.3%) | 39 (90.7%) |
| Arts, Media & Entertainment | 0 (0.0%) | 11 (100.0%) |
| Health Diagnosing & Treating | 20 (69.0%) | 9 (31.0%) |
| Health Technologists | 11 (55.0%) | 9 (45.0%) |
| Total (Category) | 158 (60.3%) | 104 (39.7%) |
| Total (Overall) | 460 (57.6%) | 339 (42.4%) |
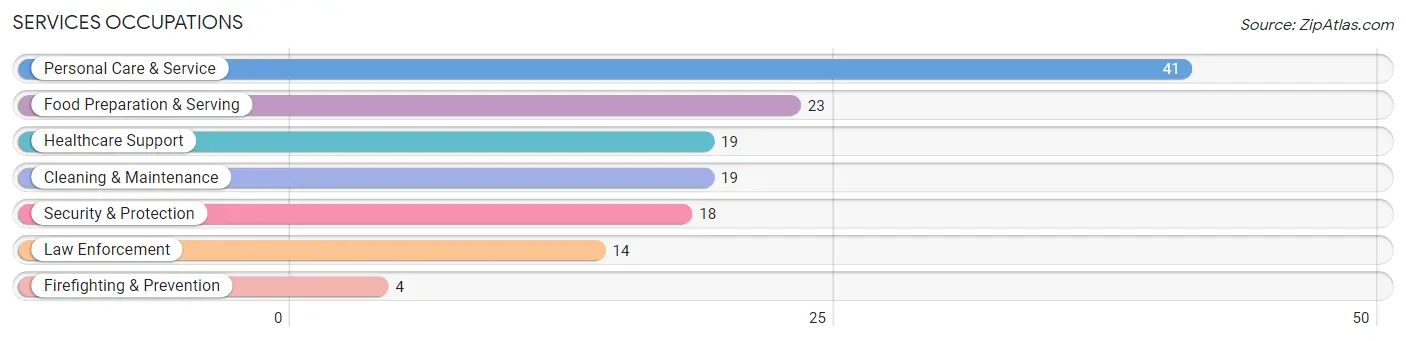
Services Occupations
The most common Services occupations in Centerburg are Personal Care & Service (41 | 5.1%), Food Preparation & Serving (23 | 2.9%), Healthcare Support (19 | 2.4%), Cleaning & Maintenance (19 | 2.4%), and Security & Protection (18 | 2.2%).
Services Occupations by Sex
Within the Services occupations in Centerburg, the most male-oriented occupations are Security & Protection (100.0%), Firefighting & Prevention (100.0%), and Law Enforcement (100.0%), while the most female-oriented occupations are Healthcare Support (100.0%), Personal Care & Service (78.0%), and Food Preparation & Serving (52.2%).
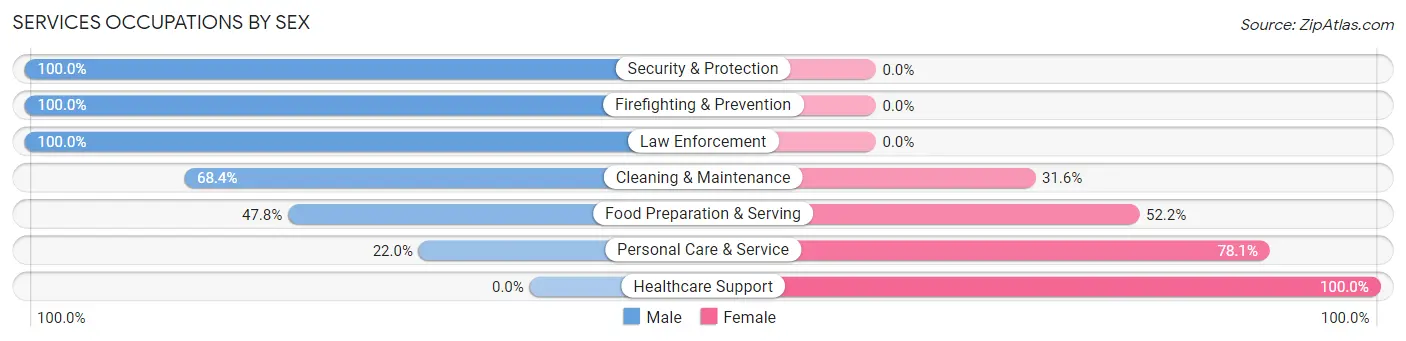
| Occupation | Male | Female |
| Healthcare Support | 0 (0.0%) | 19 (100.0%) |
| Security & Protection | 18 (100.0%) | 0 (0.0%) |
| Firefighting & Prevention | 4 (100.0%) | 0 (0.0%) |
| Law Enforcement | 14 (100.0%) | 0 (0.0%) |
| Food Preparation & Serving | 11 (47.8%) | 12 (52.2%) |
| Cleaning & Maintenance | 13 (68.4%) | 6 (31.6%) |
| Personal Care & Service | 9 (22.0%) | 32 (78.0%) |
| Total (Category) | 51 (42.5%) | 69 (57.5%) |
| Total (Overall) | 460 (57.6%) | 339 (42.4%) |
Sales and Office Occupations
The most common Sales and Office occupations in Centerburg are Sales & Related (103 | 12.9%), and Office & Administration (55 | 6.9%).

Sales and Office Occupations by Sex

| Occupation | Male | Female |
| Sales & Related | 67 (65.0%) | 36 (34.9%) |
| Office & Administration | 4 (7.3%) | 51 (92.7%) |
| Total (Category) | 71 (44.9%) | 87 (55.1%) |
| Total (Overall) | 460 (57.6%) | 339 (42.4%) |
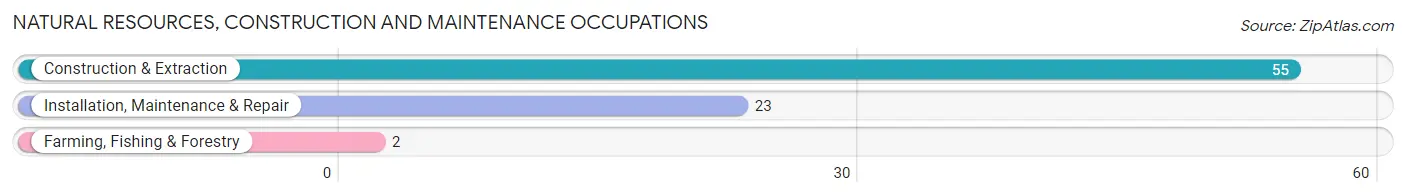
Natural Resources, Construction and Maintenance Occupations
The most common Natural Resources, Construction and Maintenance occupations in Centerburg are Construction & Extraction (55 | 6.9%), Installation, Maintenance & Repair (23 | 2.9%), and Farming, Fishing & Forestry (2 | 0.3%).
Natural Resources, Construction and Maintenance Occupations by Sex

| Occupation | Male | Female |
| Farming, Fishing & Forestry | 2 (100.0%) | 0 (0.0%) |
| Construction & Extraction | 55 (100.0%) | 0 (0.0%) |
| Installation, Maintenance & Repair | 23 (100.0%) | 0 (0.0%) |
| Total (Category) | 80 (100.0%) | 0 (0.0%) |
| Total (Overall) | 460 (57.6%) | 339 (42.4%) |
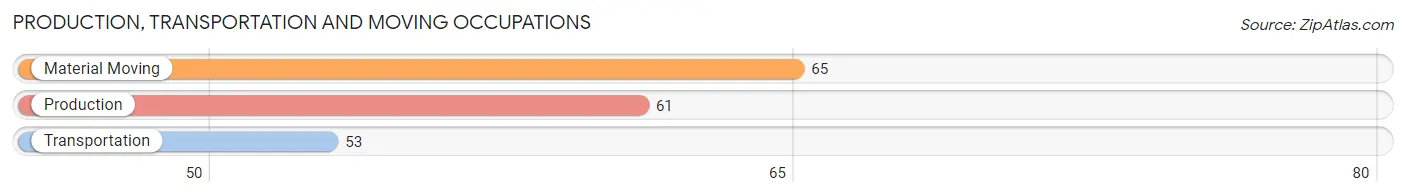
Production, Transportation and Moving Occupations
The most common Production, Transportation and Moving occupations in Centerburg are Material Moving (65 | 8.1%), Production (61 | 7.6%), and Transportation (53 | 6.6%).
Production, Transportation and Moving Occupations by Sex

| Occupation | Male | Female |
| Production | 50 (82.0%) | 11 (18.0%) |
| Transportation | 19 (35.8%) | 34 (64.1%) |
| Material Moving | 31 (47.7%) | 34 (52.3%) |
| Total (Category) | 100 (55.9%) | 79 (44.1%) |
| Total (Overall) | 460 (57.6%) | 339 (42.4%) |
Employment Industries by Sex in Centerburg
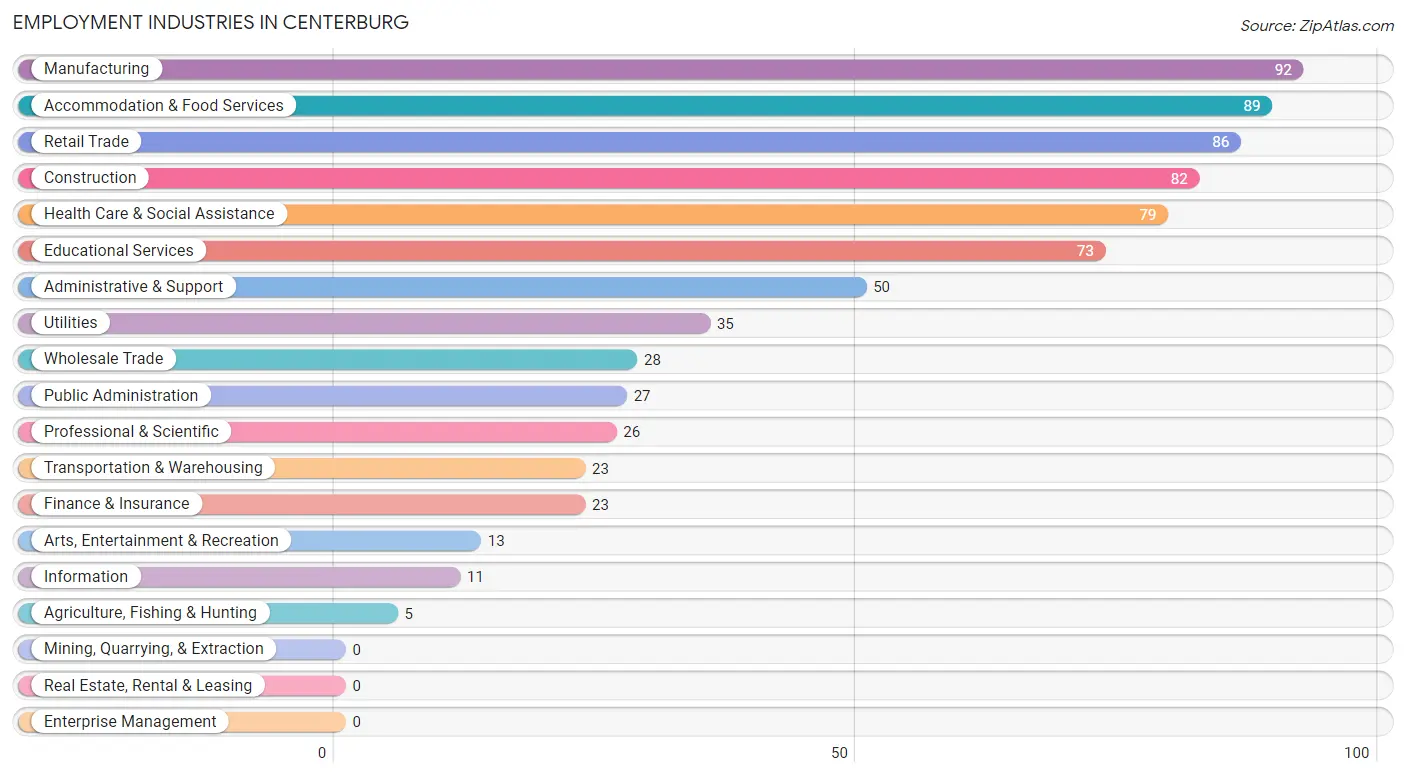
Employment Industries in Centerburg
The major employment industries in Centerburg include Manufacturing (92 | 11.5%), Accommodation & Food Services (89 | 11.1%), Retail Trade (86 | 10.8%), Construction (82 | 10.3%), and Health Care & Social Assistance (79 | 9.9%).
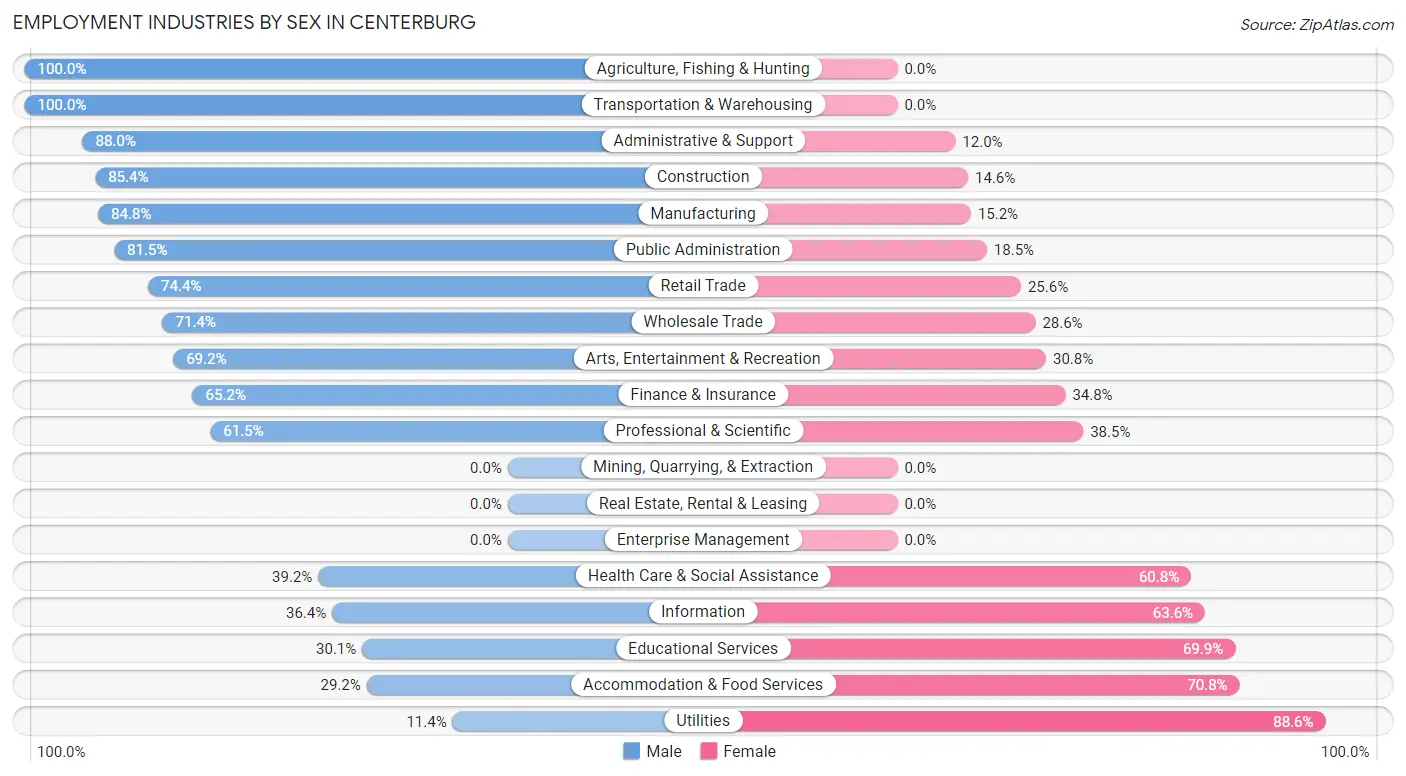
Employment Industries by Sex in Centerburg
The Centerburg industries that see more men than women are Agriculture, Fishing & Hunting (100.0%), Transportation & Warehousing (100.0%), and Administrative & Support (88.0%), whereas the industries that tend to have a higher number of women are Utilities (88.6%), Accommodation & Food Services (70.8%), and Educational Services (69.9%).
| Industry | Male | Female |
| Agriculture, Fishing & Hunting | 5 (100.0%) | 0 (0.0%) |
| Mining, Quarrying, & Extraction | 0 (0.0%) | 0 (0.0%) |
| Construction | 70 (85.4%) | 12 (14.6%) |
| Manufacturing | 78 (84.8%) | 14 (15.2%) |
| Wholesale Trade | 20 (71.4%) | 8 (28.6%) |
| Retail Trade | 64 (74.4%) | 22 (25.6%) |
| Transportation & Warehousing | 23 (100.0%) | 0 (0.0%) |
| Utilities | 4 (11.4%) | 31 (88.6%) |
| Information | 4 (36.4%) | 7 (63.6%) |
| Finance & Insurance | 15 (65.2%) | 8 (34.8%) |
| Real Estate, Rental & Leasing | 0 (0.0%) | 0 (0.0%) |
| Professional & Scientific | 16 (61.5%) | 10 (38.5%) |
| Enterprise Management | 0 (0.0%) | 0 (0.0%) |
| Administrative & Support | 44 (88.0%) | 6 (12.0%) |
| Educational Services | 22 (30.1%) | 51 (69.9%) |
| Health Care & Social Assistance | 31 (39.2%) | 48 (60.8%) |
| Arts, Entertainment & Recreation | 9 (69.2%) | 4 (30.8%) |
| Accommodation & Food Services | 26 (29.2%) | 63 (70.8%) |
| Public Administration | 22 (81.5%) | 5 (18.5%) |
| Total | 460 (57.6%) | 339 (42.4%) |
Education in Centerburg
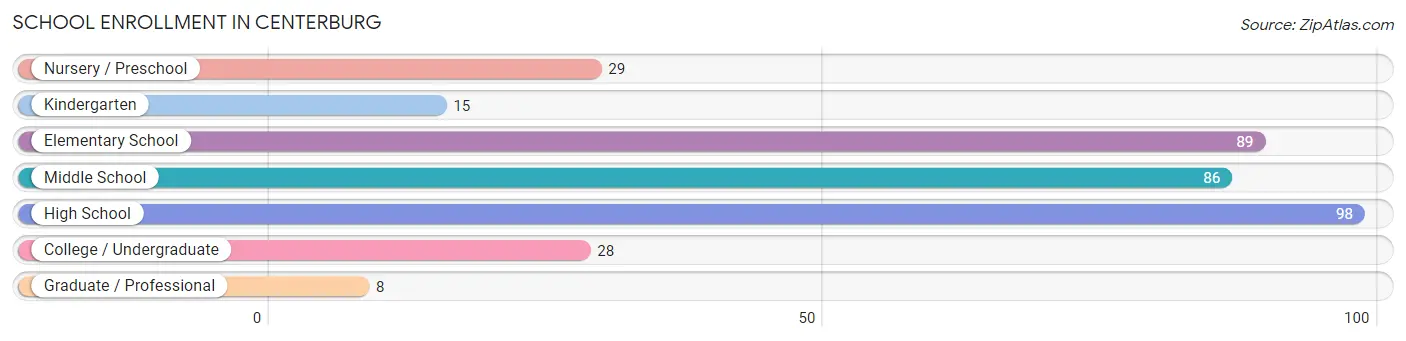
School Enrollment in Centerburg
The most common levels of schooling among the 353 students in Centerburg are high school (98 | 27.8%), elementary school (89 | 25.2%), and middle school (86 | 24.4%).
| School Level | # Students | % Students |
| Nursery / Preschool | 29 | 8.2% |
| Kindergarten | 15 | 4.3% |
| Elementary School | 89 | 25.2% |
| Middle School | 86 | 24.4% |
| High School | 98 | 27.8% |
| College / Undergraduate | 28 | 7.9% |
| Graduate / Professional | 8 | 2.3% |
| Total | 353 | 100.0% |
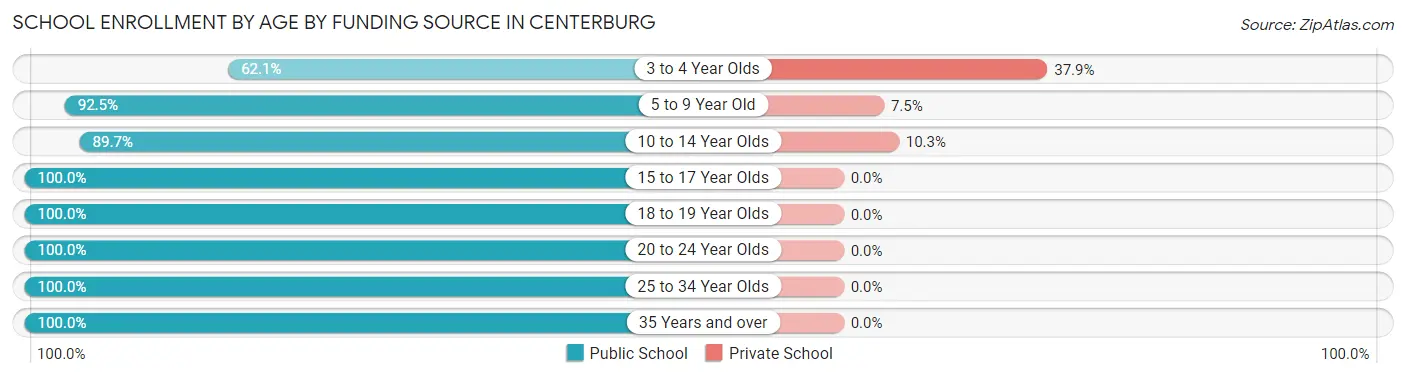
School Enrollment by Age by Funding Source in Centerburg
Out of a total of 353 students who are enrolled in schools in Centerburg, 29 (8.2%) attend a private institution, while the remaining 324 (91.8%) are enrolled in public schools. The age group of 3 to 4 year olds has the highest likelihood of being enrolled in private schools, with 11 (37.9% in the age bracket) enrolled. Conversely, the age group of 15 to 17 year olds has the lowest likelihood of being enrolled in a private school, with 61 (100.0% in the age bracket) attending a public institution.
| Age Bracket | Public School | Private School |
| 3 to 4 Year Olds | 18 (62.1%) | 11 (37.9%) |
| 5 to 9 Year Old | 74 (92.5%) | 6 (7.5%) |
| 10 to 14 Year Olds | 105 (89.7%) | 12 (10.3%) |
| 15 to 17 Year Olds | 61 (100.0%) | 0 (0.0%) |
| 18 to 19 Year Olds | 35 (100.0%) | 0 (0.0%) |
| 20 to 24 Year Olds | 12 (100.0%) | 0 (0.0%) |
| 25 to 34 Year Olds | 5 (100.0%) | 0 (0.0%) |
| 35 Years and over | 14 (100.0%) | 0 (0.0%) |
| Total | 324 (91.8%) | 29 (8.2%) |
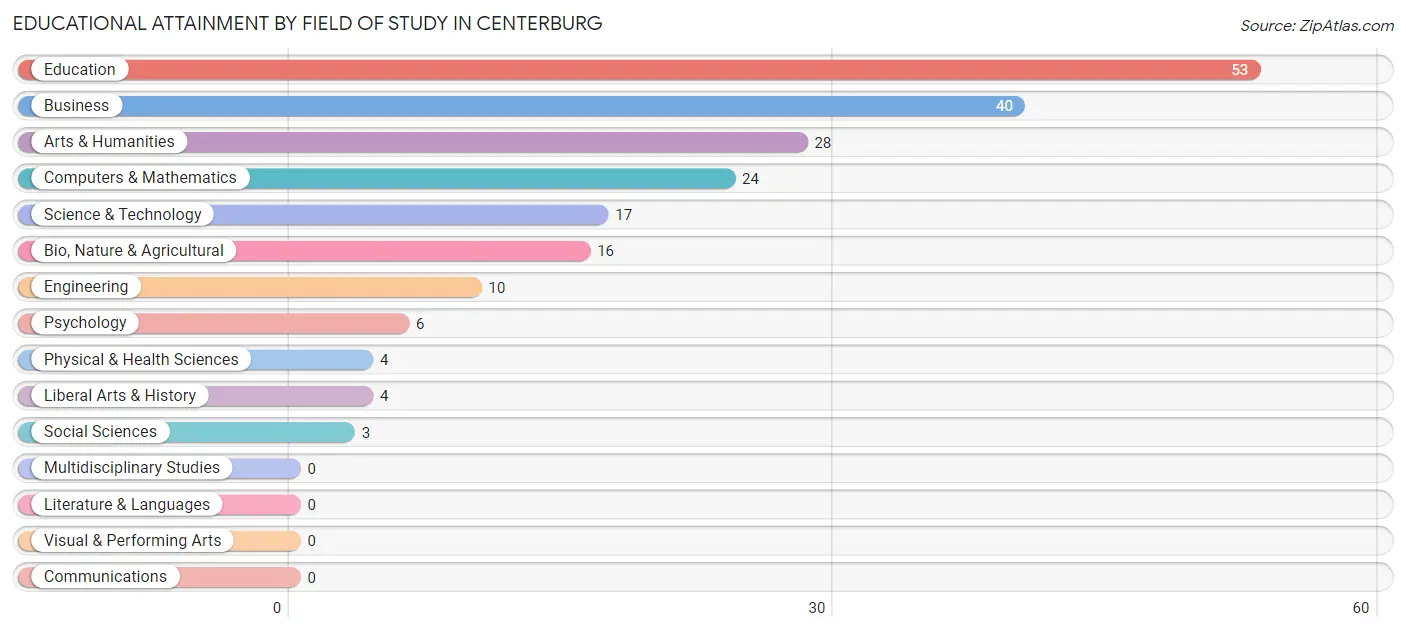
Educational Attainment by Field of Study in Centerburg
Education (53 | 25.9%), business (40 | 19.5%), arts & humanities (28 | 13.7%), computers & mathematics (24 | 11.7%), and science & technology (17 | 8.3%) are the most common fields of study among 205 individuals in Centerburg who have obtained a bachelor's degree or higher.
| Field of Study | # Graduates | % Graduates |
| Computers & Mathematics | 24 | 11.7% |
| Bio, Nature & Agricultural | 16 | 7.8% |
| Physical & Health Sciences | 4 | 1.9% |
| Psychology | 6 | 2.9% |
| Social Sciences | 3 | 1.5% |
| Engineering | 10 | 4.9% |
| Multidisciplinary Studies | 0 | 0.0% |
| Science & Technology | 17 | 8.3% |
| Business | 40 | 19.5% |
| Education | 53 | 25.9% |
| Literature & Languages | 0 | 0.0% |
| Liberal Arts & History | 4 | 1.9% |
| Visual & Performing Arts | 0 | 0.0% |
| Communications | 0 | 0.0% |
| Arts & Humanities | 28 | 13.7% |
| Total | 205 | 100.0% |
Transportation & Commute in Centerburg
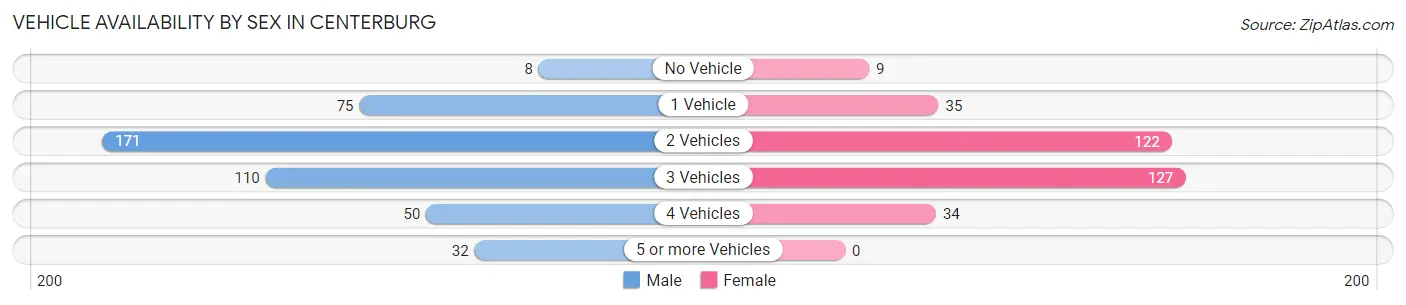
Vehicle Availability by Sex in Centerburg
The most prevalent vehicle ownership categories in Centerburg are males with 2 vehicles (171, accounting for 38.3%) and females with 2 vehicles (122, making up 52.3%).
| Vehicles Available | Male | Female |
| No Vehicle | 8 (1.8%) | 9 (2.8%) |
| 1 Vehicle | 75 (16.8%) | 35 (10.7%) |
| 2 Vehicles | 171 (38.3%) | 122 (37.3%) |
| 3 Vehicles | 110 (24.7%) | 127 (38.8%) |
| 4 Vehicles | 50 (11.2%) | 34 (10.4%) |
| 5 or more Vehicles | 32 (7.2%) | 0 (0.0%) |
| Total | 446 (100.0%) | 327 (100.0%) |
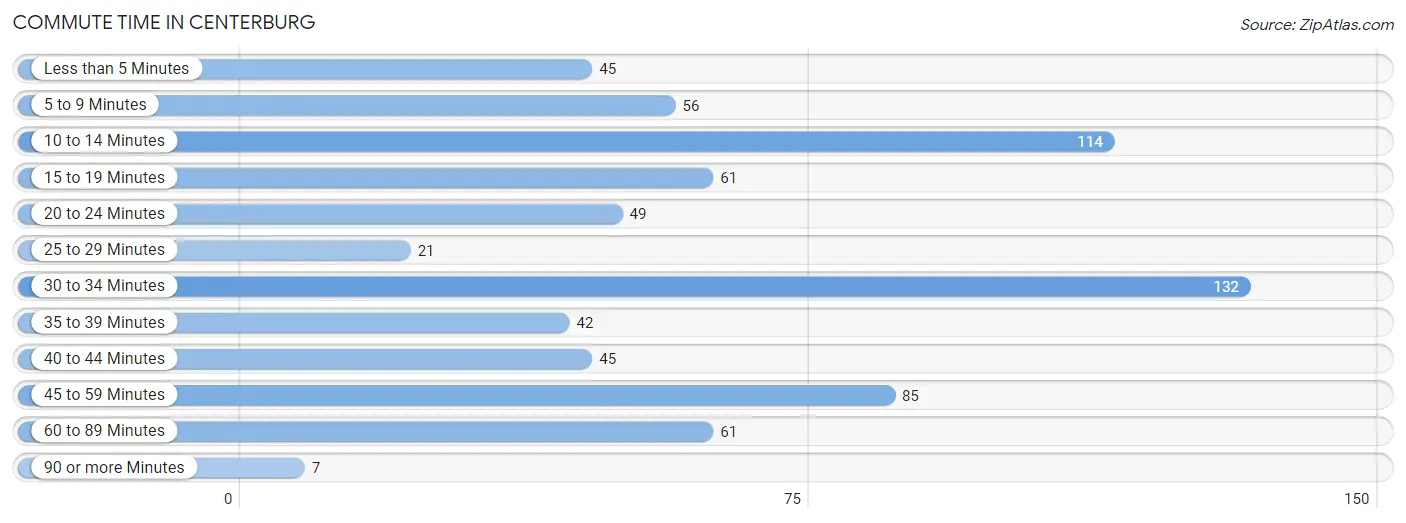
Commute Time in Centerburg
The most frequently occuring commute durations in Centerburg are 30 to 34 minutes (132 commuters, 18.4%), 10 to 14 minutes (114 commuters, 15.9%), and 45 to 59 minutes (85 commuters, 11.8%).
| Commute Time | # Commuters | % Commuters |
| Less than 5 Minutes | 45 | 6.3% |
| 5 to 9 Minutes | 56 | 7.8% |
| 10 to 14 Minutes | 114 | 15.9% |
| 15 to 19 Minutes | 61 | 8.5% |
| 20 to 24 Minutes | 49 | 6.8% |
| 25 to 29 Minutes | 21 | 2.9% |
| 30 to 34 Minutes | 132 | 18.4% |
| 35 to 39 Minutes | 42 | 5.9% |
| 40 to 44 Minutes | 45 | 6.3% |
| 45 to 59 Minutes | 85 | 11.8% |
| 60 to 89 Minutes | 61 | 8.5% |
| 90 or more Minutes | 7 | 1.0% |
Commute Time by Sex in Centerburg
The most common commute times in Centerburg are 30 to 34 minutes (80 commuters, 19.2%) for males and 10 to 14 minutes (59 commuters, 19.5%) for females.
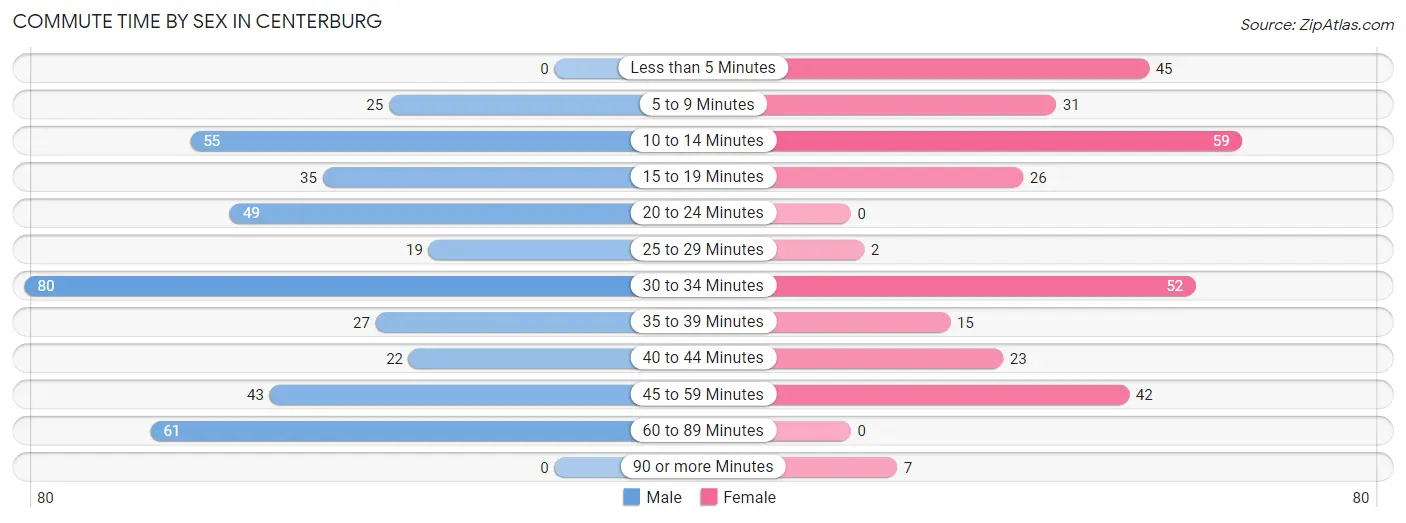
| Commute Time | Male | Female |
| Less than 5 Minutes | 0 (0.0%) | 45 (14.9%) |
| 5 to 9 Minutes | 25 (6.0%) | 31 (10.3%) |
| 10 to 14 Minutes | 55 (13.2%) | 59 (19.5%) |
| 15 to 19 Minutes | 35 (8.4%) | 26 (8.6%) |
| 20 to 24 Minutes | 49 (11.8%) | 0 (0.0%) |
| 25 to 29 Minutes | 19 (4.6%) | 2 (0.7%) |
| 30 to 34 Minutes | 80 (19.2%) | 52 (17.2%) |
| 35 to 39 Minutes | 27 (6.5%) | 15 (5.0%) |
| 40 to 44 Minutes | 22 (5.3%) | 23 (7.6%) |
| 45 to 59 Minutes | 43 (10.3%) | 42 (13.9%) |
| 60 to 89 Minutes | 61 (14.7%) | 0 (0.0%) |
| 90 or more Minutes | 0 (0.0%) | 7 (2.3%) |
Time of Departure to Work by Sex in Centerburg
The most frequent times of departure to work in Centerburg are 7:00 AM to 7:29 AM (63, 15.1%) for males and 6:00 AM to 6:29 AM (52, 17.2%) for females.
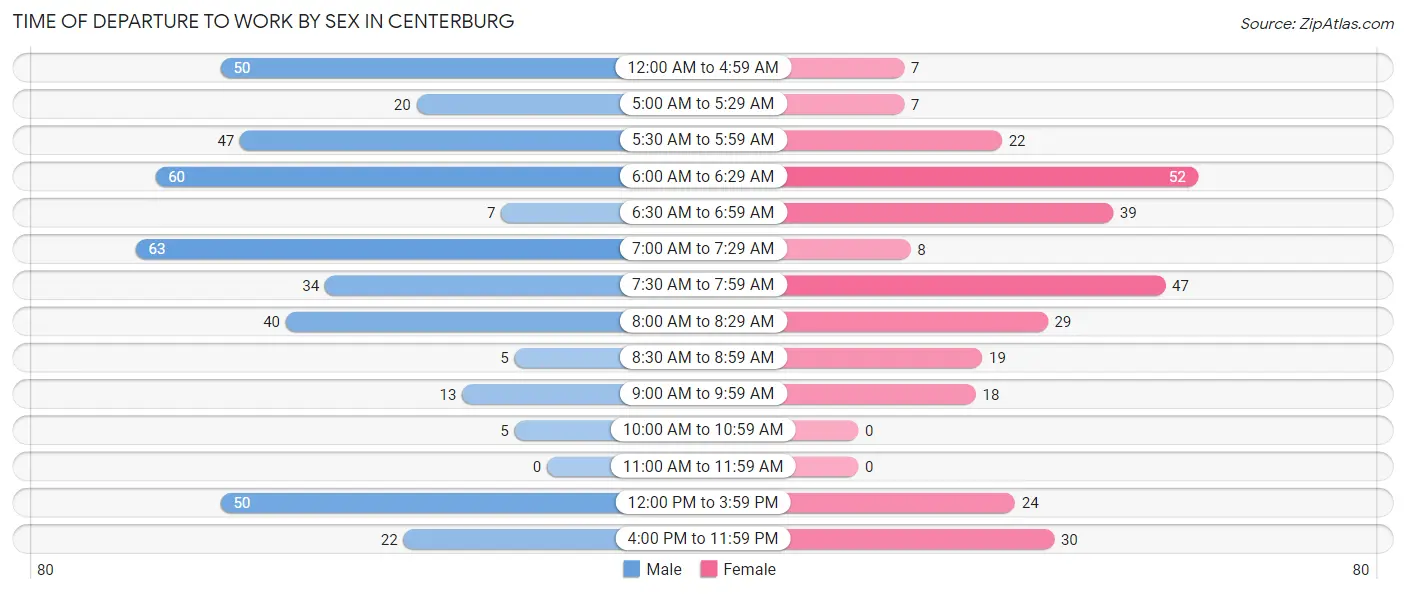
| Time of Departure | Male | Female |
| 12:00 AM to 4:59 AM | 50 (12.0%) | 7 (2.3%) |
| 5:00 AM to 5:29 AM | 20 (4.8%) | 7 (2.3%) |
| 5:30 AM to 5:59 AM | 47 (11.3%) | 22 (7.3%) |
| 6:00 AM to 6:29 AM | 60 (14.4%) | 52 (17.2%) |
| 6:30 AM to 6:59 AM | 7 (1.7%) | 39 (12.9%) |
| 7:00 AM to 7:29 AM | 63 (15.1%) | 8 (2.6%) |
| 7:30 AM to 7:59 AM | 34 (8.2%) | 47 (15.6%) |
| 8:00 AM to 8:29 AM | 40 (9.6%) | 29 (9.6%) |
| 8:30 AM to 8:59 AM | 5 (1.2%) | 19 (6.3%) |
| 9:00 AM to 9:59 AM | 13 (3.1%) | 18 (6.0%) |
| 10:00 AM to 10:59 AM | 5 (1.2%) | 0 (0.0%) |
| 11:00 AM to 11:59 AM | 0 (0.0%) | 0 (0.0%) |
| 12:00 PM to 3:59 PM | 50 (12.0%) | 24 (8.0%) |
| 4:00 PM to 11:59 PM | 22 (5.3%) | 30 (9.9%) |
| Total | 416 (100.0%) | 302 (100.0%) |
Housing Occupancy in Centerburg
Occupancy by Ownership in Centerburg
Of the total 714 dwellings in Centerburg, owner-occupied units account for 431 (60.4%), while renter-occupied units make up 283 (39.6%).
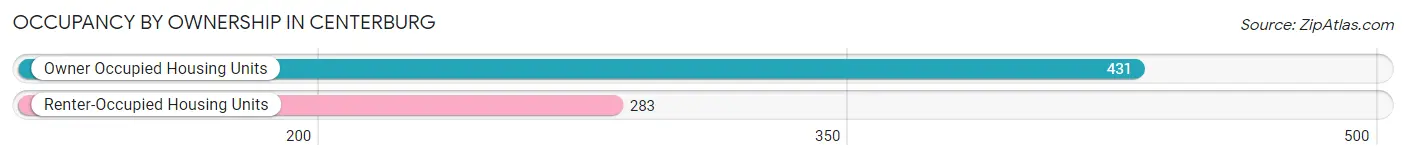
| Occupancy | # Housing Units | % Housing Units |
| Owner Occupied Housing Units | 431 | 60.4% |
| Renter-Occupied Housing Units | 283 | 39.6% |
| Total Occupied Housing Units | 714 | 100.0% |
Occupancy by Household Size in Centerburg
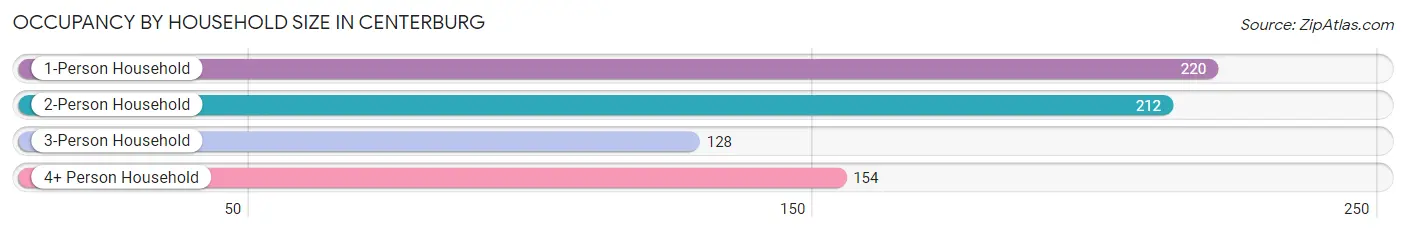
| Household Size | # Housing Units | % Housing Units |
| 1-Person Household | 220 | 30.8% |
| 2-Person Household | 212 | 29.7% |
| 3-Person Household | 128 | 17.9% |
| 4+ Person Household | 154 | 21.6% |
| Total Housing Units | 714 | 100.0% |
Occupancy by Ownership by Household Size in Centerburg
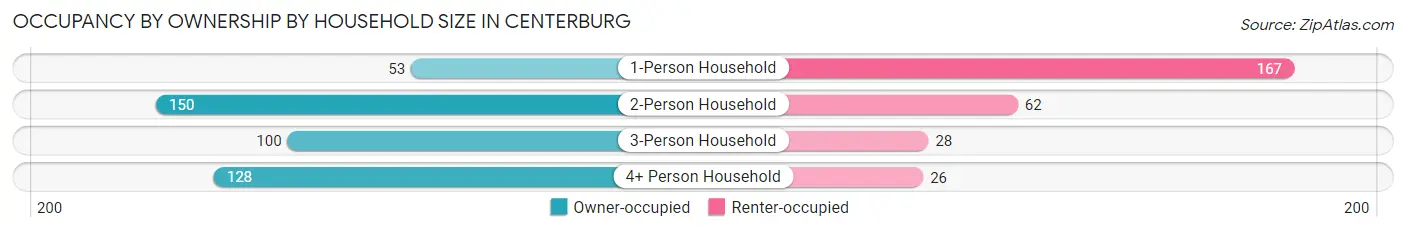
| Household Size | Owner-occupied | Renter-occupied |
| 1-Person Household | 53 (24.1%) | 167 (75.9%) |
| 2-Person Household | 150 (70.8%) | 62 (29.2%) |
| 3-Person Household | 100 (78.1%) | 28 (21.9%) |
| 4+ Person Household | 128 (83.1%) | 26 (16.9%) |
| Total Housing Units | 431 (60.4%) | 283 (39.6%) |
Occupancy by Educational Attainment in Centerburg
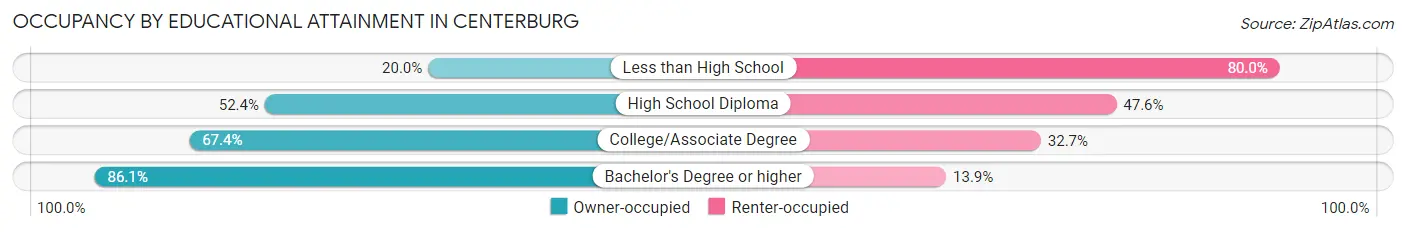
| Household Size | Owner-occupied | Renter-occupied |
| Less than High School | 16 (20.0%) | 64 (80.0%) |
| High School Diploma | 132 (52.4%) | 120 (47.6%) |
| College/Associate Degree | 165 (67.3%) | 80 (32.7%) |
| Bachelor's Degree or higher | 118 (86.1%) | 19 (13.9%) |
Occupancy by Age of Householder in Centerburg
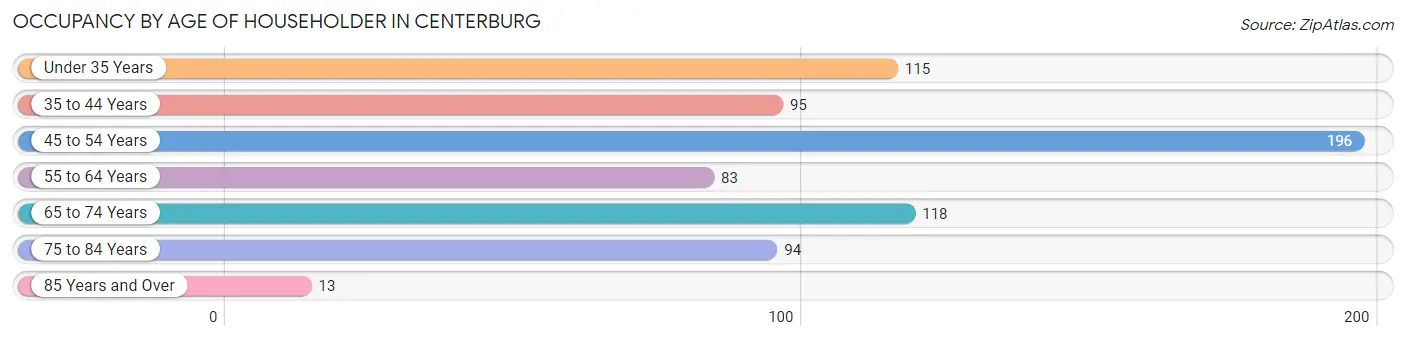
| Age Bracket | # Households | % Households |
| Under 35 Years | 115 | 16.1% |
| 35 to 44 Years | 95 | 13.3% |
| 45 to 54 Years | 196 | 27.5% |
| 55 to 64 Years | 83 | 11.6% |
| 65 to 74 Years | 118 | 16.5% |
| 75 to 84 Years | 94 | 13.2% |
| 85 Years and Over | 13 | 1.8% |
| Total | 714 | 100.0% |
Housing Finances in Centerburg
Median Income by Occupancy in Centerburg
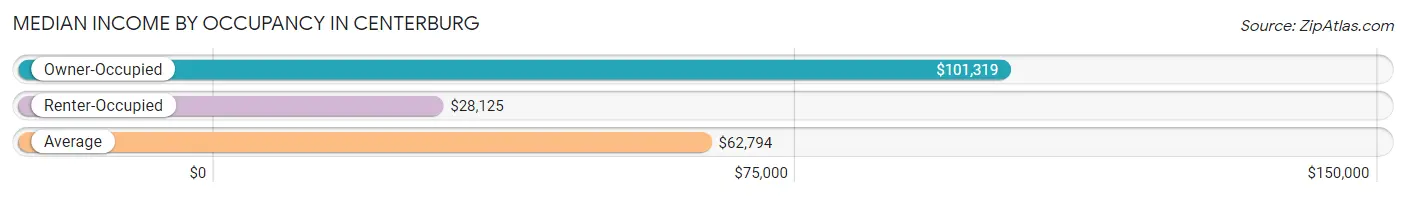
| Occupancy Type | # Households | Median Income |
| Owner-Occupied | 431 (60.4%) | $101,319 |
| Renter-Occupied | 283 (39.6%) | $28,125 |
| Average | 714 (100.0%) | $62,794 |
Occupancy by Householder Income Bracket in Centerburg
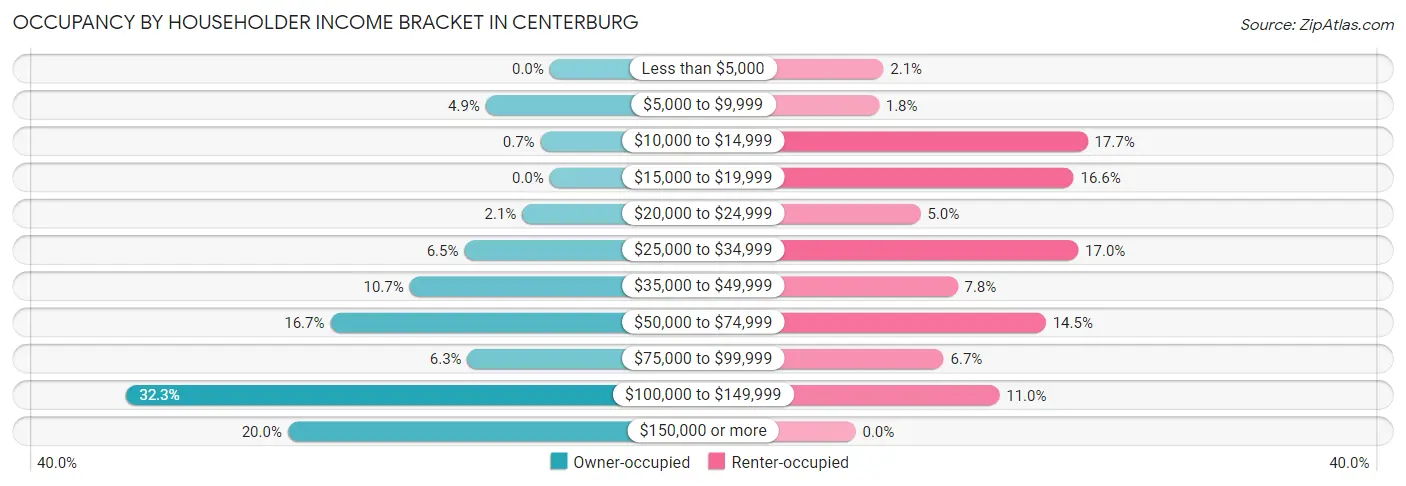
| Income Bracket | Owner-occupied | Renter-occupied |
| Less than $5,000 | 0 (0.0%) | 6 (2.1%) |
| $5,000 to $9,999 | 21 (4.9%) | 5 (1.8%) |
| $10,000 to $14,999 | 3 (0.7%) | 50 (17.7%) |
| $15,000 to $19,999 | 0 (0.0%) | 47 (16.6%) |
| $20,000 to $24,999 | 9 (2.1%) | 14 (5.0%) |
| $25,000 to $34,999 | 28 (6.5%) | 48 (17.0%) |
| $35,000 to $49,999 | 46 (10.7%) | 22 (7.8%) |
| $50,000 to $74,999 | 72 (16.7%) | 41 (14.5%) |
| $75,000 to $99,999 | 27 (6.3%) | 19 (6.7%) |
| $100,000 to $149,999 | 139 (32.3%) | 31 (11.0%) |
| $150,000 or more | 86 (20.0%) | 0 (0.0%) |
| Total | 431 (100.0%) | 283 (100.0%) |
Monthly Housing Cost Tiers in Centerburg
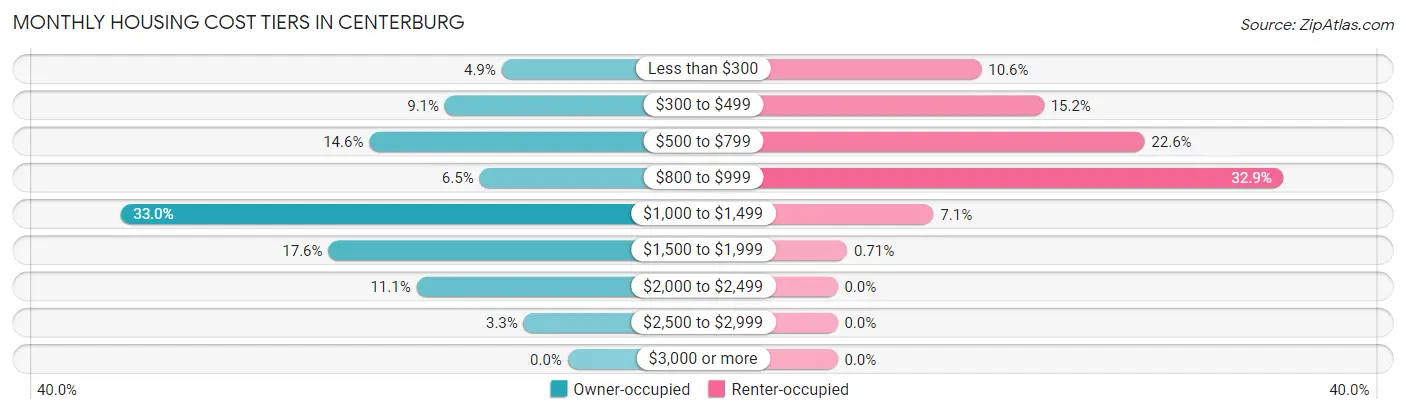
| Monthly Cost | Owner-occupied | Renter-occupied |
| Less than $300 | 21 (4.9%) | 30 (10.6%) |
| $300 to $499 | 39 (9.0%) | 43 (15.2%) |
| $500 to $799 | 63 (14.6%) | 64 (22.6%) |
| $800 to $999 | 28 (6.5%) | 93 (32.9%) |
| $1,000 to $1,499 | 142 (33.0%) | 20 (7.1%) |
| $1,500 to $1,999 | 76 (17.6%) | 2 (0.7%) |
| $2,000 to $2,499 | 48 (11.1%) | 0 (0.0%) |
| $2,500 to $2,999 | 14 (3.3%) | 0 (0.0%) |
| $3,000 or more | 0 (0.0%) | 0 (0.0%) |
| Total | 431 (100.0%) | 283 (100.0%) |
Physical Housing Characteristics in Centerburg
Housing Structures in Centerburg
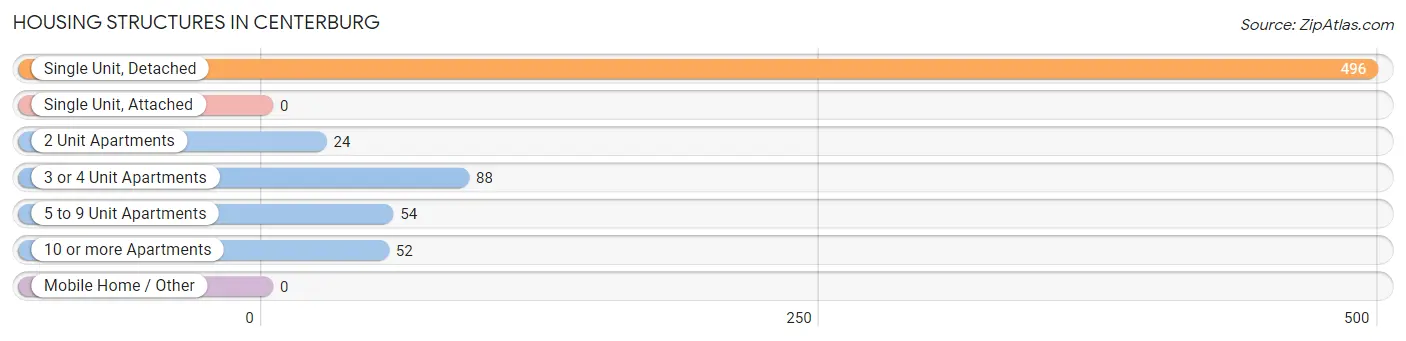
| Structure Type | # Housing Units | % Housing Units |
| Single Unit, Detached | 496 | 69.5% |
| Single Unit, Attached | 0 | 0.0% |
| 2 Unit Apartments | 24 | 3.4% |
| 3 or 4 Unit Apartments | 88 | 12.3% |
| 5 to 9 Unit Apartments | 54 | 7.6% |
| 10 or more Apartments | 52 | 7.3% |
| Mobile Home / Other | 0 | 0.0% |
| Total | 714 | 100.0% |
Housing Structures by Occupancy in Centerburg
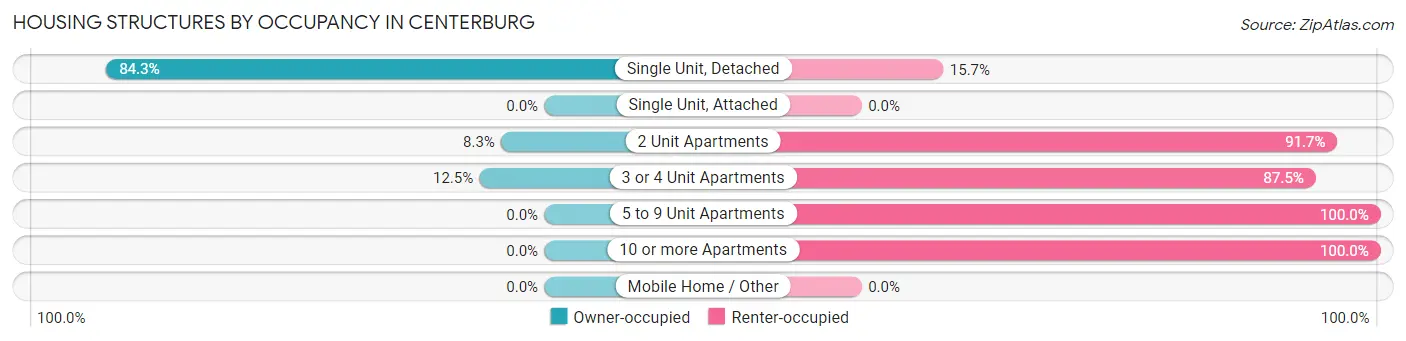
| Structure Type | Owner-occupied | Renter-occupied |
| Single Unit, Detached | 418 (84.3%) | 78 (15.7%) |
| Single Unit, Attached | 0 (0.0%) | 0 (0.0%) |
| 2 Unit Apartments | 2 (8.3%) | 22 (91.7%) |
| 3 or 4 Unit Apartments | 11 (12.5%) | 77 (87.5%) |
| 5 to 9 Unit Apartments | 0 (0.0%) | 54 (100.0%) |
| 10 or more Apartments | 0 (0.0%) | 52 (100.0%) |
| Mobile Home / Other | 0 (0.0%) | 0 (0.0%) |
| Total | 431 (60.4%) | 283 (39.6%) |
Housing Structures by Number of Rooms in Centerburg
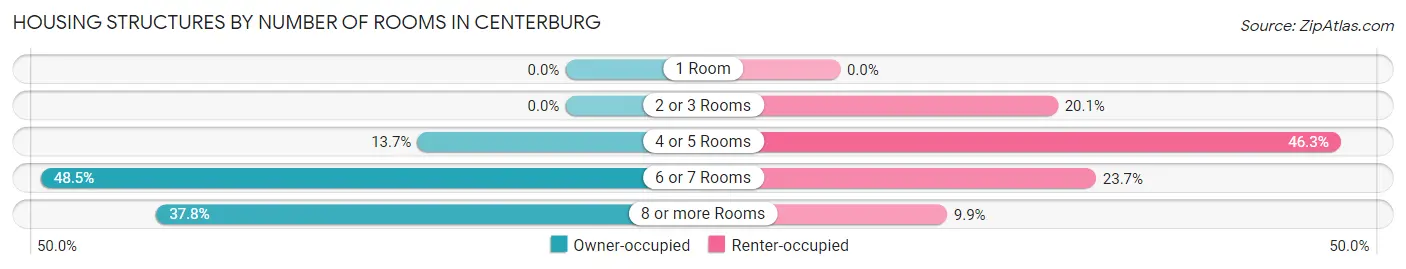
| Number of Rooms | Owner-occupied | Renter-occupied |
| 1 Room | 0 (0.0%) | 0 (0.0%) |
| 2 or 3 Rooms | 0 (0.0%) | 57 (20.1%) |
| 4 or 5 Rooms | 59 (13.7%) | 131 (46.3%) |
| 6 or 7 Rooms | 209 (48.5%) | 67 (23.7%) |
| 8 or more Rooms | 163 (37.8%) | 28 (9.9%) |
| Total | 431 (100.0%) | 283 (100.0%) |
Housing Structure by Heating Type in Centerburg
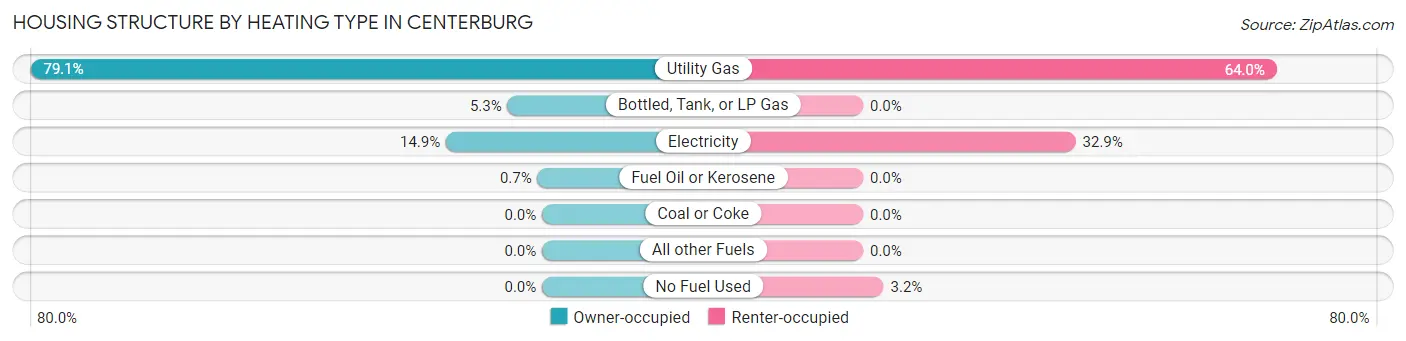
| Heating Type | Owner-occupied | Renter-occupied |
| Utility Gas | 341 (79.1%) | 181 (64.0%) |
| Bottled, Tank, or LP Gas | 23 (5.3%) | 0 (0.0%) |
| Electricity | 64 (14.8%) | 93 (32.9%) |
| Fuel Oil or Kerosene | 3 (0.7%) | 0 (0.0%) |
| Coal or Coke | 0 (0.0%) | 0 (0.0%) |
| All other Fuels | 0 (0.0%) | 0 (0.0%) |
| No Fuel Used | 0 (0.0%) | 9 (3.2%) |
| Total | 431 (100.0%) | 283 (100.0%) |
Household Vehicle Usage in Centerburg
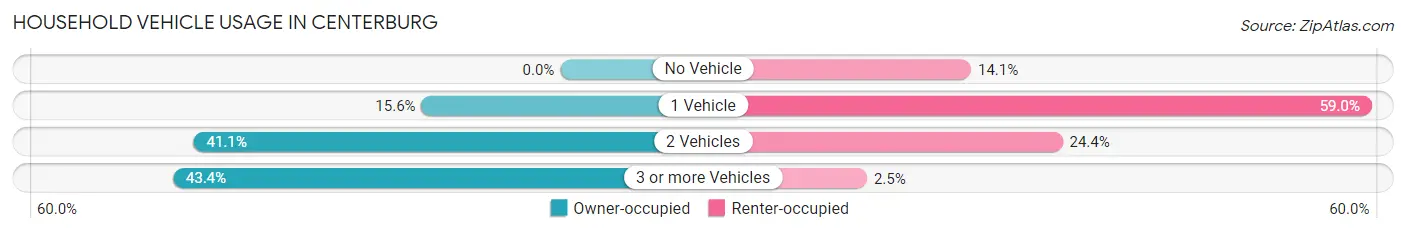
| Vehicles per Household | Owner-occupied | Renter-occupied |
| No Vehicle | 0 (0.0%) | 40 (14.1%) |
| 1 Vehicle | 67 (15.5%) | 167 (59.0%) |
| 2 Vehicles | 177 (41.1%) | 69 (24.4%) |
| 3 or more Vehicles | 187 (43.4%) | 7 (2.5%) |
| Total | 431 (100.0%) | 283 (100.0%) |
Real Estate & Mortgages in Centerburg
Real Estate and Mortgage Overview in Centerburg
| Characteristic | Without Mortgage | With Mortgage |
| Housing Units | 126 | 305 |
| Median Property Value | $208,600 | $220,100 |
| Median Household Income | $51,042 | $83 |
| Monthly Housing Costs | $540 | $0 |
| Real Estate Taxes | $1,938 | $4 |
Property Value by Mortgage Status in Centerburg
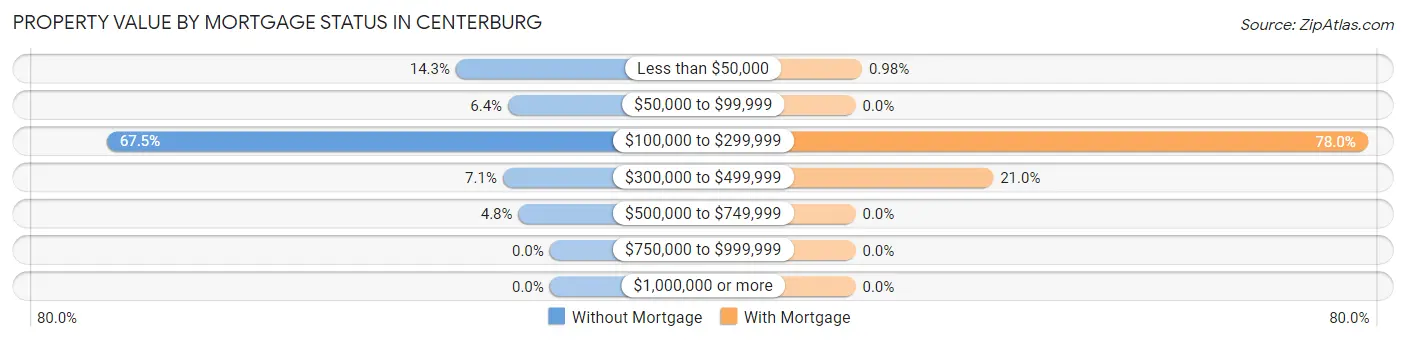
| Property Value | Without Mortgage | With Mortgage |
| Less than $50,000 | 18 (14.3%) | 3 (1.0%) |
| $50,000 to $99,999 | 8 (6.4%) | 0 (0.0%) |
| $100,000 to $299,999 | 85 (67.5%) | 238 (78.0%) |
| $300,000 to $499,999 | 9 (7.1%) | 64 (21.0%) |
| $500,000 to $749,999 | 6 (4.8%) | 0 (0.0%) |
| $750,000 to $999,999 | 0 (0.0%) | 0 (0.0%) |
| $1,000,000 or more | 0 (0.0%) | 0 (0.0%) |
| Total | 126 (100.0%) | 305 (100.0%) |
Household Income by Mortgage Status in Centerburg
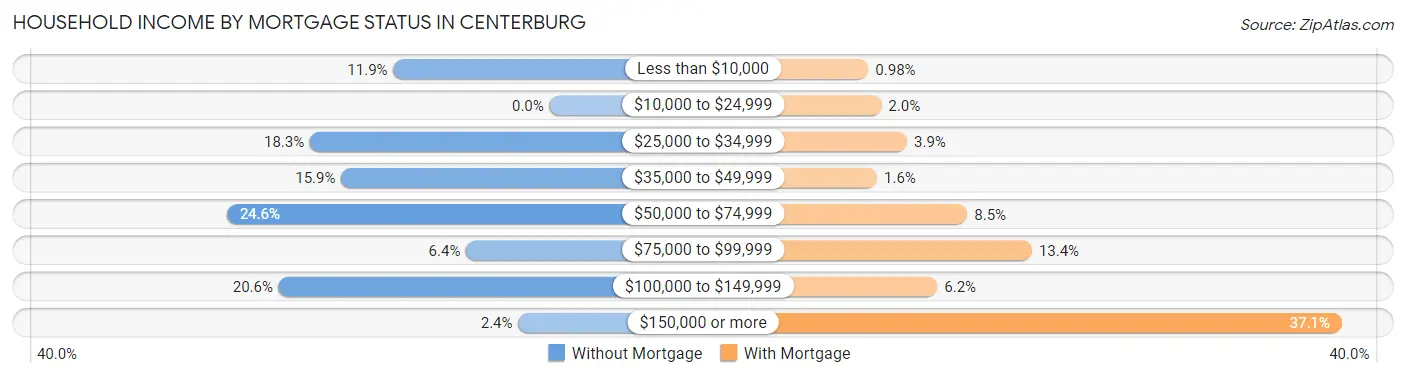
| Household Income | Without Mortgage | With Mortgage |
| Less than $10,000 | 15 (11.9%) | 3 (1.0%) |
| $10,000 to $24,999 | 0 (0.0%) | 6 (2.0%) |
| $25,000 to $34,999 | 23 (18.2%) | 12 (3.9%) |
| $35,000 to $49,999 | 20 (15.9%) | 5 (1.6%) |
| $50,000 to $74,999 | 31 (24.6%) | 26 (8.5%) |
| $75,000 to $99,999 | 8 (6.4%) | 41 (13.4%) |
| $100,000 to $149,999 | 26 (20.6%) | 19 (6.2%) |
| $150,000 or more | 3 (2.4%) | 113 (37.0%) |
| Total | 126 (100.0%) | 305 (100.0%) |
Property Value to Household Income Ratio in Centerburg
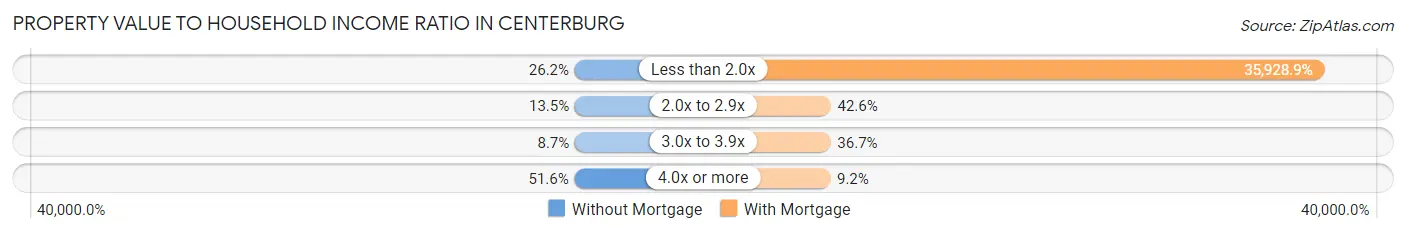
| Value-to-Income Ratio | Without Mortgage | With Mortgage |
| Less than 2.0x | 33 (26.2%) | 109,583 (35,928.8%) |
| 2.0x to 2.9x | 17 (13.5%) | 130 (42.6%) |
| 3.0x to 3.9x | 11 (8.7%) | 112 (36.7%) |
| 4.0x or more | 65 (51.6%) | 28 (9.2%) |
| Total | 126 (100.0%) | 305 (100.0%) |
Real Estate Taxes by Mortgage Status in Centerburg

| Property Taxes | Without Mortgage | With Mortgage |
| Less than $800 | 19 (15.1%) | 0 (0.0%) |
| $800 to $1,499 | 16 (12.7%) | 10 (3.3%) |
| $800 to $1,499 | 84 (66.7%) | 78 (25.6%) |
| Total | 126 (100.0%) | 305 (100.0%) |
Health & Disability in Centerburg
Health Insurance Coverage by Age in Centerburg
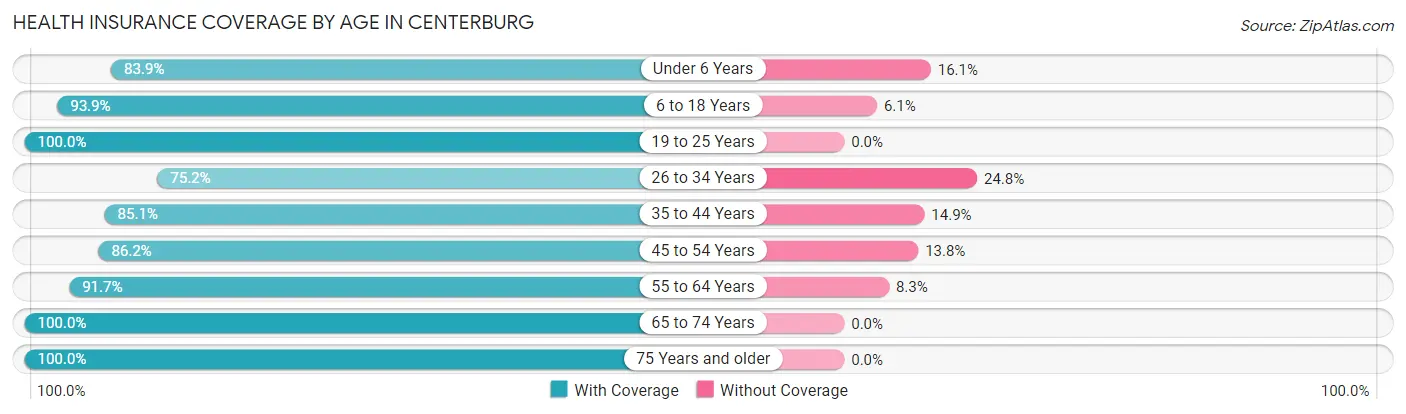
| Age Bracket | With Coverage | Without Coverage |
| Under 6 Years | 182 (83.9%) | 35 (16.1%) |
| 6 to 18 Years | 277 (93.9%) | 18 (6.1%) |
| 19 to 25 Years | 93 (100.0%) | 0 (0.0%) |
| 26 to 34 Years | 155 (75.2%) | 51 (24.8%) |
| 35 to 44 Years | 148 (85.1%) | 26 (14.9%) |
| 45 to 54 Years | 244 (86.2%) | 39 (13.8%) |
| 55 to 64 Years | 143 (91.7%) | 13 (8.3%) |
| 65 to 74 Years | 166 (100.0%) | 0 (0.0%) |
| 75 Years and older | 164 (100.0%) | 0 (0.0%) |
| Total | 1,572 (89.6%) | 182 (10.4%) |
Health Insurance Coverage by Citizenship Status in Centerburg

| Citizenship Status | With Coverage | Without Coverage |
| Native Born | 182 (83.9%) | 35 (16.1%) |
| Foreign Born, Citizen | 277 (93.9%) | 18 (6.1%) |
| Foreign Born, not a Citizen | 93 (100.0%) | 0 (0.0%) |
Health Insurance Coverage by Household Income in Centerburg
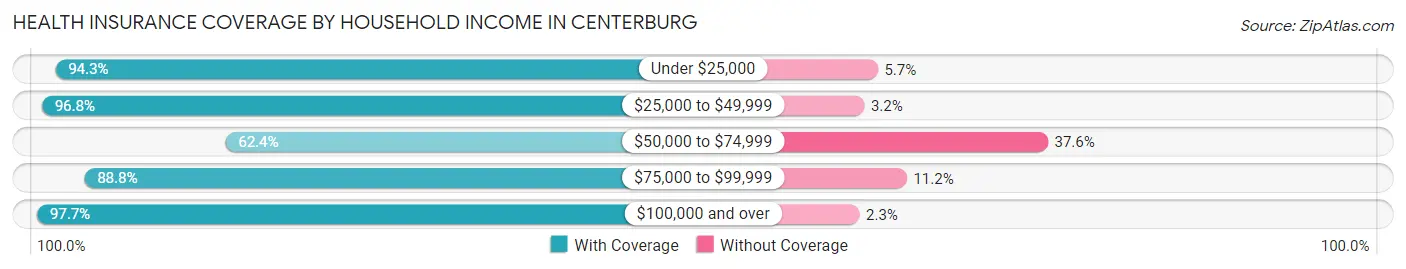
| Household Income | With Coverage | Without Coverage |
| Under $25,000 | 197 (94.3%) | 12 (5.7%) |
| $25,000 to $49,999 | 271 (96.8%) | 9 (3.2%) |
| $50,000 to $74,999 | 209 (62.4%) | 126 (37.6%) |
| $75,000 to $99,999 | 135 (88.8%) | 17 (11.2%) |
| $100,000 and over | 760 (97.7%) | 18 (2.3%) |
Public vs Private Health Insurance Coverage by Age in Centerburg
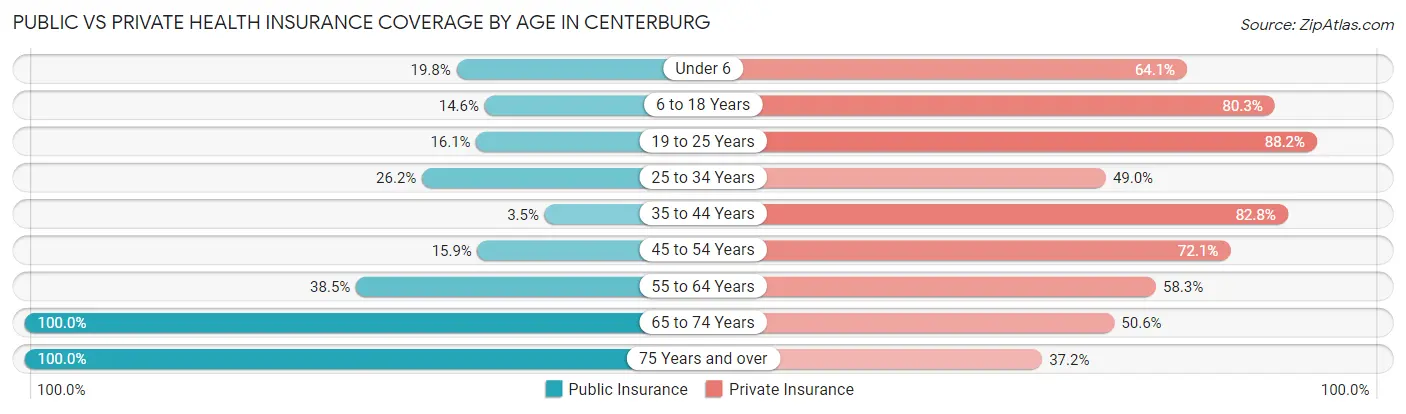
| Age Bracket | Public Insurance | Private Insurance |
| Under 6 | 43 (19.8%) | 139 (64.1%) |
| 6 to 18 Years | 43 (14.6%) | 237 (80.3%) |
| 19 to 25 Years | 15 (16.1%) | 82 (88.2%) |
| 25 to 34 Years | 54 (26.2%) | 101 (49.0%) |
| 35 to 44 Years | 6 (3.5%) | 144 (82.8%) |
| 45 to 54 Years | 45 (15.9%) | 204 (72.1%) |
| 55 to 64 Years | 60 (38.5%) | 91 (58.3%) |
| 65 to 74 Years | 166 (100.0%) | 84 (50.6%) |
| 75 Years and over | 164 (100.0%) | 61 (37.2%) |
| Total | 596 (34.0%) | 1,143 (65.2%) |
Disability Status by Sex by Age in Centerburg
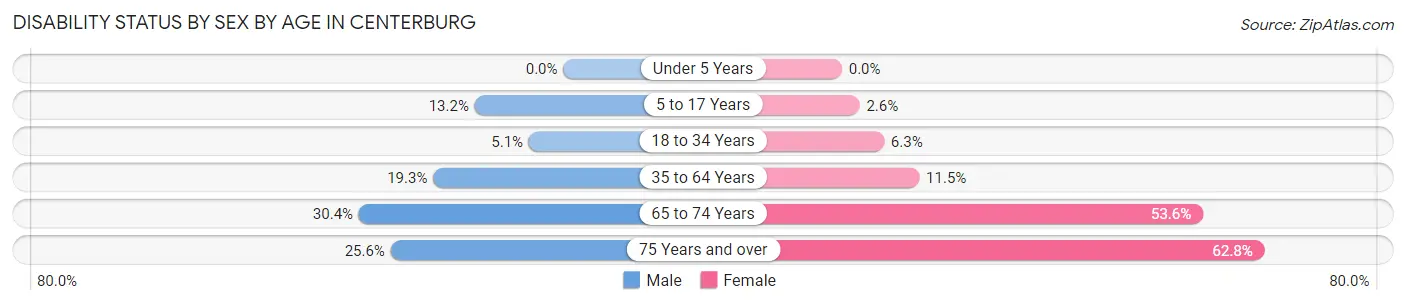
| Age Bracket | Male | Female |
| Under 5 Years | 0 (0.0%) | 0 (0.0%) |
| 5 to 17 Years | 20 (13.2%) | 3 (2.6%) |
| 18 to 34 Years | 9 (5.1%) | 10 (6.2%) |
| 35 to 64 Years | 68 (19.3%) | 30 (11.5%) |
| 65 to 74 Years | 17 (30.4%) | 59 (53.6%) |
| 75 Years and over | 20 (25.6%) | 54 (62.8%) |
Disability Class by Sex by Age in Centerburg
Disability Class: Hearing Difficulty
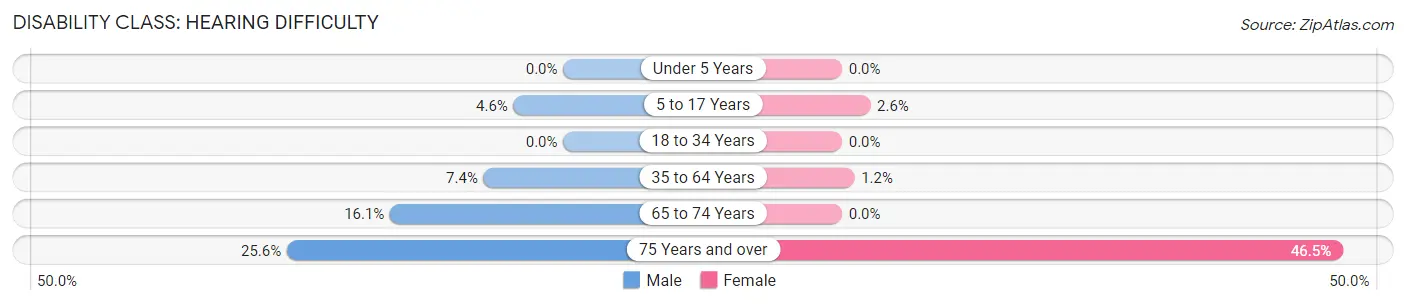
| Age Bracket | Male | Female |
| Under 5 Years | 0 (0.0%) | 0 (0.0%) |
| 5 to 17 Years | 7 (4.6%) | 3 (2.6%) |
| 18 to 34 Years | 0 (0.0%) | 0 (0.0%) |
| 35 to 64 Years | 26 (7.4%) | 3 (1.1%) |
| 65 to 74 Years | 9 (16.1%) | 0 (0.0%) |
| 75 Years and over | 20 (25.6%) | 40 (46.5%) |
Disability Class: Vision Difficulty
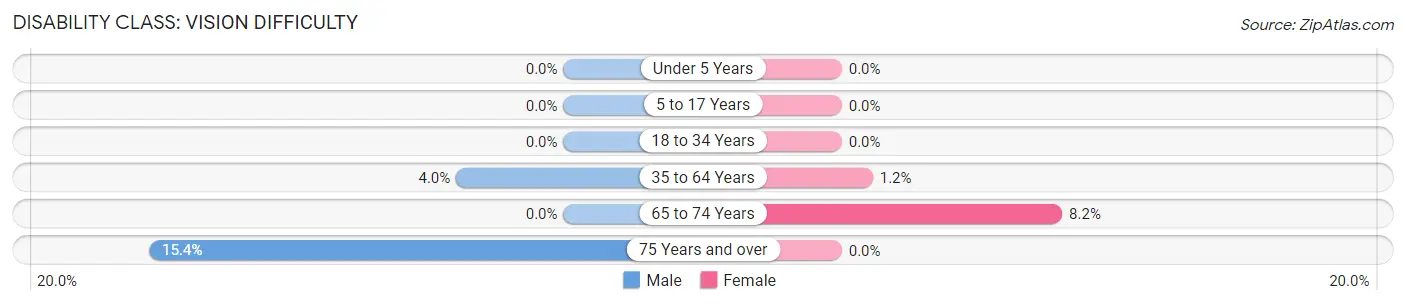
| Age Bracket | Male | Female |
| Under 5 Years | 0 (0.0%) | 0 (0.0%) |
| 5 to 17 Years | 0 (0.0%) | 0 (0.0%) |
| 18 to 34 Years | 0 (0.0%) | 0 (0.0%) |
| 35 to 64 Years | 14 (4.0%) | 3 (1.1%) |
| 65 to 74 Years | 0 (0.0%) | 9 (8.2%) |
| 75 Years and over | 12 (15.4%) | 0 (0.0%) |
Disability Class: Cognitive Difficulty
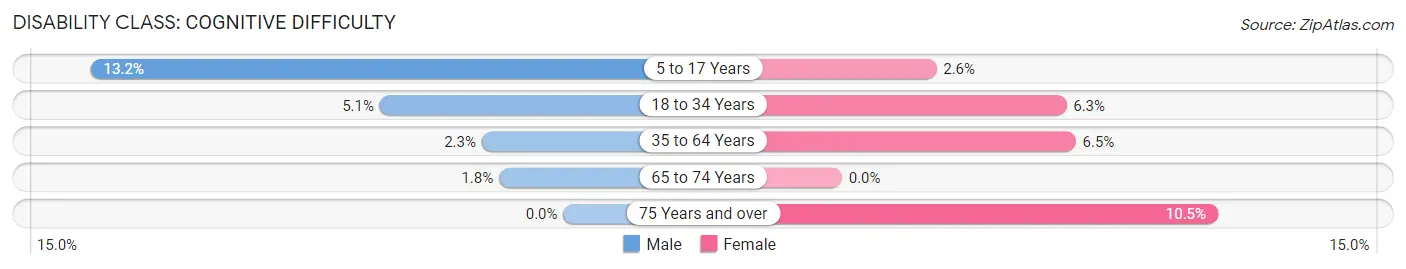
| Age Bracket | Male | Female |
| 5 to 17 Years | 20 (13.2%) | 3 (2.6%) |
| 18 to 34 Years | 9 (5.1%) | 10 (6.2%) |
| 35 to 64 Years | 8 (2.3%) | 17 (6.5%) |
| 65 to 74 Years | 1 (1.8%) | 0 (0.0%) |
| 75 Years and over | 0 (0.0%) | 9 (10.5%) |
Disability Class: Ambulatory Difficulty
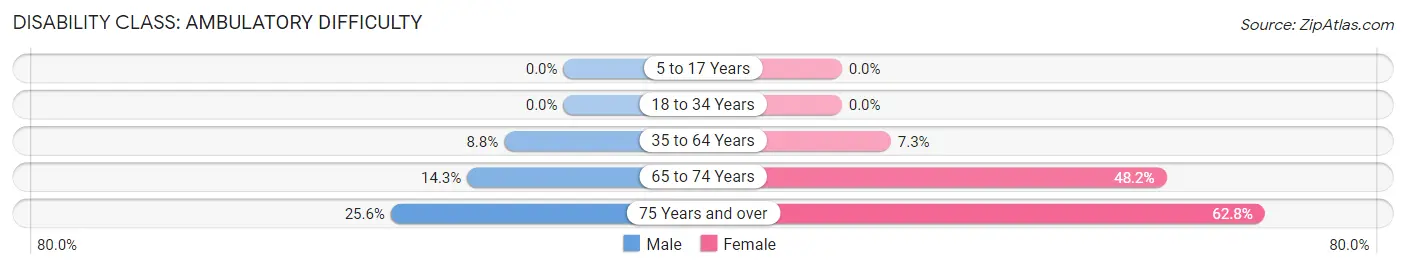
| Age Bracket | Male | Female |
| 5 to 17 Years | 0 (0.0%) | 0 (0.0%) |
| 18 to 34 Years | 0 (0.0%) | 0 (0.0%) |
| 35 to 64 Years | 31 (8.8%) | 19 (7.3%) |
| 65 to 74 Years | 8 (14.3%) | 53 (48.2%) |
| 75 Years and over | 20 (25.6%) | 54 (62.8%) |
Disability Class: Self-Care Difficulty
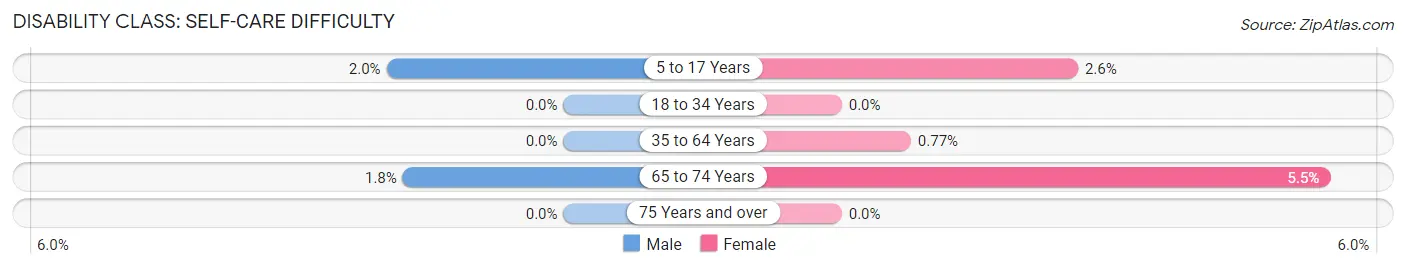
| Age Bracket | Male | Female |
| 5 to 17 Years | 3 (2.0%) | 3 (2.6%) |
| 18 to 34 Years | 0 (0.0%) | 0 (0.0%) |
| 35 to 64 Years | 0 (0.0%) | 2 (0.8%) |
| 65 to 74 Years | 1 (1.8%) | 6 (5.4%) |
| 75 Years and over | 0 (0.0%) | 0 (0.0%) |
Technology Access in Centerburg
Computing Device Access in Centerburg
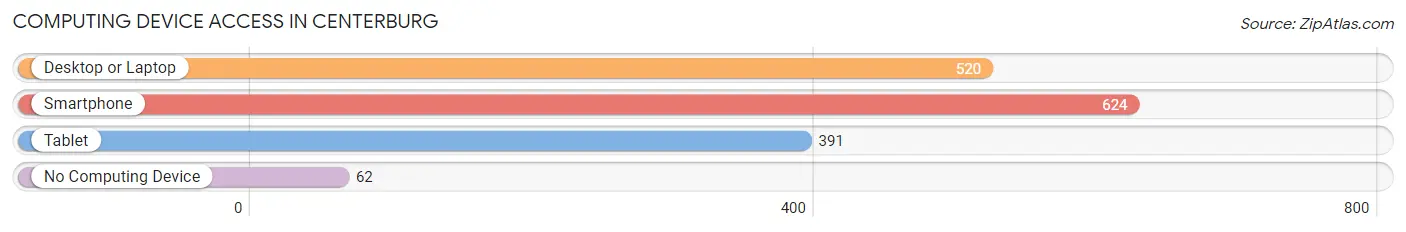
| Device Type | # Households | % Households |
| Desktop or Laptop | 520 | 72.8% |
| Smartphone | 624 | 87.4% |
| Tablet | 391 | 54.8% |
| No Computing Device | 62 | 8.7% |
| Total | 714 | 100.0% |
Internet Access in Centerburg
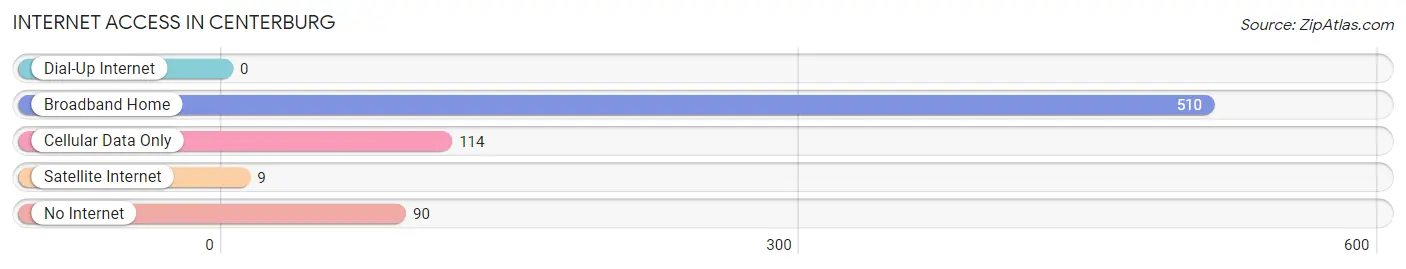
| Internet Type | # Households | % Households |
| Dial-Up Internet | 0 | 0.0% |
| Broadband Home | 510 | 71.4% |
| Cellular Data Only | 114 | 16.0% |
| Satellite Internet | 9 | 1.3% |
| No Internet | 90 | 12.6% |
| Total | 714 | 100.0% |
Centerburg Summary
History
The small village of Centerburg, Ohio is located in Knox County, Ohio, and is part of the Mount Vernon Micropolitan Statistical Area. The village was founded in 1815 by a group of settlers from Pennsylvania, and was originally known as “Centerville”. The name was changed to Centerburg in 1837, and the village was incorporated in 1867.
The village was originally a farming community, and the main crops were wheat, corn, and oats. The village also had a few small businesses, including a sawmill, a gristmill, and a blacksmith shop. The village was also home to a few churches, including the Methodist Episcopal Church, the Presbyterian Church, and the United Brethren Church.
In the late 19th century, the village began to grow and develop. The railroad came to the village in 1881, and the village was connected to the larger cities of Columbus and Cleveland. This allowed the village to become a center for commerce and industry. The village also had a number of factories, including a brickyard, a canning factory, and a furniture factory.
The village continued to grow and develop throughout the 20th century. In the 1950s, the village was home to a number of small businesses, including a grocery store, a hardware store, and a drug store. The village also had a number of churches, including the Methodist Episcopal Church, the Presbyterian Church, and the United Brethren Church.
Geography
Centerburg is located in Knox County, Ohio, and is part of the Mount Vernon Micropolitan Statistical Area. The village is situated on the banks of the Kokosing River, and is surrounded by rolling hills and farmland. The village is located approximately 25 miles east of Columbus, Ohio, and approximately 50 miles north of Cincinnati, Ohio.
The village has a total area of 0.8 square miles, all of which is land. The village is located at an elevation of 890 feet above sea level. The climate in Centerburg is classified as humid continental, with hot summers and cold winters. The average annual temperature is around 50 degrees Fahrenheit, and the average annual precipitation is around 40 inches.
Economy
The economy of Centerburg is largely based on agriculture and small businesses. The village is home to a number of small businesses, including a grocery store, a hardware store, and a drug store. The village also has a number of churches, including the Methodist Episcopal Church, the Presbyterian Church, and the United Brethren Church.
The village is also home to a number of manufacturing companies, including a furniture factory, a canning factory, and a brickyard. The village is also home to a number of farms, which produce a variety of crops, including wheat, corn, and oats.
Demographics
As of the 2010 census, the village of Centerburg had a population of 1,845 people. The population density was 2,323 people per square mile. The racial makeup of the village was 97.3% White, 0.7% African American, 0.2% Native American, 0.2% Asian, 0.1% Pacific Islander, 0.4% from other races, and 1.1% from two or more races. Hispanic or Latino of any race were 1.2% of the population.
The median income for a household in the village was $41,250, and the median income for a family was $50,000. The per capita income for the village was $20,845. About 8.3% of families and 10.2% of the population were below the poverty line, including 14.2% of those under age 18 and 6.2% of those age 65 or over.
Common Questions
What is Per Capita Income in Centerburg?
Per Capita income in Centerburg is $32,381.
What is the Median Family Income in Centerburg?
Median Family Income in Centerburg is $86,771.
What is the Median Household income in Centerburg?
Median Household Income in Centerburg is $62,794.
What is Income or Wage Gap in Centerburg?
Income or Wage Gap in Centerburg is 39.7%.
Women in Centerburg earn 60.3 cents for every dollar earned by a man.
What is Inequality or Gini Index in Centerburg?
Inequality or Gini Index in Centerburg is 0.43.
What is the Total Population of Centerburg?
Total Population of Centerburg is 1,875.
What is the Total Male Population of Centerburg?
Total Male Population of Centerburg is 1,058.
What is the Total Female Population of Centerburg?
Total Female Population of Centerburg is 817.
What is the Ratio of Males per 100 Females in Centerburg?
There are 129.50 Males per 100 Females in Centerburg.
What is the Ratio of Females per 100 Males in Centerburg?
There are 77.22 Females per 100 Males in Centerburg.
What is the Median Population Age in Centerburg?
Median Population Age in Centerburg is 41.6 Years.
What is the Average Family Size in Centerburg
Average Family Size in Centerburg is 3.1 People.
What is the Average Household Size in Centerburg
Average Household Size in Centerburg is 2.5 People.
How Large is the Labor Force in Centerburg?
There are 821 People in the Labor Forcein in Centerburg.
What is the Percentage of People in the Labor Force in Centerburg?
56.8% of People are in the Labor Force in Centerburg.
What is the Unemployment Rate in Centerburg?
Unemployment Rate in Centerburg is 2.7%.