Carbon Hill, OH Map & Demographics
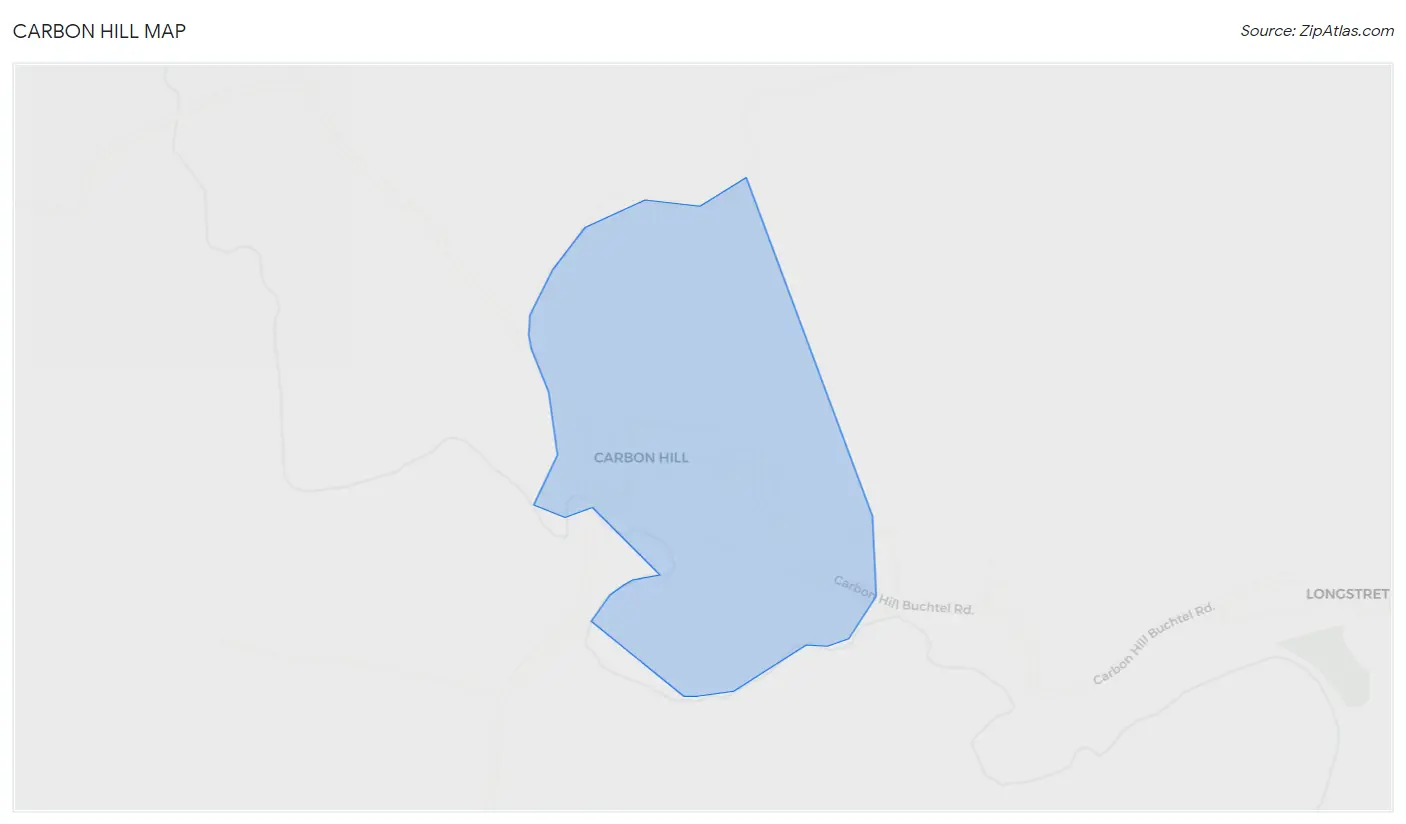
Carbon Hill Map
Carbon Hill Overview
$26,307
PER CAPITA INCOME
$78,667
AVG FAMILY INCOME
$78,667
AVG HOUSEHOLD INCOME
0.13
INEQUALITY / GINI INDEX
117
TOTAL POPULATION
63
MALE POPULATION
54
FEMALE POPULATION
116.67
MALES / 100 FEMALES
85.71
FEMALES / 100 MALES
52.5
MEDIAN AGE
2.2
AVG FAMILY SIZE
2.2
AVG HOUSEHOLD SIZE
79
LABOR FORCE [ PEOPLE ]
74.5%
PERCENT IN LABOR FORCE
12.7%
UNEMPLOYMENT RATE
Carbon Hill Zip Codes
Carbon Hill Area Codes
Income in Carbon Hill
Income Overview in Carbon Hill
Per Capita Income in Carbon Hill is $26,307, while median incomes of families and households are $78,667 and $78,667 respectively.
| Characteristic | Number | Measure |
| Per Capita Income | 117 | $26,307 |
| Median Family Income | 52 | $78,667 |
| Mean Family Income | 52 | $68,108 |
| Median Household Income | 52 | $78,667 |
| Mean Household Income | 52 | $68,108 |
| Income Deficit | 52 | $0 |
| Wage / Income Gap (%) | 117 | 0.00% |
| Wage / Income Gap ($) | 117 | 100.00¢ per $1 |
| Gini / Inequality Index | 117 | 0.13 |
Earnings by Sex in Carbon Hill
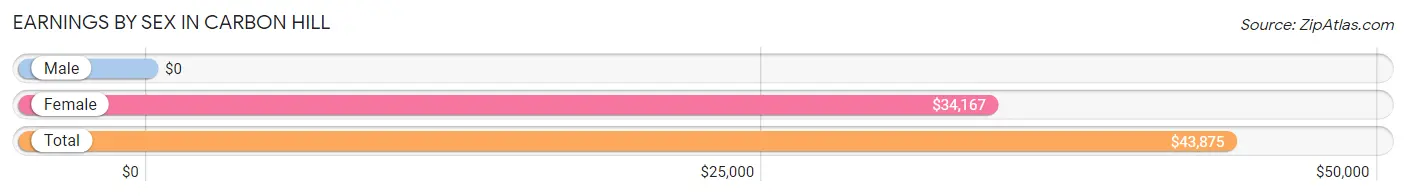
| Sex | Number | Average Earnings |
| Male | 41 (59.4%) | $0 |
| Female | 28 (40.6%) | $34,167 |
| Total | 69 (100.0%) | $43,875 |
Earnings by Sex by Income Bracket in Carbon Hill
The most common earnings brackets in Carbon Hill are $55,000 to $64,999 for men (30 | 73.2%) and $30,000 to $34,999 for women (12 | 42.9%).
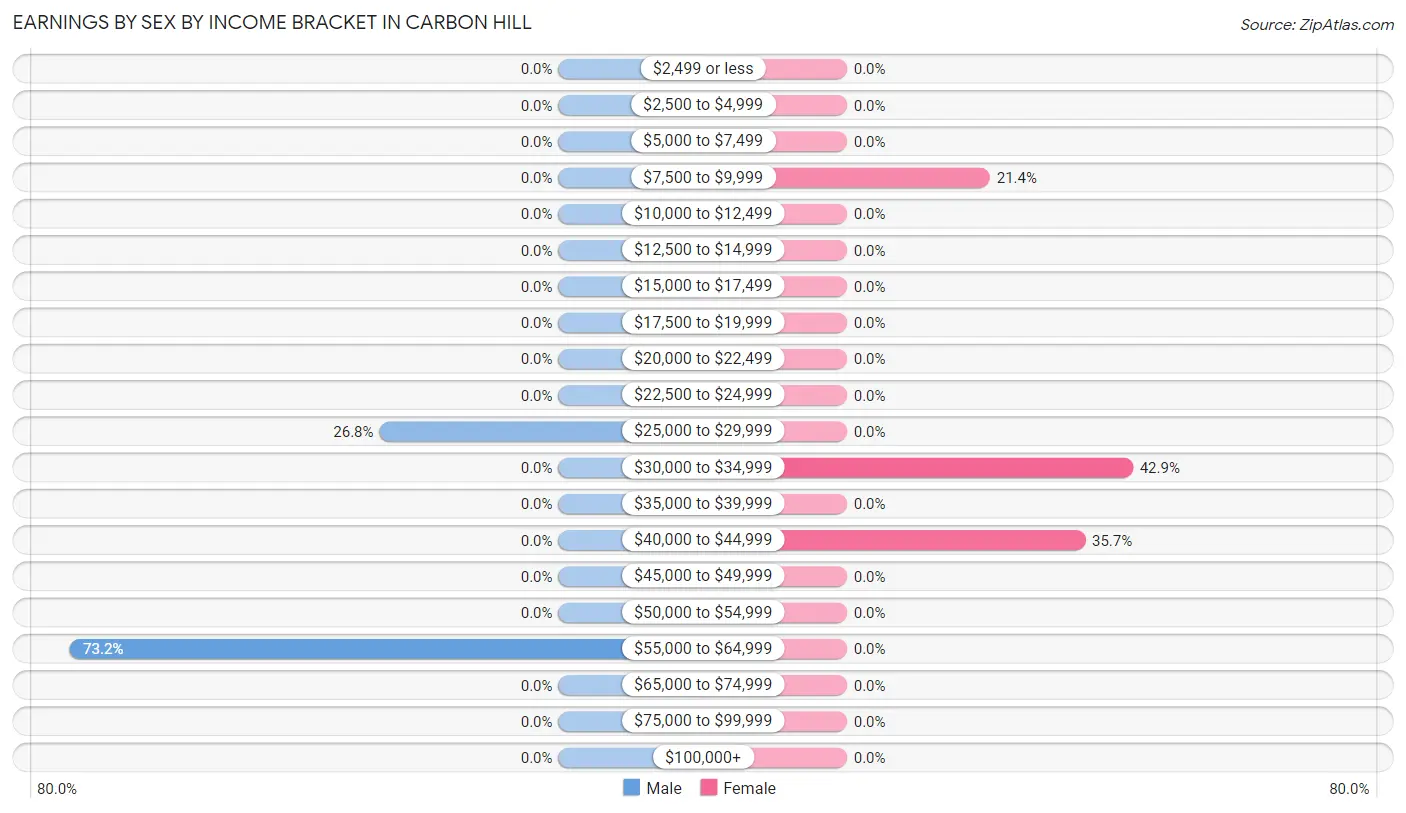
| Income | Male | Female |
| $2,499 or less | 0 (0.0%) | 0 (0.0%) |
| $2,500 to $4,999 | 0 (0.0%) | 0 (0.0%) |
| $5,000 to $7,499 | 0 (0.0%) | 0 (0.0%) |
| $7,500 to $9,999 | 0 (0.0%) | 6 (21.4%) |
| $10,000 to $12,499 | 0 (0.0%) | 0 (0.0%) |
| $12,500 to $14,999 | 0 (0.0%) | 0 (0.0%) |
| $15,000 to $17,499 | 0 (0.0%) | 0 (0.0%) |
| $17,500 to $19,999 | 0 (0.0%) | 0 (0.0%) |
| $20,000 to $22,499 | 0 (0.0%) | 0 (0.0%) |
| $22,500 to $24,999 | 0 (0.0%) | 0 (0.0%) |
| $25,000 to $29,999 | 11 (26.8%) | 0 (0.0%) |
| $30,000 to $34,999 | 0 (0.0%) | 12 (42.9%) |
| $35,000 to $39,999 | 0 (0.0%) | 0 (0.0%) |
| $40,000 to $44,999 | 0 (0.0%) | 10 (35.7%) |
| $45,000 to $49,999 | 0 (0.0%) | 0 (0.0%) |
| $50,000 to $54,999 | 0 (0.0%) | 0 (0.0%) |
| $55,000 to $64,999 | 30 (73.2%) | 0 (0.0%) |
| $65,000 to $74,999 | 0 (0.0%) | 0 (0.0%) |
| $75,000 to $99,999 | 0 (0.0%) | 0 (0.0%) |
| $100,000+ | 0 (0.0%) | 0 (0.0%) |
| Total | 41 (100.0%) | 28 (100.0%) |
Earnings by Sex by Educational Attainment in Carbon Hill
| Educational Attainment | Male Income | Female Income |
| Less than High School | - | - |
| High School Diploma | - | - |
| College or Associate's Degree | - | - |
| Bachelor's Degree | - | - |
| Graduate Degree | - | - |
| Total | - | - |
Family Income in Carbon Hill
Family Income Brackets in Carbon Hill
According to the Carbon Hill family income data, there are 40 families falling into the $75,000 to $99,999 income range, which is the most common income bracket and makes up 76.9% of all families.
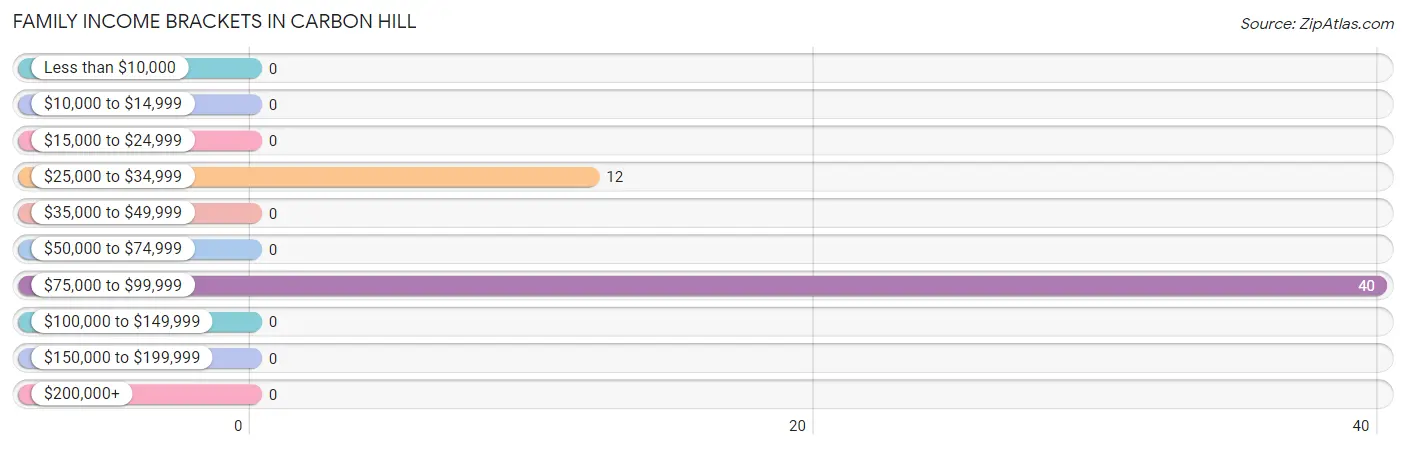
| Income Bracket | # Families | % Families |
| Less than $10,000 | 0 | 0.0% |
| $10,000 to $14,999 | 0 | 0.0% |
| $15,000 to $24,999 | 0 | 0.0% |
| $25,000 to $34,999 | 12 | 23.1% |
| $35,000 to $49,999 | 0 | 0.0% |
| $50,000 to $74,999 | 0 | 0.0% |
| $75,000 to $99,999 | 40 | 76.9% |
| $100,000 to $149,999 | 0 | 0.0% |
| $150,000 to $199,999 | 0 | 0.0% |
| $200,000+ | 0 | 0.0% |
Family Income by Famaliy Size in Carbon Hill
| Income Bracket | # Families | Median Income |
| 2-Person Families | 0 (0.0%) | $0 |
| 3-Person Families | 22 (42.3%) | $0 |
| 4-Person Families | 30 (57.7%) | $0 |
| 5-Person Families | 0 (0.0%) | $0 |
| 6-Person Families | 0 (0.0%) | $0 |
| 7+ Person Families | 0 (0.0%) | $0 |
| Total | 52 (100.0%) | $78,667 |
Family Income by Number of Earners in Carbon Hill
| Number of Earners | # Families | Median Income |
| No Earners | 0 (0.0%) | $0 |
| 1 Earner | 12 (23.1%) | $0 |
| 2 Earners | 40 (76.9%) | $0 |
| 3+ Earners | 0 (0.0%) | $0 |
| Total | 52 (100.0%) | $78,667 |
Household Income in Carbon Hill
Household Income Brackets in Carbon Hill
With 40 households falling in the category, the $75,000 to $99,999 income range is the most frequent in Carbon Hill, accounting for 76.9% of all households.
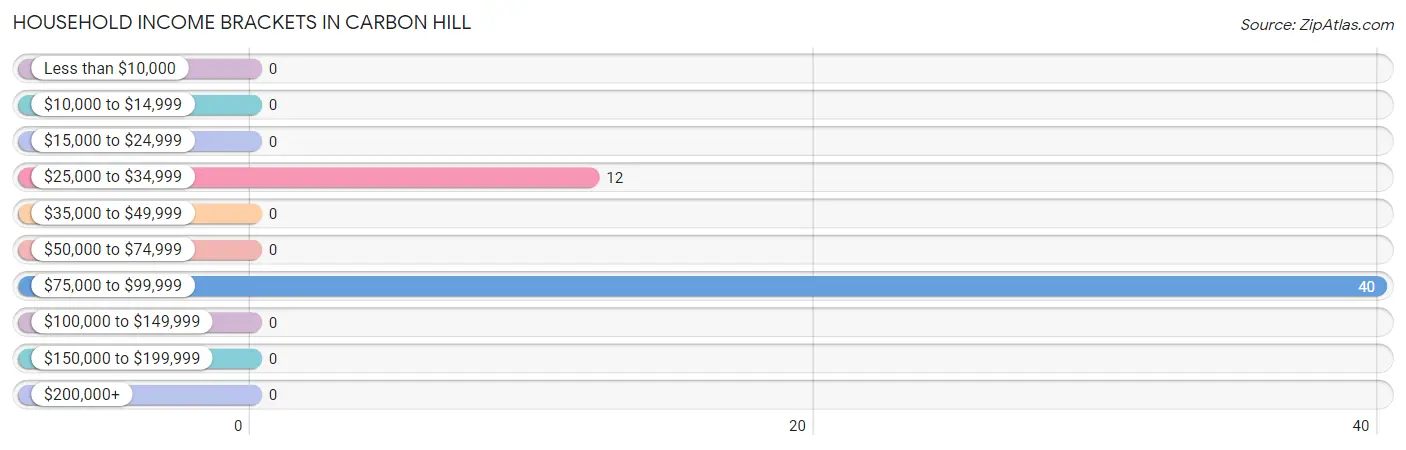
| Income Bracket | # Households | % Households |
| Less than $10,000 | 0 | 0.0% |
| $10,000 to $14,999 | 0 | 0.0% |
| $15,000 to $24,999 | 0 | 0.0% |
| $25,000 to $34,999 | 12 | 23.1% |
| $35,000 to $49,999 | 0 | 0.0% |
| $50,000 to $74,999 | 0 | 0.0% |
| $75,000 to $99,999 | 40 | 76.9% |
| $100,000 to $149,999 | 0 | 0.0% |
| $150,000 to $199,999 | 0 | 0.0% |
| $200,000+ | 0 | 0.0% |
Household Income by Householder Age in Carbon Hill
The median household income in Carbon Hill is $78,667, with the highest median household income of $78,667 found in the 45 to 64 years age bracket for the primary householder. A total of 52 households (100.0%) fall into this category.
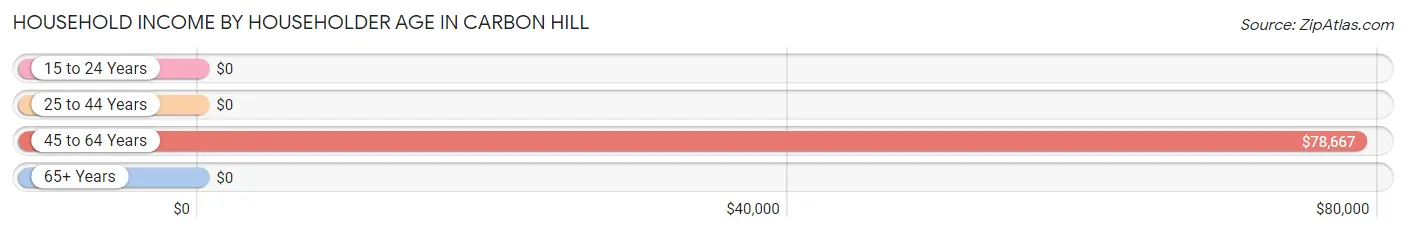
| Income Bracket | # Households | Median Income |
| 15 to 24 Years | 0 (0.0%) | $0 |
| 25 to 44 Years | 0 (0.0%) | $0 |
| 45 to 64 Years | 52 (100.0%) | $78,667 |
| 65+ Years | 0 (0.0%) | $0 |
| Total | 52 (100.0%) | $78,667 |
Poverty in Carbon Hill
Income Below Poverty by Sex and Age in Carbon Hill
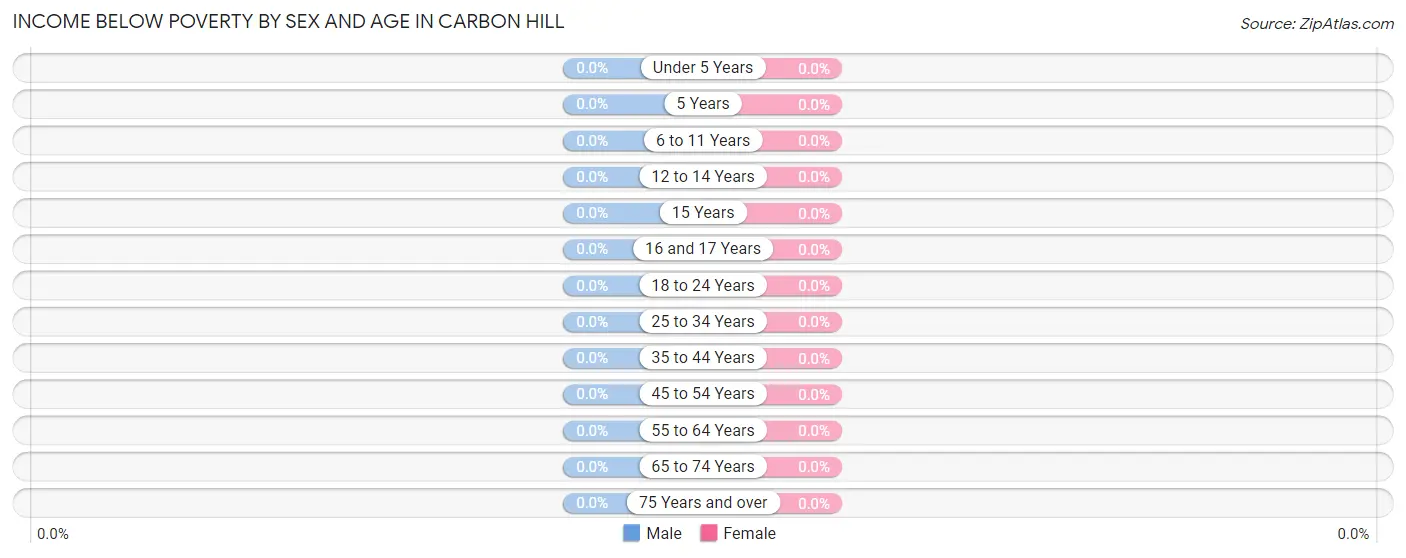
| Age Bracket | Male | Female |
| Under 5 Years | 0 (0.0%) | 0 (0.0%) |
| 5 Years | 0 (0.0%) | 0 (0.0%) |
| 6 to 11 Years | 0 (0.0%) | 0 (0.0%) |
| 12 to 14 Years | 0 (0.0%) | 0 (0.0%) |
| 15 Years | 0 (0.0%) | 0 (0.0%) |
| 16 and 17 Years | 0 (0.0%) | 0 (0.0%) |
| 18 to 24 Years | 0 (0.0%) | 0 (0.0%) |
| 25 to 34 Years | 0 (0.0%) | 0 (0.0%) |
| 35 to 44 Years | 0 (0.0%) | 0 (0.0%) |
| 45 to 54 Years | 0 (0.0%) | 0 (0.0%) |
| 55 to 64 Years | 0 (0.0%) | 0 (0.0%) |
| 65 to 74 Years | 0 (0.0%) | 0 (0.0%) |
| 75 Years and over | 0 (0.0%) | 0 (0.0%) |
| Total | 0 (0.0%) | 0 (0.0%) |
Income Above Poverty by Sex and Age in Carbon Hill
According to the poverty statistics in Carbon Hill, males aged 16 and 17 years and females aged 12 to 14 years are the age groups that are most secure financially, with 100.0% of males and 100.0% of females in these age groups living above the poverty line.
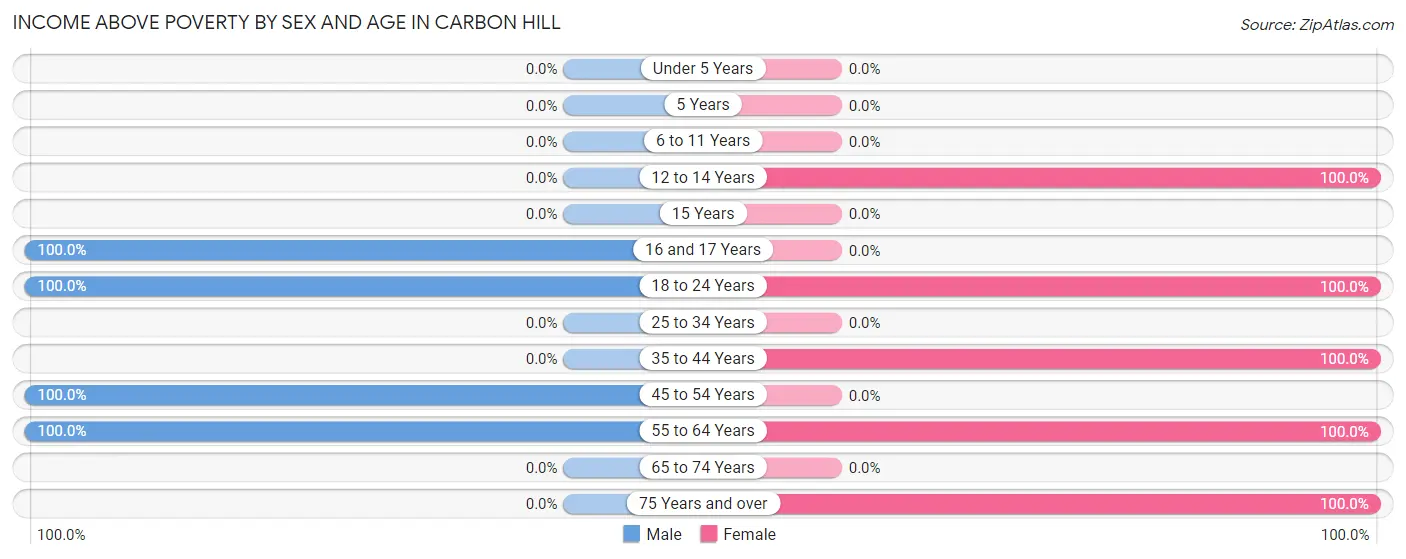
| Age Bracket | Male | Female |
| Under 5 Years | 0 (0.0%) | 0 (0.0%) |
| 5 Years | 0 (0.0%) | 0 (0.0%) |
| 6 to 11 Years | 0 (0.0%) | 0 (0.0%) |
| 12 to 14 Years | 0 (0.0%) | 11 (100.0%) |
| 15 Years | 0 (0.0%) | 0 (0.0%) |
| 16 and 17 Years | 12 (100.0%) | 0 (0.0%) |
| 18 to 24 Years | 10 (100.0%) | 6 (100.0%) |
| 25 to 34 Years | 0 (0.0%) | 0 (0.0%) |
| 35 to 44 Years | 0 (0.0%) | 5 (100.0%) |
| 45 to 54 Years | 30 (100.0%) | 0 (0.0%) |
| 55 to 64 Years | 11 (100.0%) | 22 (100.0%) |
| 65 to 74 Years | 0 (0.0%) | 0 (0.0%) |
| 75 Years and over | 0 (0.0%) | 10 (100.0%) |
| Total | 63 (100.0%) | 54 (100.0%) |
Income Below Poverty Among Married-Couple Families in Carbon Hill
| Children | Above Poverty | Below Poverty |
| No Children | 40 (100.0%) | 0 (0.0%) |
| 1 or 2 Children | 0 (0.0%) | 0 (0.0%) |
| 3 or 4 Children | 0 (0.0%) | 0 (0.0%) |
| 5 or more Children | 0 (0.0%) | 0 (0.0%) |
| Total | 40 (100.0%) | 0 (0.0%) |
Income Below Poverty Among Single-Parent Households in Carbon Hill
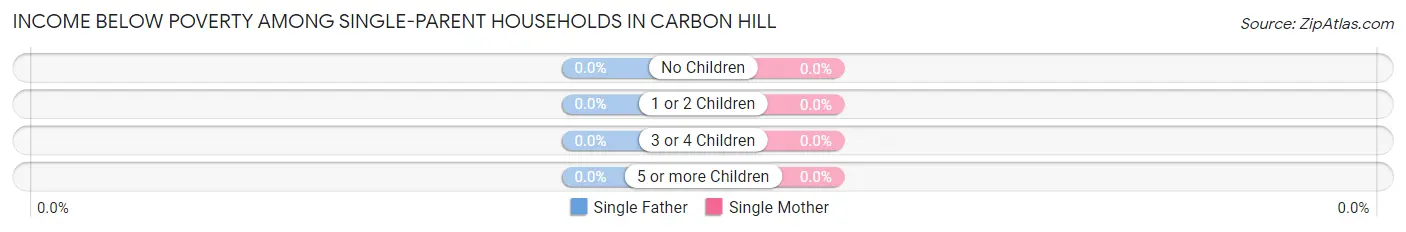
| Children | Single Father | Single Mother |
| No Children | 0 (0.0%) | 0 (0.0%) |
| 1 or 2 Children | 0 (0.0%) | 0 (0.0%) |
| 3 or 4 Children | 0 (0.0%) | 0 (0.0%) |
| 5 or more Children | 0 (0.0%) | 0 (0.0%) |
| Total | 0 (0.0%) | 0 (0.0%) |
Income Below Poverty Among Married-Couple vs Single-Parent Households in Carbon Hill
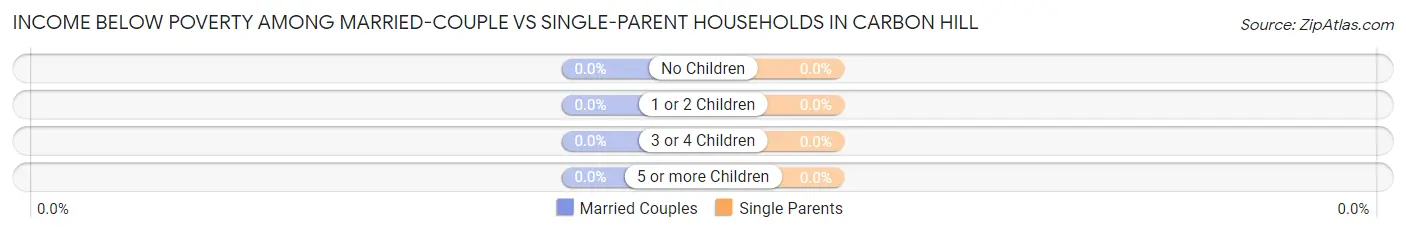
| Children | Married-Couple Families | Single-Parent Households |
| No Children | 0 (0.0%) | 0 (0.0%) |
| 1 or 2 Children | 0 (0.0%) | 0 (0.0%) |
| 3 or 4 Children | 0 (0.0%) | 0 (0.0%) |
| 5 or more Children | 0 (0.0%) | 0 (0.0%) |
| Total | 0 (0.0%) | 0 (0.0%) |
Race in Carbon Hill
The most populous races in Carbon Hill are White / Caucasian (96 | 82.1%), and Two or more Races (21 | 17.9%).
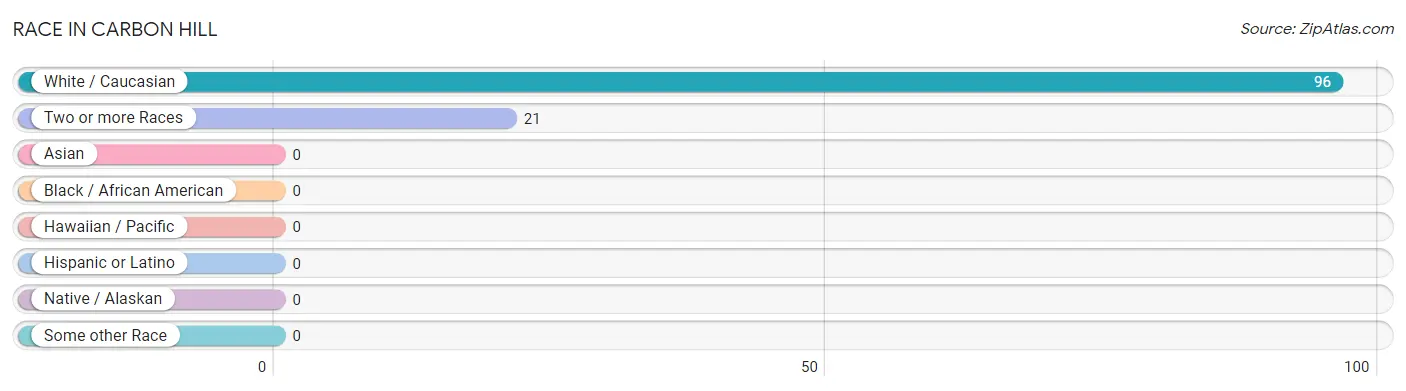
| Race | # Population | % Population |
| Asian | 0 | 0.0% |
| Black / African American | 0 | 0.0% |
| Hawaiian / Pacific | 0 | 0.0% |
| Hispanic or Latino | 0 | 0.0% |
| Native / Alaskan | 0 | 0.0% |
| White / Caucasian | 96 | 82.1% |
| Two or more Races | 21 | 17.9% |
| Some other Race | 0 | 0.0% |
| Total | 117 | 100.0% |
Ancestry in Carbon Hill
The most populous ancestries reported in Carbon Hill are German (51 | 43.6%), and English (20 | 17.1%), together accounting for 60.7% of all Carbon Hill residents.
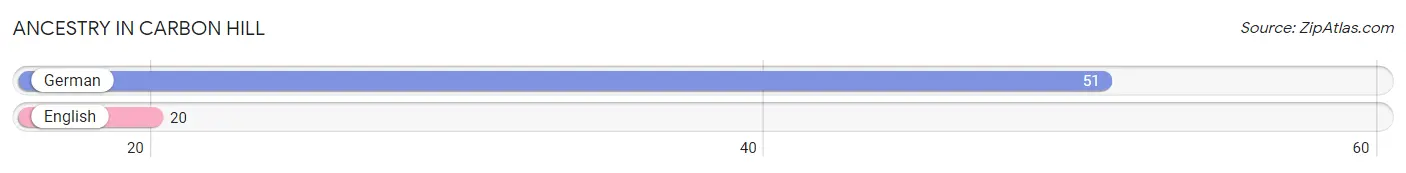
| Ancestry | # Population | % Population |
| English | 20 | 17.1% |
| German | 51 | 43.6% | View All 2 Rows |
Immigrants in Carbon Hill

| Immigration Origin | # Population | % Population | View All 0 Rows |
Sex and Age in Carbon Hill
Sex and Age in Carbon Hill
The most populous age groups in Carbon Hill are 50 to 54 Years (30 | 47.6%) for men and 55 to 59 Years (22 | 40.7%) for women.
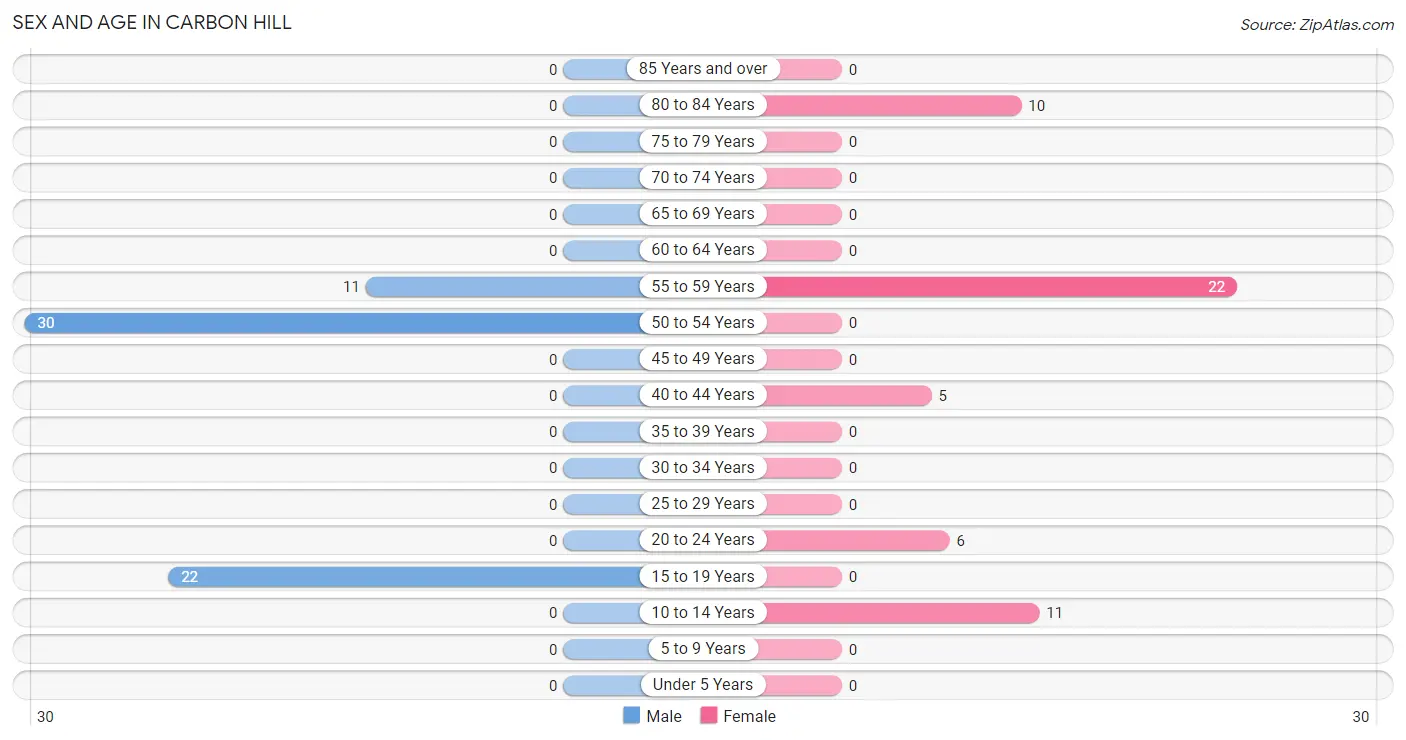
| Age Bracket | Male | Female |
| Under 5 Years | 0 (0.0%) | 0 (0.0%) |
| 5 to 9 Years | 0 (0.0%) | 0 (0.0%) |
| 10 to 14 Years | 0 (0.0%) | 11 (20.4%) |
| 15 to 19 Years | 22 (34.9%) | 0 (0.0%) |
| 20 to 24 Years | 0 (0.0%) | 6 (11.1%) |
| 25 to 29 Years | 0 (0.0%) | 0 (0.0%) |
| 30 to 34 Years | 0 (0.0%) | 0 (0.0%) |
| 35 to 39 Years | 0 (0.0%) | 0 (0.0%) |
| 40 to 44 Years | 0 (0.0%) | 5 (9.3%) |
| 45 to 49 Years | 0 (0.0%) | 0 (0.0%) |
| 50 to 54 Years | 30 (47.6%) | 0 (0.0%) |
| 55 to 59 Years | 11 (17.5%) | 22 (40.7%) |
| 60 to 64 Years | 0 (0.0%) | 0 (0.0%) |
| 65 to 69 Years | 0 (0.0%) | 0 (0.0%) |
| 70 to 74 Years | 0 (0.0%) | 0 (0.0%) |
| 75 to 79 Years | 0 (0.0%) | 0 (0.0%) |
| 80 to 84 Years | 0 (0.0%) | 10 (18.5%) |
| 85 Years and over | 0 (0.0%) | 0 (0.0%) |
| Total | 63 (100.0%) | 54 (100.0%) |
Families and Households in Carbon Hill
Median Family Size in Carbon Hill
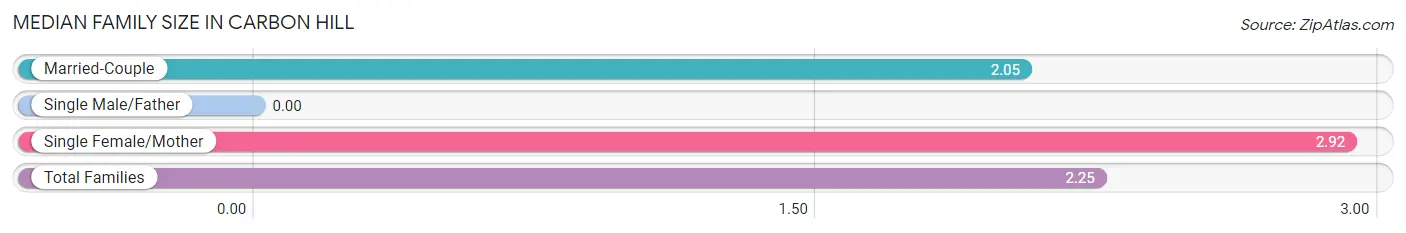
| Family Type | # Families | Family Size |
| Married-Couple | 40 (76.9%) | 2.05 |
| Single Male/Father | 0 (0.0%) | - |
| Single Female/Mother | 12 (23.1%) | 2.92 |
| Total Families | 52 (100.0%) | 2.25 |
Median Household Size in Carbon Hill
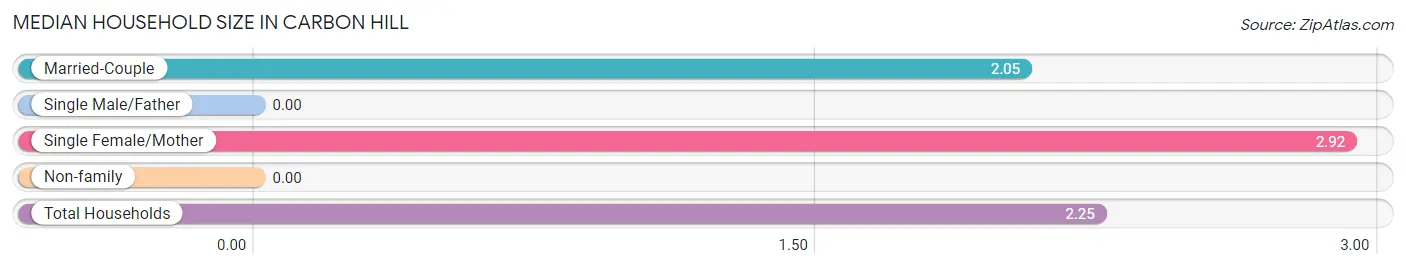
| Household Type | # Households | Household Size |
| Married-Couple | 40 (76.9%) | 2.05 |
| Single Male/Father | 0 (0.0%) | - |
| Single Female/Mother | 12 (23.1%) | 2.92 |
| Non-family | 0 (0.0%) | - |
| Total Households | 52 (100.0%) | 2.25 |
Household Size by Marriage Status in Carbon Hill
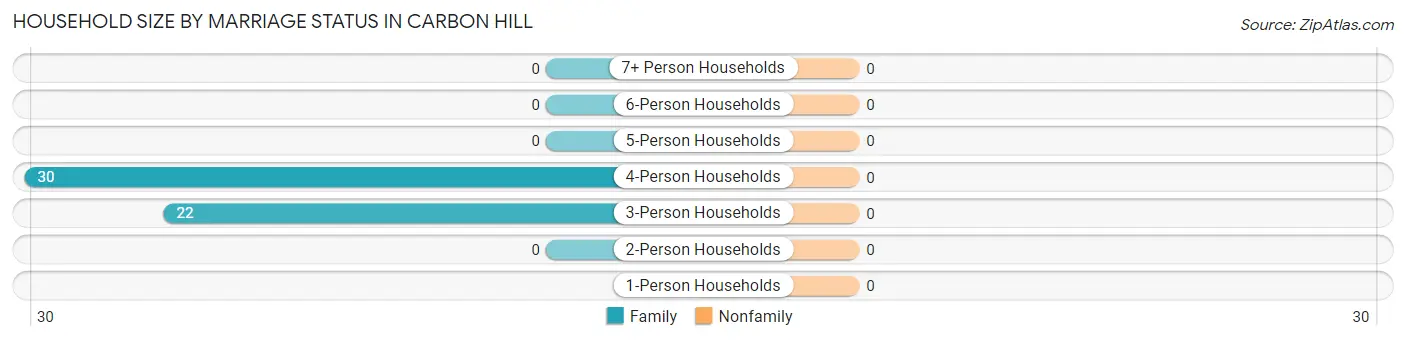
| Household Size | Family Households | Nonfamily Households |
| 1-Person Households | - | 0 (0.0%) |
| 2-Person Households | 0 (0.0%) | 0 (0.0%) |
| 3-Person Households | 22 (42.3%) | 0 (0.0%) |
| 4-Person Households | 30 (57.7%) | 0 (0.0%) |
| 5-Person Households | 0 (0.0%) | 0 (0.0%) |
| 6-Person Households | 0 (0.0%) | 0 (0.0%) |
| 7+ Person Households | 0 (0.0%) | 0 (0.0%) |
| Total | 52 (100.0%) | 0 (0.0%) |
Female Fertility in Carbon Hill
Fertility by Age in Carbon Hill
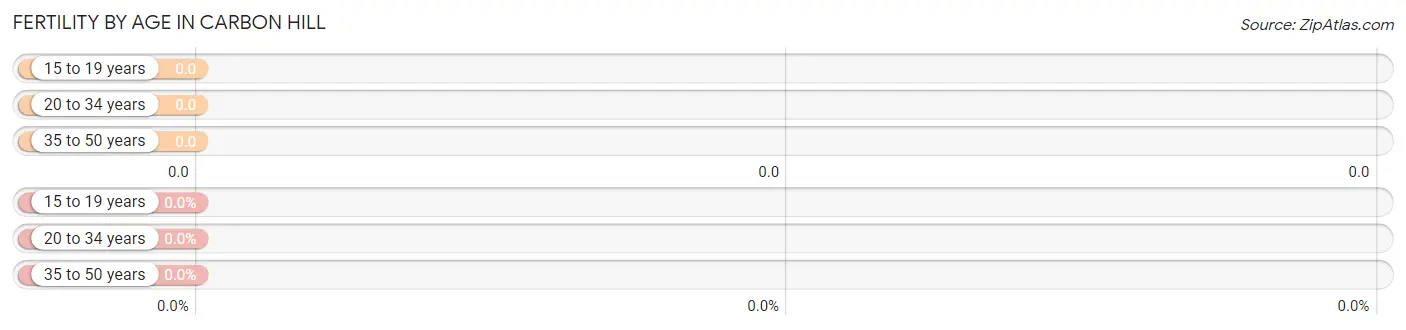
| Age Bracket | Women with Births | Births / 1,000 Women |
| 15 to 19 years | 0 (0.0%) | 0.0 |
| 20 to 34 years | 0 (0.0%) | 0.0 |
| 35 to 50 years | 0 (0.0%) | 0.0 |
| Total | 0 (0.0%) | 0.0 |
Fertility by Age by Marriage Status in Carbon Hill
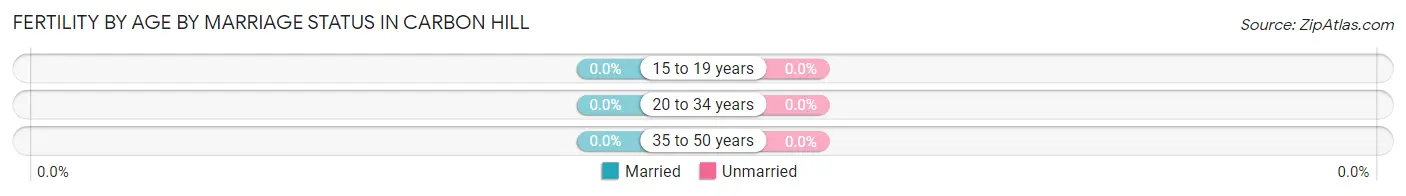
| Age Bracket | Married | Unmarried |
| 15 to 19 years | 0 (0.0%) | 0 (0.0%) |
| 20 to 34 years | 0 (0.0%) | 0 (0.0%) |
| 35 to 50 years | 0 (0.0%) | 0 (0.0%) |
| Total | 0 (0.0%) | 0 (0.0%) |
Fertility by Education in Carbon Hill
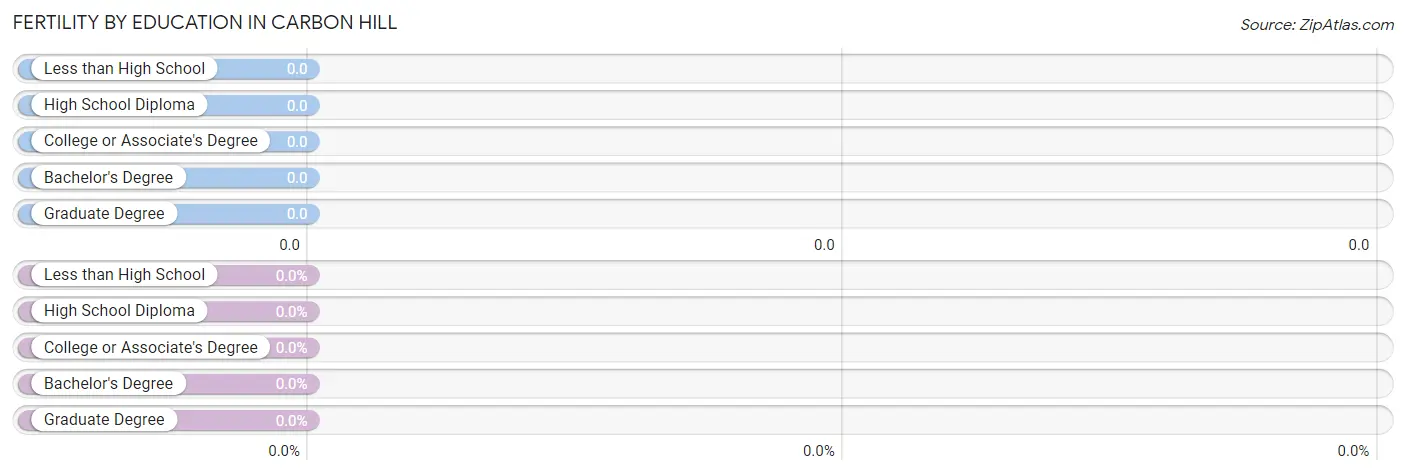
| Educational Attainment | Women with Births | Births / 1,000 Women |
| Less than High School | 0 (0.0%) | 0.0 |
| High School Diploma | 0 (0.0%) | 0.0 |
| College or Associate's Degree | 0 (0.0%) | 0.0 |
| Bachelor's Degree | 0 (0.0%) | 0.0 |
| Graduate Degree | 0 (0.0%) | 0.0 |
| Total | 0 (0.0%) | 0.0 |
Fertility by Education by Marriage Status in Carbon Hill
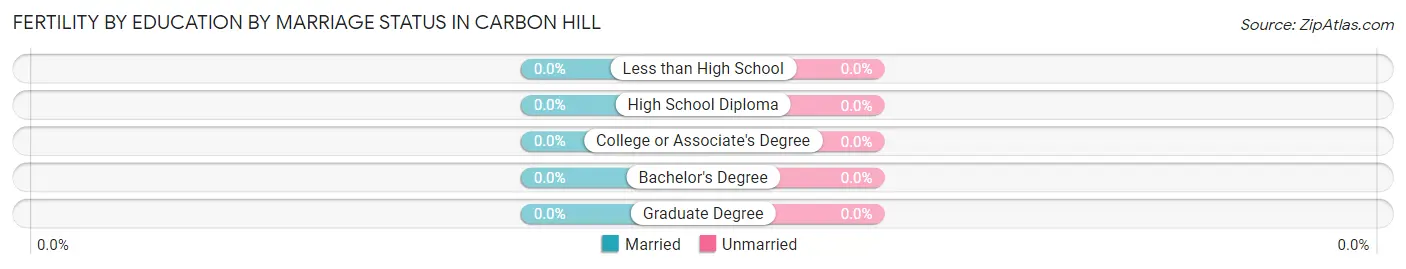
| Educational Attainment | Married | Unmarried |
| Less than High School | 0 (0.0%) | 0 (0.0%) |
| High School Diploma | 0 (0.0%) | 0 (0.0%) |
| College or Associate's Degree | 0 (0.0%) | 0 (0.0%) |
| Bachelor's Degree | 0 (0.0%) | 0 (0.0%) |
| Graduate Degree | 0 (0.0%) | 0 (0.0%) |
| Total | 0 (0.0%) | 0 (0.0%) |
Employment Characteristics in Carbon Hill
Employment by Class of Employer in Carbon Hill
Among the 69 employed individuals in Carbon Hill, self-employed (not incorporated) (30 | 43.5%), private company employees (28 | 40.6%), and unpaid family workers (11 | 15.9%) make up the most common classes of employment.
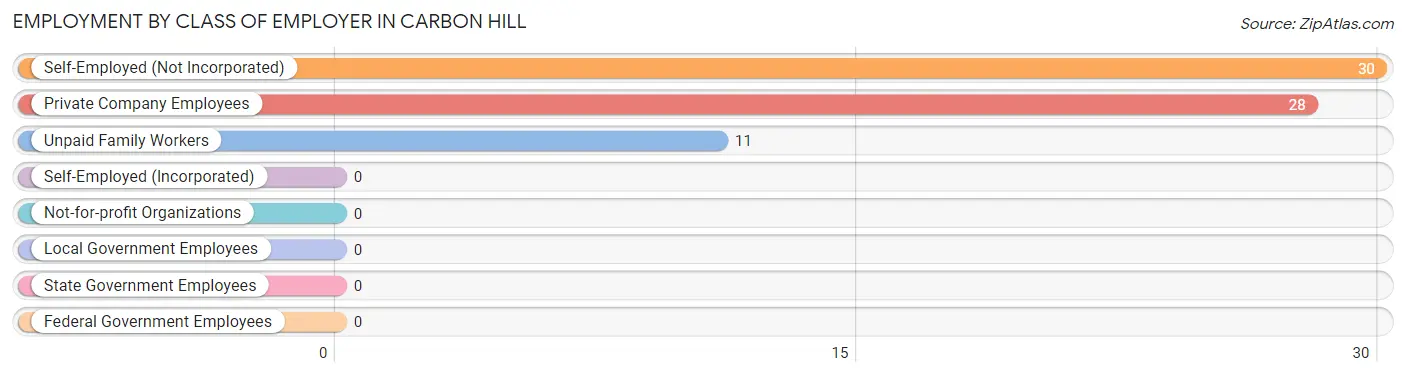
| Employer Class | # Employees | % Employees |
| Private Company Employees | 28 | 40.6% |
| Self-Employed (Incorporated) | 0 | 0.0% |
| Self-Employed (Not Incorporated) | 30 | 43.5% |
| Not-for-profit Organizations | 0 | 0.0% |
| Local Government Employees | 0 | 0.0% |
| State Government Employees | 0 | 0.0% |
| Federal Government Employees | 0 | 0.0% |
| Unpaid Family Workers | 11 | 15.9% |
| Total | 69 | 100.0% |
Employment Status by Age in Carbon Hill
According to the labor force statistics for Carbon Hill, out of the total population over 16 years of age (106), 74.5% or 79 individuals are in the labor force, with 12.7% or 10 of them unemployed. The age group with the highest labor force participation rate is 20 to 24 years, with 100.0% or 6 individuals in the labor force. Within the labor force, the 16 to 19 years age range has the highest percentage of unemployed individuals, with 100.0% or 10 of them being unemployed.
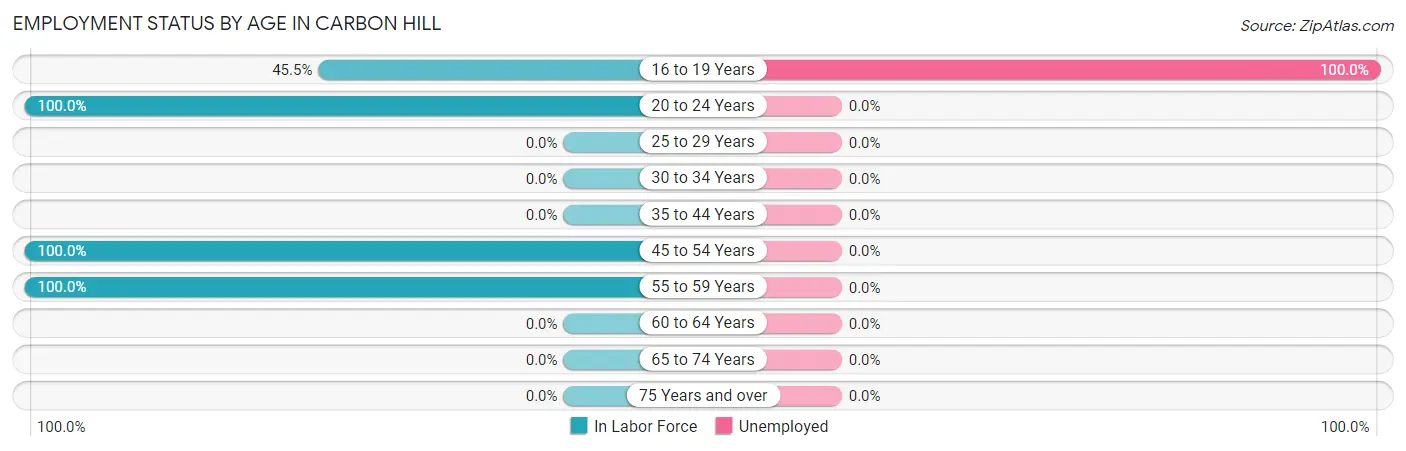
| Age Bracket | In Labor Force | Unemployed |
| 16 to 19 Years | 10 (45.5%) | 10 (100.0%) |
| 20 to 24 Years | 6 (100.0%) | 0 (0.0%) |
| 25 to 29 Years | 0 (0.0%) | 0 (0.0%) |
| 30 to 34 Years | 0 (0.0%) | 0 (0.0%) |
| 35 to 44 Years | 0 (0.0%) | 0 (0.0%) |
| 45 to 54 Years | 30 (100.0%) | 0 (0.0%) |
| 55 to 59 Years | 33 (100.0%) | 0 (0.0%) |
| 60 to 64 Years | 0 (0.0%) | 0 (0.0%) |
| 65 to 74 Years | 0 (0.0%) | 0 (0.0%) |
| 75 Years and over | 0 (0.0%) | 0 (0.0%) |
| Total | 79 (74.5%) | 10 (12.7%) |
Employment Status by Educational Attainment in Carbon Hill
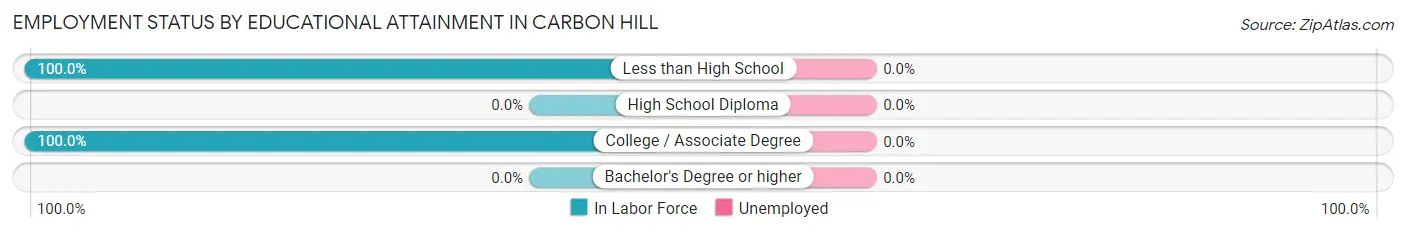
| Educational Attainment | In Labor Force | Unemployed |
| Less than High School | 12 (100.0%) | 0 (0.0%) |
| High School Diploma | 0 (0.0%) | 0 (0.0%) |
| College / Associate Degree | 51 (100.0%) | 0 (0.0%) |
| Bachelor's Degree or higher | 0 (0.0%) | 0 (0.0%) |
| Total | 63 (92.6%) | 0 (0.0%) |
Employment Occupations by Sex in Carbon Hill
Management, Business, Science and Arts Occupations
The most common Management, Business, Science and Arts occupations in Carbon Hill are , and Management (11 | 15.9%).
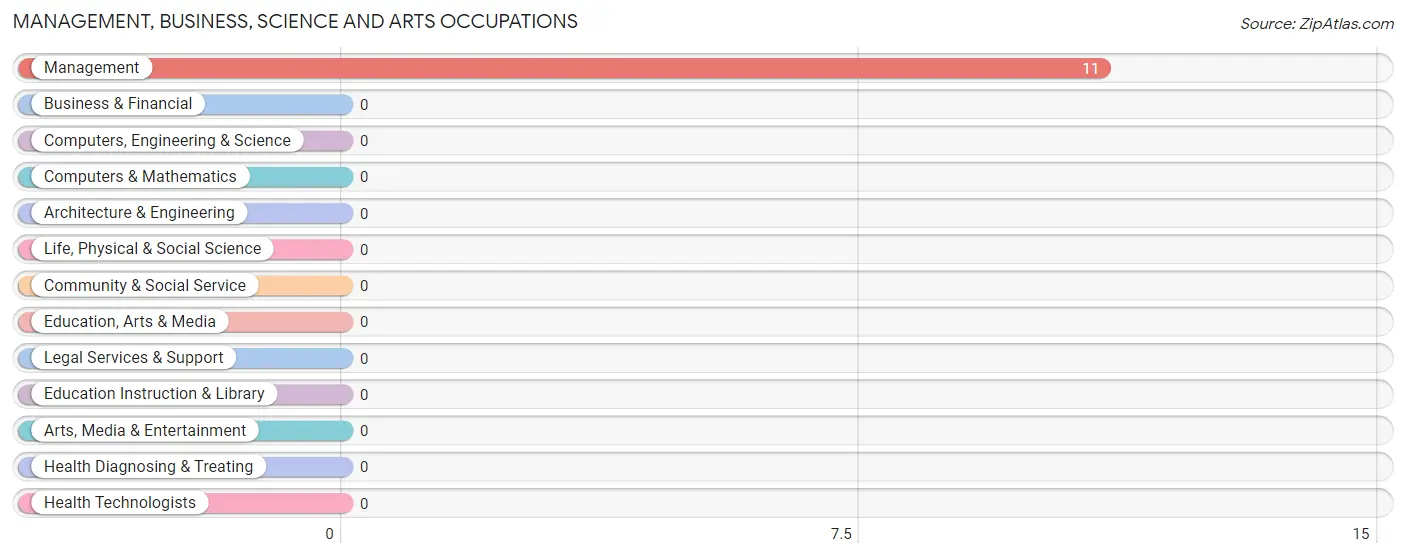
Management, Business, Science and Arts Occupations by Sex
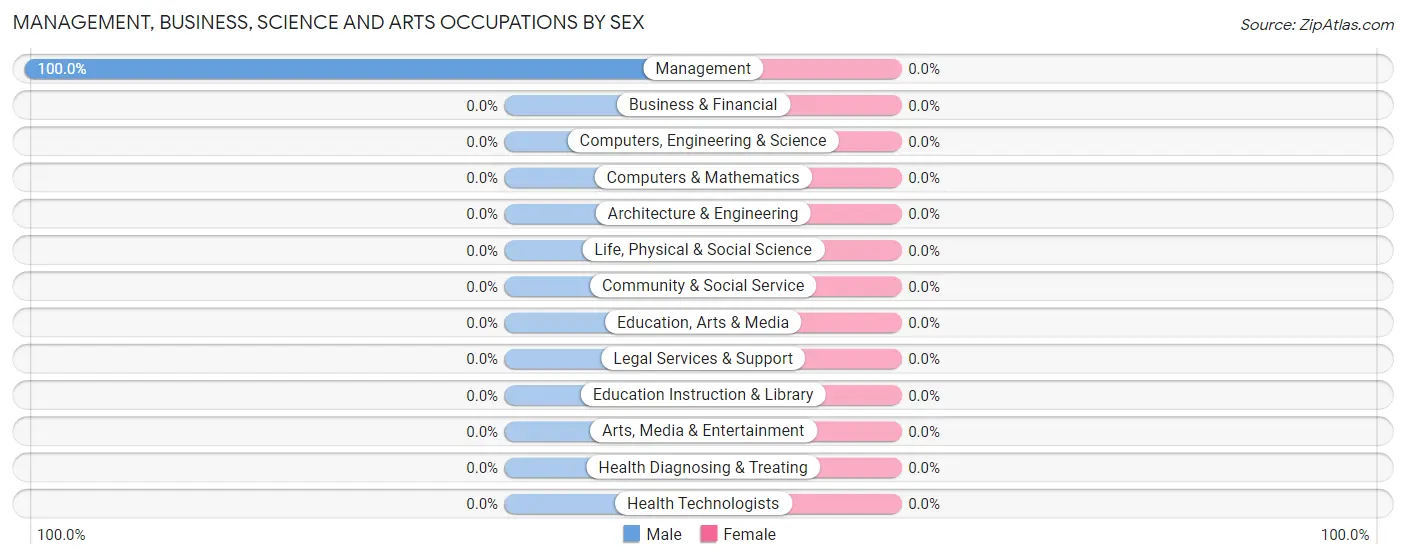
| Occupation | Male | Female |
| Management | 11 (100.0%) | 0 (0.0%) |
| Business & Financial | 0 (0.0%) | 0 (0.0%) |
| Computers, Engineering & Science | 0 (0.0%) | 0 (0.0%) |
| Computers & Mathematics | 0 (0.0%) | 0 (0.0%) |
| Architecture & Engineering | 0 (0.0%) | 0 (0.0%) |
| Life, Physical & Social Science | 0 (0.0%) | 0 (0.0%) |
| Community & Social Service | 0 (0.0%) | 0 (0.0%) |
| Education, Arts & Media | 0 (0.0%) | 0 (0.0%) |
| Legal Services & Support | 0 (0.0%) | 0 (0.0%) |
| Education Instruction & Library | 0 (0.0%) | 0 (0.0%) |
| Arts, Media & Entertainment | 0 (0.0%) | 0 (0.0%) |
| Health Diagnosing & Treating | 0 (0.0%) | 0 (0.0%) |
| Health Technologists | 0 (0.0%) | 0 (0.0%) |
| Total (Category) | 11 (100.0%) | 0 (0.0%) |
| Total (Overall) | 41 (59.4%) | 28 (40.6%) |
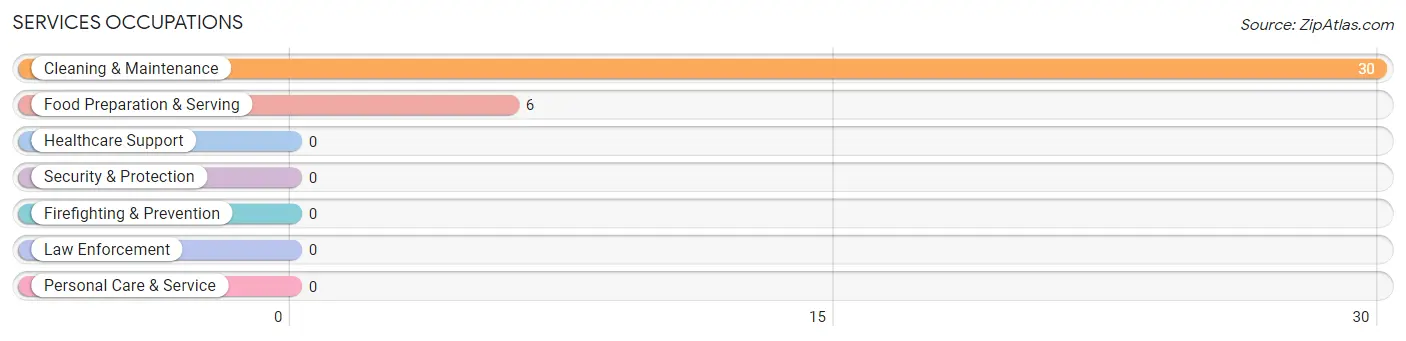
Services Occupations
The most common Services occupations in Carbon Hill are Cleaning & Maintenance (30 | 43.5%), and Food Preparation & Serving (6 | 8.7%).
Services Occupations by Sex
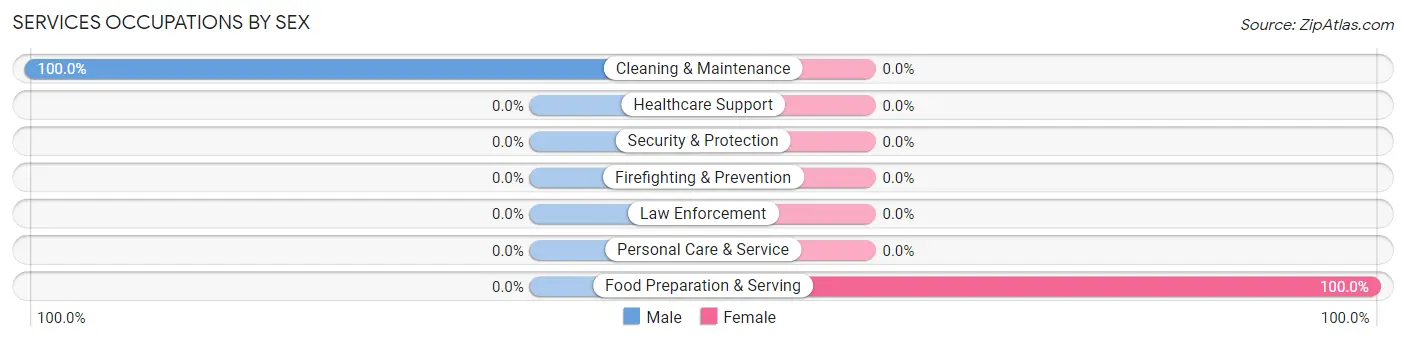
| Occupation | Male | Female |
| Healthcare Support | 0 (0.0%) | 0 (0.0%) |
| Security & Protection | 0 (0.0%) | 0 (0.0%) |
| Firefighting & Prevention | 0 (0.0%) | 0 (0.0%) |
| Law Enforcement | 0 (0.0%) | 0 (0.0%) |
| Food Preparation & Serving | 0 (0.0%) | 6 (100.0%) |
| Cleaning & Maintenance | 30 (100.0%) | 0 (0.0%) |
| Personal Care & Service | 0 (0.0%) | 0 (0.0%) |
| Total (Category) | 30 (83.3%) | 6 (16.7%) |
| Total (Overall) | 41 (59.4%) | 28 (40.6%) |
Sales and Office Occupations
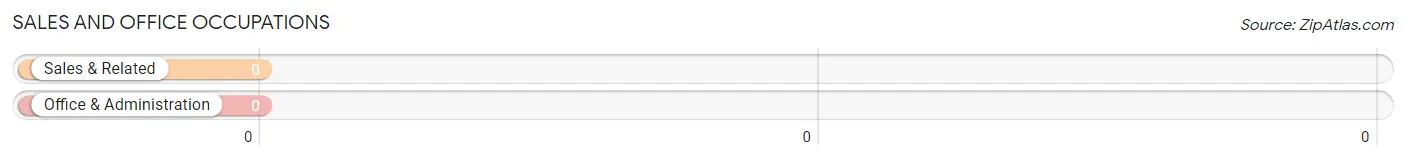
Sales and Office Occupations by Sex
| Occupation | Male | Female |
| Sales & Related | 0 (0.0%) | 0 (0.0%) |
| Office & Administration | 0 (0.0%) | 0 (0.0%) |
| Total (Category) | 0 (0.0%) | 0 (0.0%) |
| Total (Overall) | 41 (59.4%) | 28 (40.6%) |
Natural Resources, Construction and Maintenance Occupations
Natural Resources, Construction and Maintenance Occupations by Sex
| Occupation | Male | Female |
| Farming, Fishing & Forestry | 0 (0.0%) | 0 (0.0%) |
| Construction & Extraction | 0 (0.0%) | 0 (0.0%) |
| Installation, Maintenance & Repair | 0 (0.0%) | 0 (0.0%) |
| Total (Category) | 0 (0.0%) | 0 (0.0%) |
| Total (Overall) | 41 (59.4%) | 28 (40.6%) |
Production, Transportation and Moving Occupations
The most common Production, Transportation and Moving occupations in Carbon Hill are , and Production (22 | 31.9%).
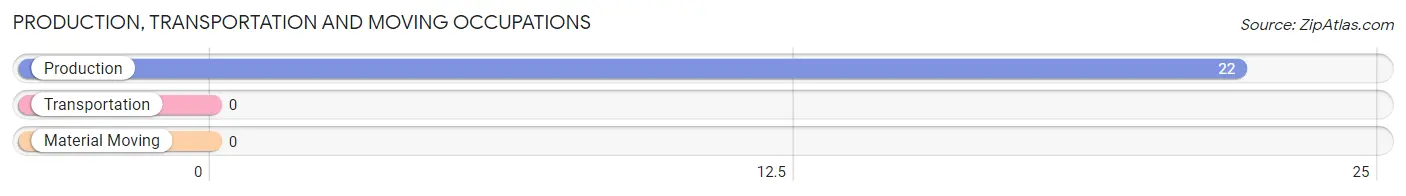
Production, Transportation and Moving Occupations by Sex
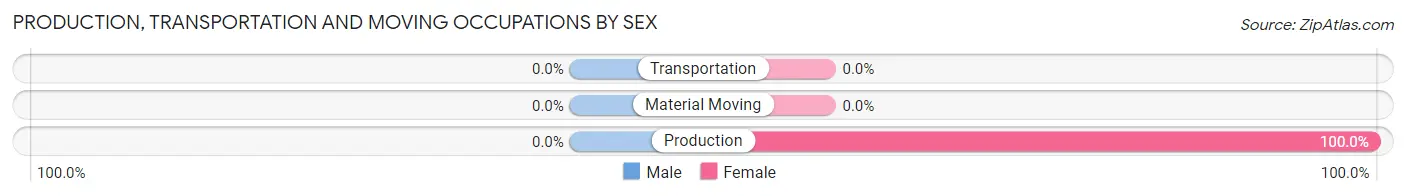
| Occupation | Male | Female |
| Production | 0 (0.0%) | 22 (100.0%) |
| Transportation | 0 (0.0%) | 0 (0.0%) |
| Material Moving | 0 (0.0%) | 0 (0.0%) |
| Total (Category) | 0 (0.0%) | 22 (100.0%) |
| Total (Overall) | 41 (59.4%) | 28 (40.6%) |
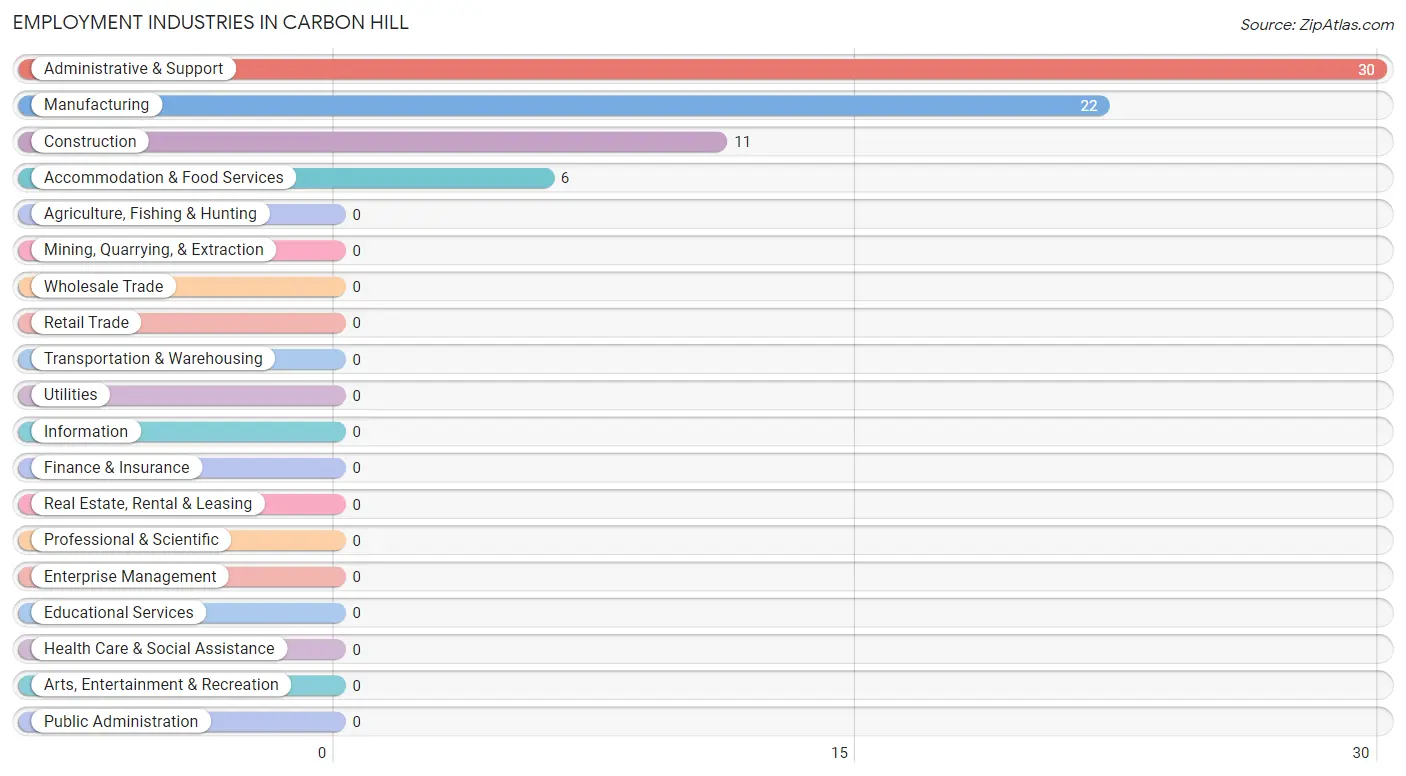
Employment Industries by Sex in Carbon Hill
Employment Industries in Carbon Hill
The major employment industries in Carbon Hill include Administrative & Support (30 | 43.5%), Manufacturing (22 | 31.9%), Construction (11 | 15.9%), and Accommodation & Food Services (6 | 8.7%).
Employment Industries by Sex in Carbon Hill
The Carbon Hill industries that see more men than women are Construction (100.0%), and Administrative & Support (100.0%), whereas the industries that tend to have a higher number of women are Manufacturing (100.0%), and Accommodation & Food Services (100.0%).
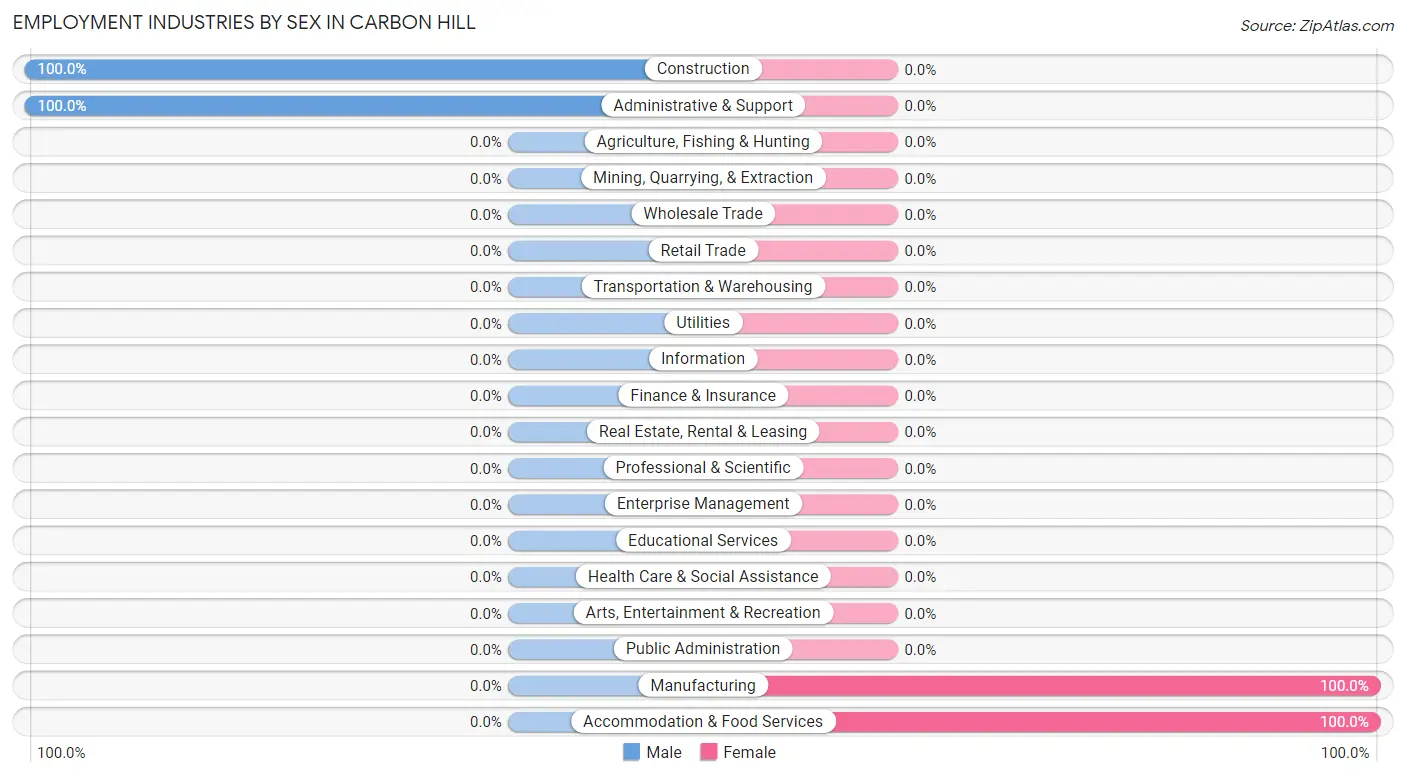
| Industry | Male | Female |
| Agriculture, Fishing & Hunting | 0 (0.0%) | 0 (0.0%) |
| Mining, Quarrying, & Extraction | 0 (0.0%) | 0 (0.0%) |
| Construction | 11 (100.0%) | 0 (0.0%) |
| Manufacturing | 0 (0.0%) | 22 (100.0%) |
| Wholesale Trade | 0 (0.0%) | 0 (0.0%) |
| Retail Trade | 0 (0.0%) | 0 (0.0%) |
| Transportation & Warehousing | 0 (0.0%) | 0 (0.0%) |
| Utilities | 0 (0.0%) | 0 (0.0%) |
| Information | 0 (0.0%) | 0 (0.0%) |
| Finance & Insurance | 0 (0.0%) | 0 (0.0%) |
| Real Estate, Rental & Leasing | 0 (0.0%) | 0 (0.0%) |
| Professional & Scientific | 0 (0.0%) | 0 (0.0%) |
| Enterprise Management | 0 (0.0%) | 0 (0.0%) |
| Administrative & Support | 30 (100.0%) | 0 (0.0%) |
| Educational Services | 0 (0.0%) | 0 (0.0%) |
| Health Care & Social Assistance | 0 (0.0%) | 0 (0.0%) |
| Arts, Entertainment & Recreation | 0 (0.0%) | 0 (0.0%) |
| Accommodation & Food Services | 0 (0.0%) | 6 (100.0%) |
| Public Administration | 0 (0.0%) | 0 (0.0%) |
| Total | 41 (59.4%) | 28 (40.6%) |
Education in Carbon Hill
School Enrollment in Carbon Hill
The most common levels of schooling among the 23 students in Carbon Hill are high school (12 | 52.2%), and middle school (11 | 47.8%).
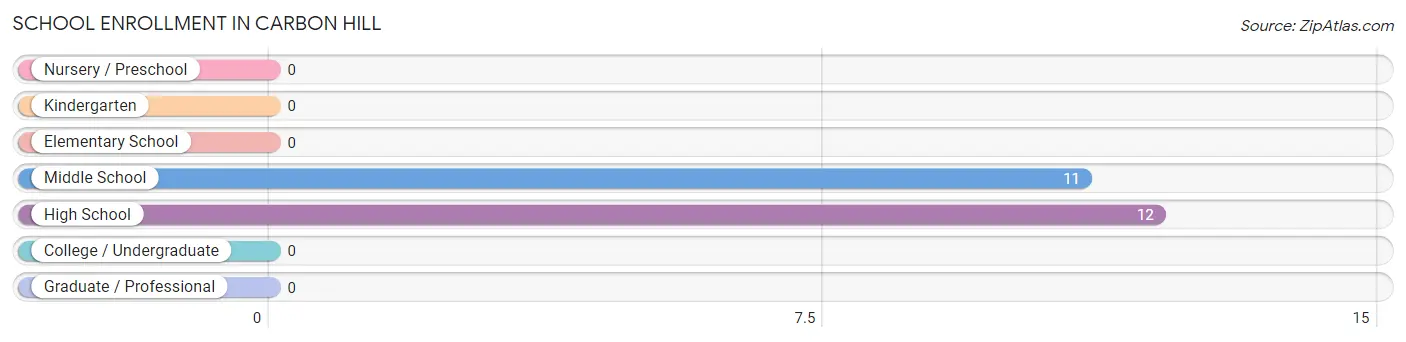
| School Level | # Students | % Students |
| Nursery / Preschool | 0 | 0.0% |
| Kindergarten | 0 | 0.0% |
| Elementary School | 0 | 0.0% |
| Middle School | 11 | 47.8% |
| High School | 12 | 52.2% |
| College / Undergraduate | 0 | 0.0% |
| Graduate / Professional | 0 | 0.0% |
| Total | 23 | 100.0% |
School Enrollment by Age by Funding Source in Carbon Hill
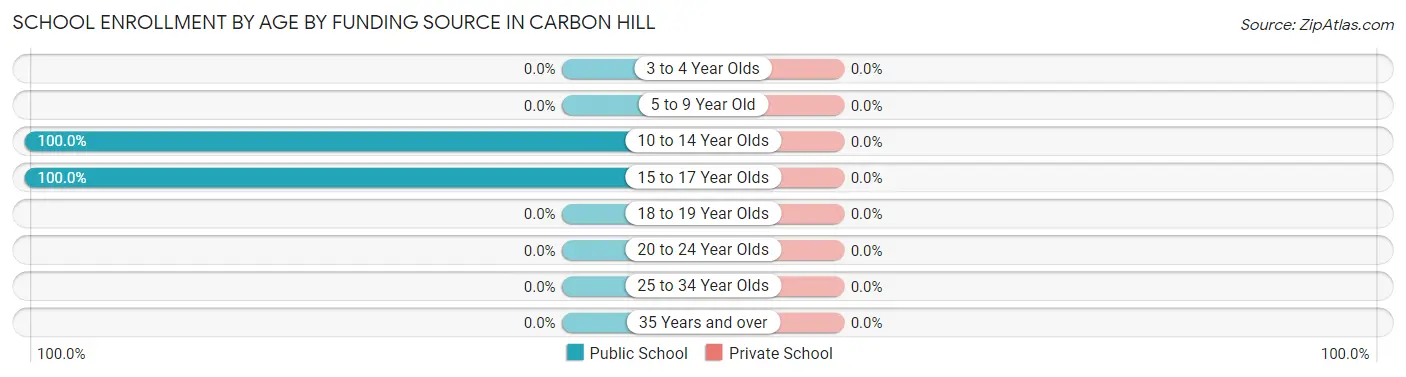
| Age Bracket | Public School | Private School |
| 3 to 4 Year Olds | 0 (0.0%) | 0 (0.0%) |
| 5 to 9 Year Old | 0 (0.0%) | 0 (0.0%) |
| 10 to 14 Year Olds | 11 (100.0%) | 0 (0.0%) |
| 15 to 17 Year Olds | 12 (100.0%) | 0 (0.0%) |
| 18 to 19 Year Olds | 0 (0.0%) | 0 (0.0%) |
| 20 to 24 Year Olds | 0 (0.0%) | 0 (0.0%) |
| 25 to 34 Year Olds | 0 (0.0%) | 0 (0.0%) |
| 35 Years and over | 0 (0.0%) | 0 (0.0%) |
| Total | 23 (100.0%) | 0 (0.0%) |
Educational Attainment by Field of Study in Carbon Hill
| Field of Study | # Graduates | % Graduates |
| Computers & Mathematics | 0 | 0.0% |
| Bio, Nature & Agricultural | 0 | 0.0% |
| Physical & Health Sciences | 0 | 0.0% |
| Psychology | 0 | 0.0% |
| Social Sciences | 0 | 0.0% |
| Engineering | 0 | 0.0% |
| Multidisciplinary Studies | 0 | 0.0% |
| Science & Technology | 0 | 0.0% |
| Business | 0 | 0.0% |
| Education | 0 | 0.0% |
| Literature & Languages | 0 | 0.0% |
| Liberal Arts & History | 0 | 0.0% |
| Visual & Performing Arts | 0 | 0.0% |
| Communications | 0 | 0.0% |
| Arts & Humanities | 0 | 0.0% |
| Total | 0 | 0.0% |
Transportation & Commute in Carbon Hill
Vehicle Availability by Sex in Carbon Hill
The most prevalent vehicle ownership categories in Carbon Hill are males with 3 vehicles (30, accounting for 73.2%) and females with 3 vehicles (18, making up 107.1%).
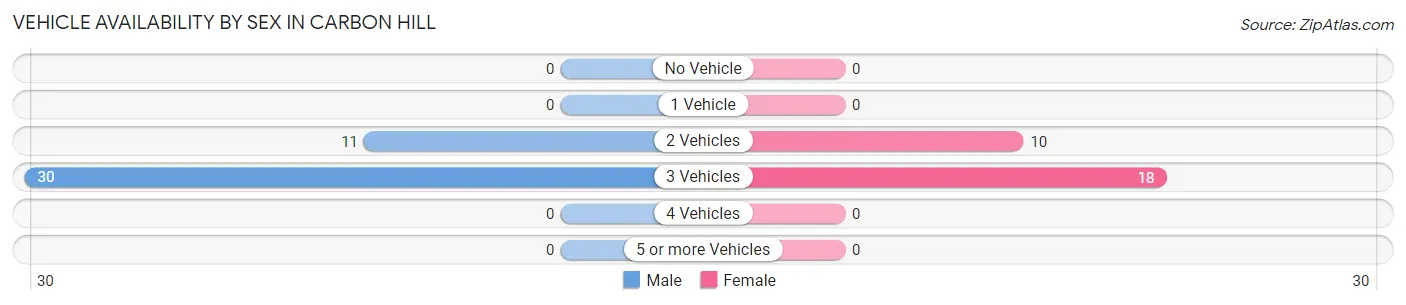
| Vehicles Available | Male | Female |
| No Vehicle | 0 (0.0%) | 0 (0.0%) |
| 1 Vehicle | 0 (0.0%) | 0 (0.0%) |
| 2 Vehicles | 11 (26.8%) | 10 (35.7%) |
| 3 Vehicles | 30 (73.2%) | 18 (64.3%) |
| 4 Vehicles | 0 (0.0%) | 0 (0.0%) |
| 5 or more Vehicles | 0 (0.0%) | 0 (0.0%) |
| Total | 41 (100.0%) | 28 (100.0%) |
Commute Time in Carbon Hill
The most frequently occuring commute durations in Carbon Hill are 20 to 24 minutes (23 commuters, 59.0%), 45 to 59 minutes (10 commuters, 25.6%), and 10 to 14 minutes (6 commuters, 15.4%).
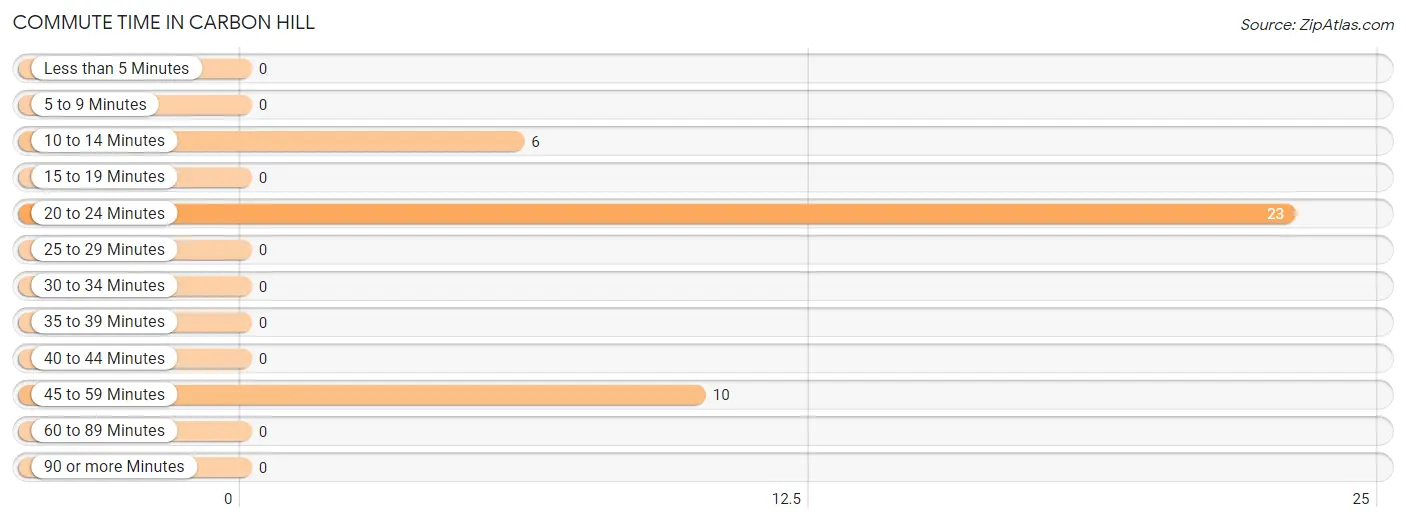
| Commute Time | # Commuters | % Commuters |
| Less than 5 Minutes | 0 | 0.0% |
| 5 to 9 Minutes | 0 | 0.0% |
| 10 to 14 Minutes | 6 | 15.4% |
| 15 to 19 Minutes | 0 | 0.0% |
| 20 to 24 Minutes | 23 | 59.0% |
| 25 to 29 Minutes | 0 | 0.0% |
| 30 to 34 Minutes | 0 | 0.0% |
| 35 to 39 Minutes | 0 | 0.0% |
| 40 to 44 Minutes | 0 | 0.0% |
| 45 to 59 Minutes | 10 | 25.6% |
| 60 to 89 Minutes | 0 | 0.0% |
| 90 or more Minutes | 0 | 0.0% |
Commute Time by Sex in Carbon Hill
The most common commute times in Carbon Hill are 20 to 24 minutes (11 commuters, 100.0%) for males and 20 to 24 minutes (12 commuters, 42.9%) for females.
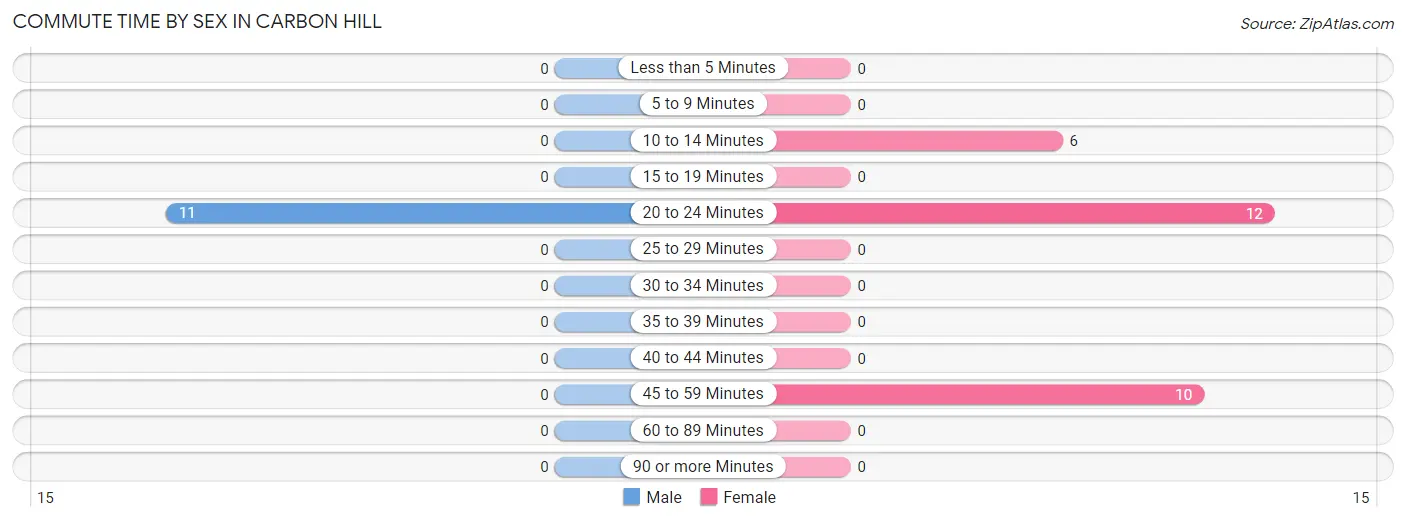
| Commute Time | Male | Female |
| Less than 5 Minutes | 0 (0.0%) | 0 (0.0%) |
| 5 to 9 Minutes | 0 (0.0%) | 0 (0.0%) |
| 10 to 14 Minutes | 0 (0.0%) | 6 (21.4%) |
| 15 to 19 Minutes | 0 (0.0%) | 0 (0.0%) |
| 20 to 24 Minutes | 11 (100.0%) | 12 (42.9%) |
| 25 to 29 Minutes | 0 (0.0%) | 0 (0.0%) |
| 30 to 34 Minutes | 0 (0.0%) | 0 (0.0%) |
| 35 to 39 Minutes | 0 (0.0%) | 0 (0.0%) |
| 40 to 44 Minutes | 0 (0.0%) | 0 (0.0%) |
| 45 to 59 Minutes | 0 (0.0%) | 10 (35.7%) |
| 60 to 89 Minutes | 0 (0.0%) | 0 (0.0%) |
| 90 or more Minutes | 0 (0.0%) | 0 (0.0%) |
Time of Departure to Work by Sex in Carbon Hill
The most frequent times of departure to work in Carbon Hill are 7:00 AM to 7:29 AM (11, 100.0%) for males and 8:00 AM to 8:29 AM (12, 42.9%) for females.
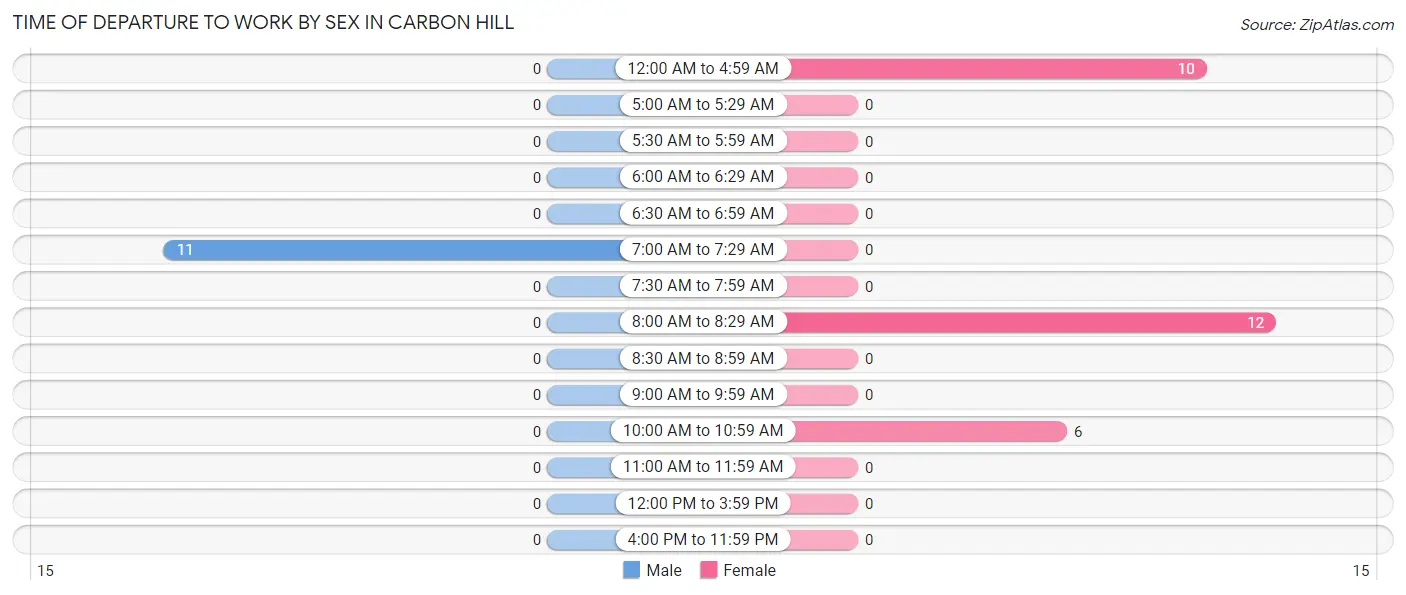
| Time of Departure | Male | Female |
| 12:00 AM to 4:59 AM | 0 (0.0%) | 10 (35.7%) |
| 5:00 AM to 5:29 AM | 0 (0.0%) | 0 (0.0%) |
| 5:30 AM to 5:59 AM | 0 (0.0%) | 0 (0.0%) |
| 6:00 AM to 6:29 AM | 0 (0.0%) | 0 (0.0%) |
| 6:30 AM to 6:59 AM | 0 (0.0%) | 0 (0.0%) |
| 7:00 AM to 7:29 AM | 11 (100.0%) | 0 (0.0%) |
| 7:30 AM to 7:59 AM | 0 (0.0%) | 0 (0.0%) |
| 8:00 AM to 8:29 AM | 0 (0.0%) | 12 (42.9%) |
| 8:30 AM to 8:59 AM | 0 (0.0%) | 0 (0.0%) |
| 9:00 AM to 9:59 AM | 0 (0.0%) | 0 (0.0%) |
| 10:00 AM to 10:59 AM | 0 (0.0%) | 6 (21.4%) |
| 11:00 AM to 11:59 AM | 0 (0.0%) | 0 (0.0%) |
| 12:00 PM to 3:59 PM | 0 (0.0%) | 0 (0.0%) |
| 4:00 PM to 11:59 PM | 0 (0.0%) | 0 (0.0%) |
| Total | 11 (100.0%) | 28 (100.0%) |
Housing Occupancy in Carbon Hill
Occupancy by Ownership in Carbon Hill
Of the total 52 dwellings in Carbon Hill, owner-occupied units account for 22 (42.3%), while renter-occupied units make up 30 (57.7%).
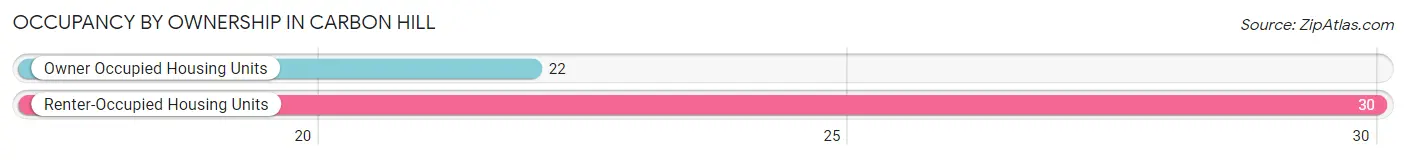
| Occupancy | # Housing Units | % Housing Units |
| Owner Occupied Housing Units | 22 | 42.3% |
| Renter-Occupied Housing Units | 30 | 57.7% |
| Total Occupied Housing Units | 52 | 100.0% |
Occupancy by Household Size in Carbon Hill
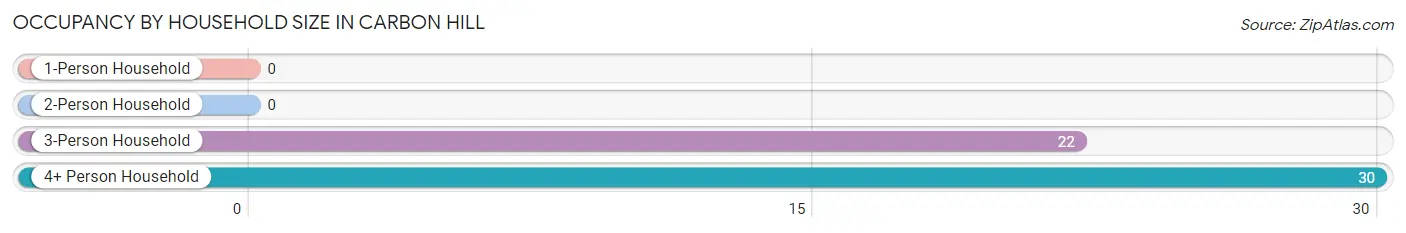
| Household Size | # Housing Units | % Housing Units |
| 1-Person Household | 0 | 0.0% |
| 2-Person Household | 0 | 0.0% |
| 3-Person Household | 22 | 42.3% |
| 4+ Person Household | 30 | 57.7% |
| Total Housing Units | 52 | 100.0% |
Occupancy by Ownership by Household Size in Carbon Hill
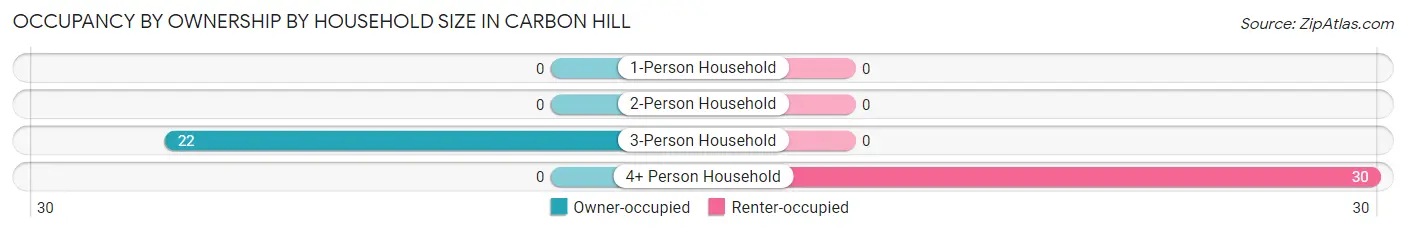
| Household Size | Owner-occupied | Renter-occupied |
| 1-Person Household | 0 (0.0%) | 0 (0.0%) |
| 2-Person Household | 0 (0.0%) | 0 (0.0%) |
| 3-Person Household | 22 (100.0%) | 0 (0.0%) |
| 4+ Person Household | 0 (0.0%) | 30 (100.0%) |
| Total Housing Units | 22 (42.3%) | 30 (57.7%) |
Occupancy by Educational Attainment in Carbon Hill
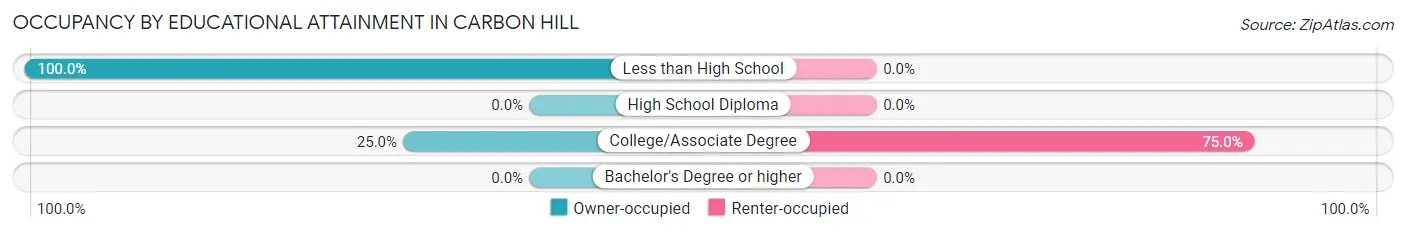
| Household Size | Owner-occupied | Renter-occupied |
| Less than High School | 12 (100.0%) | 0 (0.0%) |
| High School Diploma | 0 (0.0%) | 0 (0.0%) |
| College/Associate Degree | 10 (25.0%) | 30 (75.0%) |
| Bachelor's Degree or higher | 0 (0.0%) | 0 (0.0%) |
Occupancy by Age of Householder in Carbon Hill
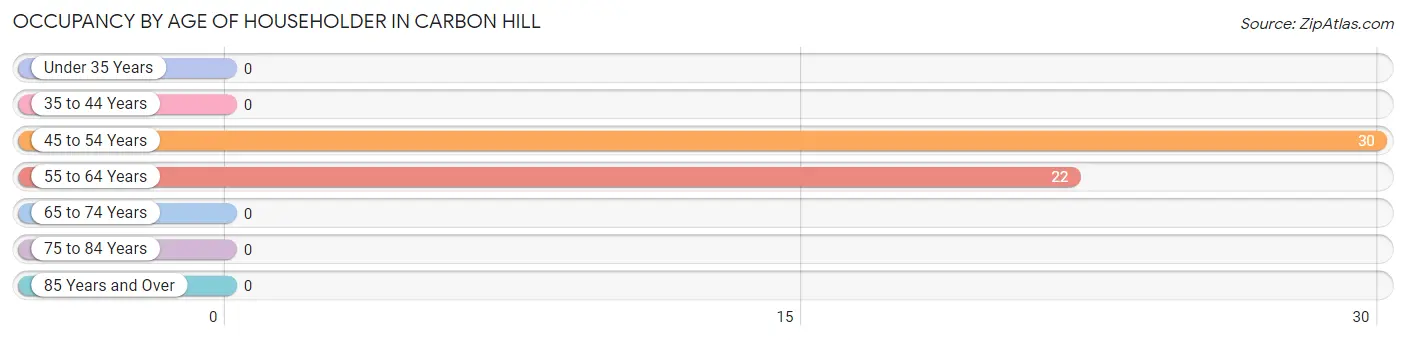
| Age Bracket | # Households | % Households |
| Under 35 Years | 0 | 0.0% |
| 35 to 44 Years | 0 | 0.0% |
| 45 to 54 Years | 30 | 57.7% |
| 55 to 64 Years | 22 | 42.3% |
| 65 to 74 Years | 0 | 0.0% |
| 75 to 84 Years | 0 | 0.0% |
| 85 Years and Over | 0 | 0.0% |
| Total | 52 | 100.0% |
Housing Finances in Carbon Hill
Median Income by Occupancy in Carbon Hill
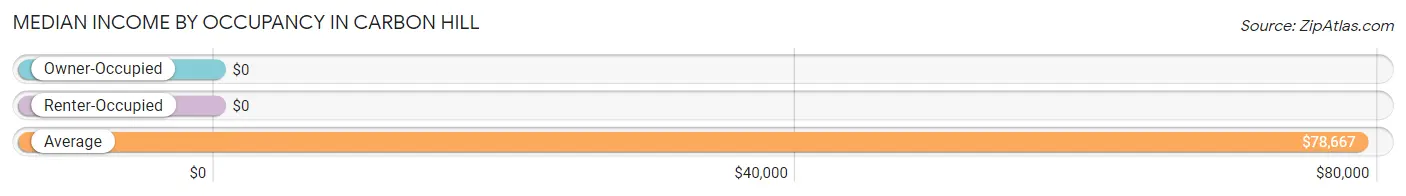
| Occupancy Type | # Households | Median Income |
| Owner-Occupied | 22 (42.3%) | $0 |
| Renter-Occupied | 30 (57.7%) | $0 |
| Average | 52 (100.0%) | $78,667 |
Occupancy by Householder Income Bracket in Carbon Hill
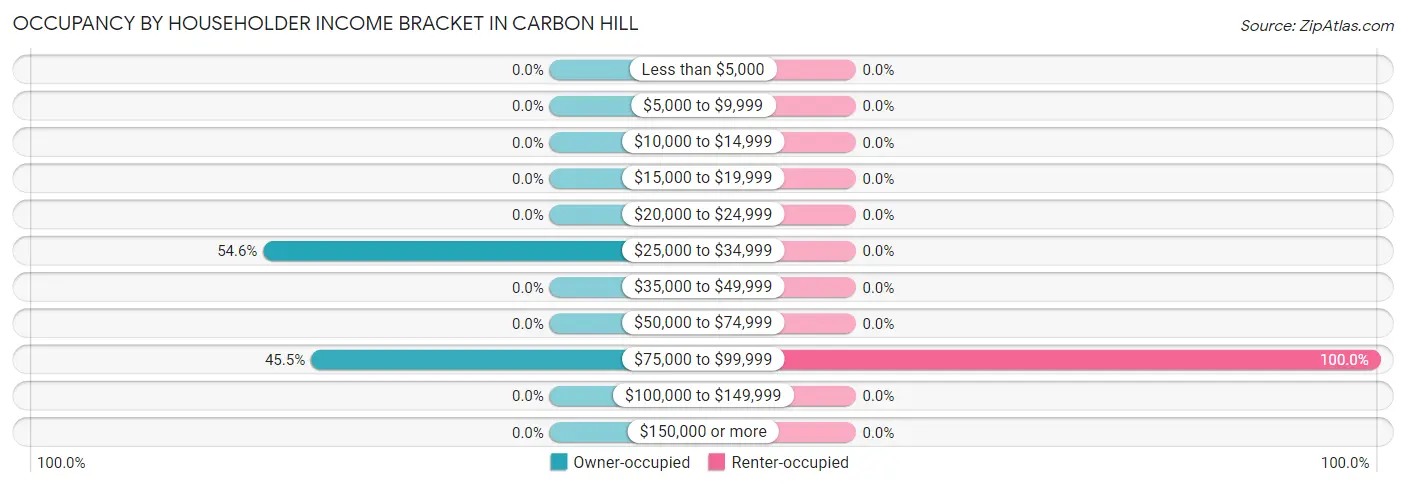
| Income Bracket | Owner-occupied | Renter-occupied |
| Less than $5,000 | 0 (0.0%) | 0 (0.0%) |
| $5,000 to $9,999 | 0 (0.0%) | 0 (0.0%) |
| $10,000 to $14,999 | 0 (0.0%) | 0 (0.0%) |
| $15,000 to $19,999 | 0 (0.0%) | 0 (0.0%) |
| $20,000 to $24,999 | 0 (0.0%) | 0 (0.0%) |
| $25,000 to $34,999 | 12 (54.5%) | 0 (0.0%) |
| $35,000 to $49,999 | 0 (0.0%) | 0 (0.0%) |
| $50,000 to $74,999 | 0 (0.0%) | 0 (0.0%) |
| $75,000 to $99,999 | 10 (45.5%) | 30 (100.0%) |
| $100,000 to $149,999 | 0 (0.0%) | 0 (0.0%) |
| $150,000 or more | 0 (0.0%) | 0 (0.0%) |
| Total | 22 (100.0%) | 30 (100.0%) |
Monthly Housing Cost Tiers in Carbon Hill
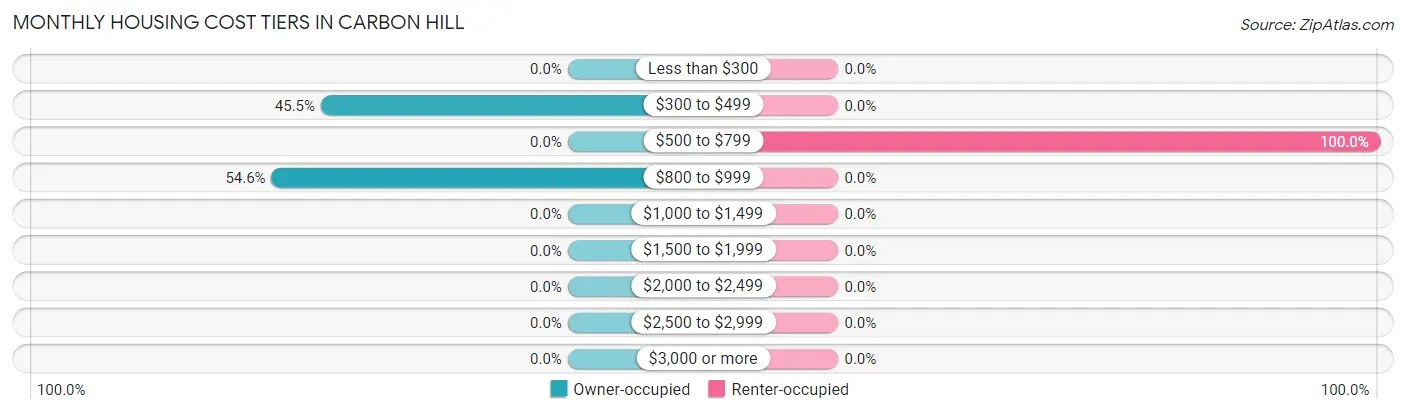
| Monthly Cost | Owner-occupied | Renter-occupied |
| Less than $300 | 0 (0.0%) | 0 (0.0%) |
| $300 to $499 | 10 (45.5%) | 0 (0.0%) |
| $500 to $799 | 0 (0.0%) | 30 (100.0%) |
| $800 to $999 | 12 (54.5%) | 0 (0.0%) |
| $1,000 to $1,499 | 0 (0.0%) | 0 (0.0%) |
| $1,500 to $1,999 | 0 (0.0%) | 0 (0.0%) |
| $2,000 to $2,499 | 0 (0.0%) | 0 (0.0%) |
| $2,500 to $2,999 | 0 (0.0%) | 0 (0.0%) |
| $3,000 or more | 0 (0.0%) | 0 (0.0%) |
| Total | 22 (100.0%) | 30 (100.0%) |
Physical Housing Characteristics in Carbon Hill
Housing Structures in Carbon Hill
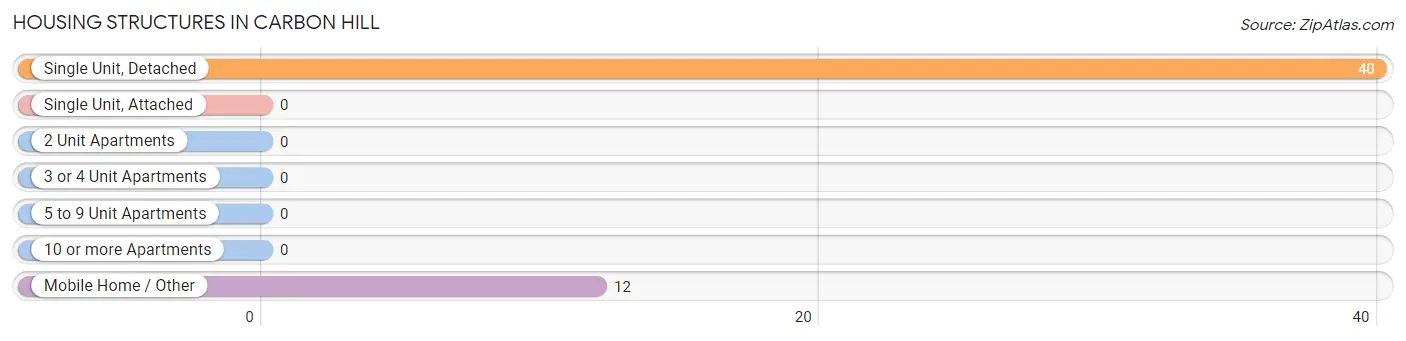
| Structure Type | # Housing Units | % Housing Units |
| Single Unit, Detached | 40 | 76.9% |
| Single Unit, Attached | 0 | 0.0% |
| 2 Unit Apartments | 0 | 0.0% |
| 3 or 4 Unit Apartments | 0 | 0.0% |
| 5 to 9 Unit Apartments | 0 | 0.0% |
| 10 or more Apartments | 0 | 0.0% |
| Mobile Home / Other | 12 | 23.1% |
| Total | 52 | 100.0% |
Housing Structures by Occupancy in Carbon Hill
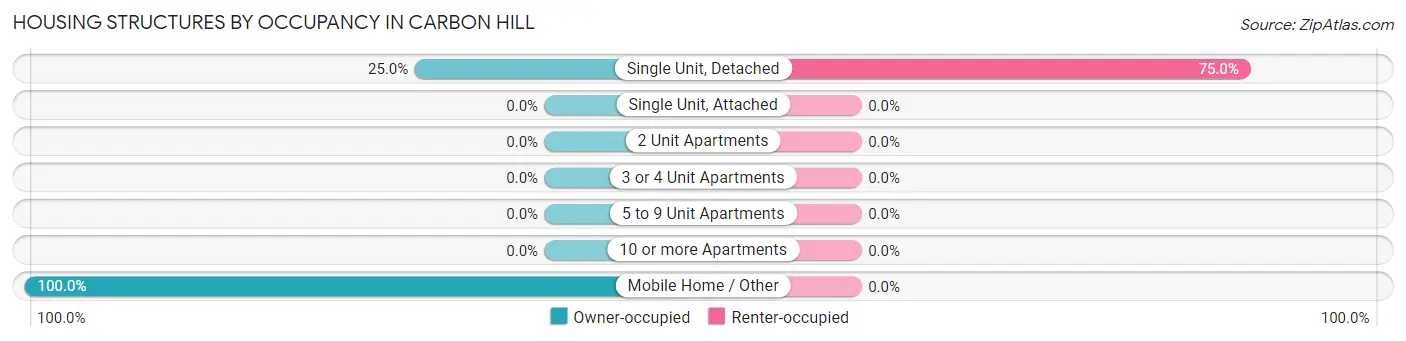
| Structure Type | Owner-occupied | Renter-occupied |
| Single Unit, Detached | 10 (25.0%) | 30 (75.0%) |
| Single Unit, Attached | 0 (0.0%) | 0 (0.0%) |
| 2 Unit Apartments | 0 (0.0%) | 0 (0.0%) |
| 3 or 4 Unit Apartments | 0 (0.0%) | 0 (0.0%) |
| 5 to 9 Unit Apartments | 0 (0.0%) | 0 (0.0%) |
| 10 or more Apartments | 0 (0.0%) | 0 (0.0%) |
| Mobile Home / Other | 12 (100.0%) | 0 (0.0%) |
| Total | 22 (42.3%) | 30 (57.7%) |
Housing Structures by Number of Rooms in Carbon Hill
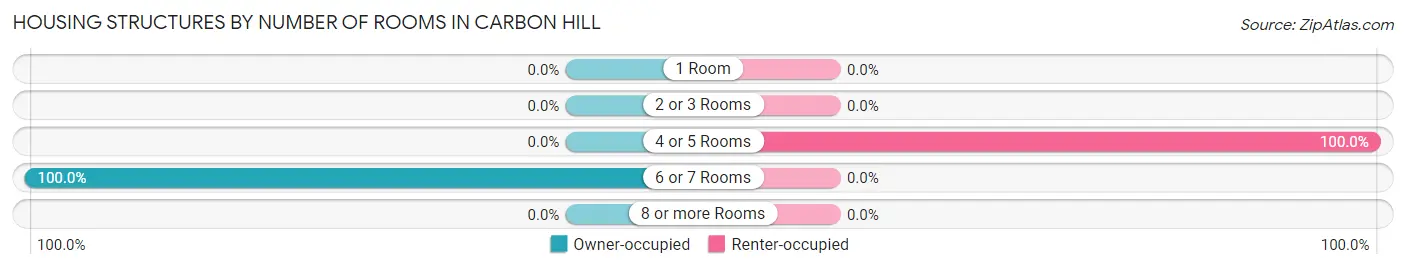
| Number of Rooms | Owner-occupied | Renter-occupied |
| 1 Room | 0 (0.0%) | 0 (0.0%) |
| 2 or 3 Rooms | 0 (0.0%) | 0 (0.0%) |
| 4 or 5 Rooms | 0 (0.0%) | 30 (100.0%) |
| 6 or 7 Rooms | 22 (100.0%) | 0 (0.0%) |
| 8 or more Rooms | 0 (0.0%) | 0 (0.0%) |
| Total | 22 (100.0%) | 30 (100.0%) |
Housing Structure by Heating Type in Carbon Hill

| Heating Type | Owner-occupied | Renter-occupied |
| Utility Gas | 12 (54.5%) | 30 (100.0%) |
| Bottled, Tank, or LP Gas | 0 (0.0%) | 0 (0.0%) |
| Electricity | 0 (0.0%) | 0 (0.0%) |
| Fuel Oil or Kerosene | 0 (0.0%) | 0 (0.0%) |
| Coal or Coke | 0 (0.0%) | 0 (0.0%) |
| All other Fuels | 10 (45.5%) | 0 (0.0%) |
| No Fuel Used | 0 (0.0%) | 0 (0.0%) |
| Total | 22 (100.0%) | 30 (100.0%) |
Household Vehicle Usage in Carbon Hill
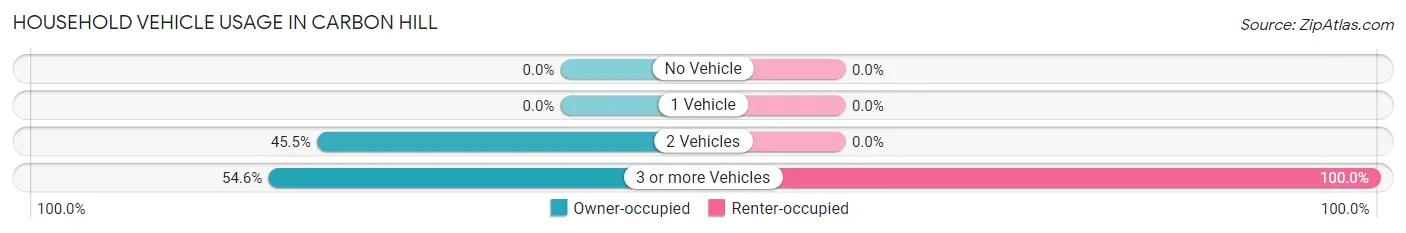
| Vehicles per Household | Owner-occupied | Renter-occupied |
| No Vehicle | 0 (0.0%) | 0 (0.0%) |
| 1 Vehicle | 0 (0.0%) | 0 (0.0%) |
| 2 Vehicles | 10 (45.5%) | 0 (0.0%) |
| 3 or more Vehicles | 12 (54.5%) | 30 (100.0%) |
| Total | 22 (100.0%) | 30 (100.0%) |
Real Estate & Mortgages in Carbon Hill
Real Estate and Mortgage Overview in Carbon Hill
| Characteristic | Without Mortgage | With Mortgage |
| Housing Units | 10 | 12 |
| Median Property Value | - | - |
| Median Household Income | - | - |
| Monthly Housing Costs | - | - |
| Real Estate Taxes | - | - |
Property Value by Mortgage Status in Carbon Hill
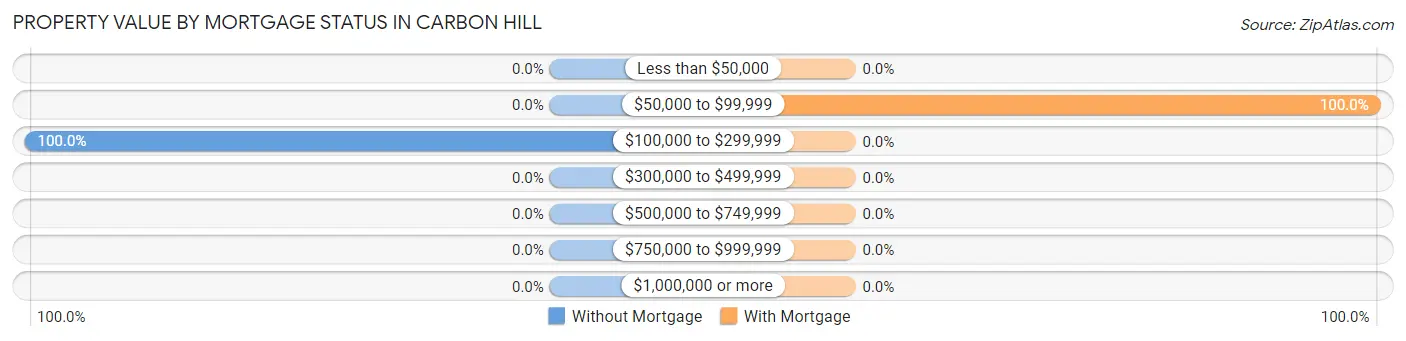
| Property Value | Without Mortgage | With Mortgage |
| Less than $50,000 | 0 (0.0%) | 0 (0.0%) |
| $50,000 to $99,999 | 0 (0.0%) | 12 (100.0%) |
| $100,000 to $299,999 | 10 (100.0%) | 0 (0.0%) |
| $300,000 to $499,999 | 0 (0.0%) | 0 (0.0%) |
| $500,000 to $749,999 | 0 (0.0%) | 0 (0.0%) |
| $750,000 to $999,999 | 0 (0.0%) | 0 (0.0%) |
| $1,000,000 or more | 0 (0.0%) | 0 (0.0%) |
| Total | 10 (100.0%) | 12 (100.0%) |
Household Income by Mortgage Status in Carbon Hill
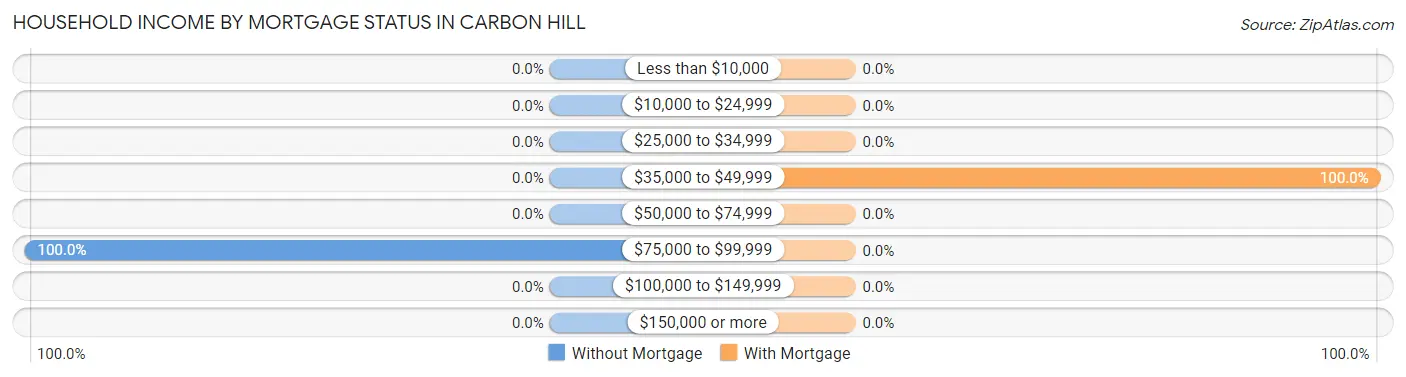
| Household Income | Without Mortgage | With Mortgage |
| Less than $10,000 | 0 (0.0%) | 0 (0.0%) |
| $10,000 to $24,999 | 0 (0.0%) | 0 (0.0%) |
| $25,000 to $34,999 | 0 (0.0%) | 0 (0.0%) |
| $35,000 to $49,999 | 0 (0.0%) | 12 (100.0%) |
| $50,000 to $74,999 | 0 (0.0%) | 0 (0.0%) |
| $75,000 to $99,999 | 10 (100.0%) | 0 (0.0%) |
| $100,000 to $149,999 | 0 (0.0%) | 0 (0.0%) |
| $150,000 or more | 0 (0.0%) | 0 (0.0%) |
| Total | 10 (100.0%) | 12 (100.0%) |
Property Value to Household Income Ratio in Carbon Hill
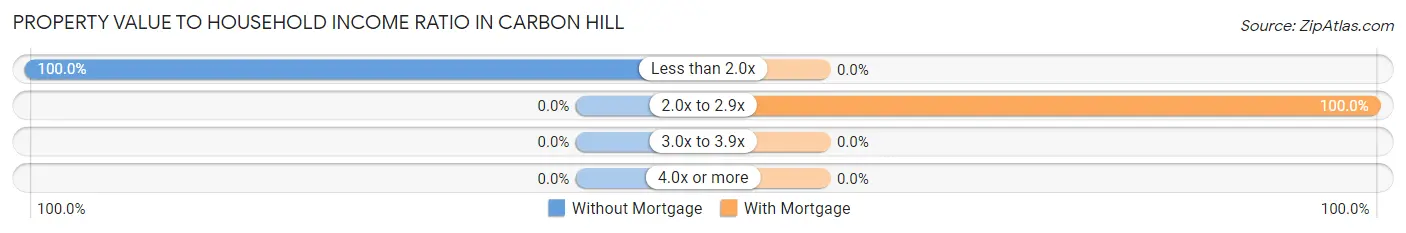
| Value-to-Income Ratio | Without Mortgage | With Mortgage |
| Less than 2.0x | 10 (100.0%) | 0 (0.0%) |
| 2.0x to 2.9x | 0 (0.0%) | 12 (100.0%) |
| 3.0x to 3.9x | 0 (0.0%) | 0 (0.0%) |
| 4.0x or more | 0 (0.0%) | 0 (0.0%) |
| Total | 10 (100.0%) | 12 (100.0%) |
Real Estate Taxes by Mortgage Status in Carbon Hill
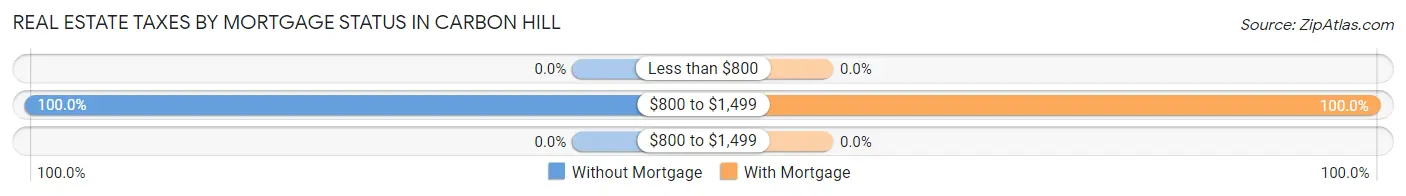
| Property Taxes | Without Mortgage | With Mortgage |
| Less than $800 | 0 (0.0%) | 0 (0.0%) |
| $800 to $1,499 | 10 (100.0%) | 12 (100.0%) |
| $800 to $1,499 | 0 (0.0%) | 0 (0.0%) |
| Total | 10 (100.0%) | 12 (100.0%) |
Health & Disability in Carbon Hill
Health Insurance Coverage by Age in Carbon Hill
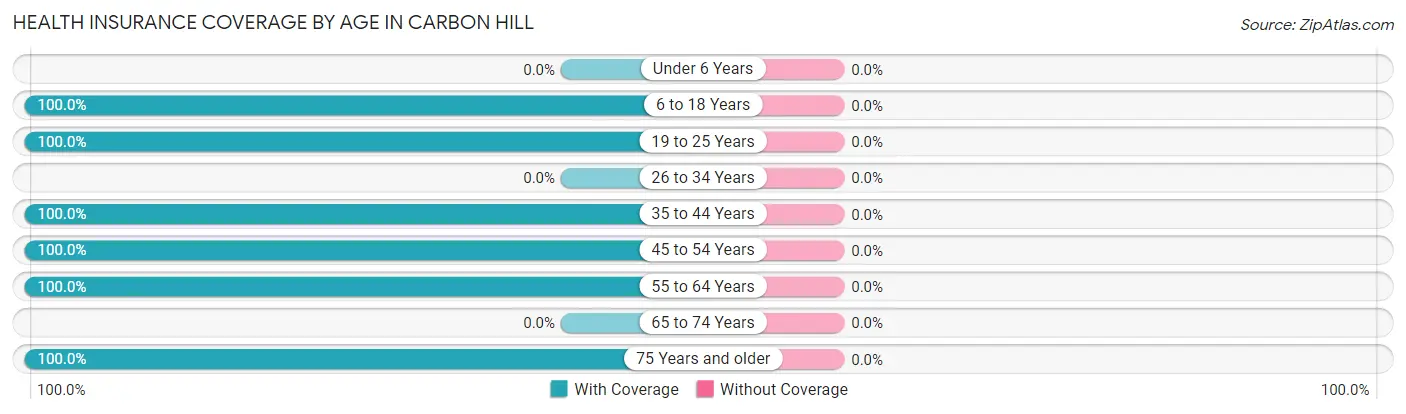
| Age Bracket | With Coverage | Without Coverage |
| Under 6 Years | 0 (0.0%) | 0 (0.0%) |
| 6 to 18 Years | 23 (100.0%) | 0 (0.0%) |
| 19 to 25 Years | 16 (100.0%) | 0 (0.0%) |
| 26 to 34 Years | 0 (0.0%) | 0 (0.0%) |
| 35 to 44 Years | 5 (100.0%) | 0 (0.0%) |
| 45 to 54 Years | 30 (100.0%) | 0 (0.0%) |
| 55 to 64 Years | 33 (100.0%) | 0 (0.0%) |
| 65 to 74 Years | 0 (0.0%) | 0 (0.0%) |
| 75 Years and older | 10 (100.0%) | 0 (0.0%) |
| Total | 117 (100.0%) | 0 (0.0%) |
Health Insurance Coverage by Citizenship Status in Carbon Hill
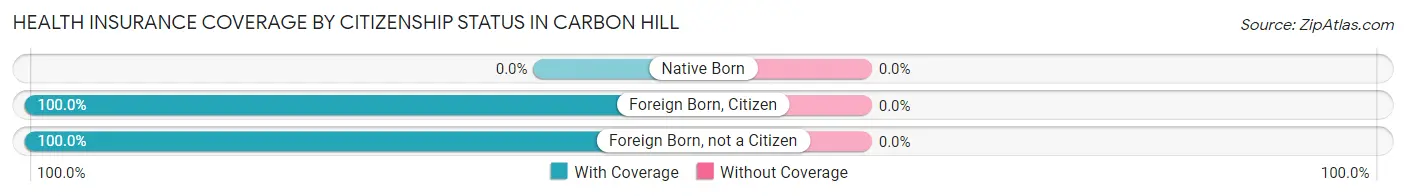
| Citizenship Status | With Coverage | Without Coverage |
| Native Born | 0 (0.0%) | 0 (0.0%) |
| Foreign Born, Citizen | 23 (100.0%) | 0 (0.0%) |
| Foreign Born, not a Citizen | 16 (100.0%) | 0 (0.0%) |
Health Insurance Coverage by Household Income in Carbon Hill
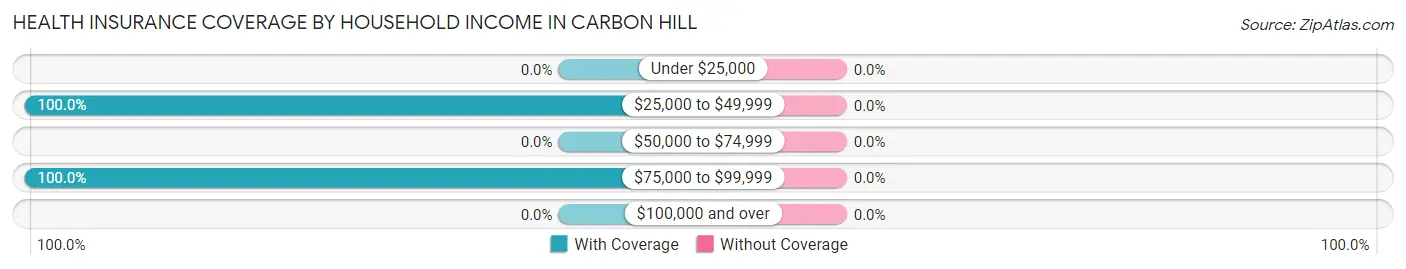
| Household Income | With Coverage | Without Coverage |
| Under $25,000 | 0 (0.0%) | 0 (0.0%) |
| $25,000 to $49,999 | 35 (100.0%) | 0 (0.0%) |
| $50,000 to $74,999 | 0 (0.0%) | 0 (0.0%) |
| $75,000 to $99,999 | 82 (100.0%) | 0 (0.0%) |
| $100,000 and over | 0 (0.0%) | 0 (0.0%) |
Public vs Private Health Insurance Coverage by Age in Carbon Hill
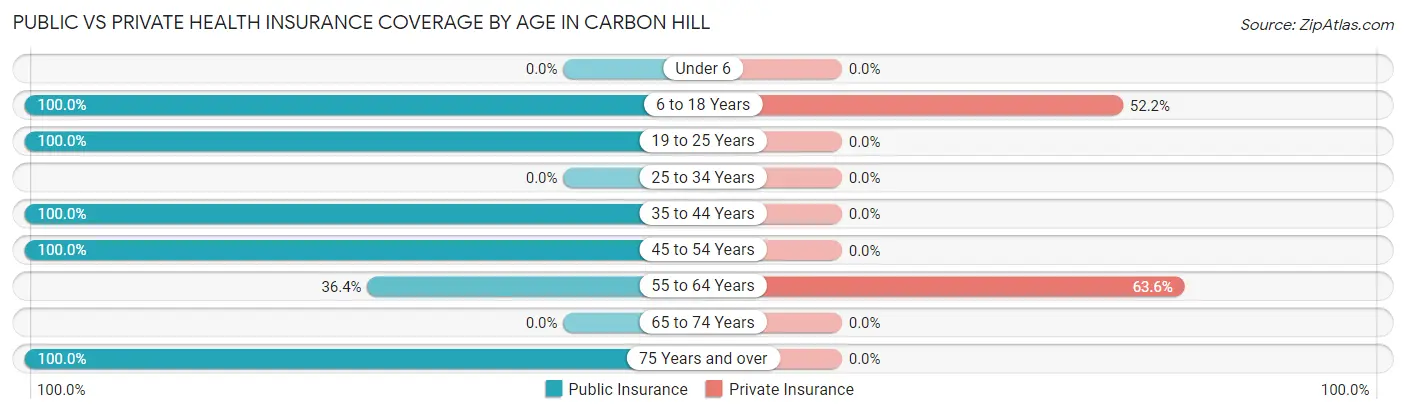
| Age Bracket | Public Insurance | Private Insurance |
| Under 6 | 0 (0.0%) | 0 (0.0%) |
| 6 to 18 Years | 23 (100.0%) | 12 (52.2%) |
| 19 to 25 Years | 16 (100.0%) | 0 (0.0%) |
| 25 to 34 Years | 0 (0.0%) | 0 (0.0%) |
| 35 to 44 Years | 5 (100.0%) | 0 (0.0%) |
| 45 to 54 Years | 30 (100.0%) | 0 (0.0%) |
| 55 to 64 Years | 12 (36.4%) | 21 (63.6%) |
| 65 to 74 Years | 0 (0.0%) | 0 (0.0%) |
| 75 Years and over | 10 (100.0%) | 0 (0.0%) |
| Total | 96 (82.1%) | 33 (28.2%) |
Disability Status by Sex by Age in Carbon Hill
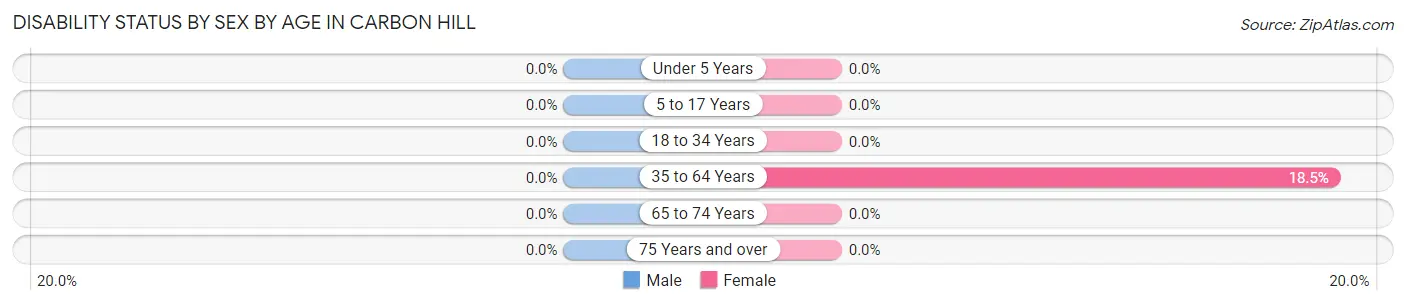
| Age Bracket | Male | Female |
| Under 5 Years | 0 (0.0%) | 0 (0.0%) |
| 5 to 17 Years | 0 (0.0%) | 0 (0.0%) |
| 18 to 34 Years | 0 (0.0%) | 0 (0.0%) |
| 35 to 64 Years | 0 (0.0%) | 5 (18.5%) |
| 65 to 74 Years | 0 (0.0%) | 0 (0.0%) |
| 75 Years and over | 0 (0.0%) | 0 (0.0%) |
Disability Class by Sex by Age in Carbon Hill
Disability Class: Hearing Difficulty
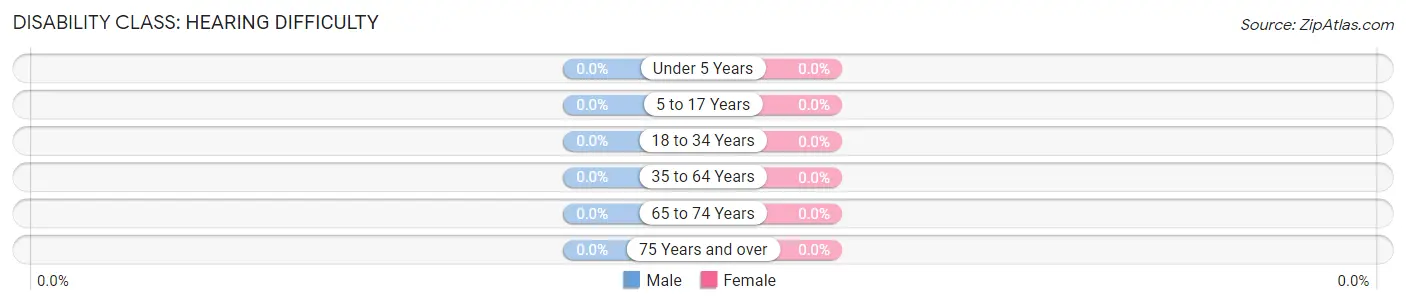
| Age Bracket | Male | Female |
| Under 5 Years | 0 (0.0%) | 0 (0.0%) |
| 5 to 17 Years | 0 (0.0%) | 0 (0.0%) |
| 18 to 34 Years | 0 (0.0%) | 0 (0.0%) |
| 35 to 64 Years | 0 (0.0%) | 0 (0.0%) |
| 65 to 74 Years | 0 (0.0%) | 0 (0.0%) |
| 75 Years and over | 0 (0.0%) | 0 (0.0%) |
Disability Class: Vision Difficulty
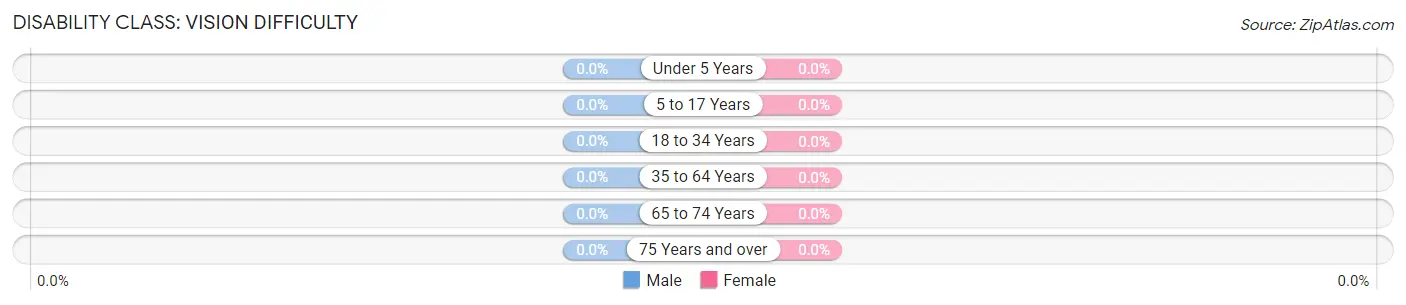
| Age Bracket | Male | Female |
| Under 5 Years | 0 (0.0%) | 0 (0.0%) |
| 5 to 17 Years | 0 (0.0%) | 0 (0.0%) |
| 18 to 34 Years | 0 (0.0%) | 0 (0.0%) |
| 35 to 64 Years | 0 (0.0%) | 0 (0.0%) |
| 65 to 74 Years | 0 (0.0%) | 0 (0.0%) |
| 75 Years and over | 0 (0.0%) | 0 (0.0%) |
Disability Class: Cognitive Difficulty
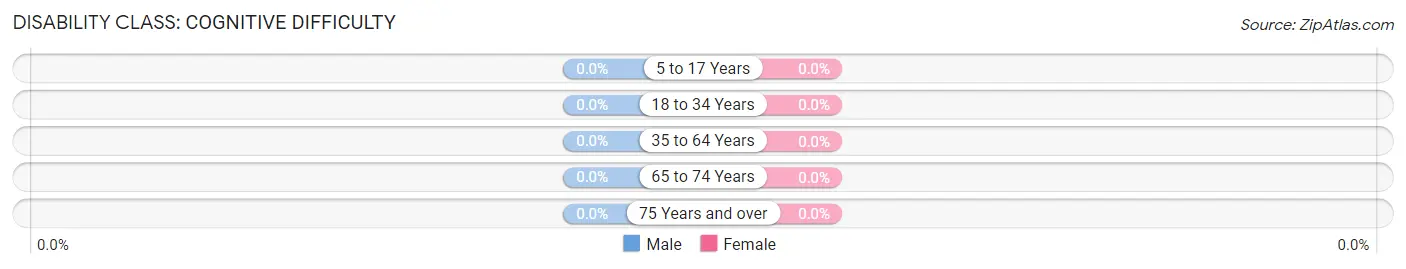
| Age Bracket | Male | Female |
| 5 to 17 Years | 0 (0.0%) | 0 (0.0%) |
| 18 to 34 Years | 0 (0.0%) | 0 (0.0%) |
| 35 to 64 Years | 0 (0.0%) | 0 (0.0%) |
| 65 to 74 Years | 0 (0.0%) | 0 (0.0%) |
| 75 Years and over | 0 (0.0%) | 0 (0.0%) |
Disability Class: Ambulatory Difficulty
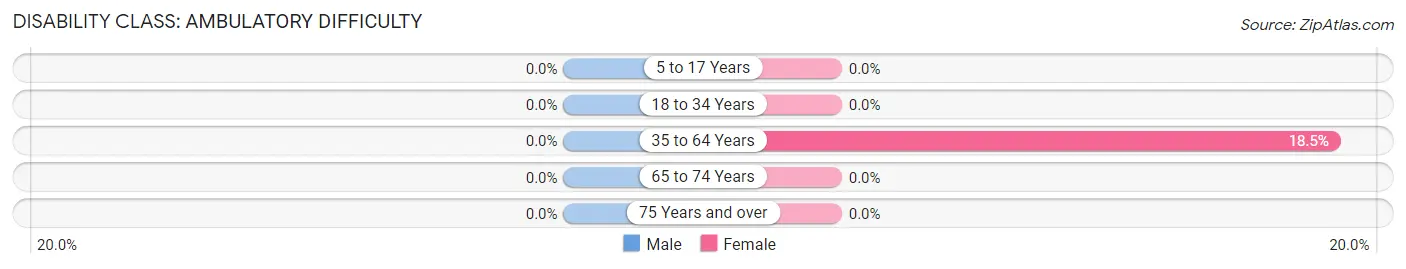
| Age Bracket | Male | Female |
| 5 to 17 Years | 0 (0.0%) | 0 (0.0%) |
| 18 to 34 Years | 0 (0.0%) | 0 (0.0%) |
| 35 to 64 Years | 0 (0.0%) | 5 (18.5%) |
| 65 to 74 Years | 0 (0.0%) | 0 (0.0%) |
| 75 Years and over | 0 (0.0%) | 0 (0.0%) |
Disability Class: Self-Care Difficulty
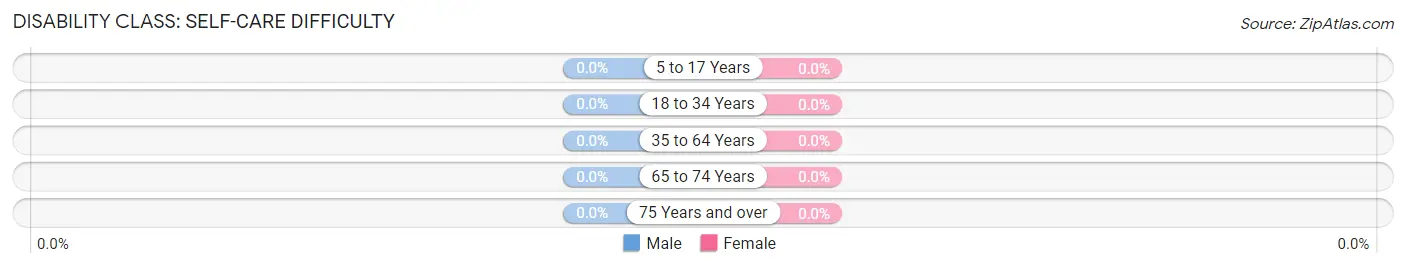
| Age Bracket | Male | Female |
| 5 to 17 Years | 0 (0.0%) | 0 (0.0%) |
| 18 to 34 Years | 0 (0.0%) | 0 (0.0%) |
| 35 to 64 Years | 0 (0.0%) | 0 (0.0%) |
| 65 to 74 Years | 0 (0.0%) | 0 (0.0%) |
| 75 Years and over | 0 (0.0%) | 0 (0.0%) |
Technology Access in Carbon Hill
Computing Device Access in Carbon Hill
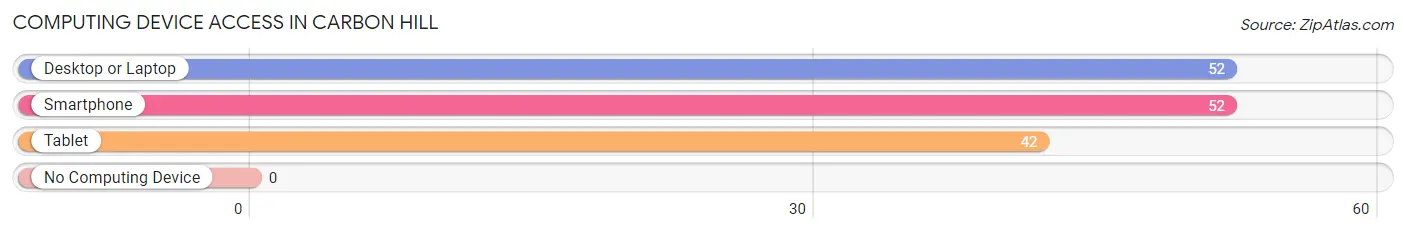
| Device Type | # Households | % Households |
| Desktop or Laptop | 52 | 100.0% |
| Smartphone | 52 | 100.0% |
| Tablet | 42 | 80.8% |
| No Computing Device | 0 | 0.0% |
| Total | 52 | 100.0% |
Internet Access in Carbon Hill
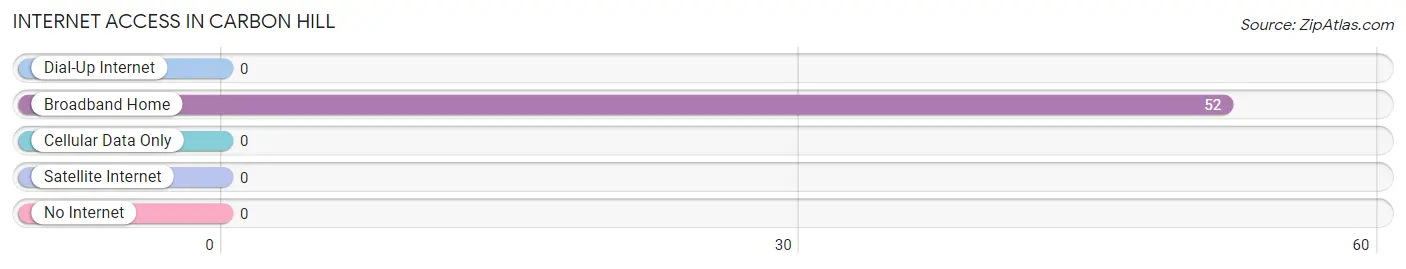
| Internet Type | # Households | % Households |
| Dial-Up Internet | 0 | 0.0% |
| Broadband Home | 52 | 100.0% |
| Cellular Data Only | 0 | 0.0% |
| Satellite Internet | 0 | 0.0% |
| No Internet | 0 | 0.0% |
| Total | 52 | 100.0% |
Carbon Hill Summary
Carbon Hill is a small village located in the southeastern corner of Ohio, in the county of Guernsey. It is situated on the banks of the Muskingum River, and is surrounded by rolling hills and farmland. The village has a population of just over 500 people, and is home to a variety of businesses, including a grocery store, a gas station, a post office, and a few restaurants.
History
Carbon Hill was first settled in the early 1800s by a group of settlers from Pennsylvania. The village was originally known as “Carbon Hill” due to the abundance of coal in the area. The coal was used to power the local industries, such as the grist mill and saw mill. The village was officially incorporated in 1837, and the first post office was established in 1845.
In the late 1800s, the village experienced a period of growth and prosperity. The railroad was extended to Carbon Hill in 1881, and the village became a hub for the coal industry. The coal industry provided jobs for many of the local residents, and the village experienced a period of growth and development.
Geography
Carbon Hill is located in the southeastern corner of Ohio, in the county of Guernsey. It is situated on the banks of the Muskingum River, and is surrounded by rolling hills and farmland. The village is located approximately 25 miles from the city of Cambridge, and is about an hour’s drive from the state capital of Columbus.
The village is located in a rural area, and is surrounded by farmland and forests. The climate in Carbon Hill is generally mild, with temperatures ranging from the low 30s in the winter to the mid-80s in the summer.
Economy
The economy of Carbon Hill is largely based on agriculture and tourism. The village is home to a variety of businesses, including a grocery store, a gas station, a post office, and a few restaurants. The village also has a few small manufacturing businesses, such as a furniture factory and a woodworking shop.
The village is also home to a number of tourist attractions, including the Muskingum River Museum, the Carbon Hill Historical Society, and the Carbon Hill Nature Center. These attractions draw visitors from all over the region, and help to support the local economy.
Demographics
As of the 2010 census, the population of Carbon Hill was 514. The racial makeup of the village was 97.3% White, 0.6% African American, 0.2% Native American, 0.4% Asian, and 1.5% from other races. The median household income was $37,500, and the median age was 43.
Conclusion
Carbon Hill is a small village located in the southeastern corner of Ohio, in the county of Guernsey. It is situated on the banks of the Muskingum River, and is surrounded by rolling hills and farmland. The village has a population of just over 500 people, and is home to a variety of businesses, including a grocery store, a gas station, a post office, and a few restaurants. The economy of Carbon Hill is largely based on agriculture and tourism, and the village is home to a number of tourist attractions. The racial makeup of the village is predominantly White, with a small percentage of African American, Native American, and Asian residents. The median household income is $37,500, and the median age is 43.
Common Questions
What is Per Capita Income in Carbon Hill?
Per Capita income in Carbon Hill is $26,307.
What is the Median Family Income in Carbon Hill?
Median Family Income in Carbon Hill is $78,667.
What is the Median Household income in Carbon Hill?
Median Household Income in Carbon Hill is $78,667.
What is Inequality or Gini Index in Carbon Hill?
Inequality or Gini Index in Carbon Hill is 0.13.
What is the Total Population of Carbon Hill?
Total Population of Carbon Hill is 117.
What is the Total Male Population of Carbon Hill?
Total Male Population of Carbon Hill is 63.
What is the Total Female Population of Carbon Hill?
Total Female Population of Carbon Hill is 54.
What is the Ratio of Males per 100 Females in Carbon Hill?
There are 116.67 Males per 100 Females in Carbon Hill.
What is the Ratio of Females per 100 Males in Carbon Hill?
There are 85.71 Females per 100 Males in Carbon Hill.
What is the Median Population Age in Carbon Hill?
Median Population Age in Carbon Hill is 52.5 Years.
What is the Average Family Size in Carbon Hill
Average Family Size in Carbon Hill is 2.2 People.
What is the Average Household Size in Carbon Hill
Average Household Size in Carbon Hill is 2.2 People.
How Large is the Labor Force in Carbon Hill?
There are 79 People in the Labor Forcein in Carbon Hill.
What is the Percentage of People in the Labor Force in Carbon Hill?
74.5% of People are in the Labor Force in Carbon Hill.
What is the Unemployment Rate in Carbon Hill?
Unemployment Rate in Carbon Hill is 12.7%.