Camden, OH Map & Demographics
Camden Map
Camden Overview
$23,204
PER CAPITA INCOME
$55,313
AVG FAMILY INCOME
$49,667
AVG HOUSEHOLD INCOME
21.0%
WAGE / INCOME GAP [ % ]
79.0¢/ $1
WAGE / INCOME GAP [ $ ]
$13,146
FAMILY INCOME DEFICIT
0.43
INEQUALITY / GINI INDEX
1,977
TOTAL POPULATION
1,090
MALE POPULATION
887
FEMALE POPULATION
122.89
MALES / 100 FEMALES
81.38
FEMALES / 100 MALES
45.1
MEDIAN AGE
2.6
AVG FAMILY SIZE
2.5
AVG HOUSEHOLD SIZE
747
LABOR FORCE [ PEOPLE ]
43.7%
PERCENT IN LABOR FORCE
4.7%
UNEMPLOYMENT RATE
Camden Zip Codes
Income in Camden
Income Overview in Camden
Per Capita Income in Camden is $23,204, while median incomes of families and households are $55,313 and $49,667 respectively.
| Characteristic | Number | Measure |
| Per Capita Income | 1,977 | $23,204 |
| Median Family Income | 611 | $55,313 |
| Mean Family Income | 611 | $61,364 |
| Median Household Income | 794 | $49,667 |
| Mean Household Income | 794 | $56,143 |
| Income Deficit | 611 | $13,146 |
| Wage / Income Gap (%) | 1,977 | 21.02% |
| Wage / Income Gap ($) | 1,977 | 78.98¢ per $1 |
| Gini / Inequality Index | 1,977 | 0.43 |
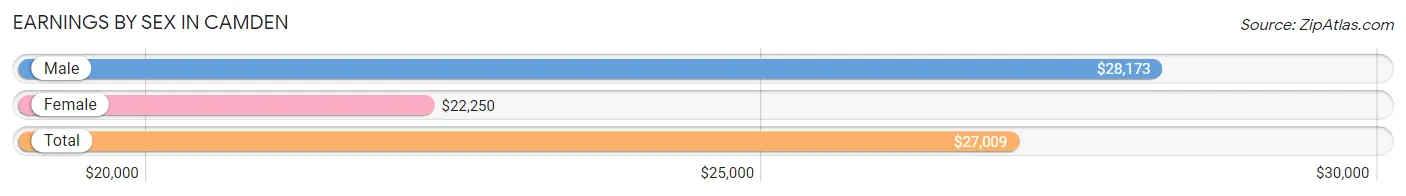
Earnings by Sex in Camden
Average Earnings in Camden are $27,009, $28,173 for men and $22,250 for women, a difference of 21.0%.
| Sex | Number | Average Earnings |
| Male | 485 (52.6%) | $28,173 |
| Female | 437 (47.4%) | $22,250 |
| Total | 922 (100.0%) | $27,009 |
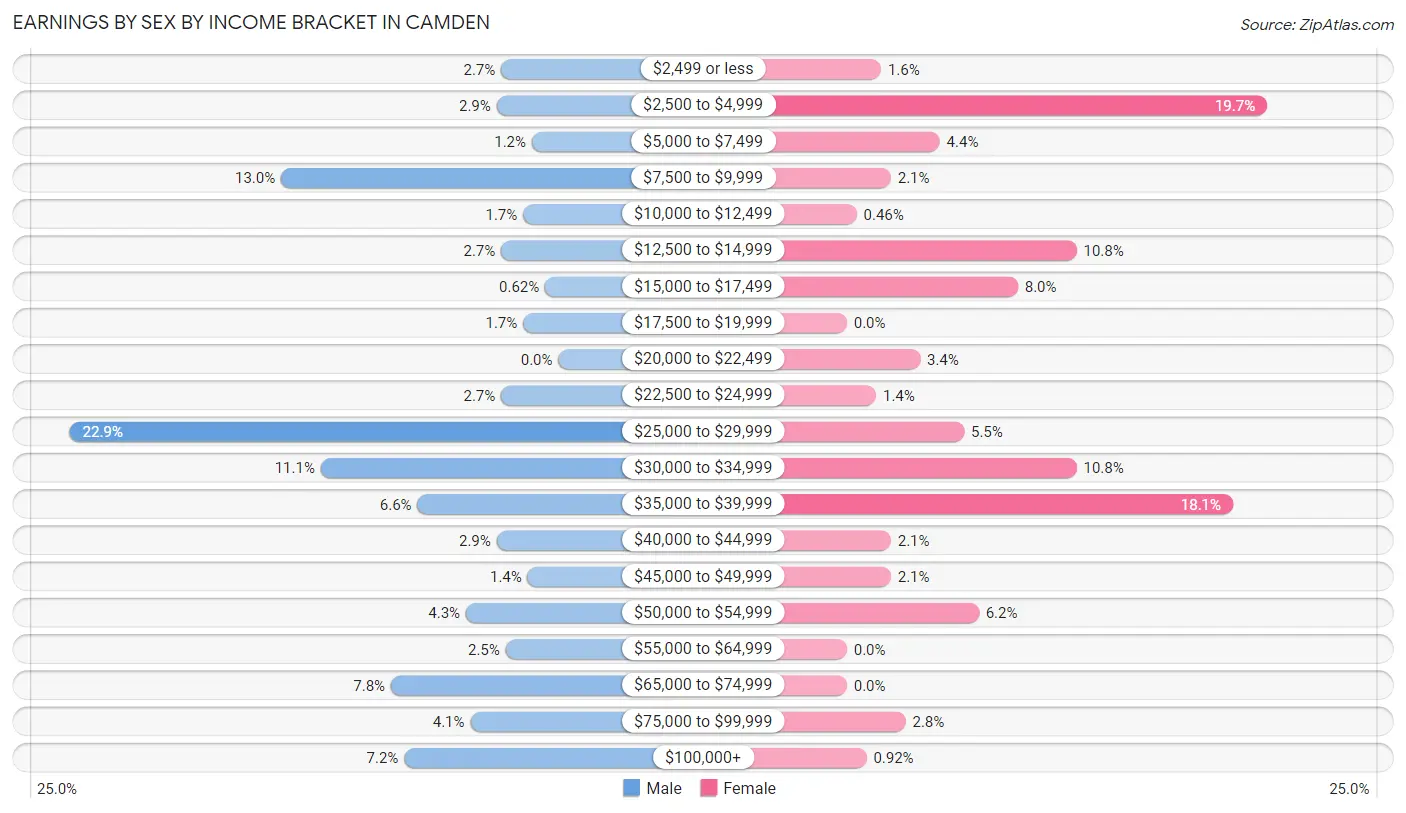
Earnings by Sex by Income Bracket in Camden
The most common earnings brackets in Camden are $25,000 to $29,999 for men (111 | 22.9%) and $2,500 to $4,999 for women (86 | 19.7%).
| Income | Male | Female |
| $2,499 or less | 13 (2.7%) | 7 (1.6%) |
| $2,500 to $4,999 | 14 (2.9%) | 86 (19.7%) |
| $5,000 to $7,499 | 6 (1.2%) | 19 (4.3%) |
| $7,500 to $9,999 | 63 (13.0%) | 9 (2.1%) |
| $10,000 to $12,499 | 8 (1.7%) | 2 (0.5%) |
| $12,500 to $14,999 | 13 (2.7%) | 47 (10.8%) |
| $15,000 to $17,499 | 3 (0.6%) | 35 (8.0%) |
| $17,500 to $19,999 | 8 (1.7%) | 0 (0.0%) |
| $20,000 to $22,499 | 0 (0.0%) | 15 (3.4%) |
| $22,500 to $24,999 | 13 (2.7%) | 6 (1.4%) |
| $25,000 to $29,999 | 111 (22.9%) | 24 (5.5%) |
| $30,000 to $34,999 | 54 (11.1%) | 47 (10.8%) |
| $35,000 to $39,999 | 32 (6.6%) | 79 (18.1%) |
| $40,000 to $44,999 | 14 (2.9%) | 9 (2.1%) |
| $45,000 to $49,999 | 7 (1.4%) | 9 (2.1%) |
| $50,000 to $54,999 | 21 (4.3%) | 27 (6.2%) |
| $55,000 to $64,999 | 12 (2.5%) | 0 (0.0%) |
| $65,000 to $74,999 | 38 (7.8%) | 0 (0.0%) |
| $75,000 to $99,999 | 20 (4.1%) | 12 (2.8%) |
| $100,000+ | 35 (7.2%) | 4 (0.9%) |
| Total | 485 (100.0%) | 437 (100.0%) |
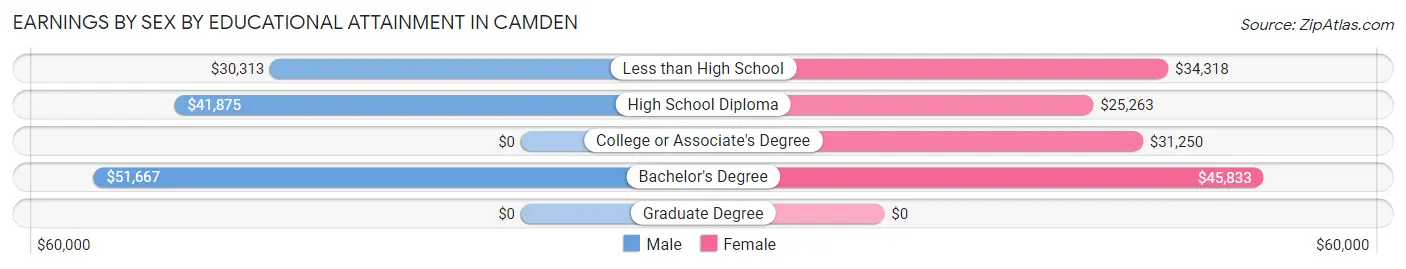
Earnings by Sex by Educational Attainment in Camden
Average earnings in Camden are $39,750 for men and $30,893 for women, a difference of 22.3%. Men with an educational attainment of bachelor's degree enjoy the highest average annual earnings of $51,667, while those with less than high school education earn the least with $30,313. Women with an educational attainment of bachelor's degree earn the most with the average annual earnings of $45,833, while those with high school diploma education have the smallest earnings of $25,263.
| Educational Attainment | Male Income | Female Income |
| Less than High School | $30,313 | $34,318 |
| High School Diploma | $41,875 | $25,263 |
| College or Associate's Degree | - | - |
| Bachelor's Degree | $51,667 | $45,833 |
| Graduate Degree | - | - |
| Total | $39,750 | $30,893 |
Family Income in Camden
Family Income Brackets in Camden
According to the Camden family income data, there are 194 families falling into the $50,000 to $74,999 income range, which is the most common income bracket and makes up 31.8% of all families. Conversely, the $200,000+ income bracket is the least frequent group with only 11 families (1.8%) belonging to this category.
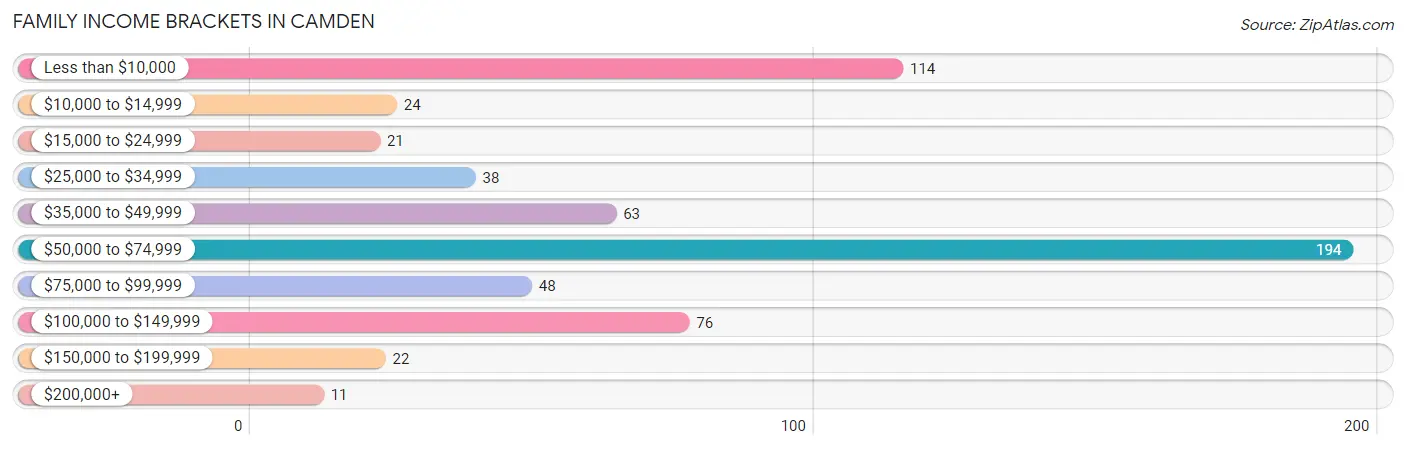
| Income Bracket | # Families | % Families |
| Less than $10,000 | 114 | 18.7% |
| $10,000 to $14,999 | 24 | 3.9% |
| $15,000 to $24,999 | 21 | 3.4% |
| $25,000 to $34,999 | 38 | 6.2% |
| $35,000 to $49,999 | 63 | 10.3% |
| $50,000 to $74,999 | 194 | 31.8% |
| $75,000 to $99,999 | 48 | 7.9% |
| $100,000 to $149,999 | 76 | 12.4% |
| $150,000 to $199,999 | 22 | 3.6% |
| $200,000+ | 11 | 1.8% |
Family Income by Famaliy Size in Camden
3-person families (150 | 24.5%) account for the highest median family income in Camden with $63,371 per family, while 2-person families (372 | 60.9%) have the highest median income of $23,214 per family member.
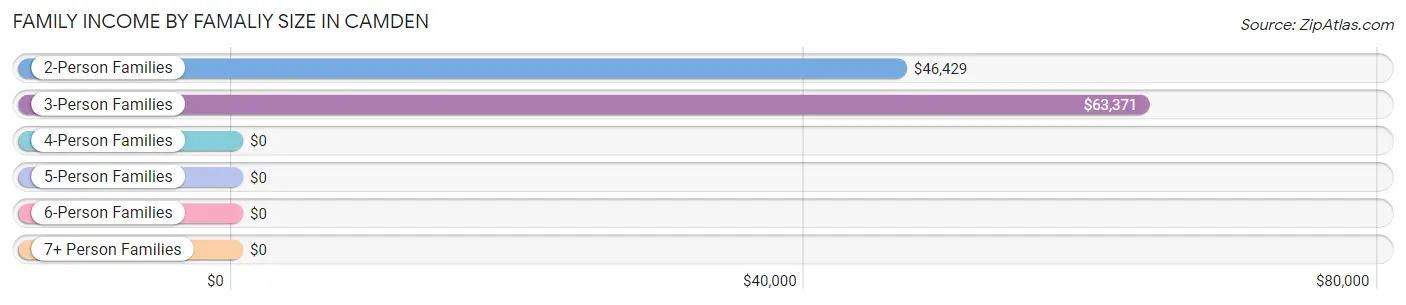
| Income Bracket | # Families | Median Income |
| 2-Person Families | 372 (60.9%) | $46,429 |
| 3-Person Families | 150 (24.5%) | $63,371 |
| 4-Person Families | 64 (10.5%) | $0 |
| 5-Person Families | 10 (1.6%) | $0 |
| 6-Person Families | 4 (0.6%) | $0 |
| 7+ Person Families | 11 (1.8%) | $0 |
| Total | 611 (100.0%) | $55,313 |
Family Income by Number of Earners in Camden
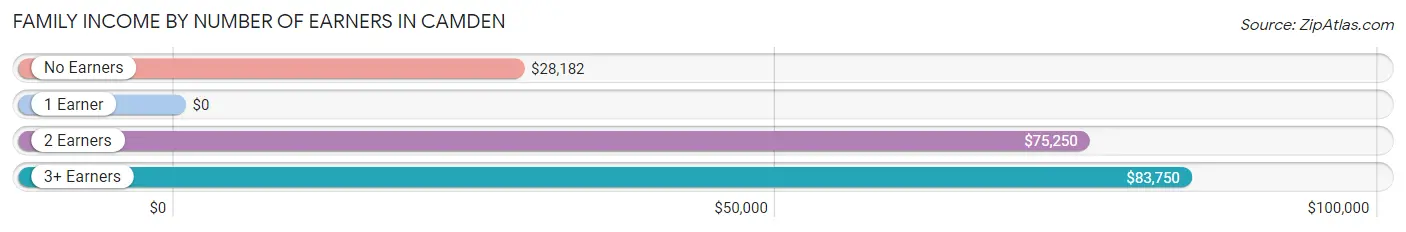
| Number of Earners | # Families | Median Income |
| No Earners | 154 (25.2%) | $28,182 |
| 1 Earner | 198 (32.4%) | $0 |
| 2 Earners | 235 (38.5%) | $75,250 |
| 3+ Earners | 24 (3.9%) | $83,750 |
| Total | 611 (100.0%) | $55,313 |
Household Income in Camden
Household Income Brackets in Camden
With 220 households falling in the category, the $50,000 to $74,999 income range is the most frequent in Camden, accounting for 27.7% of all households. In contrast, only 11 households (1.4%) fall into the $200,000+ income bracket, making it the least populous group.
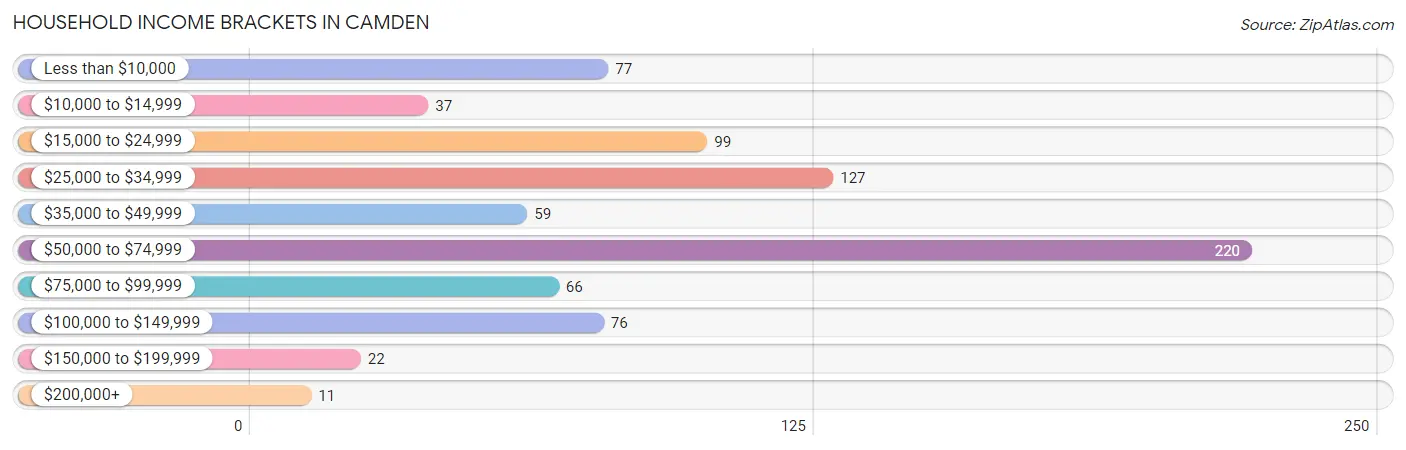
| Income Bracket | # Households | % Households |
| Less than $10,000 | 77 | 9.7% |
| $10,000 to $14,999 | 37 | 4.7% |
| $15,000 to $24,999 | 99 | 12.5% |
| $25,000 to $34,999 | 127 | 16.0% |
| $35,000 to $49,999 | 59 | 7.4% |
| $50,000 to $74,999 | 220 | 27.7% |
| $75,000 to $99,999 | 66 | 8.3% |
| $100,000 to $149,999 | 76 | 9.6% |
| $150,000 to $199,999 | 22 | 2.8% |
| $200,000+ | 11 | 1.4% |
Household Income by Householder Age in Camden
The median household income in Camden is $49,667, with the highest median household income of $62,732 found in the 45 to 64 years age bracket for the primary householder. A total of 335 households (42.2%) fall into this category. Meanwhile, the 65+ years age bracket for the primary householder has the lowest median household income of $0, with 238 households (30.0%) in this group.
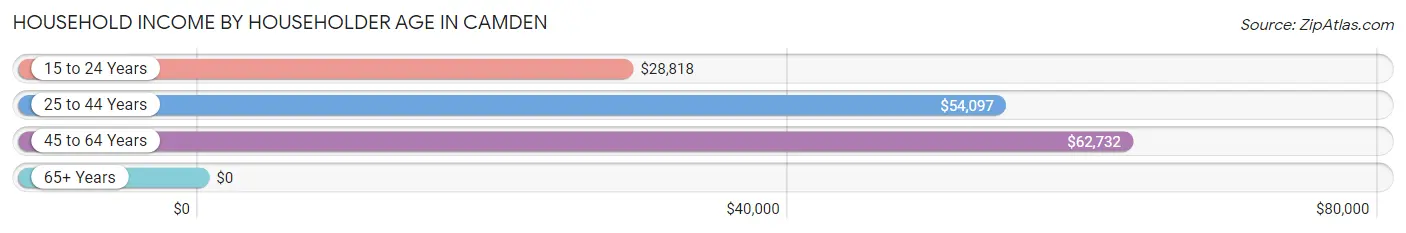
| Income Bracket | # Households | Median Income |
| 15 to 24 Years | 84 (10.6%) | $28,818 |
| 25 to 44 Years | 137 (17.2%) | $54,097 |
| 45 to 64 Years | 335 (42.2%) | $62,732 |
| 65+ Years | 238 (30.0%) | $0 |
| Total | 794 (100.0%) | $49,667 |
Poverty in Camden
Income Below Poverty by Sex and Age in Camden
With 19.0% poverty level for males and 28.5% for females among the residents of Camden, under 5 year old males and 12 to 14 year old females are the most vulnerable to poverty, with 59 males (70.2%) and 2 females (100.0%) in their respective age groups living below the poverty level.
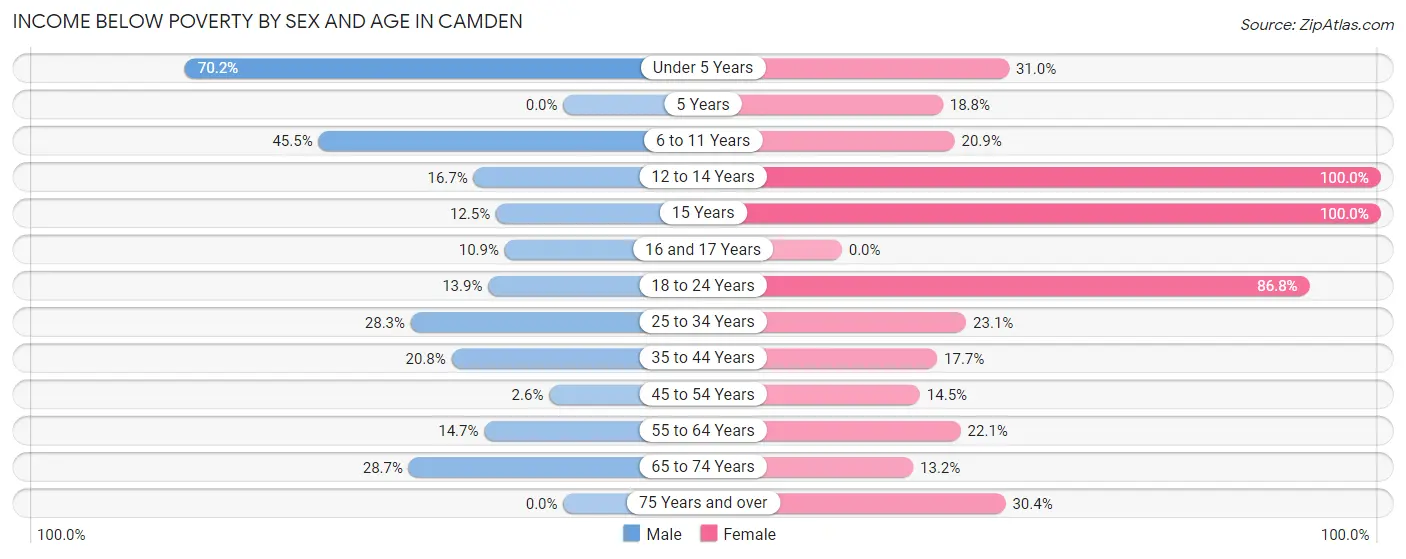
| Age Bracket | Male | Female |
| Under 5 Years | 59 (70.2%) | 9 (31.0%) |
| 5 Years | 0 (0.0%) | 3 (18.8%) |
| 6 to 11 Years | 10 (45.5%) | 9 (20.9%) |
| 12 to 14 Years | 6 (16.7%) | 2 (100.0%) |
| 15 Years | 3 (12.5%) | 12 (100.0%) |
| 16 and 17 Years | 10 (10.9%) | 0 (0.0%) |
| 18 to 24 Years | 23 (13.9%) | 92 (86.8%) |
| 25 to 34 Years | 15 (28.3%) | 12 (23.1%) |
| 35 to 44 Years | 22 (20.7%) | 23 (17.7%) |
| 45 to 54 Years | 6 (2.6%) | 19 (14.5%) |
| 55 to 64 Years | 16 (14.7%) | 30 (22.1%) |
| 65 to 74 Years | 37 (28.7%) | 18 (13.2%) |
| 75 Years and over | 0 (0.0%) | 24 (30.4%) |
| Total | 207 (19.0%) | 253 (28.5%) |
Income Above Poverty by Sex and Age in Camden
According to the poverty statistics in Camden, males aged 75 years and over and females aged 16 and 17 years are the age groups that are most secure financially, with 100.0% of males and 100.0% of females in these age groups living above the poverty line.
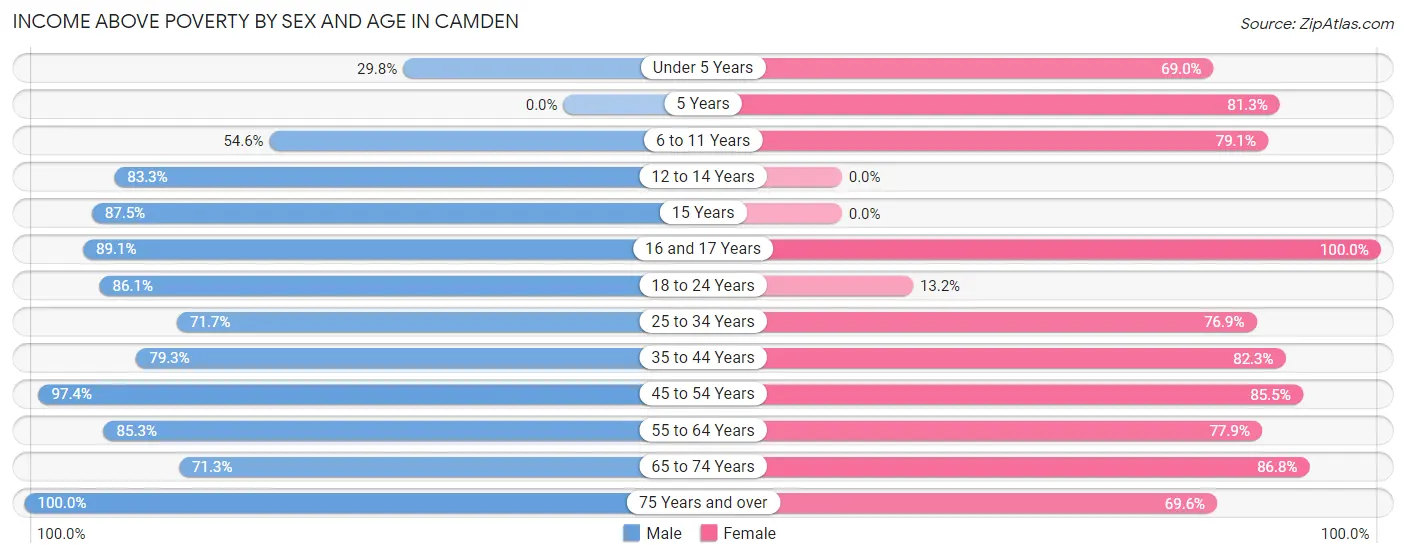
| Age Bracket | Male | Female |
| Under 5 Years | 25 (29.8%) | 20 (69.0%) |
| 5 Years | 0 (0.0%) | 13 (81.2%) |
| 6 to 11 Years | 12 (54.5%) | 34 (79.1%) |
| 12 to 14 Years | 30 (83.3%) | 0 (0.0%) |
| 15 Years | 21 (87.5%) | 0 (0.0%) |
| 16 and 17 Years | 82 (89.1%) | 15 (100.0%) |
| 18 to 24 Years | 142 (86.1%) | 14 (13.2%) |
| 25 to 34 Years | 38 (71.7%) | 40 (76.9%) |
| 35 to 44 Years | 84 (79.2%) | 107 (82.3%) |
| 45 to 54 Years | 223 (97.4%) | 112 (85.5%) |
| 55 to 64 Years | 93 (85.3%) | 106 (77.9%) |
| 65 to 74 Years | 92 (71.3%) | 118 (86.8%) |
| 75 Years and over | 41 (100.0%) | 55 (69.6%) |
| Total | 883 (81.0%) | 634 (71.5%) |
Income Below Poverty Among Married-Couple Families in Camden
The poverty statistics for married-couple families in Camden show that 7.0% or 27 of the total 385 families live below the poverty line. Families with no children have the highest poverty rate of 9.9%, comprising of 24 families. On the other hand, families with 3 or 4 children have the lowest poverty rate of 0.0%, which includes 0 families.
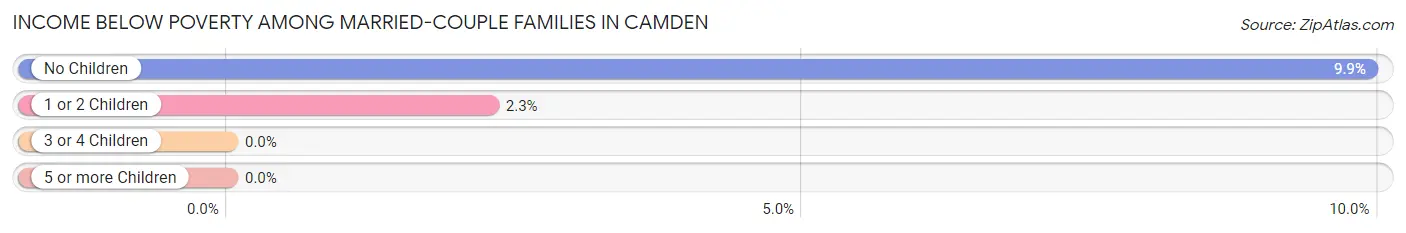
| Children | Above Poverty | Below Poverty |
| No Children | 218 (90.1%) | 24 (9.9%) |
| 1 or 2 Children | 129 (97.7%) | 3 (2.3%) |
| 3 or 4 Children | 11 (100.0%) | 0 (0.0%) |
| 5 or more Children | 0 (0.0%) | 0 (0.0%) |
| Total | 358 (93.0%) | 27 (7.0%) |
Income Below Poverty Among Single-Parent Households in Camden
According to the poverty data in Camden, 19.6% or 11 single-father households and 67.6% or 115 single-mother households are living below the poverty line. Among single-father households, those with 1 or 2 children have the highest poverty rate, with 7 households (28.0%) experiencing poverty. Likewise, among single-mother households, those with 3 or 4 children have the highest poverty rate, with 8 households (100.0%) falling below the poverty line.
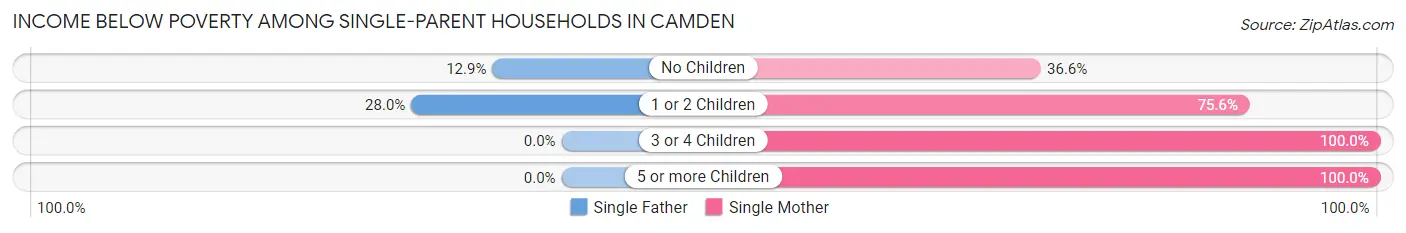
| Children | Single Father | Single Mother |
| No Children | 4 (12.9%) | 15 (36.6%) |
| 1 or 2 Children | 7 (28.0%) | 90 (75.6%) |
| 3 or 4 Children | 0 (0.0%) | 8 (100.0%) |
| 5 or more Children | 0 (0.0%) | 2 (100.0%) |
| Total | 11 (19.6%) | 115 (67.6%) |
Income Below Poverty Among Married-Couple vs Single-Parent Households in Camden
The poverty data for Camden shows that 27 of the married-couple family households (7.0%) and 126 of the single-parent households (55.7%) are living below the poverty level. Within the married-couple family households, those with no children have the highest poverty rate, with 24 households (9.9%) falling below the poverty line. Among the single-parent households, those with 3 or 4 children have the highest poverty rate, with 8 household (100.0%) living below poverty.
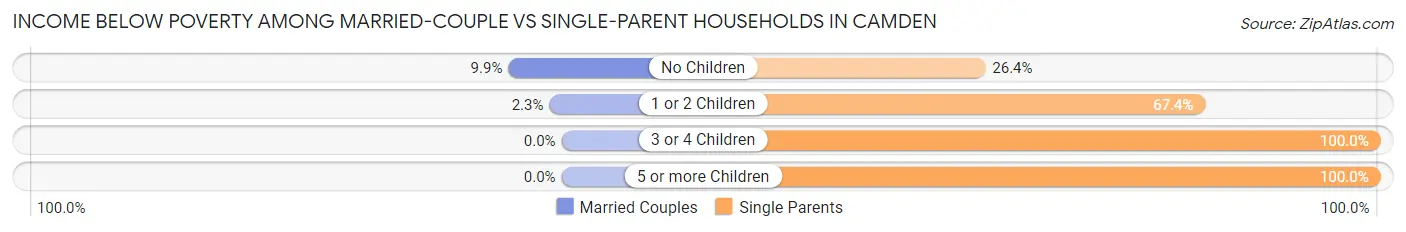
| Children | Married-Couple Families | Single-Parent Households |
| No Children | 24 (9.9%) | 19 (26.4%) |
| 1 or 2 Children | 3 (2.3%) | 97 (67.4%) |
| 3 or 4 Children | 0 (0.0%) | 8 (100.0%) |
| 5 or more Children | 0 (0.0%) | 2 (100.0%) |
| Total | 27 (7.0%) | 126 (55.7%) |
Race in Camden
The most populous races in Camden are White / Caucasian (1,945 | 98.4%), Black / African American (17 | 0.9%), and Two or more Races (15 | 0.8%).
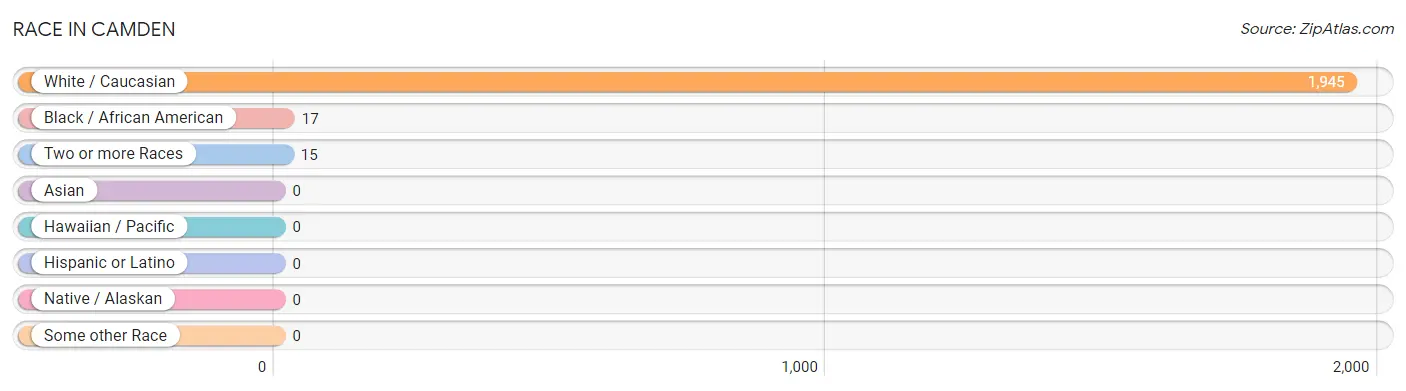
| Race | # Population | % Population |
| Asian | 0 | 0.0% |
| Black / African American | 17 | 0.9% |
| Hawaiian / Pacific | 0 | 0.0% |
| Hispanic or Latino | 0 | 0.0% |
| Native / Alaskan | 0 | 0.0% |
| White / Caucasian | 1,945 | 98.4% |
| Two or more Races | 15 | 0.8% |
| Some other Race | 0 | 0.0% |
| Total | 1,977 | 100.0% |
Ancestry in Camden
The most populous ancestries reported in Camden are American (305 | 15.4%), German (211 | 10.7%), English (162 | 8.2%), Irish (145 | 7.3%), and Italian (33 | 1.7%), together accounting for 43.3% of all Camden residents.
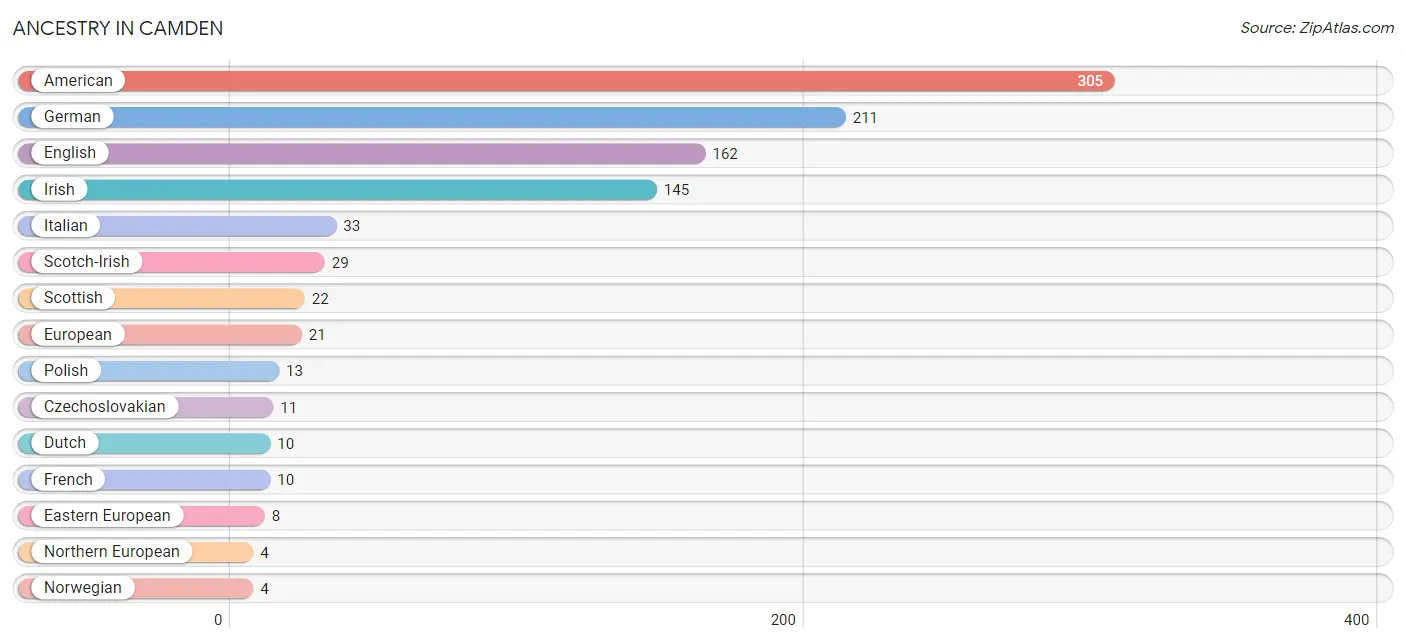
| Ancestry | # Population | % Population |
| American | 305 | 15.4% |
| British | 2 | 0.1% |
| Czechoslovakian | 11 | 0.6% |
| Dutch | 10 | 0.5% |
| Eastern European | 8 | 0.4% |
| English | 162 | 8.2% |
| European | 21 | 1.1% |
| French | 10 | 0.5% |
| German | 211 | 10.7% |
| Irish | 145 | 7.3% |
| Italian | 33 | 1.7% |
| Northern European | 4 | 0.2% |
| Norwegian | 4 | 0.2% |
| Pennsylvania German | 4 | 0.2% |
| Polish | 13 | 0.7% |
| Scandinavian | 3 | 0.2% |
| Scotch-Irish | 29 | 1.5% |
| Scottish | 22 | 1.1% | View All 18 Rows |
Immigrants in Camden

| Immigration Origin | # Population | % Population | View All 0 Rows |
Sex and Age in Camden
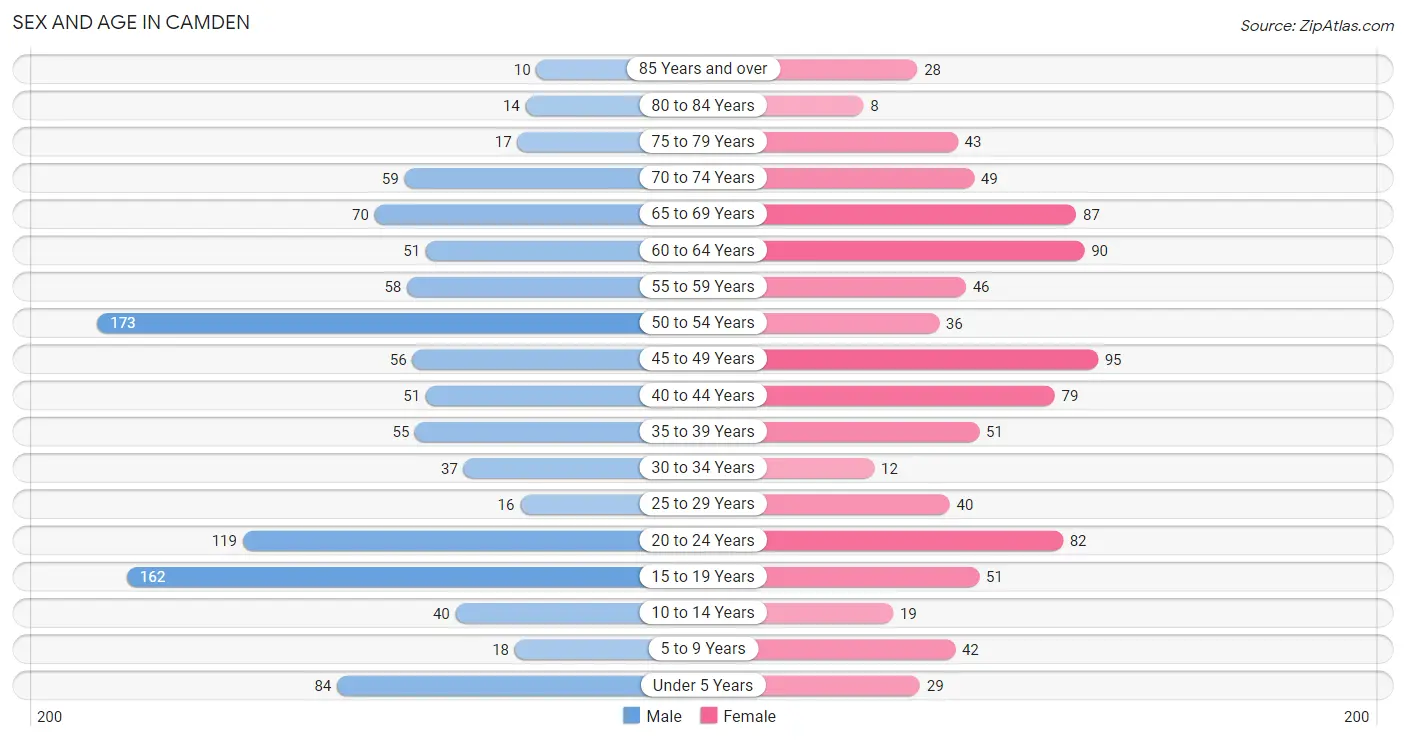
Sex and Age in Camden
The most populous age groups in Camden are 50 to 54 Years (173 | 15.9%) for men and 45 to 49 Years (95 | 10.7%) for women.
| Age Bracket | Male | Female |
| Under 5 Years | 84 (7.7%) | 29 (3.3%) |
| 5 to 9 Years | 18 (1.7%) | 42 (4.7%) |
| 10 to 14 Years | 40 (3.7%) | 19 (2.1%) |
| 15 to 19 Years | 162 (14.9%) | 51 (5.8%) |
| 20 to 24 Years | 119 (10.9%) | 82 (9.2%) |
| 25 to 29 Years | 16 (1.5%) | 40 (4.5%) |
| 30 to 34 Years | 37 (3.4%) | 12 (1.3%) |
| 35 to 39 Years | 55 (5.1%) | 51 (5.8%) |
| 40 to 44 Years | 51 (4.7%) | 79 (8.9%) |
| 45 to 49 Years | 56 (5.1%) | 95 (10.7%) |
| 50 to 54 Years | 173 (15.9%) | 36 (4.1%) |
| 55 to 59 Years | 58 (5.3%) | 46 (5.2%) |
| 60 to 64 Years | 51 (4.7%) | 90 (10.2%) |
| 65 to 69 Years | 70 (6.4%) | 87 (9.8%) |
| 70 to 74 Years | 59 (5.4%) | 49 (5.5%) |
| 75 to 79 Years | 17 (1.6%) | 43 (4.9%) |
| 80 to 84 Years | 14 (1.3%) | 8 (0.9%) |
| 85 Years and over | 10 (0.9%) | 28 (3.2%) |
| Total | 1,090 (100.0%) | 887 (100.0%) |
Families and Households in Camden
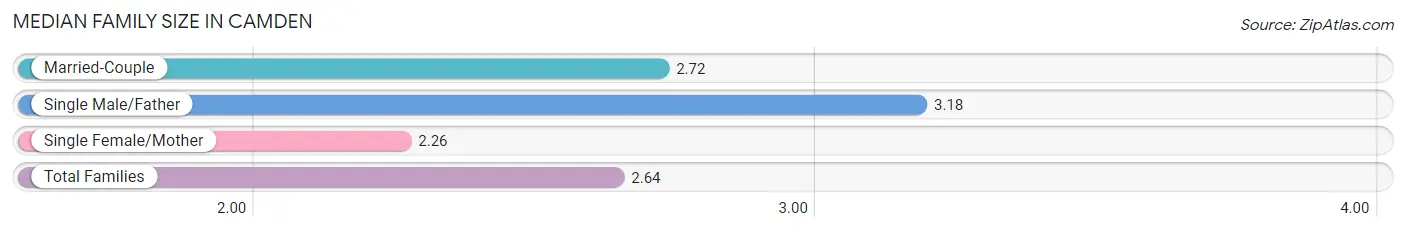
Median Family Size in Camden
The median family size in Camden is 2.64 persons per family, with single male/father families (56 | 9.2%) accounting for the largest median family size of 3.18 persons per family. On the other hand, single female/mother families (170 | 27.8%) represent the smallest median family size with 2.26 persons per family.
| Family Type | # Families | Family Size |
| Married-Couple | 385 (63.0%) | 2.72 |
| Single Male/Father | 56 (9.2%) | 3.18 |
| Single Female/Mother | 170 (27.8%) | 2.26 |
| Total Families | 611 (100.0%) | 2.64 |
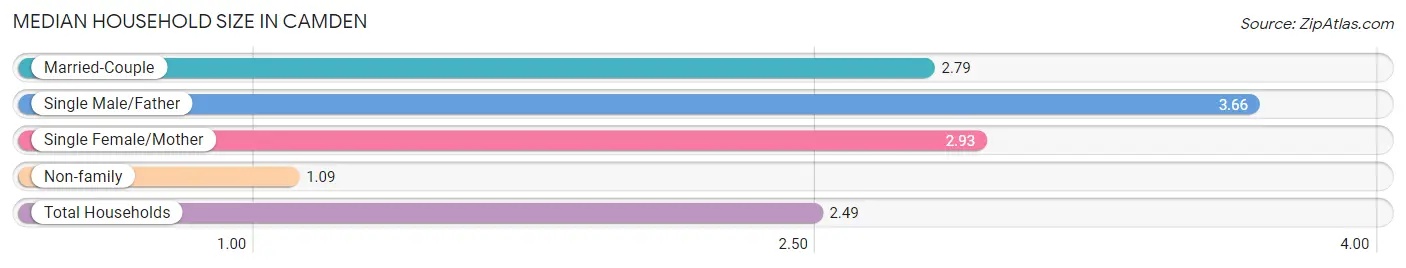
Median Household Size in Camden
The median household size in Camden is 2.49 persons per household, with single male/father households (56 | 7.0%) accounting for the largest median household size of 3.66 persons per household. non-family households (183 | 23.1%) represent the smallest median household size with 1.09 persons per household.
| Household Type | # Households | Household Size |
| Married-Couple | 385 (48.5%) | 2.79 |
| Single Male/Father | 56 (7.0%) | 3.66 |
| Single Female/Mother | 170 (21.4%) | 2.93 |
| Non-family | 183 (23.1%) | 1.09 |
| Total Households | 794 (100.0%) | 2.49 |
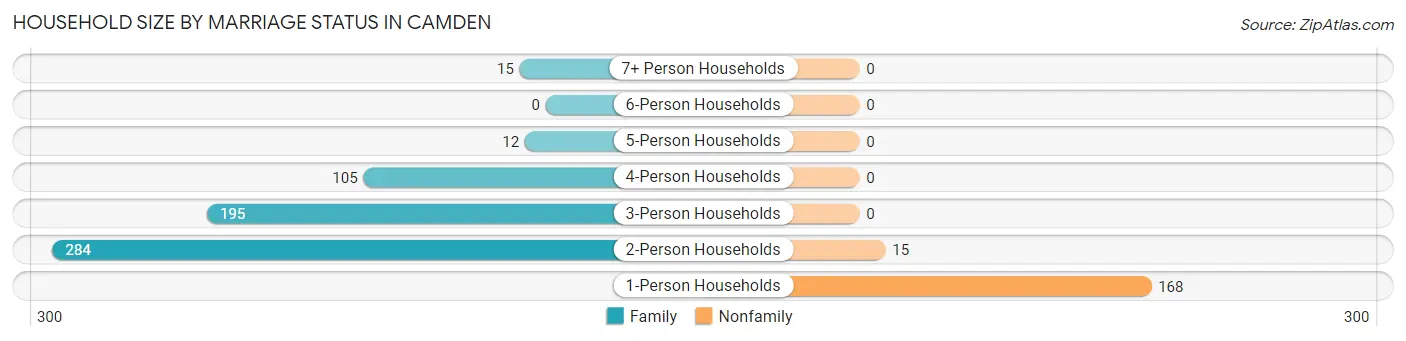
Household Size by Marriage Status in Camden
Out of a total of 794 households in Camden, 611 (76.9%) are family households, while 183 (23.1%) are nonfamily households. The most numerous type of family households are 2-person households, comprising 284, and the most common type of nonfamily households are 1-person households, comprising 168.
| Household Size | Family Households | Nonfamily Households |
| 1-Person Households | - | 168 (21.2%) |
| 2-Person Households | 284 (35.8%) | 15 (1.9%) |
| 3-Person Households | 195 (24.6%) | 0 (0.0%) |
| 4-Person Households | 105 (13.2%) | 0 (0.0%) |
| 5-Person Households | 12 (1.5%) | 0 (0.0%) |
| 6-Person Households | 0 (0.0%) | 0 (0.0%) |
| 7+ Person Households | 15 (1.9%) | 0 (0.0%) |
| Total | 611 (76.9%) | 183 (23.1%) |
Female Fertility in Camden
Fertility by Age in Camden
Average fertility rate in Camden is 51.0 births per 1,000 women. Women in the age bracket of 20 to 34 years have the highest fertility rate with 119.0 births per 1,000 women. Women in the age bracket of 20 to 34 years acount for 76.2% of all women with births.
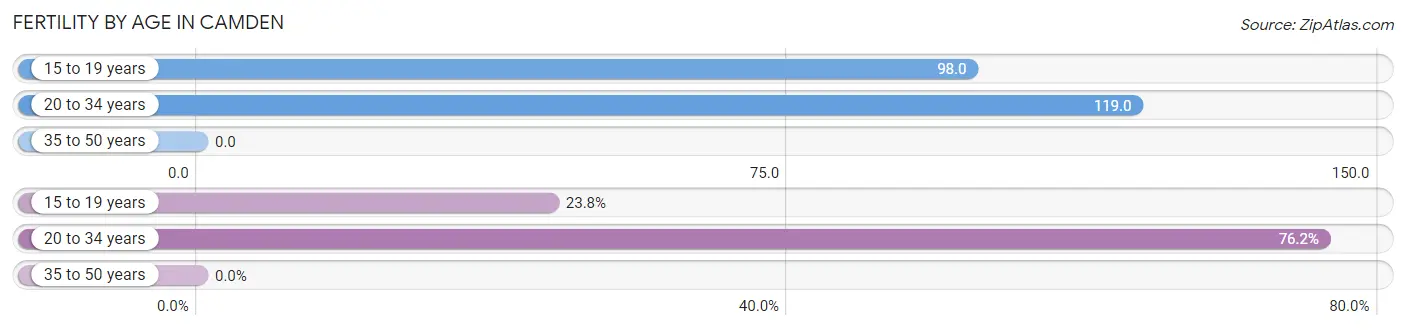
| Age Bracket | Women with Births | Births / 1,000 Women |
| 15 to 19 years | 5 (23.8%) | 98.0 |
| 20 to 34 years | 16 (76.2%) | 119.0 |
| 35 to 50 years | 0 (0.0%) | 0.0 |
| Total | 21 (100.0%) | 51.0 |
Fertility by Age by Marriage Status in Camden
52.4% of women with births (21) in Camden are married. The highest percentage of unmarried women with births falls into 20 to 34 years age bracket with 62.5% of them unmarried at the time of birth, while the lowest percentage of unmarried women with births belong to 15 to 19 years age bracket with 0.0% of them unmarried.
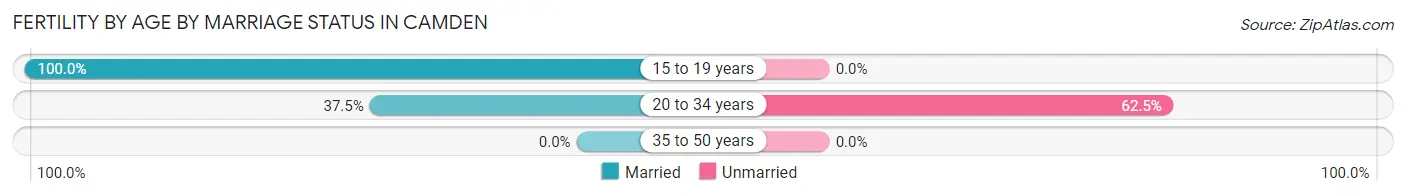
| Age Bracket | Married | Unmarried |
| 15 to 19 years | 5 (100.0%) | 0 (0.0%) |
| 20 to 34 years | 6 (37.5%) | 10 (62.5%) |
| 35 to 50 years | 0 (0.0%) | 0 (0.0%) |
| Total | 11 (52.4%) | 10 (47.6%) |
Fertility by Education in Camden
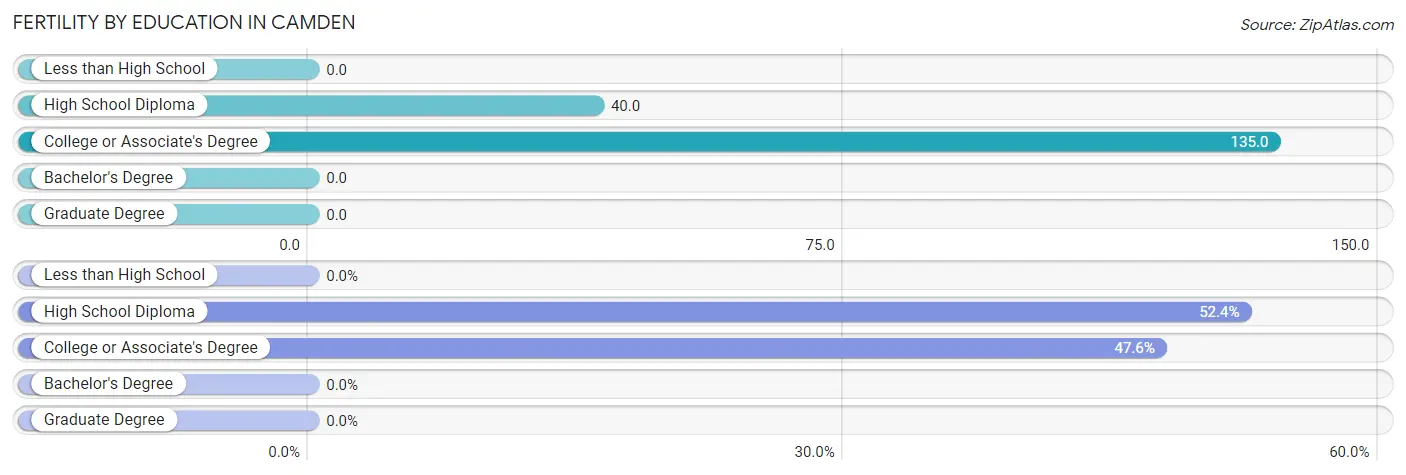
| Educational Attainment | Women with Births | Births / 1,000 Women |
| Less than High School | 0 (0.0%) | 0.0 |
| High School Diploma | 11 (52.4%) | 40.0 |
| College or Associate's Degree | 10 (47.6%) | 135.0 |
| Bachelor's Degree | 0 (0.0%) | 0.0 |
| Graduate Degree | 0 (0.0%) | 0.0 |
| Total | 21 (100.0%) | 51.0 |
Fertility by Education by Marriage Status in Camden
47.6% of women with births in Camden are unmarried. Women with the educational attainment of college or associate's degree are most likely to be married with 60.0% of them married at childbirth, while women with the educational attainment of high school diploma are least likely to be married with 54.5% of them unmarried at childbirth.
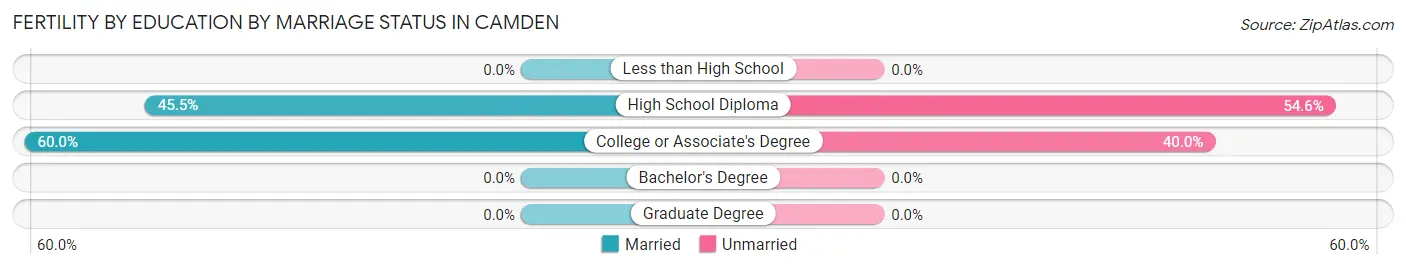
| Educational Attainment | Married | Unmarried |
| Less than High School | 0 (0.0%) | 0 (0.0%) |
| High School Diploma | 5 (45.5%) | 6 (54.5%) |
| College or Associate's Degree | 6 (60.0%) | 4 (40.0%) |
| Bachelor's Degree | 0 (0.0%) | 0 (0.0%) |
| Graduate Degree | 0 (0.0%) | 0 (0.0%) |
| Total | 11 (52.4%) | 10 (47.6%) |
Employment Characteristics in Camden
Employment by Class of Employer in Camden
Among the 694 employed individuals in Camden, private company employees (475 | 68.4%), state government employees (69 | 9.9%), and not-for-profit organizations (67 | 9.7%) make up the most common classes of employment.
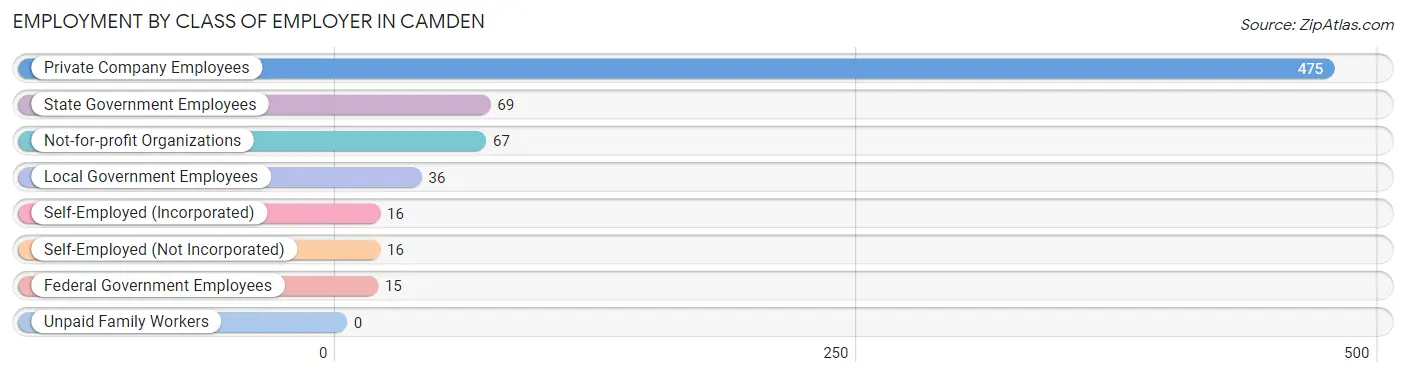
| Employer Class | # Employees | % Employees |
| Private Company Employees | 475 | 68.4% |
| Self-Employed (Incorporated) | 16 | 2.3% |
| Self-Employed (Not Incorporated) | 16 | 2.3% |
| Not-for-profit Organizations | 67 | 9.7% |
| Local Government Employees | 36 | 5.2% |
| State Government Employees | 69 | 9.9% |
| Federal Government Employees | 15 | 2.2% |
| Unpaid Family Workers | 0 | 0.0% |
| Total | 694 | 100.0% |
Employment Status by Age in Camden
According to the labor force statistics for Camden, out of the total population over 16 years of age (1,709), 43.7% or 747 individuals are in the labor force, with 4.7% or 35 of them unemployed. The age group with the highest labor force participation rate is 35 to 44 years, with 78.0% or 184 individuals in the labor force. Within the labor force, the 16 to 19 years age range has the highest percentage of unemployed individuals, with 48.7% or 19 of them being unemployed.
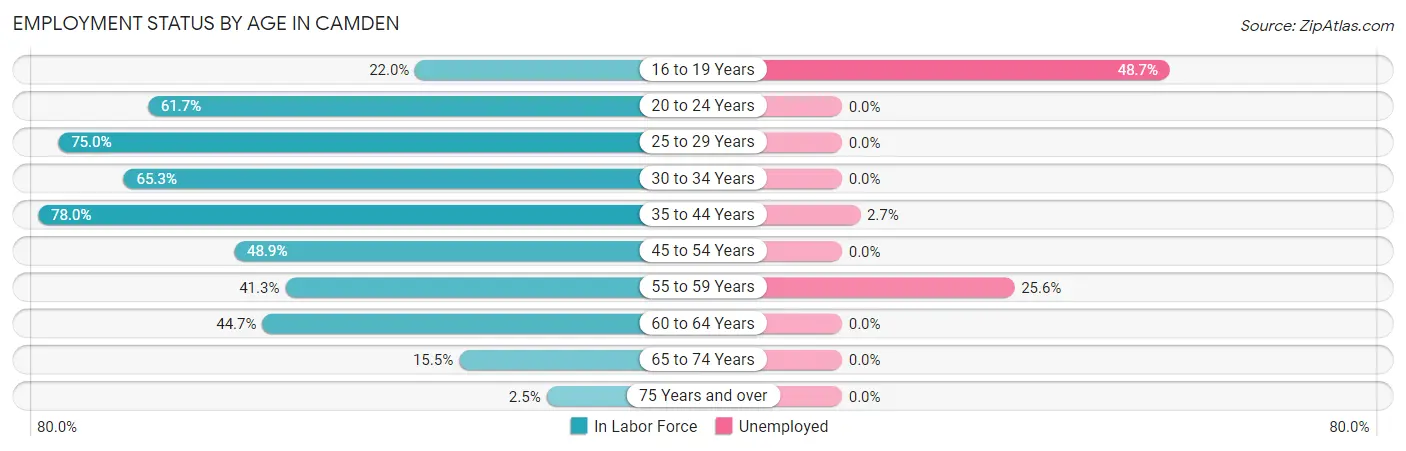
| Age Bracket | In Labor Force | Unemployed |
| 16 to 19 Years | 39 (22.0%) | 19 (48.7%) |
| 20 to 24 Years | 124 (61.7%) | 0 (0.0%) |
| 25 to 29 Years | 42 (75.0%) | 0 (0.0%) |
| 30 to 34 Years | 32 (65.3%) | 0 (0.0%) |
| 35 to 44 Years | 184 (78.0%) | 5 (2.7%) |
| 45 to 54 Years | 176 (48.9%) | 0 (0.0%) |
| 55 to 59 Years | 43 (41.3%) | 11 (25.6%) |
| 60 to 64 Years | 63 (44.7%) | 0 (0.0%) |
| 65 to 74 Years | 41 (15.5%) | 0 (0.0%) |
| 75 Years and over | 3 (2.5%) | 0 (0.0%) |
| Total | 747 (43.7%) | 35 (4.7%) |
Employment Status by Educational Attainment in Camden
According to labor force statistics for Camden, 57.1% of individuals (540) out of the total population between 25 and 64 years of age (946) are in the labor force, with 3.0% or 16 of them being unemployed. The group with the highest labor force participation rate are those with the educational attainment of college / associate degree, with 77.4% or 161 individuals in the labor force. Within the labor force, individuals with college / associate degree education have the highest percentage of unemployment, with 9.9% or 16 of them being unemployed.
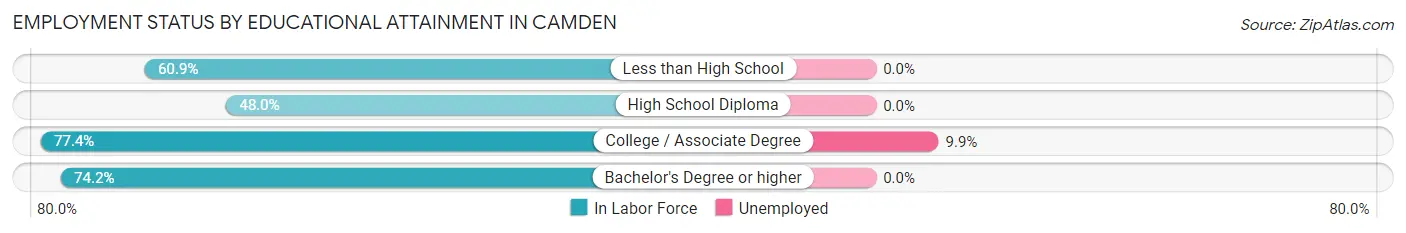
| Educational Attainment | In Labor Force | Unemployed |
| Less than High School | 39 (60.9%) | 0 (0.0%) |
| High School Diploma | 294 (48.0%) | 0 (0.0%) |
| College / Associate Degree | 161 (77.4%) | 21 (9.9%) |
| Bachelor's Degree or higher | 46 (74.2%) | 0 (0.0%) |
| Total | 540 (57.1%) | 28 (3.0%) |
Employment Occupations by Sex in Camden
Management, Business, Science and Arts Occupations
The most common Management, Business, Science and Arts occupations in Camden are Management (85 | 11.9%), Community & Social Service (29 | 4.1%), Health Diagnosing & Treating (27 | 3.8%), Health Technologists (27 | 3.8%), and Education, Arts & Media (24 | 3.4%).
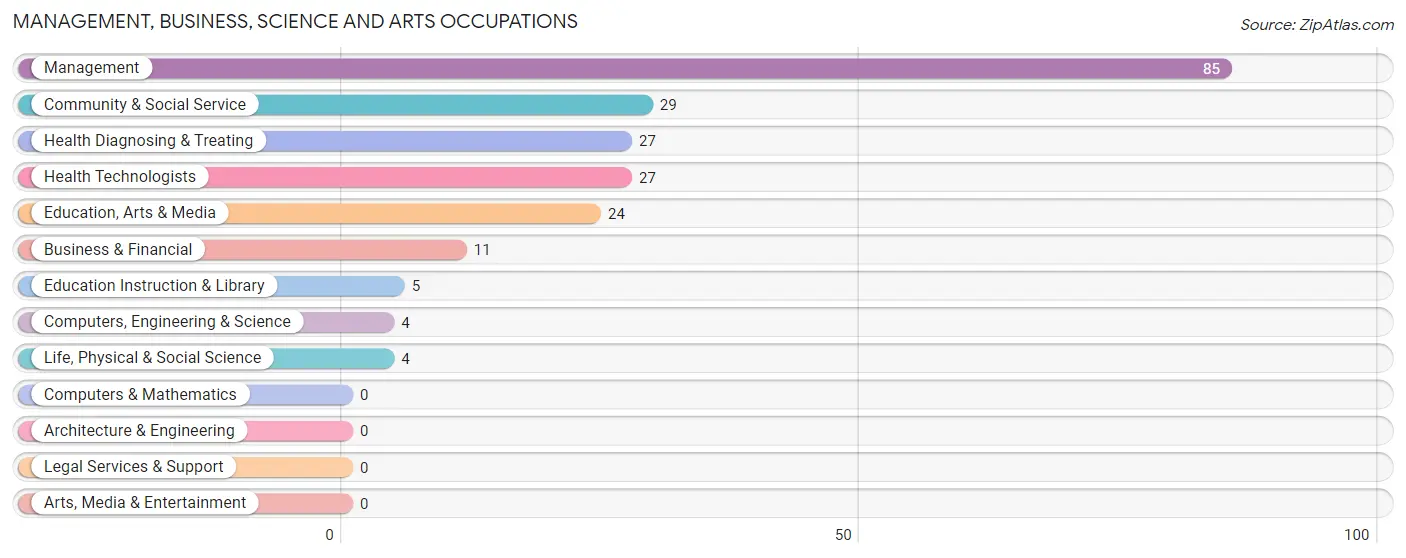
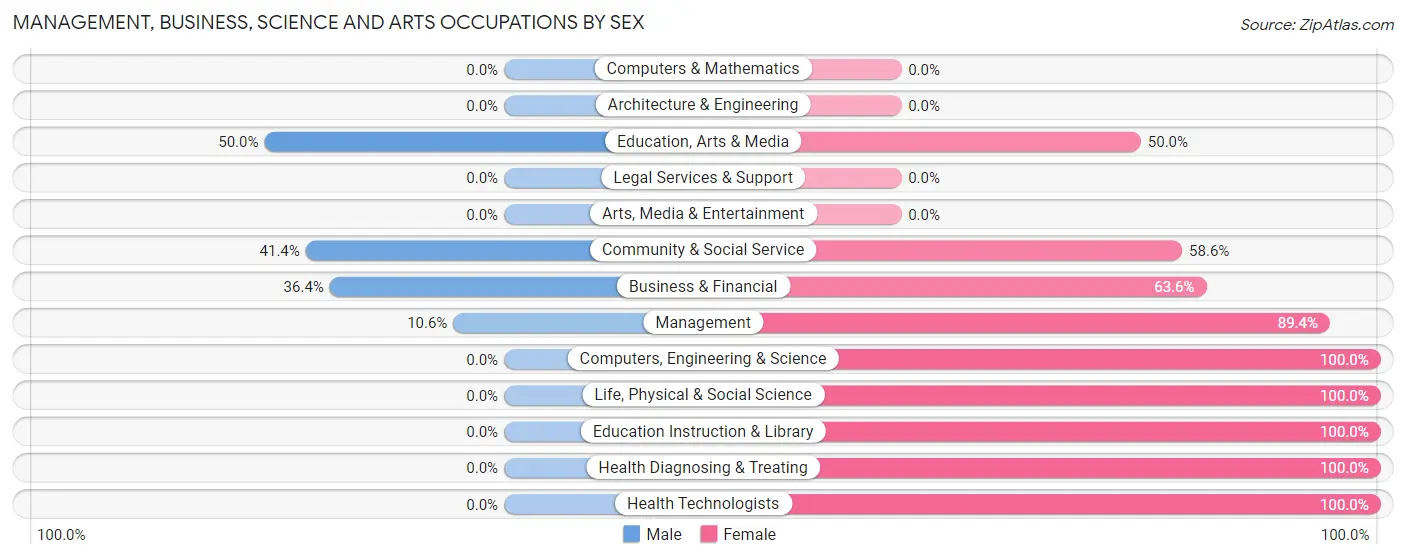
Management, Business, Science and Arts Occupations by Sex
Within the Management, Business, Science and Arts occupations in Camden, the most male-oriented occupations are Education, Arts & Media (50.0%), Community & Social Service (41.4%), and Business & Financial (36.4%), while the most female-oriented occupations are Computers, Engineering & Science (100.0%), Life, Physical & Social Science (100.0%), and Education Instruction & Library (100.0%).
| Occupation | Male | Female |
| Management | 9 (10.6%) | 76 (89.4%) |
| Business & Financial | 4 (36.4%) | 7 (63.6%) |
| Computers, Engineering & Science | 0 (0.0%) | 4 (100.0%) |
| Computers & Mathematics | 0 (0.0%) | 0 (0.0%) |
| Architecture & Engineering | 0 (0.0%) | 0 (0.0%) |
| Life, Physical & Social Science | 0 (0.0%) | 4 (100.0%) |
| Community & Social Service | 12 (41.4%) | 17 (58.6%) |
| Education, Arts & Media | 12 (50.0%) | 12 (50.0%) |
| Legal Services & Support | 0 (0.0%) | 0 (0.0%) |
| Education Instruction & Library | 0 (0.0%) | 5 (100.0%) |
| Arts, Media & Entertainment | 0 (0.0%) | 0 (0.0%) |
| Health Diagnosing & Treating | 0 (0.0%) | 27 (100.0%) |
| Health Technologists | 0 (0.0%) | 27 (100.0%) |
| Total (Category) | 25 (16.0%) | 131 (84.0%) |
| Total (Overall) | 370 (52.0%) | 342 (48.0%) |
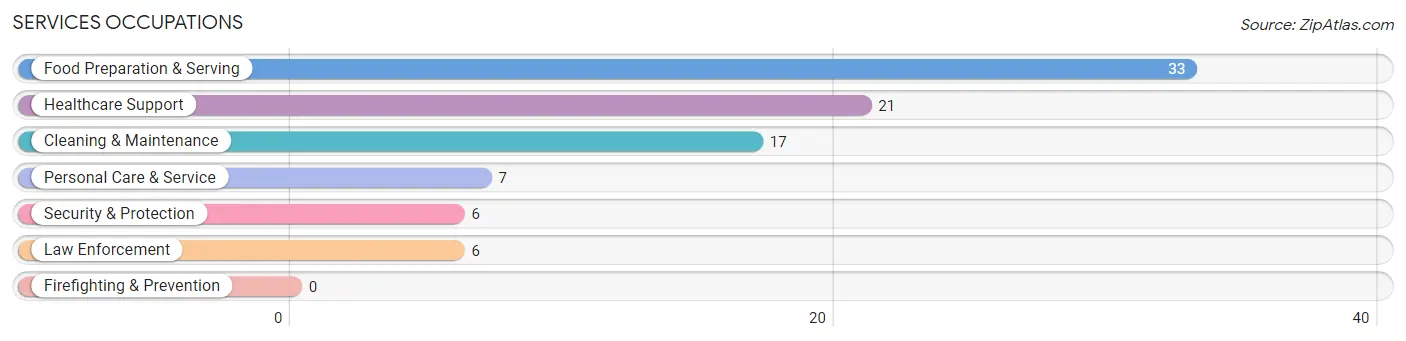
Services Occupations
The most common Services occupations in Camden are Food Preparation & Serving (33 | 4.6%), Healthcare Support (21 | 2.9%), Cleaning & Maintenance (17 | 2.4%), Personal Care & Service (7 | 1.0%), and Security & Protection (6 | 0.8%).
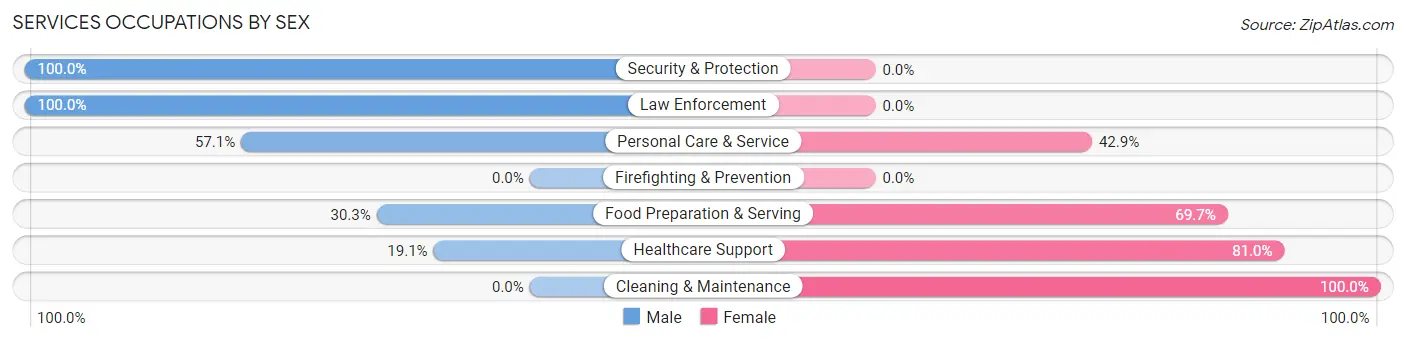
Services Occupations by Sex
Within the Services occupations in Camden, the most male-oriented occupations are Security & Protection (100.0%), Law Enforcement (100.0%), and Personal Care & Service (57.1%), while the most female-oriented occupations are Cleaning & Maintenance (100.0%), Healthcare Support (80.9%), and Food Preparation & Serving (69.7%).
| Occupation | Male | Female |
| Healthcare Support | 4 (19.1%) | 17 (80.9%) |
| Security & Protection | 6 (100.0%) | 0 (0.0%) |
| Firefighting & Prevention | 0 (0.0%) | 0 (0.0%) |
| Law Enforcement | 6 (100.0%) | 0 (0.0%) |
| Food Preparation & Serving | 10 (30.3%) | 23 (69.7%) |
| Cleaning & Maintenance | 0 (0.0%) | 17 (100.0%) |
| Personal Care & Service | 4 (57.1%) | 3 (42.9%) |
| Total (Category) | 24 (28.6%) | 60 (71.4%) |
| Total (Overall) | 370 (52.0%) | 342 (48.0%) |
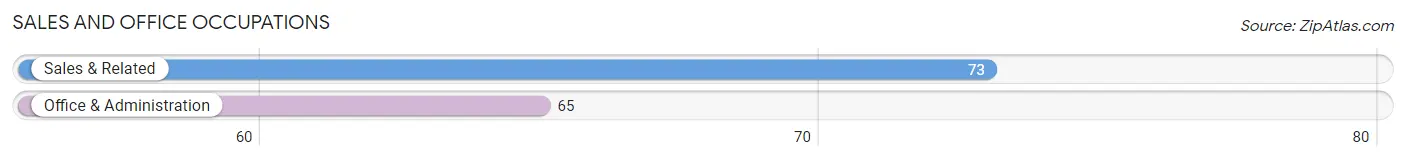
Sales and Office Occupations
The most common Sales and Office occupations in Camden are Sales & Related (73 | 10.2%), and Office & Administration (65 | 9.1%).
Sales and Office Occupations by Sex
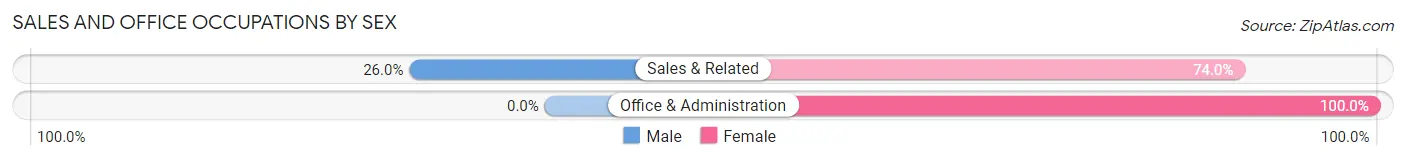
| Occupation | Male | Female |
| Sales & Related | 19 (26.0%) | 54 (74.0%) |
| Office & Administration | 0 (0.0%) | 65 (100.0%) |
| Total (Category) | 19 (13.8%) | 119 (86.2%) |
| Total (Overall) | 370 (52.0%) | 342 (48.0%) |
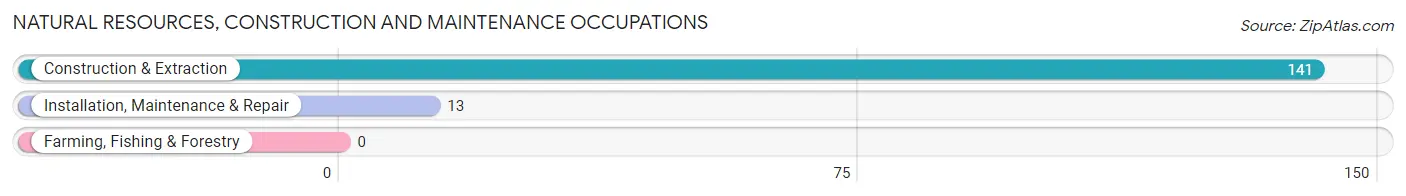
Natural Resources, Construction and Maintenance Occupations
The most common Natural Resources, Construction and Maintenance occupations in Camden are Construction & Extraction (141 | 19.8%), and Installation, Maintenance & Repair (13 | 1.8%).
Natural Resources, Construction and Maintenance Occupations by Sex
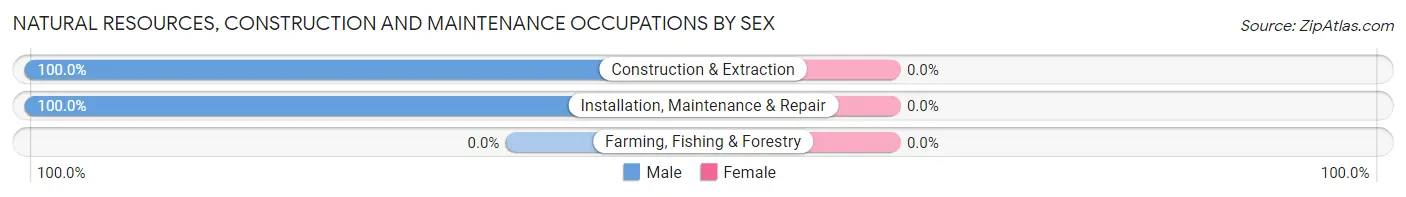
| Occupation | Male | Female |
| Farming, Fishing & Forestry | 0 (0.0%) | 0 (0.0%) |
| Construction & Extraction | 141 (100.0%) | 0 (0.0%) |
| Installation, Maintenance & Repair | 13 (100.0%) | 0 (0.0%) |
| Total (Category) | 154 (100.0%) | 0 (0.0%) |
| Total (Overall) | 370 (52.0%) | 342 (48.0%) |
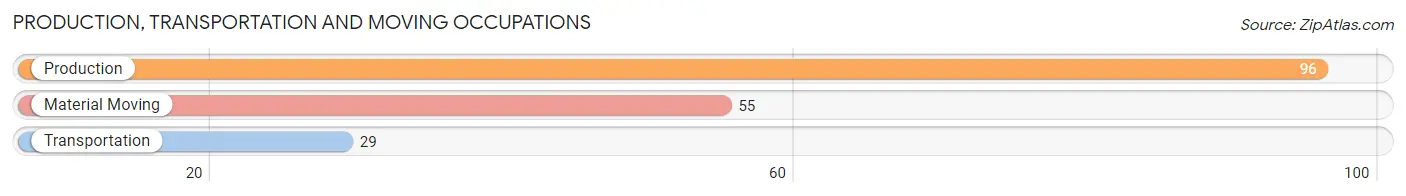
Production, Transportation and Moving Occupations
The most common Production, Transportation and Moving occupations in Camden are Production (96 | 13.5%), Material Moving (55 | 7.7%), and Transportation (29 | 4.1%).
Production, Transportation and Moving Occupations by Sex
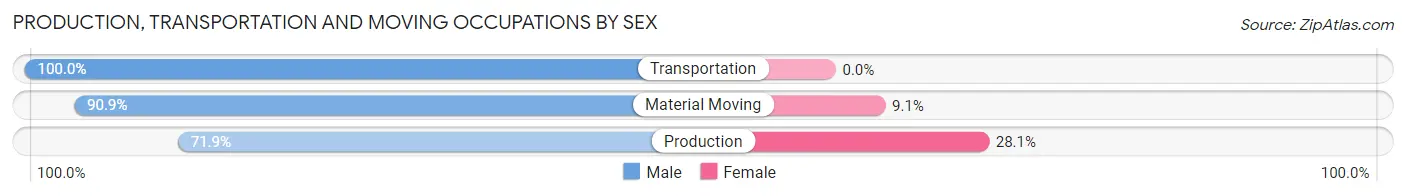
| Occupation | Male | Female |
| Production | 69 (71.9%) | 27 (28.1%) |
| Transportation | 29 (100.0%) | 0 (0.0%) |
| Material Moving | 50 (90.9%) | 5 (9.1%) |
| Total (Category) | 148 (82.2%) | 32 (17.8%) |
| Total (Overall) | 370 (52.0%) | 342 (48.0%) |
Employment Industries by Sex in Camden
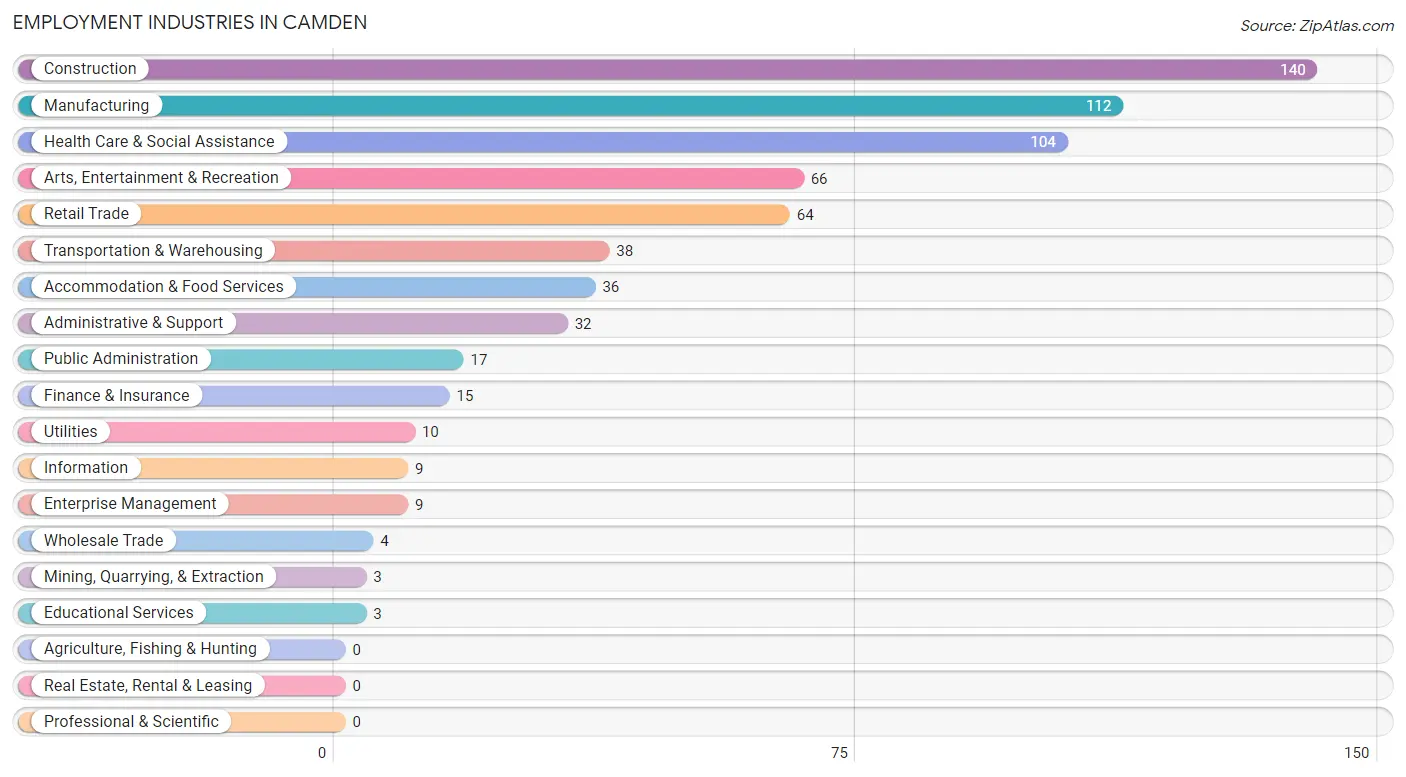
Employment Industries in Camden
The major employment industries in Camden include Construction (140 | 19.7%), Manufacturing (112 | 15.7%), Health Care & Social Assistance (104 | 14.6%), Arts, Entertainment & Recreation (66 | 9.3%), and Retail Trade (64 | 9.0%).
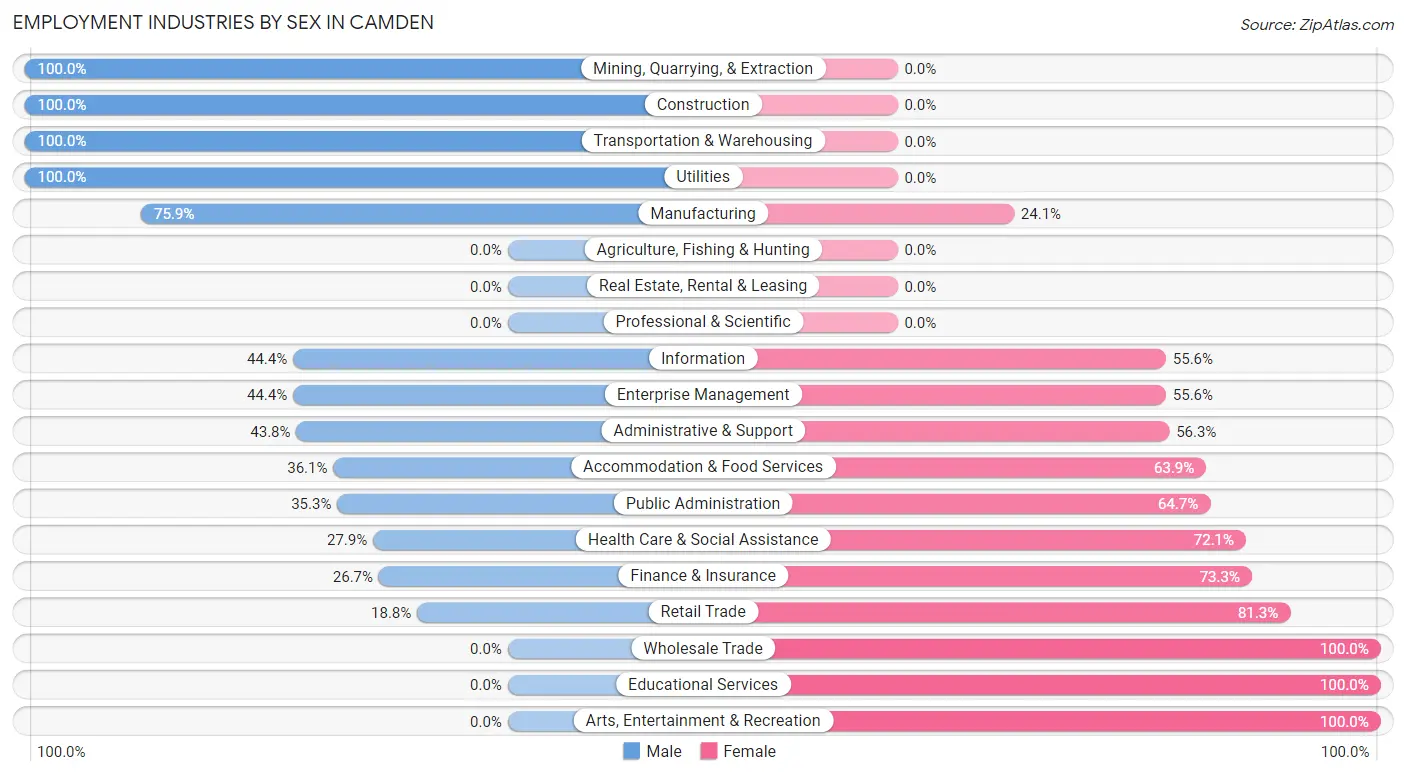
Employment Industries by Sex in Camden
The Camden industries that see more men than women are Mining, Quarrying, & Extraction (100.0%), Construction (100.0%), and Transportation & Warehousing (100.0%), whereas the industries that tend to have a higher number of women are Wholesale Trade (100.0%), Educational Services (100.0%), and Arts, Entertainment & Recreation (100.0%).
| Industry | Male | Female |
| Agriculture, Fishing & Hunting | 0 (0.0%) | 0 (0.0%) |
| Mining, Quarrying, & Extraction | 3 (100.0%) | 0 (0.0%) |
| Construction | 140 (100.0%) | 0 (0.0%) |
| Manufacturing | 85 (75.9%) | 27 (24.1%) |
| Wholesale Trade | 0 (0.0%) | 4 (100.0%) |
| Retail Trade | 12 (18.8%) | 52 (81.2%) |
| Transportation & Warehousing | 38 (100.0%) | 0 (0.0%) |
| Utilities | 10 (100.0%) | 0 (0.0%) |
| Information | 4 (44.4%) | 5 (55.6%) |
| Finance & Insurance | 4 (26.7%) | 11 (73.3%) |
| Real Estate, Rental & Leasing | 0 (0.0%) | 0 (0.0%) |
| Professional & Scientific | 0 (0.0%) | 0 (0.0%) |
| Enterprise Management | 4 (44.4%) | 5 (55.6%) |
| Administrative & Support | 14 (43.8%) | 18 (56.2%) |
| Educational Services | 0 (0.0%) | 3 (100.0%) |
| Health Care & Social Assistance | 29 (27.9%) | 75 (72.1%) |
| Arts, Entertainment & Recreation | 0 (0.0%) | 66 (100.0%) |
| Accommodation & Food Services | 13 (36.1%) | 23 (63.9%) |
| Public Administration | 6 (35.3%) | 11 (64.7%) |
| Total | 370 (52.0%) | 342 (48.0%) |
Education in Camden
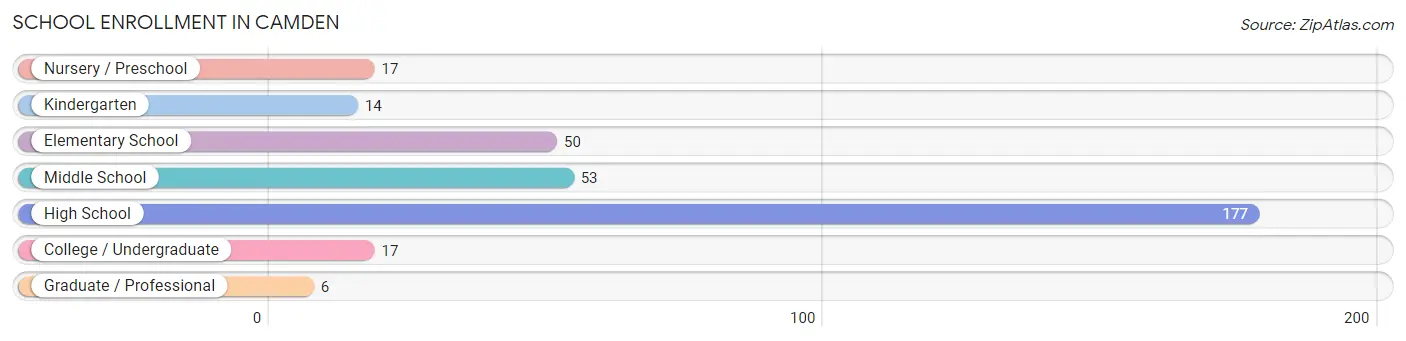
School Enrollment in Camden
The most common levels of schooling among the 334 students in Camden are high school (177 | 53.0%), middle school (53 | 15.9%), and elementary school (50 | 15.0%).
| School Level | # Students | % Students |
| Nursery / Preschool | 17 | 5.1% |
| Kindergarten | 14 | 4.2% |
| Elementary School | 50 | 15.0% |
| Middle School | 53 | 15.9% |
| High School | 177 | 53.0% |
| College / Undergraduate | 17 | 5.1% |
| Graduate / Professional | 6 | 1.8% |
| Total | 334 | 100.0% |
School Enrollment by Age by Funding Source in Camden
Out of a total of 334 students who are enrolled in schools in Camden, 33 (9.9%) attend a private institution, while the remaining 301 (90.1%) are enrolled in public schools. The age group of 35 years and over has the highest likelihood of being enrolled in private schools, with 6 (100.0% in the age bracket) enrolled. Conversely, the age group of 3 to 4 year olds has the lowest likelihood of being enrolled in a private school, with 14 (100.0% in the age bracket) attending a public institution.
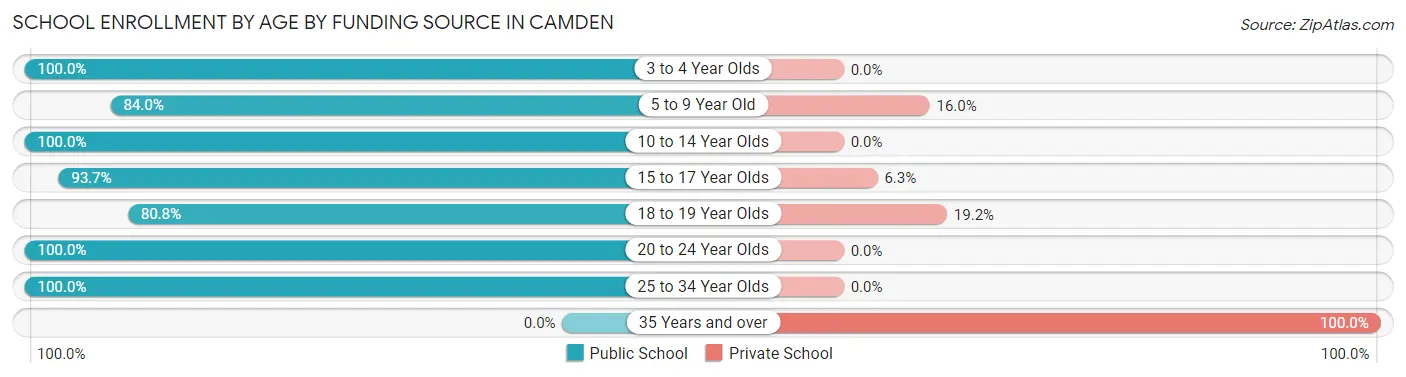
| Age Bracket | Public School | Private School |
| 3 to 4 Year Olds | 14 (100.0%) | 0 (0.0%) |
| 5 to 9 Year Old | 42 (84.0%) | 8 (16.0%) |
| 10 to 14 Year Olds | 59 (100.0%) | 0 (0.0%) |
| 15 to 17 Year Olds | 134 (93.7%) | 9 (6.3%) |
| 18 to 19 Year Olds | 42 (80.8%) | 10 (19.2%) |
| 20 to 24 Year Olds | 6 (100.0%) | 0 (0.0%) |
| 25 to 34 Year Olds | 4 (100.0%) | 0 (0.0%) |
| 35 Years and over | 0 (0.0%) | 6 (100.0%) |
| Total | 301 (90.1%) | 33 (9.9%) |
Educational Attainment by Field of Study in Camden
Education (55 | 53.9%), business (11 | 10.8%), arts & humanities (10 | 9.8%), psychology (6 | 5.9%), and social sciences (6 | 5.9%) are the most common fields of study among 102 individuals in Camden who have obtained a bachelor's degree or higher.
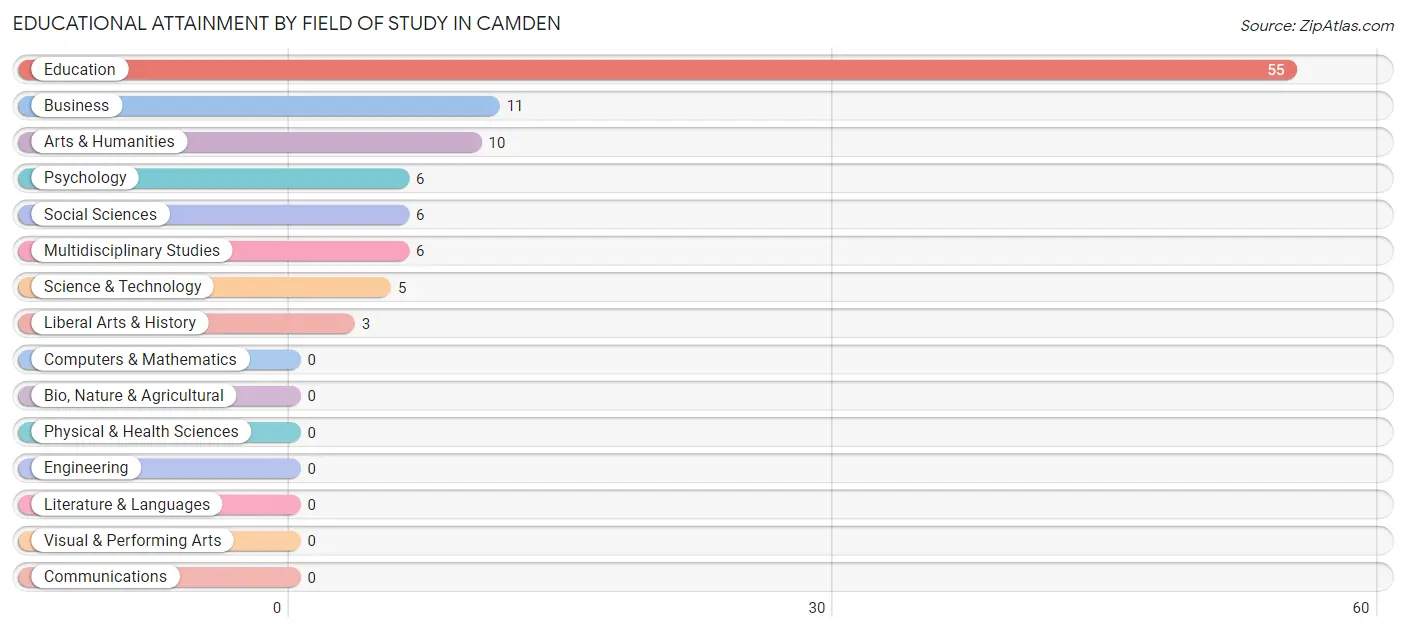
| Field of Study | # Graduates | % Graduates |
| Computers & Mathematics | 0 | 0.0% |
| Bio, Nature & Agricultural | 0 | 0.0% |
| Physical & Health Sciences | 0 | 0.0% |
| Psychology | 6 | 5.9% |
| Social Sciences | 6 | 5.9% |
| Engineering | 0 | 0.0% |
| Multidisciplinary Studies | 6 | 5.9% |
| Science & Technology | 5 | 4.9% |
| Business | 11 | 10.8% |
| Education | 55 | 53.9% |
| Literature & Languages | 0 | 0.0% |
| Liberal Arts & History | 3 | 2.9% |
| Visual & Performing Arts | 0 | 0.0% |
| Communications | 0 | 0.0% |
| Arts & Humanities | 10 | 9.8% |
| Total | 102 | 100.0% |
Transportation & Commute in Camden
Vehicle Availability by Sex in Camden
The most prevalent vehicle ownership categories in Camden are males with 3 vehicles (156, accounting for 42.5%) and females with 3 vehicles (69, making up 47.7%).
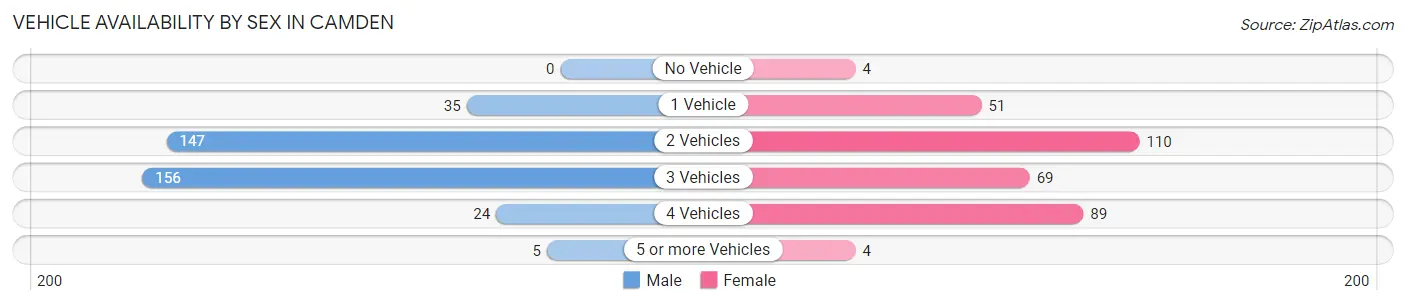
| Vehicles Available | Male | Female |
| No Vehicle | 0 (0.0%) | 4 (1.2%) |
| 1 Vehicle | 35 (9.5%) | 51 (15.6%) |
| 2 Vehicles | 147 (40.1%) | 110 (33.6%) |
| 3 Vehicles | 156 (42.5%) | 69 (21.1%) |
| 4 Vehicles | 24 (6.5%) | 89 (27.2%) |
| 5 or more Vehicles | 5 (1.4%) | 4 (1.2%) |
| Total | 367 (100.0%) | 327 (100.0%) |
Commute Time in Camden
The most frequently occuring commute durations in Camden are 30 to 34 minutes (151 commuters, 24.0%), 45 to 59 minutes (103 commuters, 16.4%), and 20 to 24 minutes (76 commuters, 12.1%).
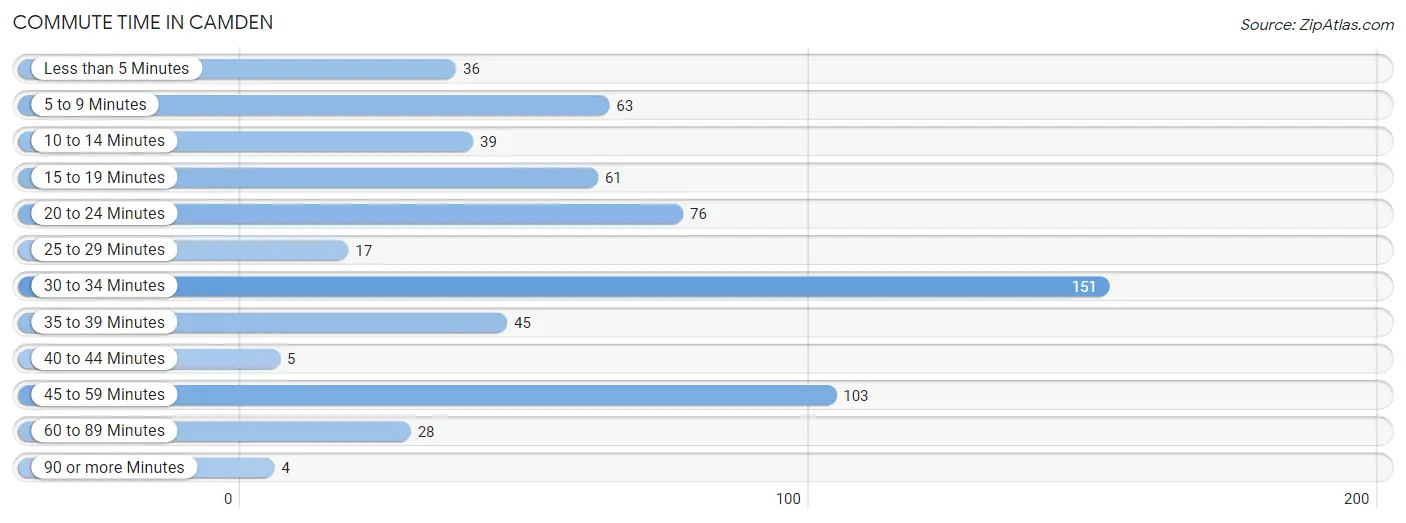
| Commute Time | # Commuters | % Commuters |
| Less than 5 Minutes | 36 | 5.7% |
| 5 to 9 Minutes | 63 | 10.0% |
| 10 to 14 Minutes | 39 | 6.2% |
| 15 to 19 Minutes | 61 | 9.7% |
| 20 to 24 Minutes | 76 | 12.1% |
| 25 to 29 Minutes | 17 | 2.7% |
| 30 to 34 Minutes | 151 | 24.0% |
| 35 to 39 Minutes | 45 | 7.2% |
| 40 to 44 Minutes | 5 | 0.8% |
| 45 to 59 Minutes | 103 | 16.4% |
| 60 to 89 Minutes | 28 | 4.5% |
| 90 or more Minutes | 4 | 0.6% |
Commute Time by Sex in Camden
The most common commute times in Camden are 30 to 34 minutes (128 commuters, 34.9%) for males and 20 to 24 minutes (55 commuters, 21.1%) for females.
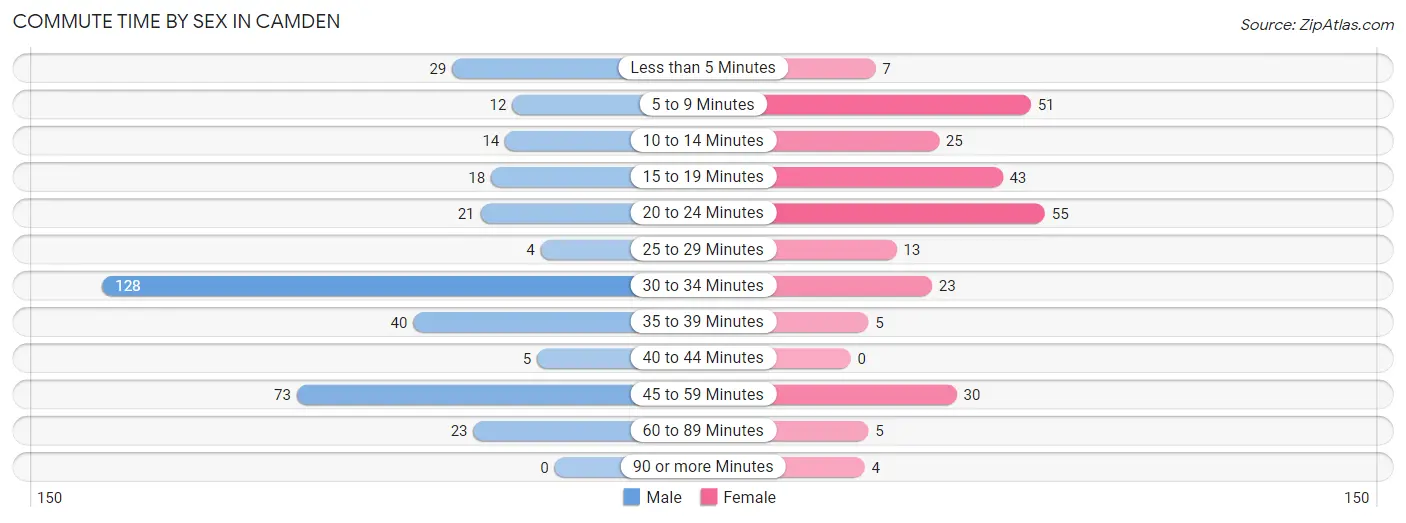
| Commute Time | Male | Female |
| Less than 5 Minutes | 29 (7.9%) | 7 (2.7%) |
| 5 to 9 Minutes | 12 (3.3%) | 51 (19.5%) |
| 10 to 14 Minutes | 14 (3.8%) | 25 (9.6%) |
| 15 to 19 Minutes | 18 (4.9%) | 43 (16.5%) |
| 20 to 24 Minutes | 21 (5.7%) | 55 (21.1%) |
| 25 to 29 Minutes | 4 (1.1%) | 13 (5.0%) |
| 30 to 34 Minutes | 128 (34.9%) | 23 (8.8%) |
| 35 to 39 Minutes | 40 (10.9%) | 5 (1.9%) |
| 40 to 44 Minutes | 5 (1.4%) | 0 (0.0%) |
| 45 to 59 Minutes | 73 (19.9%) | 30 (11.5%) |
| 60 to 89 Minutes | 23 (6.3%) | 5 (1.9%) |
| 90 or more Minutes | 0 (0.0%) | 4 (1.5%) |
Time of Departure to Work by Sex in Camden
The most frequent times of departure to work in Camden are 6:00 AM to 6:29 AM (166, 45.2%) for males and 4:00 PM to 11:59 PM (43, 16.5%) for females.
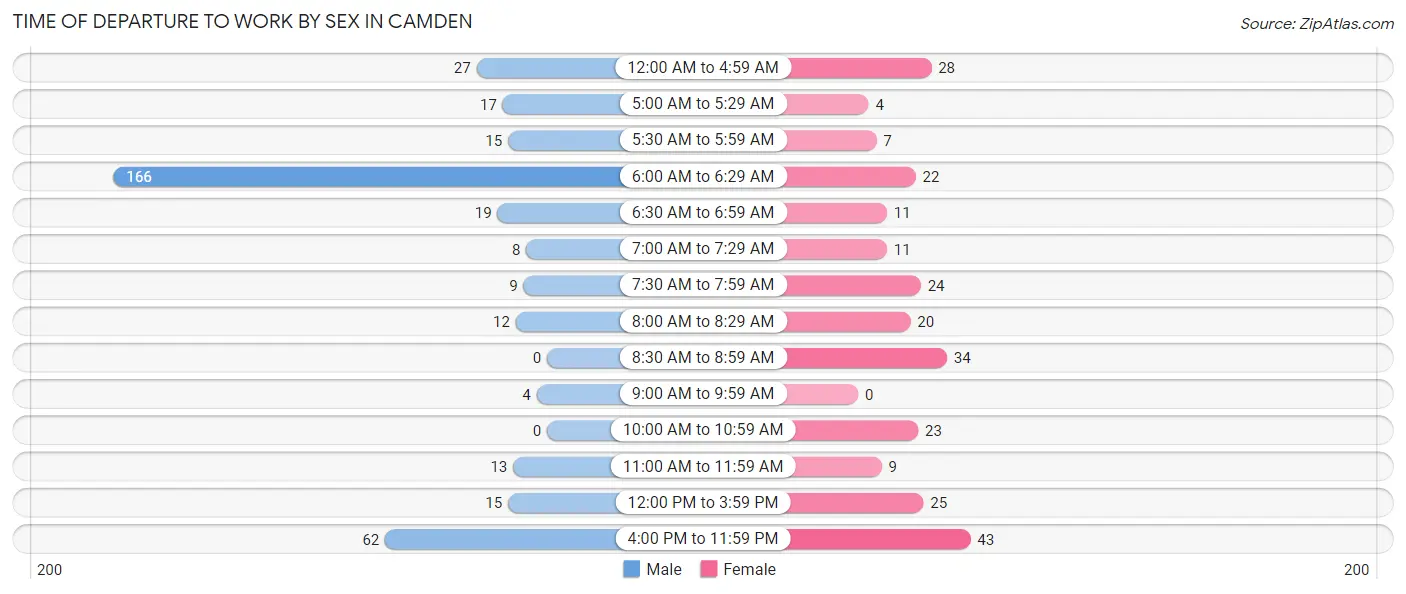
| Time of Departure | Male | Female |
| 12:00 AM to 4:59 AM | 27 (7.4%) | 28 (10.7%) |
| 5:00 AM to 5:29 AM | 17 (4.6%) | 4 (1.5%) |
| 5:30 AM to 5:59 AM | 15 (4.1%) | 7 (2.7%) |
| 6:00 AM to 6:29 AM | 166 (45.2%) | 22 (8.4%) |
| 6:30 AM to 6:59 AM | 19 (5.2%) | 11 (4.2%) |
| 7:00 AM to 7:29 AM | 8 (2.2%) | 11 (4.2%) |
| 7:30 AM to 7:59 AM | 9 (2.5%) | 24 (9.2%) |
| 8:00 AM to 8:29 AM | 12 (3.3%) | 20 (7.7%) |
| 8:30 AM to 8:59 AM | 0 (0.0%) | 34 (13.0%) |
| 9:00 AM to 9:59 AM | 4 (1.1%) | 0 (0.0%) |
| 10:00 AM to 10:59 AM | 0 (0.0%) | 23 (8.8%) |
| 11:00 AM to 11:59 AM | 13 (3.5%) | 9 (3.5%) |
| 12:00 PM to 3:59 PM | 15 (4.1%) | 25 (9.6%) |
| 4:00 PM to 11:59 PM | 62 (16.9%) | 43 (16.5%) |
| Total | 367 (100.0%) | 261 (100.0%) |
Housing Occupancy in Camden
Occupancy by Ownership in Camden
Of the total 794 dwellings in Camden, owner-occupied units account for 507 (63.8%), while renter-occupied units make up 287 (36.1%).
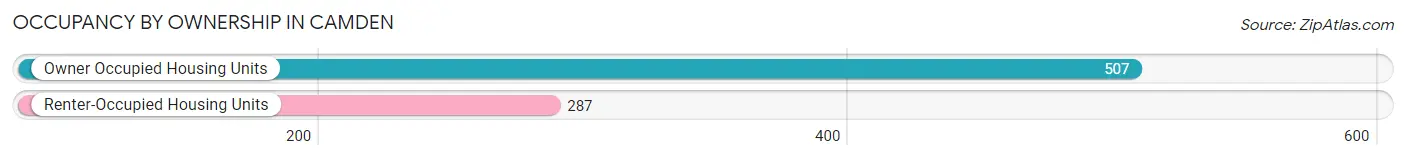
| Occupancy | # Housing Units | % Housing Units |
| Owner Occupied Housing Units | 507 | 63.8% |
| Renter-Occupied Housing Units | 287 | 36.1% |
| Total Occupied Housing Units | 794 | 100.0% |
Occupancy by Household Size in Camden
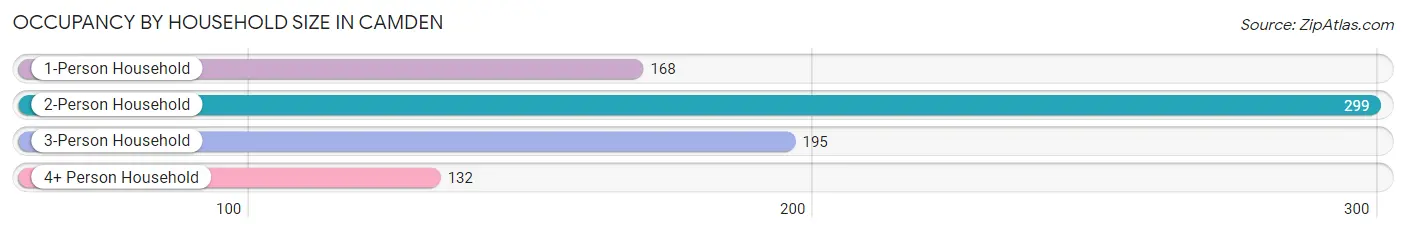
| Household Size | # Housing Units | % Housing Units |
| 1-Person Household | 168 | 21.2% |
| 2-Person Household | 299 | 37.7% |
| 3-Person Household | 195 | 24.6% |
| 4+ Person Household | 132 | 16.6% |
| Total Housing Units | 794 | 100.0% |
Occupancy by Ownership by Household Size in Camden
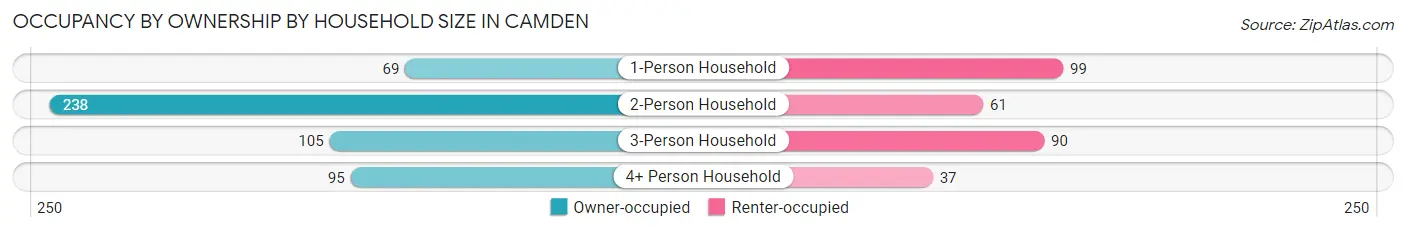
| Household Size | Owner-occupied | Renter-occupied |
| 1-Person Household | 69 (41.1%) | 99 (58.9%) |
| 2-Person Household | 238 (79.6%) | 61 (20.4%) |
| 3-Person Household | 105 (53.8%) | 90 (46.2%) |
| 4+ Person Household | 95 (72.0%) | 37 (28.0%) |
| Total Housing Units | 507 (63.8%) | 287 (36.1%) |
Occupancy by Educational Attainment in Camden
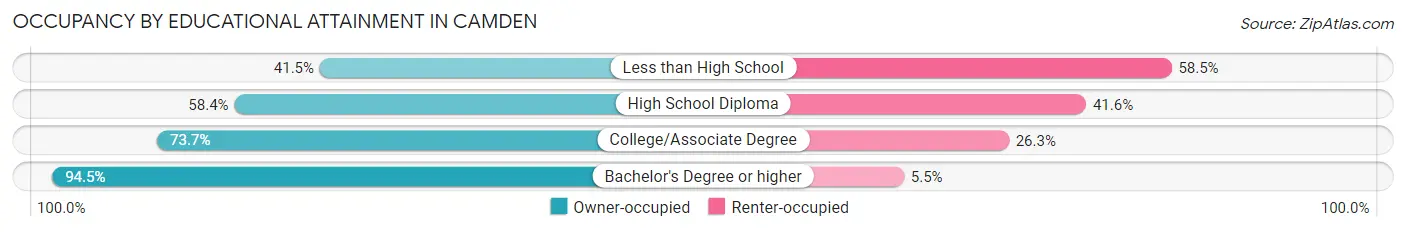
| Household Size | Owner-occupied | Renter-occupied |
| Less than High School | 17 (41.5%) | 24 (58.5%) |
| High School Diploma | 306 (58.4%) | 218 (41.6%) |
| College/Associate Degree | 115 (73.7%) | 41 (26.3%) |
| Bachelor's Degree or higher | 69 (94.5%) | 4 (5.5%) |
Occupancy by Age of Householder in Camden
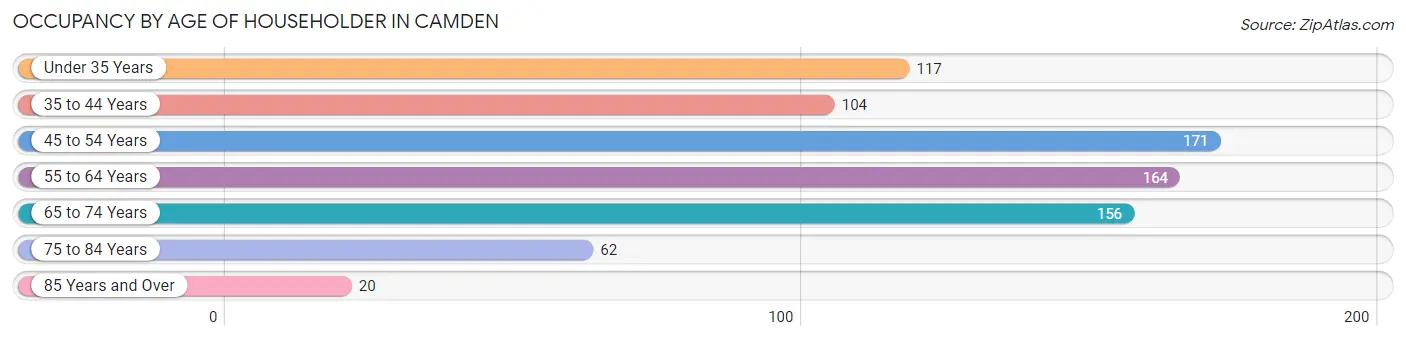
| Age Bracket | # Households | % Households |
| Under 35 Years | 117 | 14.7% |
| 35 to 44 Years | 104 | 13.1% |
| 45 to 54 Years | 171 | 21.5% |
| 55 to 64 Years | 164 | 20.6% |
| 65 to 74 Years | 156 | 19.7% |
| 75 to 84 Years | 62 | 7.8% |
| 85 Years and Over | 20 | 2.5% |
| Total | 794 | 100.0% |
Housing Finances in Camden
Median Income by Occupancy in Camden
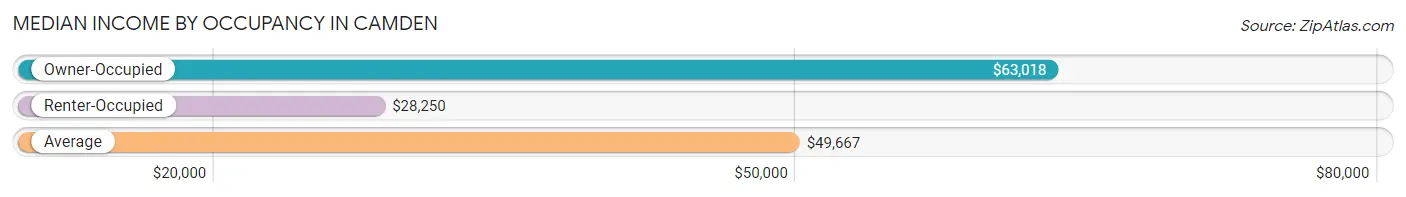
| Occupancy Type | # Households | Median Income |
| Owner-Occupied | 507 (63.8%) | $63,018 |
| Renter-Occupied | 287 (36.1%) | $28,250 |
| Average | 794 (100.0%) | $49,667 |
Occupancy by Householder Income Bracket in Camden
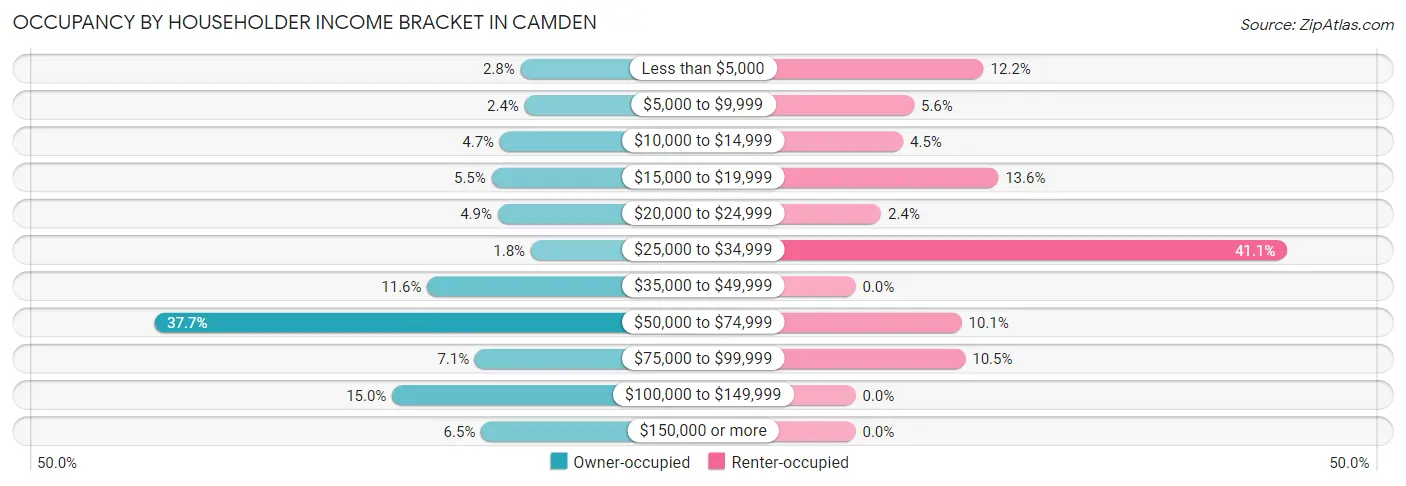
| Income Bracket | Owner-occupied | Renter-occupied |
| Less than $5,000 | 14 (2.8%) | 35 (12.2%) |
| $5,000 to $9,999 | 12 (2.4%) | 16 (5.6%) |
| $10,000 to $14,999 | 24 (4.7%) | 13 (4.5%) |
| $15,000 to $19,999 | 28 (5.5%) | 39 (13.6%) |
| $20,000 to $24,999 | 25 (4.9%) | 7 (2.4%) |
| $25,000 to $34,999 | 9 (1.8%) | 118 (41.1%) |
| $35,000 to $49,999 | 59 (11.6%) | 0 (0.0%) |
| $50,000 to $74,999 | 191 (37.7%) | 29 (10.1%) |
| $75,000 to $99,999 | 36 (7.1%) | 30 (10.4%) |
| $100,000 to $149,999 | 76 (15.0%) | 0 (0.0%) |
| $150,000 or more | 33 (6.5%) | 0 (0.0%) |
| Total | 507 (100.0%) | 287 (100.0%) |
Monthly Housing Cost Tiers in Camden
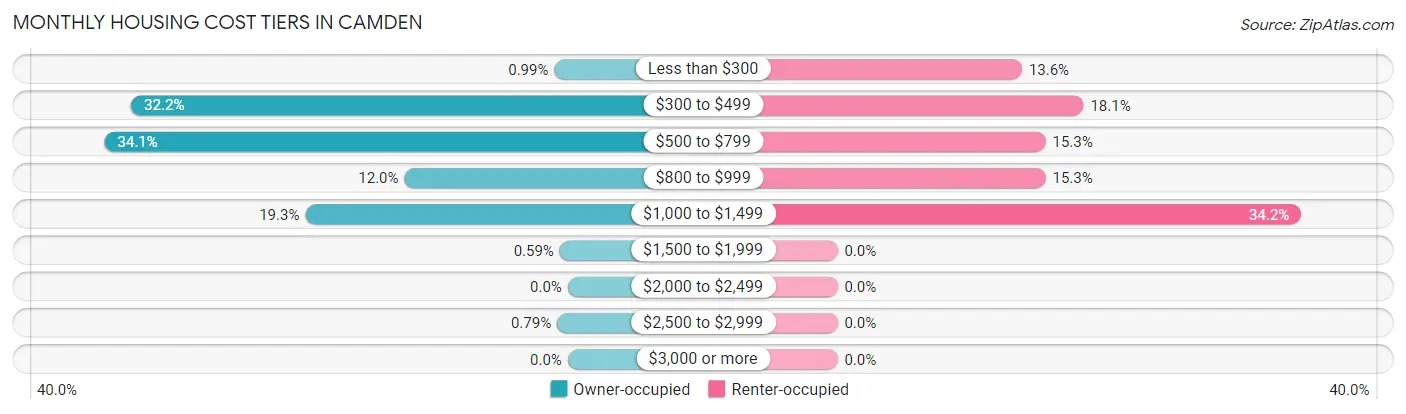
| Monthly Cost | Owner-occupied | Renter-occupied |
| Less than $300 | 5 (1.0%) | 39 (13.6%) |
| $300 to $499 | 163 (32.2%) | 52 (18.1%) |
| $500 to $799 | 173 (34.1%) | 44 (15.3%) |
| $800 to $999 | 61 (12.0%) | 44 (15.3%) |
| $1,000 to $1,499 | 98 (19.3%) | 98 (34.2%) |
| $1,500 to $1,999 | 3 (0.6%) | 0 (0.0%) |
| $2,000 to $2,499 | 0 (0.0%) | 0 (0.0%) |
| $2,500 to $2,999 | 4 (0.8%) | 0 (0.0%) |
| $3,000 or more | 0 (0.0%) | 0 (0.0%) |
| Total | 507 (100.0%) | 287 (100.0%) |
Physical Housing Characteristics in Camden
Housing Structures in Camden
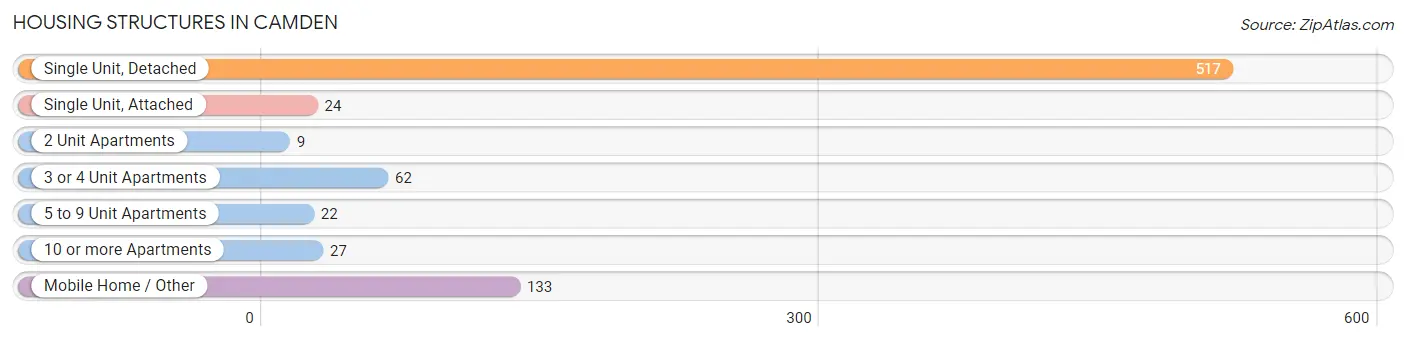
| Structure Type | # Housing Units | % Housing Units |
| Single Unit, Detached | 517 | 65.1% |
| Single Unit, Attached | 24 | 3.0% |
| 2 Unit Apartments | 9 | 1.1% |
| 3 or 4 Unit Apartments | 62 | 7.8% |
| 5 to 9 Unit Apartments | 22 | 2.8% |
| 10 or more Apartments | 27 | 3.4% |
| Mobile Home / Other | 133 | 16.8% |
| Total | 794 | 100.0% |
Housing Structures by Occupancy in Camden
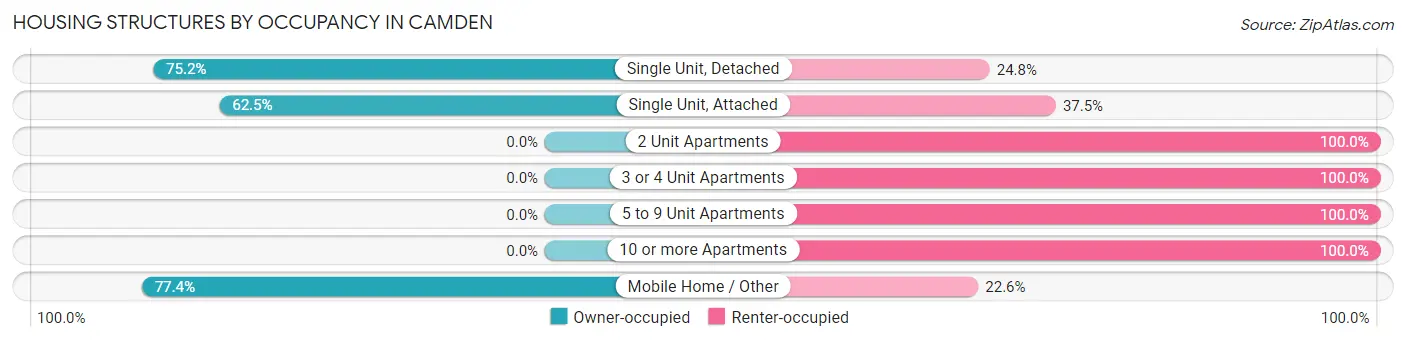
| Structure Type | Owner-occupied | Renter-occupied |
| Single Unit, Detached | 389 (75.2%) | 128 (24.8%) |
| Single Unit, Attached | 15 (62.5%) | 9 (37.5%) |
| 2 Unit Apartments | 0 (0.0%) | 9 (100.0%) |
| 3 or 4 Unit Apartments | 0 (0.0%) | 62 (100.0%) |
| 5 to 9 Unit Apartments | 0 (0.0%) | 22 (100.0%) |
| 10 or more Apartments | 0 (0.0%) | 27 (100.0%) |
| Mobile Home / Other | 103 (77.4%) | 30 (22.6%) |
| Total | 507 (63.8%) | 287 (36.1%) |
Housing Structures by Number of Rooms in Camden
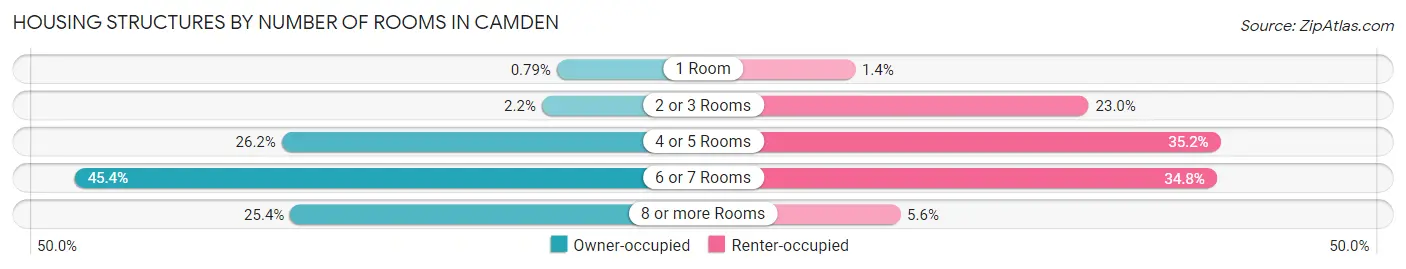
| Number of Rooms | Owner-occupied | Renter-occupied |
| 1 Room | 4 (0.8%) | 4 (1.4%) |
| 2 or 3 Rooms | 11 (2.2%) | 66 (23.0%) |
| 4 or 5 Rooms | 133 (26.2%) | 101 (35.2%) |
| 6 or 7 Rooms | 230 (45.4%) | 100 (34.8%) |
| 8 or more Rooms | 129 (25.4%) | 16 (5.6%) |
| Total | 507 (100.0%) | 287 (100.0%) |
Housing Structure by Heating Type in Camden
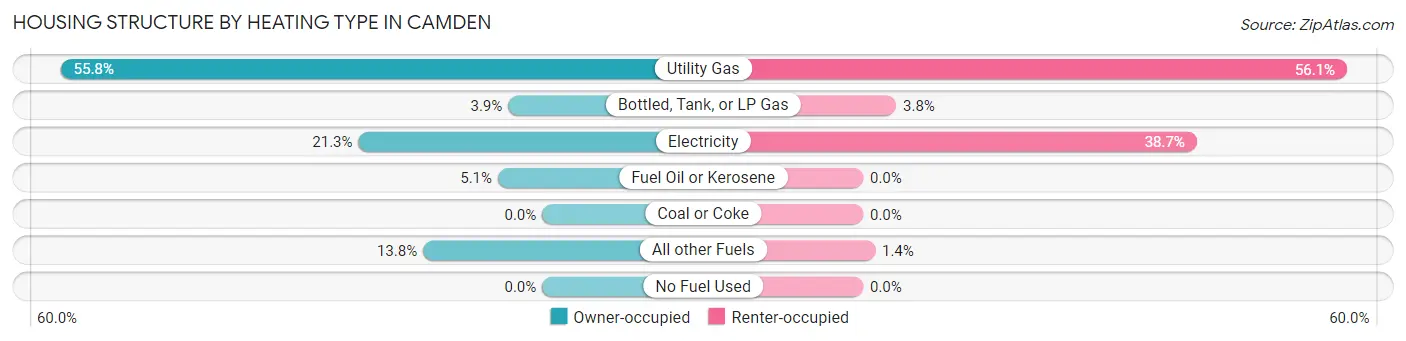
| Heating Type | Owner-occupied | Renter-occupied |
| Utility Gas | 283 (55.8%) | 161 (56.1%) |
| Bottled, Tank, or LP Gas | 20 (3.9%) | 11 (3.8%) |
| Electricity | 108 (21.3%) | 111 (38.7%) |
| Fuel Oil or Kerosene | 26 (5.1%) | 0 (0.0%) |
| Coal or Coke | 0 (0.0%) | 0 (0.0%) |
| All other Fuels | 70 (13.8%) | 4 (1.4%) |
| No Fuel Used | 0 (0.0%) | 0 (0.0%) |
| Total | 507 (100.0%) | 287 (100.0%) |
Household Vehicle Usage in Camden
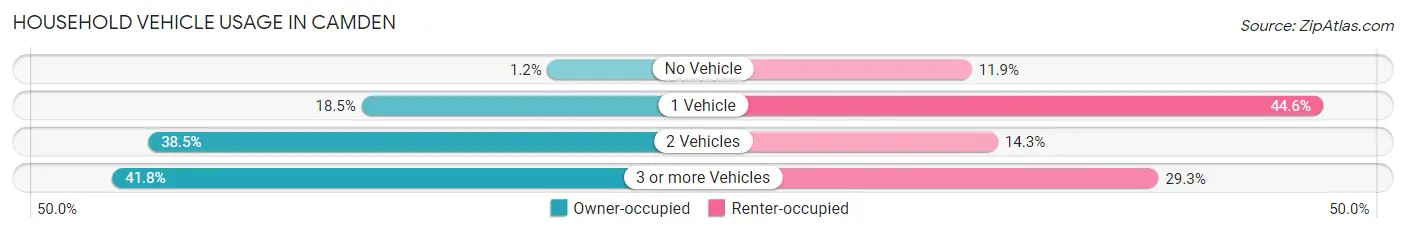
| Vehicles per Household | Owner-occupied | Renter-occupied |
| No Vehicle | 6 (1.2%) | 34 (11.8%) |
| 1 Vehicle | 94 (18.5%) | 128 (44.6%) |
| 2 Vehicles | 195 (38.5%) | 41 (14.3%) |
| 3 or more Vehicles | 212 (41.8%) | 84 (29.3%) |
| Total | 507 (100.0%) | 287 (100.0%) |
Real Estate & Mortgages in Camden
Real Estate and Mortgage Overview in Camden
| Characteristic | Without Mortgage | With Mortgage |
| Housing Units | 294 | 213 |
| Median Property Value | $103,800 | $129,100 |
| Median Household Income | $51,136 | $20 |
| Monthly Housing Costs | $483 | $0 |
| Real Estate Taxes | $1,263 | $3 |
Property Value by Mortgage Status in Camden
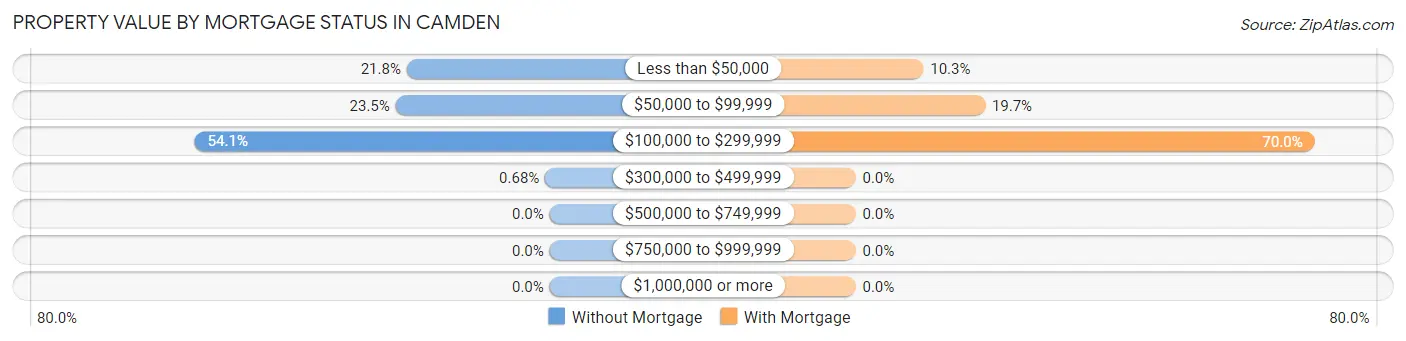
| Property Value | Without Mortgage | With Mortgage |
| Less than $50,000 | 64 (21.8%) | 22 (10.3%) |
| $50,000 to $99,999 | 69 (23.5%) | 42 (19.7%) |
| $100,000 to $299,999 | 159 (54.1%) | 149 (70.0%) |
| $300,000 to $499,999 | 2 (0.7%) | 0 (0.0%) |
| $500,000 to $749,999 | 0 (0.0%) | 0 (0.0%) |
| $750,000 to $999,999 | 0 (0.0%) | 0 (0.0%) |
| $1,000,000 or more | 0 (0.0%) | 0 (0.0%) |
| Total | 294 (100.0%) | 213 (100.0%) |
Household Income by Mortgage Status in Camden
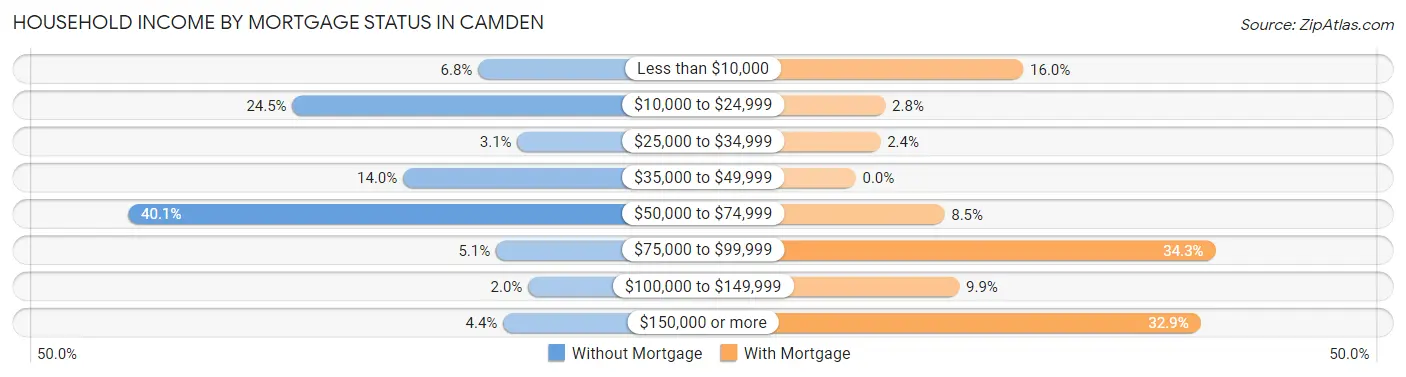
| Household Income | Without Mortgage | With Mortgage |
| Less than $10,000 | 20 (6.8%) | 34 (16.0%) |
| $10,000 to $24,999 | 72 (24.5%) | 6 (2.8%) |
| $25,000 to $34,999 | 9 (3.1%) | 5 (2.4%) |
| $35,000 to $49,999 | 41 (14.0%) | 0 (0.0%) |
| $50,000 to $74,999 | 118 (40.1%) | 18 (8.5%) |
| $75,000 to $99,999 | 15 (5.1%) | 73 (34.3%) |
| $100,000 to $149,999 | 6 (2.0%) | 21 (9.9%) |
| $150,000 or more | 13 (4.4%) | 70 (32.9%) |
| Total | 294 (100.0%) | 213 (100.0%) |
Property Value to Household Income Ratio in Camden
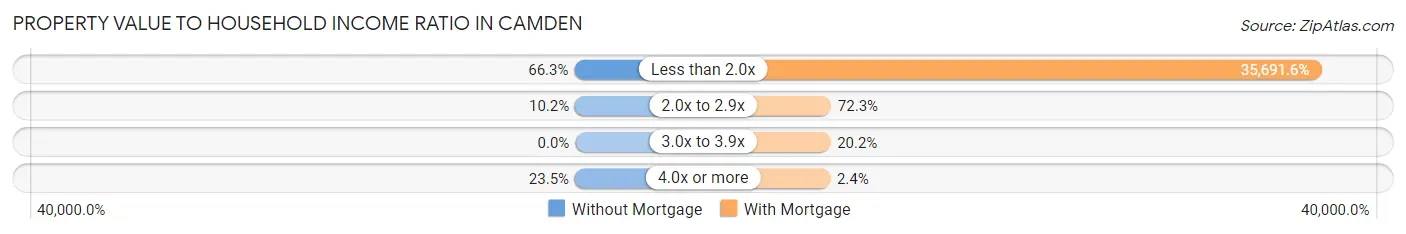
| Value-to-Income Ratio | Without Mortgage | With Mortgage |
| Less than 2.0x | 195 (66.3%) | 76,023 (35,691.6%) |
| 2.0x to 2.9x | 30 (10.2%) | 154 (72.3%) |
| 3.0x to 3.9x | 0 (0.0%) | 43 (20.2%) |
| 4.0x or more | 69 (23.5%) | 5 (2.4%) |
| Total | 294 (100.0%) | 213 (100.0%) |
Real Estate Taxes by Mortgage Status in Camden
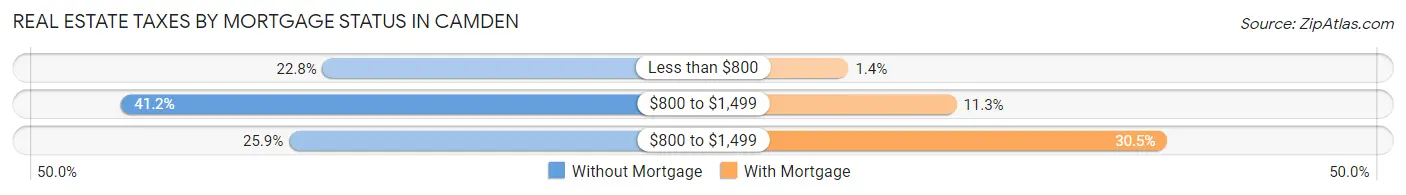
| Property Taxes | Without Mortgage | With Mortgage |
| Less than $800 | 67 (22.8%) | 3 (1.4%) |
| $800 to $1,499 | 121 (41.2%) | 24 (11.3%) |
| $800 to $1,499 | 76 (25.9%) | 65 (30.5%) |
| Total | 294 (100.0%) | 213 (100.0%) |
Health & Disability in Camden
Health Insurance Coverage by Age in Camden
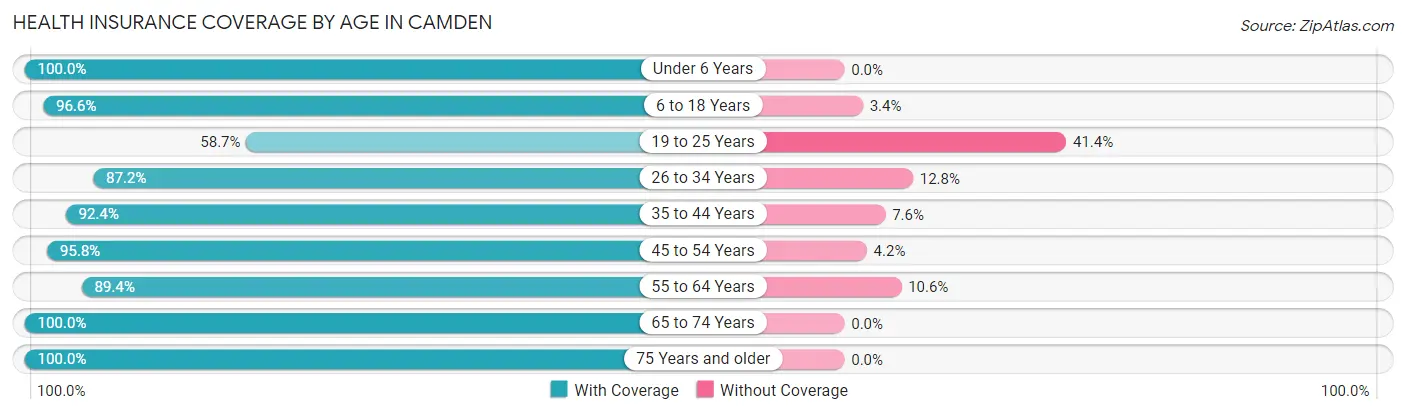
| Age Bracket | With Coverage | Without Coverage |
| Under 6 Years | 129 (100.0%) | 0 (0.0%) |
| 6 to 18 Years | 281 (96.6%) | 10 (3.4%) |
| 19 to 25 Years | 139 (58.7%) | 98 (41.3%) |
| 26 to 34 Years | 82 (87.2%) | 12 (12.8%) |
| 35 to 44 Years | 218 (92.4%) | 18 (7.6%) |
| 45 to 54 Years | 345 (95.8%) | 15 (4.2%) |
| 55 to 64 Years | 219 (89.4%) | 26 (10.6%) |
| 65 to 74 Years | 265 (100.0%) | 0 (0.0%) |
| 75 Years and older | 120 (100.0%) | 0 (0.0%) |
| Total | 1,798 (90.9%) | 179 (9.0%) |
Health Insurance Coverage by Citizenship Status in Camden
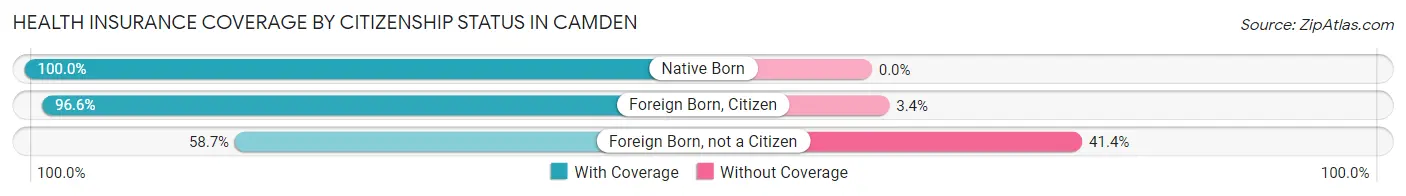
| Citizenship Status | With Coverage | Without Coverage |
| Native Born | 129 (100.0%) | 0 (0.0%) |
| Foreign Born, Citizen | 281 (96.6%) | 10 (3.4%) |
| Foreign Born, not a Citizen | 139 (58.7%) | 98 (41.3%) |
Health Insurance Coverage by Household Income in Camden
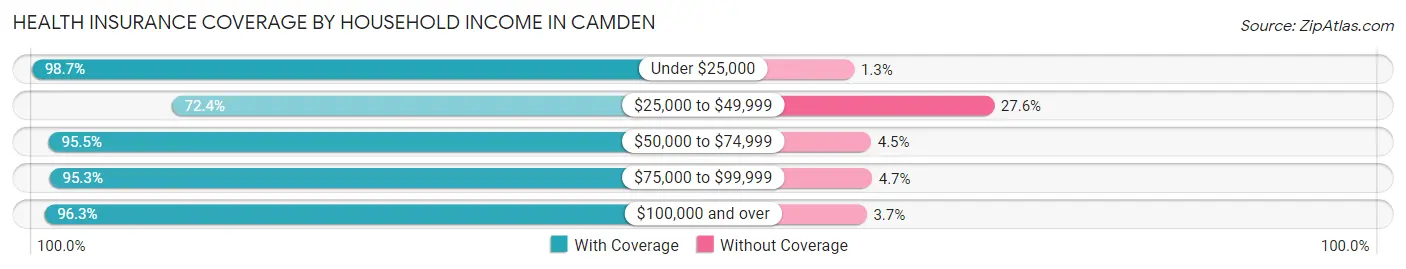
| Household Income | With Coverage | Without Coverage |
| Under $25,000 | 369 (98.7%) | 5 (1.3%) |
| $25,000 to $49,999 | 326 (72.4%) | 124 (27.6%) |
| $50,000 to $74,999 | 617 (95.5%) | 29 (4.5%) |
| $75,000 to $99,999 | 224 (95.3%) | 11 (4.7%) |
| $100,000 and over | 262 (96.3%) | 10 (3.7%) |
Public vs Private Health Insurance Coverage by Age in Camden
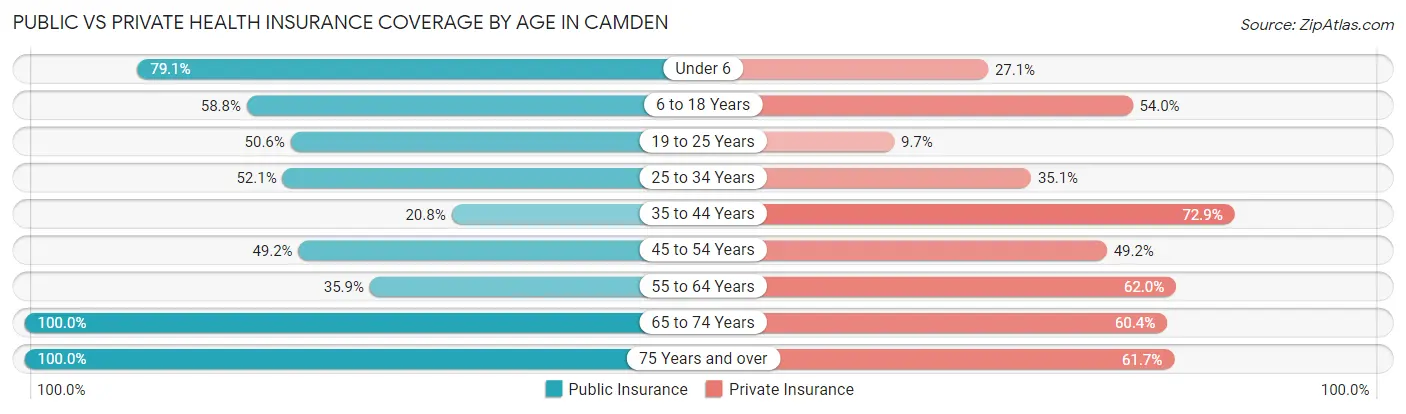
| Age Bracket | Public Insurance | Private Insurance |
| Under 6 | 102 (79.1%) | 35 (27.1%) |
| 6 to 18 Years | 171 (58.8%) | 157 (53.9%) |
| 19 to 25 Years | 120 (50.6%) | 23 (9.7%) |
| 25 to 34 Years | 49 (52.1%) | 33 (35.1%) |
| 35 to 44 Years | 49 (20.8%) | 172 (72.9%) |
| 45 to 54 Years | 177 (49.2%) | 177 (49.2%) |
| 55 to 64 Years | 88 (35.9%) | 152 (62.0%) |
| 65 to 74 Years | 265 (100.0%) | 160 (60.4%) |
| 75 Years and over | 120 (100.0%) | 74 (61.7%) |
| Total | 1,141 (57.7%) | 983 (49.7%) |
Disability Status by Sex by Age in Camden
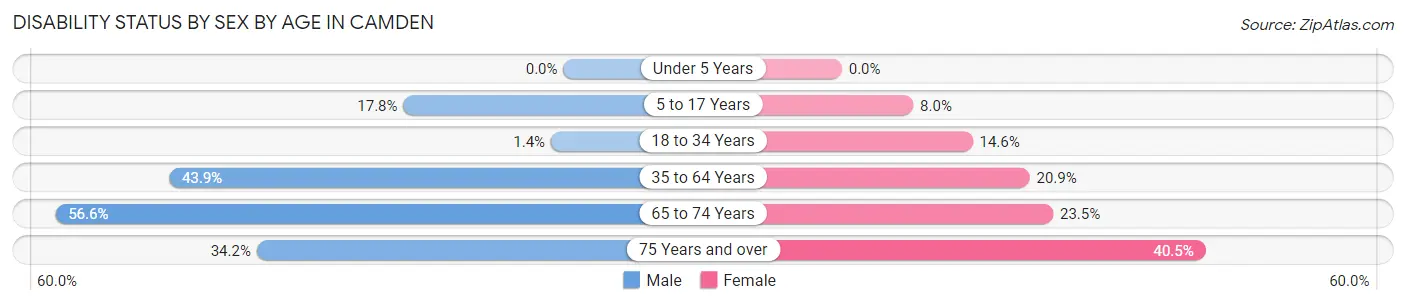
| Age Bracket | Male | Female |
| Under 5 Years | 0 (0.0%) | 0 (0.0%) |
| 5 to 17 Years | 31 (17.8%) | 7 (8.0%) |
| 18 to 34 Years | 3 (1.4%) | 23 (14.6%) |
| 35 to 64 Years | 195 (43.9%) | 83 (20.9%) |
| 65 to 74 Years | 73 (56.6%) | 32 (23.5%) |
| 75 Years and over | 14 (34.2%) | 32 (40.5%) |
Disability Class by Sex by Age in Camden
Disability Class: Hearing Difficulty
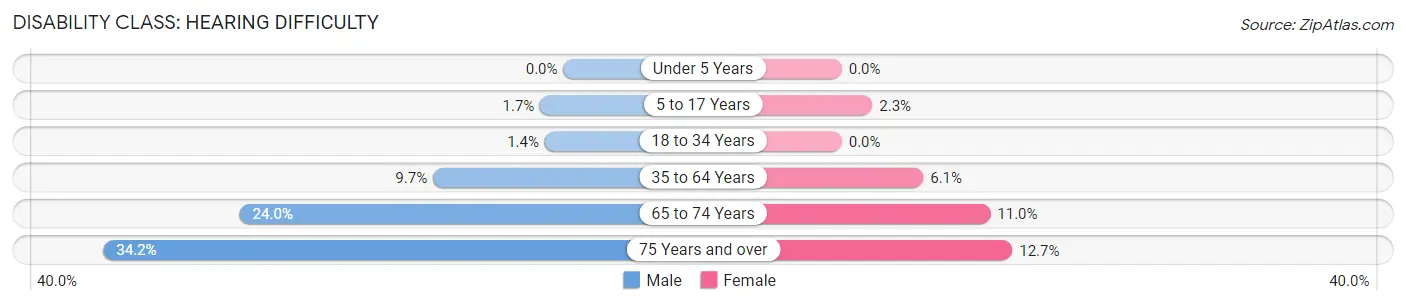
| Age Bracket | Male | Female |
| Under 5 Years | 0 (0.0%) | 0 (0.0%) |
| 5 to 17 Years | 3 (1.7%) | 2 (2.3%) |
| 18 to 34 Years | 3 (1.4%) | 0 (0.0%) |
| 35 to 64 Years | 43 (9.7%) | 24 (6.0%) |
| 65 to 74 Years | 31 (24.0%) | 15 (11.0%) |
| 75 Years and over | 14 (34.2%) | 10 (12.7%) |
Disability Class: Vision Difficulty
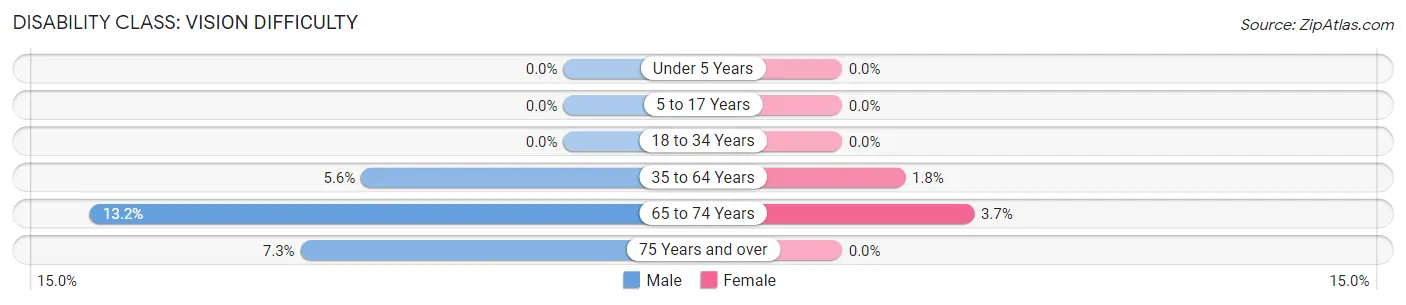
| Age Bracket | Male | Female |
| Under 5 Years | 0 (0.0%) | 0 (0.0%) |
| 5 to 17 Years | 0 (0.0%) | 0 (0.0%) |
| 18 to 34 Years | 0 (0.0%) | 0 (0.0%) |
| 35 to 64 Years | 25 (5.6%) | 7 (1.8%) |
| 65 to 74 Years | 17 (13.2%) | 5 (3.7%) |
| 75 Years and over | 3 (7.3%) | 0 (0.0%) |
Disability Class: Cognitive Difficulty
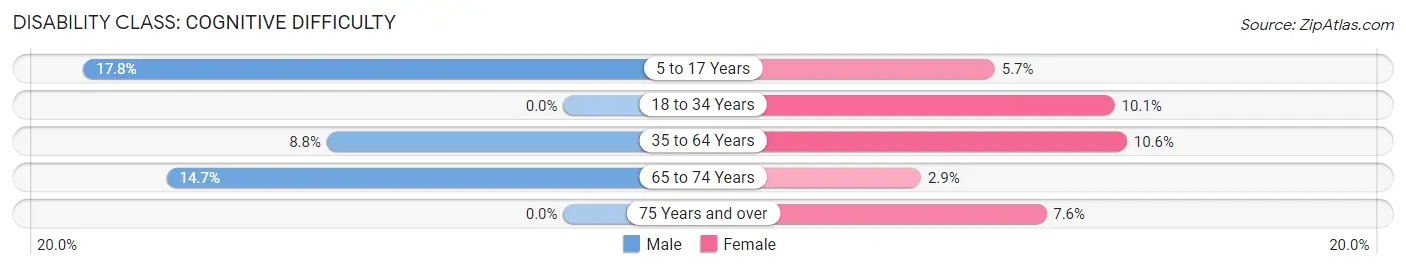
| Age Bracket | Male | Female |
| 5 to 17 Years | 31 (17.8%) | 5 (5.7%) |
| 18 to 34 Years | 0 (0.0%) | 16 (10.1%) |
| 35 to 64 Years | 39 (8.8%) | 42 (10.6%) |
| 65 to 74 Years | 19 (14.7%) | 4 (2.9%) |
| 75 Years and over | 0 (0.0%) | 6 (7.6%) |
Disability Class: Ambulatory Difficulty
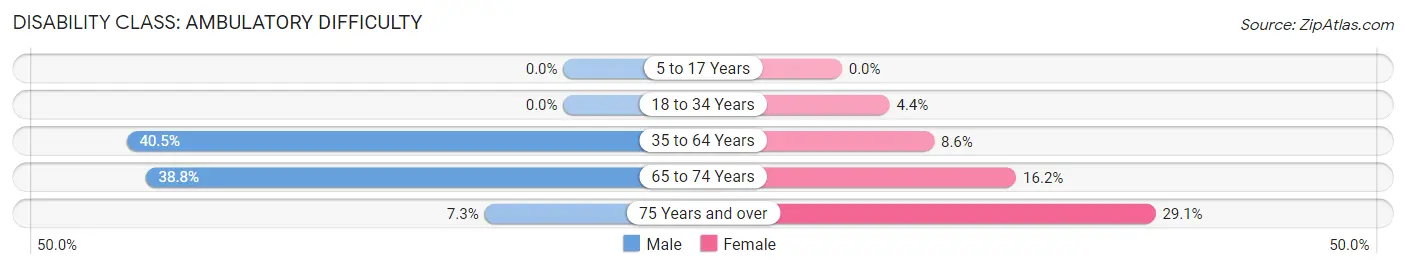
| Age Bracket | Male | Female |
| 5 to 17 Years | 0 (0.0%) | 0 (0.0%) |
| 18 to 34 Years | 0 (0.0%) | 7 (4.4%) |
| 35 to 64 Years | 180 (40.5%) | 34 (8.6%) |
| 65 to 74 Years | 50 (38.8%) | 22 (16.2%) |
| 75 Years and over | 3 (7.3%) | 23 (29.1%) |
Disability Class: Self-Care Difficulty
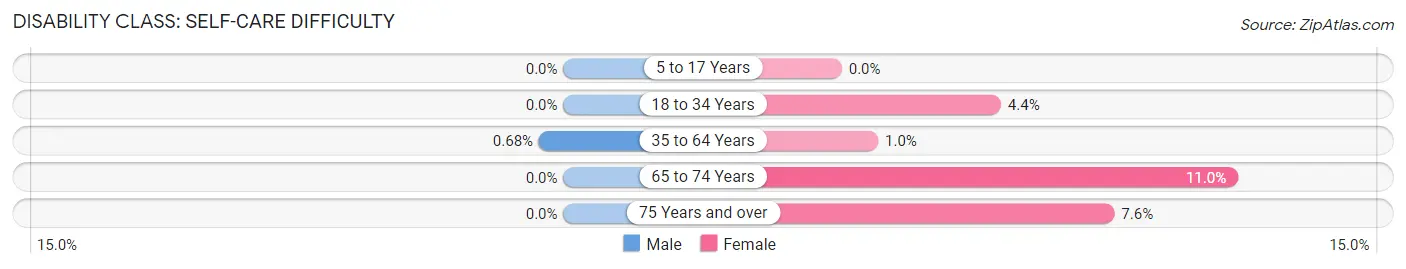
| Age Bracket | Male | Female |
| 5 to 17 Years | 0 (0.0%) | 0 (0.0%) |
| 18 to 34 Years | 0 (0.0%) | 7 (4.4%) |
| 35 to 64 Years | 3 (0.7%) | 4 (1.0%) |
| 65 to 74 Years | 0 (0.0%) | 15 (11.0%) |
| 75 Years and over | 0 (0.0%) | 6 (7.6%) |
Technology Access in Camden
Computing Device Access in Camden
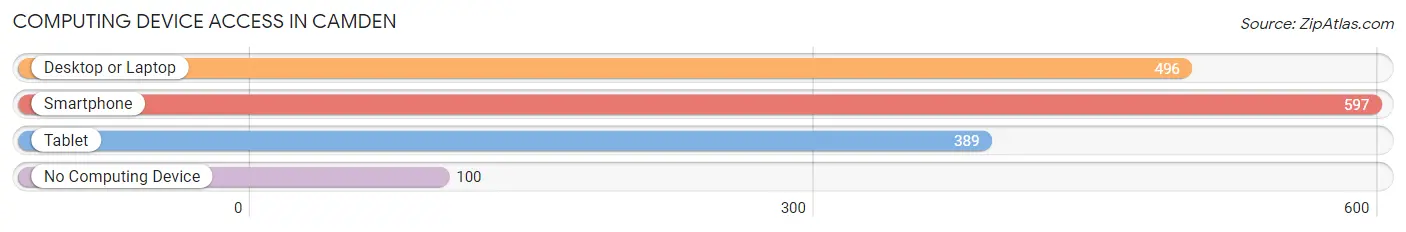
| Device Type | # Households | % Households |
| Desktop or Laptop | 496 | 62.5% |
| Smartphone | 597 | 75.2% |
| Tablet | 389 | 49.0% |
| No Computing Device | 100 | 12.6% |
| Total | 794 | 100.0% |
Internet Access in Camden
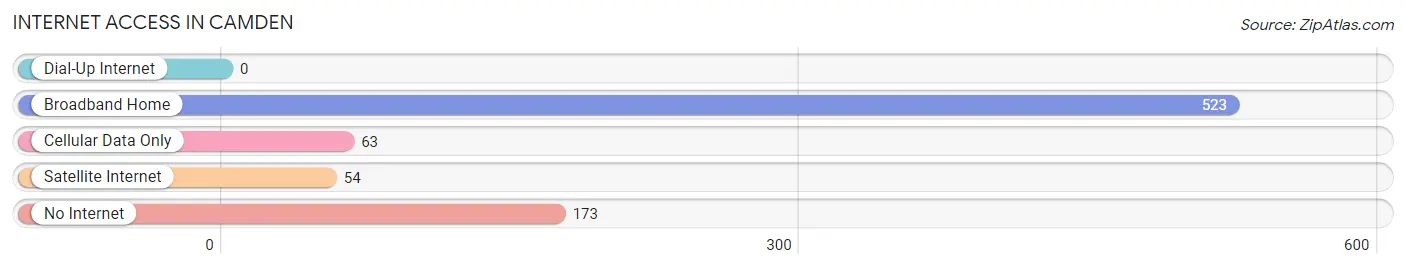
| Internet Type | # Households | % Households |
| Dial-Up Internet | 0 | 0.0% |
| Broadband Home | 523 | 65.9% |
| Cellular Data Only | 63 | 7.9% |
| Satellite Internet | 54 | 6.8% |
| No Internet | 173 | 21.8% |
| Total | 794 | 100.0% |
Camden Summary
Camden, Ohio is a small village located in Preble County, Ohio. It is situated on the banks of the Great Miami River, approximately 25 miles northwest of Dayton. The village has a population of 1,845 people, according to the 2010 census.
History
The area that is now Camden was first settled in 1806 by a group of Quakers from North Carolina. The village was originally known as Quaker Bottom, but was later renamed Camden in 1818 after the Earl of Camden, a British statesman. The village was incorporated in 1841.
In the late 19th century, Camden was a thriving agricultural community. The village was home to several mills, including a grist mill, a saw mill, and a woolen mill. The village also had a number of stores, a hotel, and a post office.
Geography
Camden is located in Preble County, Ohio, approximately 25 miles northwest of Dayton. The village is situated on the banks of the Great Miami River. The village has a total area of 0.9 square miles, all of which is land.
The village is located in a rural area, with the nearest major city being Dayton. The village is surrounded by farmland and is home to several small lakes.
Economy
The economy of Camden is largely based on agriculture. The village is home to several farms, which produce a variety of crops, including corn, soybeans, and wheat. The village also has a number of small businesses, including restaurants, stores, and a gas station.
Demographics
According to the 2010 census, Camden has a population of 1,845 people. The population is predominantly white (96.2%), with a small percentage of African Americans (2.2%) and Hispanics (1.2%). The median household income is $41,250, and the median age is 41.
The village is home to a number of churches, including the Camden United Methodist Church, the Camden Presbyterian Church, and the Camden Church of the Nazarene. The village also has a public library and a number of parks.
Conclusion
Camden, Ohio is a small village located in Preble County, Ohio. It is situated on the banks of the Great Miami River, approximately 25 miles northwest of Dayton. The village has a population of 1,845 people, according to the 2010 census. The economy of Camden is largely based on agriculture, and the village is home to several farms, businesses, churches, and parks. The population is predominantly white, with a small percentage of African Americans and Hispanics.
Common Questions
What is Per Capita Income in Camden?
Per Capita income in Camden is $23,204.
What is the Median Family Income in Camden?
Median Family Income in Camden is $55,313.
What is the Median Household income in Camden?
Median Household Income in Camden is $49,667.
What is Income or Wage Gap in Camden?
Income or Wage Gap in Camden is 21.0%.
Women in Camden earn 79.0 cents for every dollar earned by a man.
What is Family Income Deficit in Camden?
Family Income Deficit in Camden is $13,146.
Families that are below poverty line in Camden earn $13,146 less on average than the poverty threshold level.
What is Inequality or Gini Index in Camden?
Inequality or Gini Index in Camden is 0.43.
What is the Total Population of Camden?
Total Population of Camden is 1,977.
What is the Total Male Population of Camden?
Total Male Population of Camden is 1,090.
What is the Total Female Population of Camden?
Total Female Population of Camden is 887.
What is the Ratio of Males per 100 Females in Camden?
There are 122.89 Males per 100 Females in Camden.
What is the Ratio of Females per 100 Males in Camden?
There are 81.38 Females per 100 Males in Camden.
What is the Median Population Age in Camden?
Median Population Age in Camden is 45.1 Years.
What is the Average Family Size in Camden
Average Family Size in Camden is 2.6 People.
What is the Average Household Size in Camden
Average Household Size in Camden is 2.5 People.
How Large is the Labor Force in Camden?
There are 747 People in the Labor Forcein in Camden.
What is the Percentage of People in the Labor Force in Camden?
43.7% of People are in the Labor Force in Camden.
What is the Unemployment Rate in Camden?
Unemployment Rate in Camden is 4.7%.