Cambridge, OH Map & Demographics
Cambridge Map
Cambridge Overview
$23,361
PER CAPITA INCOME
$52,527
AVG FAMILY INCOME
$39,589
AVG HOUSEHOLD INCOME
24.1%
WAGE / INCOME GAP [ % ]
75.9¢/ $1
WAGE / INCOME GAP [ $ ]
$12,887
FAMILY INCOME DEFICIT
0.44
INEQUALITY / GINI INDEX
10,087
TOTAL POPULATION
4,846
MALE POPULATION
5,241
FEMALE POPULATION
92.46
MALES / 100 FEMALES
108.15
FEMALES / 100 MALES
35.1
MEDIAN AGE
3.0
AVG FAMILY SIZE
2.2
AVG HOUSEHOLD SIZE
4,614
LABOR FORCE [ PEOPLE ]
58.0%
PERCENT IN LABOR FORCE
2.6%
UNEMPLOYMENT RATE
Cambridge Zip Codes
Cambridge Area Codes
Income in Cambridge
Income Overview in Cambridge
Per Capita Income in Cambridge is $23,361, while median incomes of families and households are $52,527 and $39,589 respectively.
| Characteristic | Number | Measure |
| Per Capita Income | 10,087 | $23,361 |
| Median Family Income | 2,309 | $52,527 |
| Mean Family Income | 2,309 | $61,156 |
| Median Household Income | 4,465 | $39,589 |
| Mean Household Income | 4,465 | $51,794 |
| Income Deficit | 2,309 | $12,887 |
| Wage / Income Gap (%) | 10,087 | 24.15% |
| Wage / Income Gap ($) | 10,087 | 75.85¢ per $1 |
| Gini / Inequality Index | 10,087 | 0.44 |
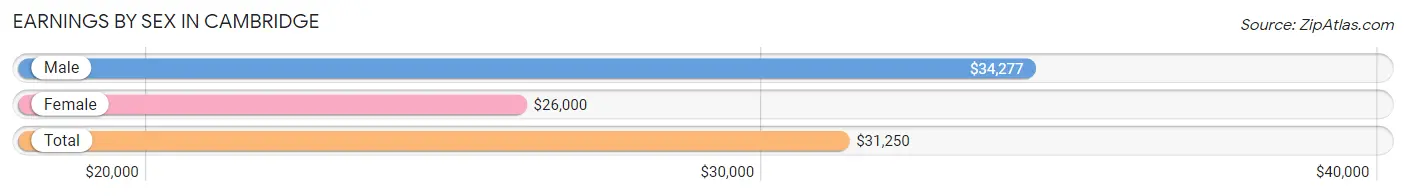
Earnings by Sex in Cambridge
Average Earnings in Cambridge are $31,250, $34,277 for men and $26,000 for women, a difference of 24.1%.
| Sex | Number | Average Earnings |
| Male | 2,457 (49.1%) | $34,277 |
| Female | 2,550 (50.9%) | $26,000 |
| Total | 5,007 (100.0%) | $31,250 |
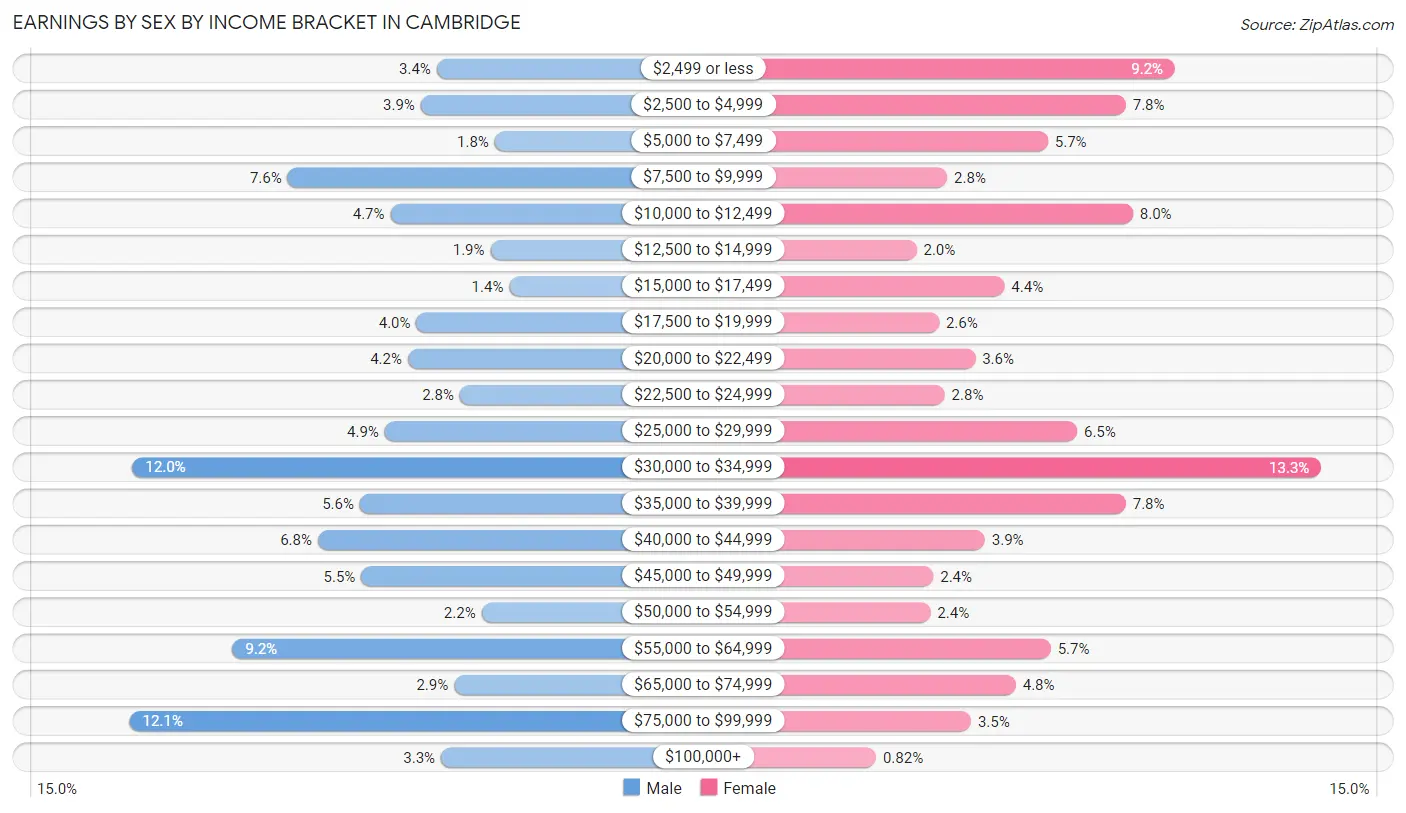
Earnings by Sex by Income Bracket in Cambridge
The most common earnings brackets in Cambridge are $75,000 to $99,999 for men (296 | 12.0%) and $30,000 to $34,999 for women (340 | 13.3%).
| Income | Male | Female |
| $2,499 or less | 84 (3.4%) | 235 (9.2%) |
| $2,500 to $4,999 | 95 (3.9%) | 200 (7.8%) |
| $5,000 to $7,499 | 44 (1.8%) | 144 (5.7%) |
| $7,500 to $9,999 | 187 (7.6%) | 72 (2.8%) |
| $10,000 to $12,499 | 116 (4.7%) | 205 (8.0%) |
| $12,500 to $14,999 | 47 (1.9%) | 50 (2.0%) |
| $15,000 to $17,499 | 34 (1.4%) | 113 (4.4%) |
| $17,500 to $19,999 | 98 (4.0%) | 66 (2.6%) |
| $20,000 to $22,499 | 104 (4.2%) | 92 (3.6%) |
| $22,500 to $24,999 | 68 (2.8%) | 70 (2.8%) |
| $25,000 to $29,999 | 120 (4.9%) | 165 (6.5%) |
| $30,000 to $34,999 | 294 (12.0%) | 340 (13.3%) |
| $35,000 to $39,999 | 137 (5.6%) | 200 (7.8%) |
| $40,000 to $44,999 | 166 (6.8%) | 99 (3.9%) |
| $45,000 to $49,999 | 136 (5.5%) | 62 (2.4%) |
| $50,000 to $54,999 | 53 (2.2%) | 60 (2.4%) |
| $55,000 to $64,999 | 225 (9.2%) | 146 (5.7%) |
| $65,000 to $74,999 | 72 (2.9%) | 121 (4.8%) |
| $75,000 to $99,999 | 296 (12.0%) | 89 (3.5%) |
| $100,000+ | 81 (3.3%) | 21 (0.8%) |
| Total | 2,457 (100.0%) | 2,550 (100.0%) |
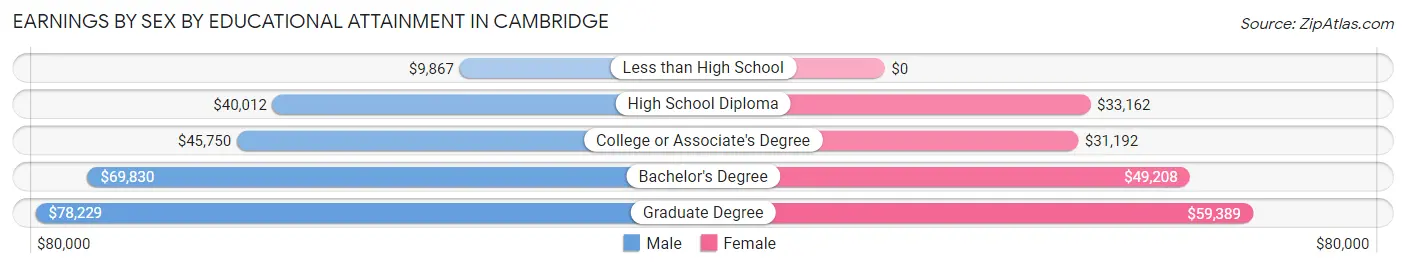
Earnings by Sex by Educational Attainment in Cambridge
Average earnings in Cambridge are $40,594 for men and $32,485 for women, a difference of 20.0%. Men with an educational attainment of graduate degree enjoy the highest average annual earnings of $78,229, while those with less than high school education earn the least with $9,867. Women with an educational attainment of graduate degree earn the most with the average annual earnings of $59,389, while those with college or associate's degree education have the smallest earnings of $31,192.
| Educational Attainment | Male Income | Female Income |
| Less than High School | $9,867 | $0 |
| High School Diploma | $40,012 | $33,162 |
| College or Associate's Degree | $45,750 | $31,192 |
| Bachelor's Degree | $69,830 | $49,208 |
| Graduate Degree | $78,229 | $59,389 |
| Total | $40,594 | $32,485 |
Family Income in Cambridge
Family Income Brackets in Cambridge
According to the Cambridge family income data, there are 367 families falling into the $75,000 to $99,999 income range, which is the most common income bracket and makes up 15.9% of all families. Conversely, the $200,000+ income bracket is the least frequent group with only 30 families (1.3%) belonging to this category.
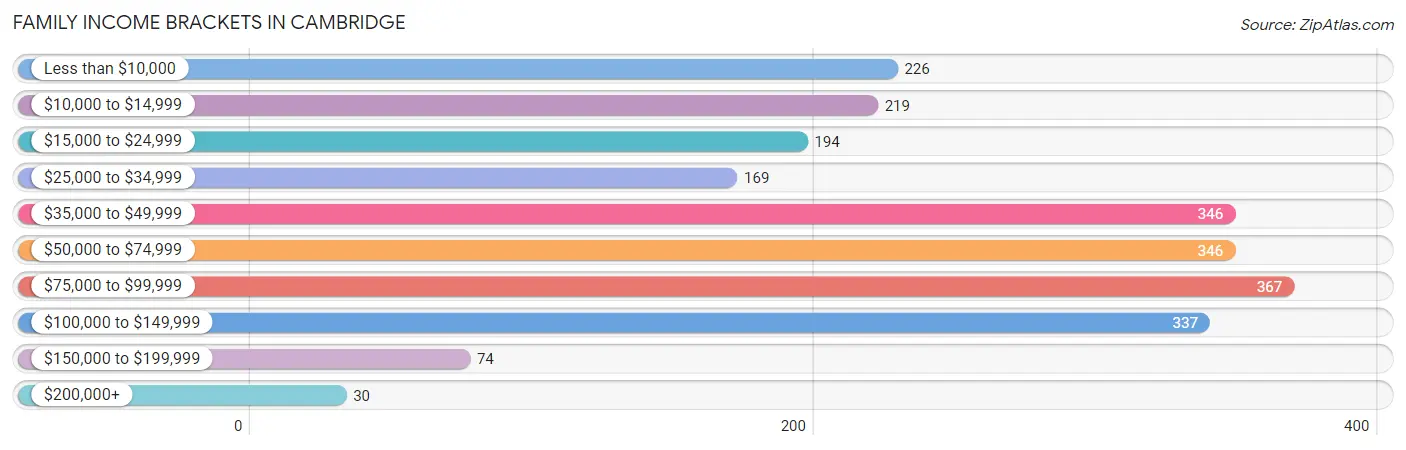
| Income Bracket | # Families | % Families |
| Less than $10,000 | 226 | 9.8% |
| $10,000 to $14,999 | 219 | 9.5% |
| $15,000 to $24,999 | 194 | 8.4% |
| $25,000 to $34,999 | 169 | 7.3% |
| $35,000 to $49,999 | 346 | 15.0% |
| $50,000 to $74,999 | 346 | 15.0% |
| $75,000 to $99,999 | 367 | 15.9% |
| $100,000 to $149,999 | 337 | 14.6% |
| $150,000 to $199,999 | 74 | 3.2% |
| $200,000+ | 30 | 1.3% |
Family Income by Famaliy Size in Cambridge
2-person families (1,026 | 44.4%) account for the highest median family income in Cambridge with $60,568 per family, while 2-person families (1,026 | 44.4%) have the highest median income of $30,284 per family member.
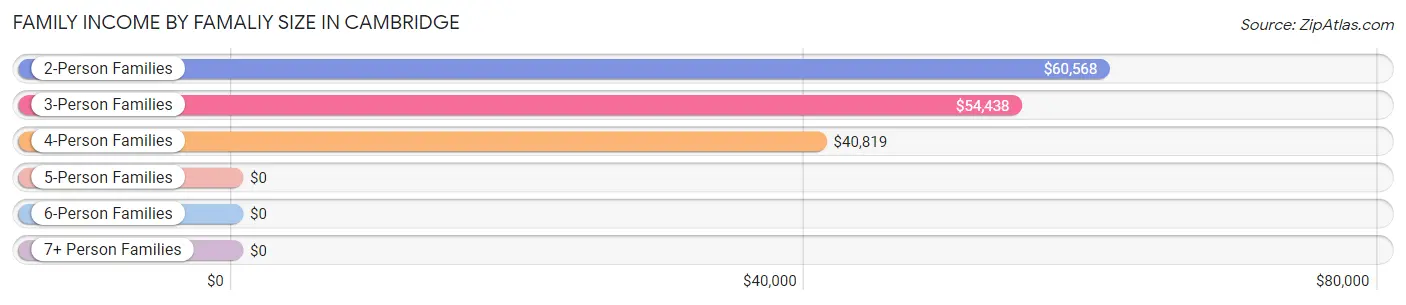
| Income Bracket | # Families | Median Income |
| 2-Person Families | 1,026 (44.4%) | $60,568 |
| 3-Person Families | 627 (27.2%) | $54,438 |
| 4-Person Families | 419 (18.1%) | $40,819 |
| 5-Person Families | 179 (7.7%) | $0 |
| 6-Person Families | 50 (2.2%) | $0 |
| 7+ Person Families | 8 (0.4%) | $0 |
| Total | 2,309 (100.0%) | $52,527 |
Family Income by Number of Earners in Cambridge
The median family income in Cambridge is $52,527, with families comprising 3+ earners (147) having the highest median family income of $98,977, while families with no earners (506) have the lowest median family income of $21,181, accounting for 6.4% and 21.9% of families, respectively.
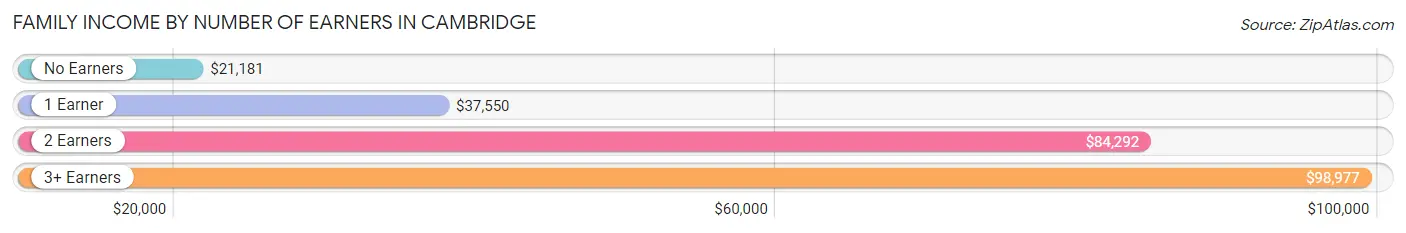
| Number of Earners | # Families | Median Income |
| No Earners | 506 (21.9%) | $21,181 |
| 1 Earner | 849 (36.8%) | $37,550 |
| 2 Earners | 807 (34.9%) | $84,292 |
| 3+ Earners | 147 (6.4%) | $98,977 |
| Total | 2,309 (100.0%) | $52,527 |
Household Income in Cambridge
Household Income Brackets in Cambridge
With 670 households falling in the category, the $15,000 to $24,999 income range is the most frequent in Cambridge, accounting for 15.0% of all households. In contrast, only 31 households (0.7%) fall into the $200,000+ income bracket, making it the least populous group.
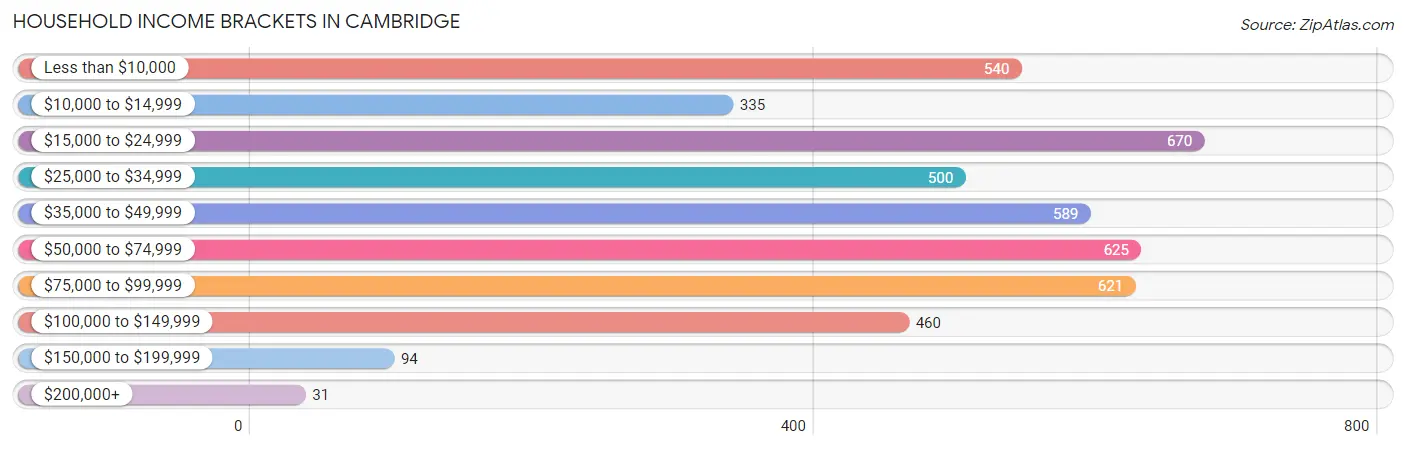
| Income Bracket | # Households | % Households |
| Less than $10,000 | 540 | 12.1% |
| $10,000 to $14,999 | 335 | 7.5% |
| $15,000 to $24,999 | 670 | 15.0% |
| $25,000 to $34,999 | 500 | 11.2% |
| $35,000 to $49,999 | 589 | 13.2% |
| $50,000 to $74,999 | 625 | 14.0% |
| $75,000 to $99,999 | 621 | 13.9% |
| $100,000 to $149,999 | 460 | 10.3% |
| $150,000 to $199,999 | 94 | 2.1% |
| $200,000+ | 31 | 0.7% |
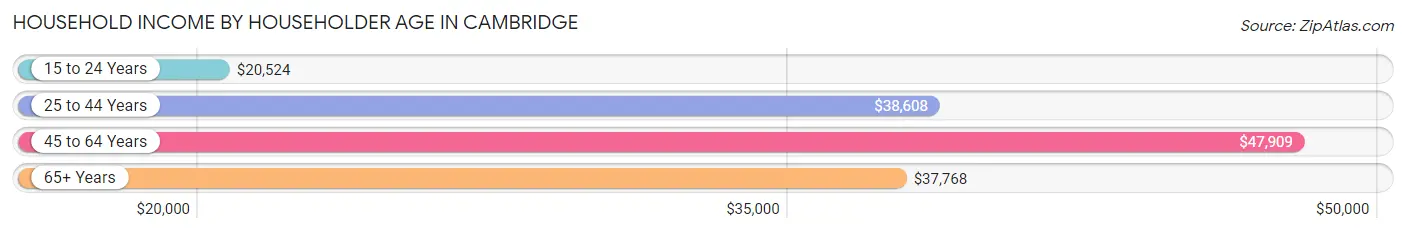
Household Income by Householder Age in Cambridge
The median household income in Cambridge is $39,589, with the highest median household income of $47,909 found in the 45 to 64 years age bracket for the primary householder. A total of 1,457 households (32.6%) fall into this category. Meanwhile, the 15 to 24 years age bracket for the primary householder has the lowest median household income of $20,524, with 381 households (8.5%) in this group.
| Income Bracket | # Households | Median Income |
| 15 to 24 Years | 381 (8.5%) | $20,524 |
| 25 to 44 Years | 1,465 (32.8%) | $38,608 |
| 45 to 64 Years | 1,457 (32.6%) | $47,909 |
| 65+ Years | 1,162 (26.0%) | $37,768 |
| Total | 4,465 (100.0%) | $39,589 |
Poverty in Cambridge
Income Below Poverty by Sex and Age in Cambridge
With 28.9% poverty level for males and 31.4% for females among the residents of Cambridge, under 5 year old males and 12 to 14 year old females are the most vulnerable to poverty, with 275 males (70.7%) and 116 females (56.3%) in their respective age groups living below the poverty level.
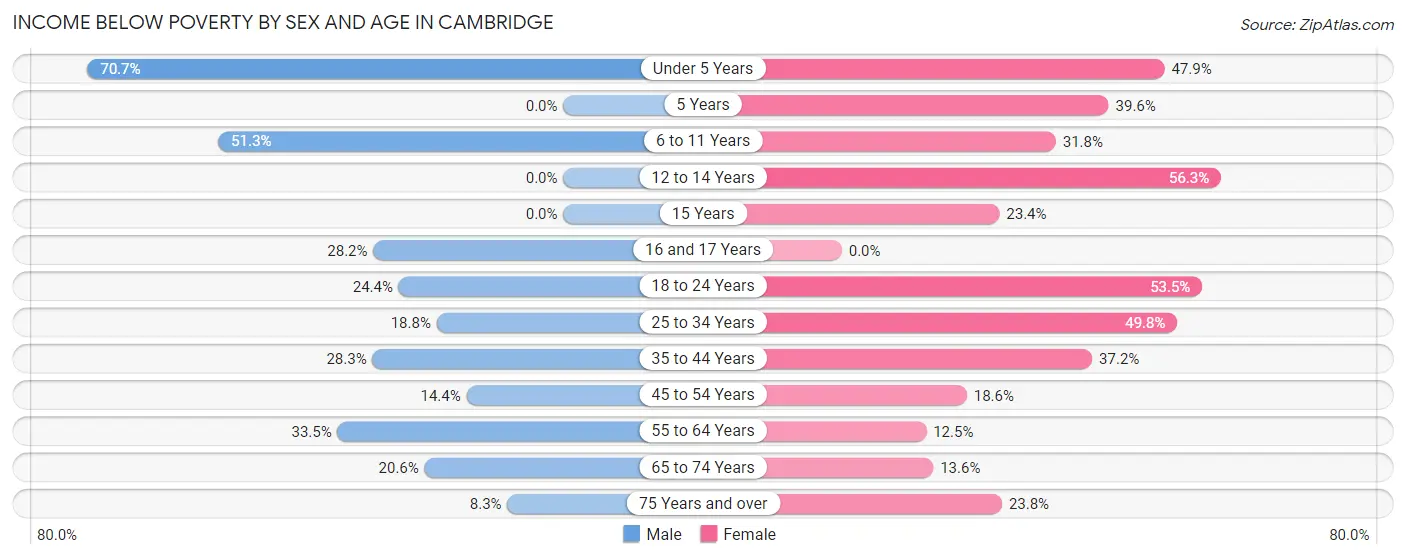
| Age Bracket | Male | Female |
| Under 5 Years | 275 (70.7%) | 161 (47.9%) |
| 5 Years | 0 (0.0%) | 21 (39.6%) |
| 6 to 11 Years | 307 (51.2%) | 68 (31.8%) |
| 12 to 14 Years | 0 (0.0%) | 116 (56.3%) |
| 15 Years | 0 (0.0%) | 11 (23.4%) |
| 16 and 17 Years | 11 (28.2%) | 0 (0.0%) |
| 18 to 24 Years | 139 (24.4%) | 305 (53.5%) |
| 25 to 34 Years | 122 (18.8%) | 402 (49.8%) |
| 35 to 44 Years | 157 (28.3%) | 145 (37.2%) |
| 45 to 54 Years | 73 (14.4%) | 113 (18.6%) |
| 55 to 64 Years | 167 (33.5%) | 89 (12.5%) |
| 65 to 74 Years | 89 (20.6%) | 72 (13.6%) |
| 75 Years and over | 19 (8.3%) | 102 (23.8%) |
| Total | 1,359 (28.9%) | 1,605 (31.4%) |
Income Above Poverty by Sex and Age in Cambridge
According to the poverty statistics in Cambridge, males aged 5 years and females aged 16 and 17 years are the age groups that are most secure financially, with 100.0% of males and 100.0% of females in these age groups living above the poverty line.
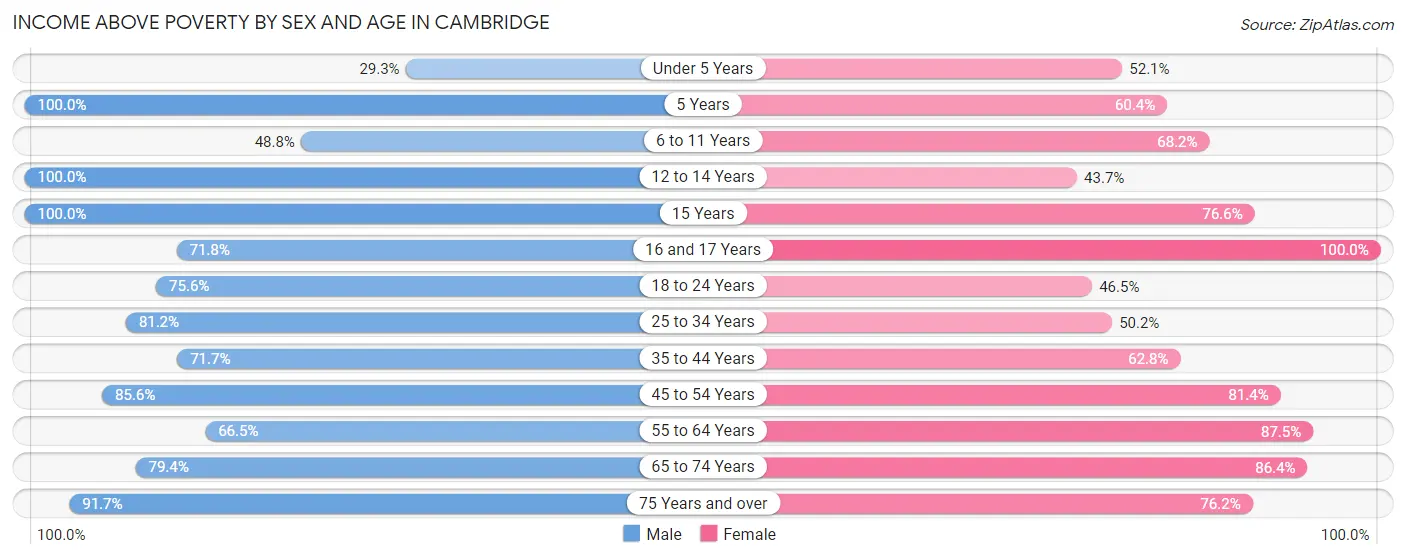
| Age Bracket | Male | Female |
| Under 5 Years | 114 (29.3%) | 175 (52.1%) |
| 5 Years | 15 (100.0%) | 32 (60.4%) |
| 6 to 11 Years | 292 (48.7%) | 146 (68.2%) |
| 12 to 14 Years | 119 (100.0%) | 90 (43.7%) |
| 15 Years | 102 (100.0%) | 36 (76.6%) |
| 16 and 17 Years | 28 (71.8%) | 214 (100.0%) |
| 18 to 24 Years | 430 (75.6%) | 265 (46.5%) |
| 25 to 34 Years | 527 (81.2%) | 405 (50.2%) |
| 35 to 44 Years | 397 (71.7%) | 245 (62.8%) |
| 45 to 54 Years | 435 (85.6%) | 496 (81.4%) |
| 55 to 64 Years | 331 (66.5%) | 621 (87.5%) |
| 65 to 74 Years | 343 (79.4%) | 458 (86.4%) |
| 75 Years and over | 210 (91.7%) | 327 (76.2%) |
| Total | 3,343 (71.1%) | 3,510 (68.6%) |
Income Below Poverty Among Married-Couple Families in Cambridge
The poverty statistics for married-couple families in Cambridge show that 11.2% or 143 of the total 1,272 families live below the poverty line. Families with 1 or 2 children have the highest poverty rate of 29.0%, comprising of 123 families. On the other hand, families with 3 or 4 children have the lowest poverty rate of 0.0%, which includes 0 families.
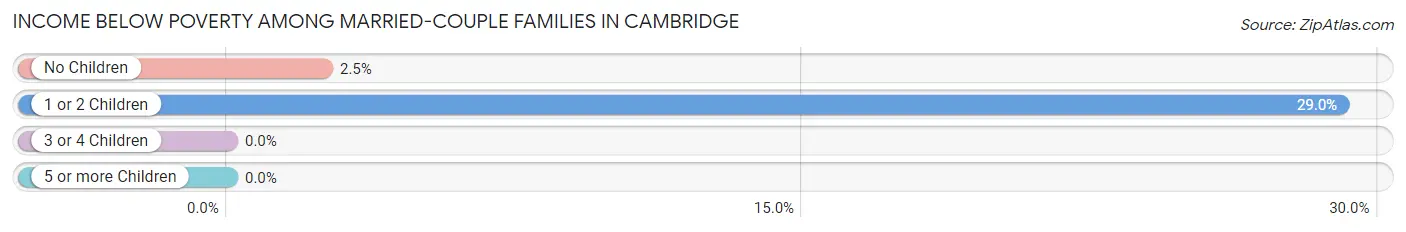
| Children | Above Poverty | Below Poverty |
| No Children | 785 (97.5%) | 20 (2.5%) |
| 1 or 2 Children | 301 (71.0%) | 123 (29.0%) |
| 3 or 4 Children | 35 (100.0%) | 0 (0.0%) |
| 5 or more Children | 8 (100.0%) | 0 (0.0%) |
| Total | 1,129 (88.8%) | 143 (11.2%) |
Income Below Poverty Among Single-Parent Households in Cambridge
According to the poverty data in Cambridge, 28.6% or 91 single-father households and 58.7% or 422 single-mother households are living below the poverty line. Among single-father households, those with 3 or 4 children have the highest poverty rate, with 46 households (47.4%) experiencing poverty. Likewise, among single-mother households, those with 3 or 4 children have the highest poverty rate, with 129 households (100.0%) falling below the poverty line.
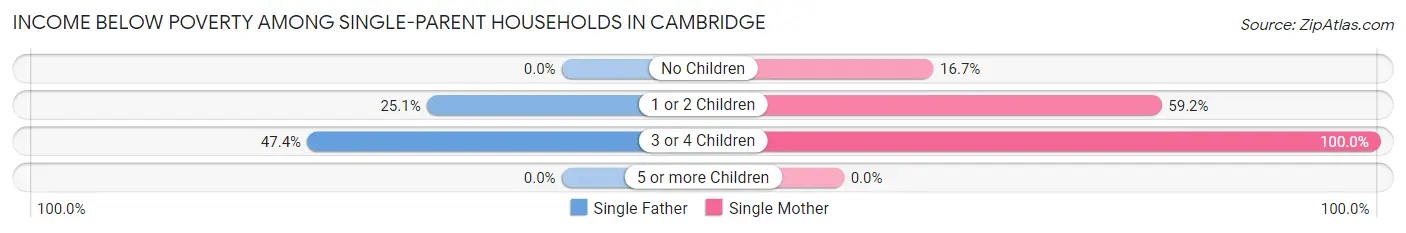
| Children | Single Father | Single Mother |
| No Children | 0 (0.0%) | 22 (16.7%) |
| 1 or 2 Children | 45 (25.1%) | 271 (59.2%) |
| 3 or 4 Children | 46 (47.4%) | 129 (100.0%) |
| 5 or more Children | 0 (0.0%) | 0 (0.0%) |
| Total | 91 (28.6%) | 422 (58.7%) |
Income Below Poverty Among Married-Couple vs Single-Parent Households in Cambridge
The poverty data for Cambridge shows that 143 of the married-couple family households (11.2%) and 513 of the single-parent households (49.5%) are living below the poverty level. Within the married-couple family households, those with 1 or 2 children have the highest poverty rate, with 123 households (29.0%) falling below the poverty line. Among the single-parent households, those with 3 or 4 children have the highest poverty rate, with 175 household (77.4%) living below poverty.
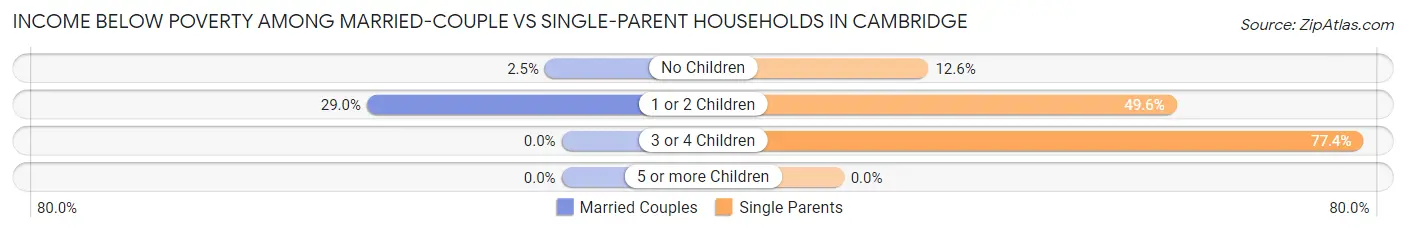
| Children | Married-Couple Families | Single-Parent Households |
| No Children | 20 (2.5%) | 22 (12.6%) |
| 1 or 2 Children | 123 (29.0%) | 316 (49.6%) |
| 3 or 4 Children | 0 (0.0%) | 175 (77.4%) |
| 5 or more Children | 0 (0.0%) | 0 (0.0%) |
| Total | 143 (11.2%) | 513 (49.5%) |
Race in Cambridge
The most populous races in Cambridge are White / Caucasian (8,998 | 89.2%), Black / African American (579 | 5.7%), and Two or more Races (421 | 4.2%).
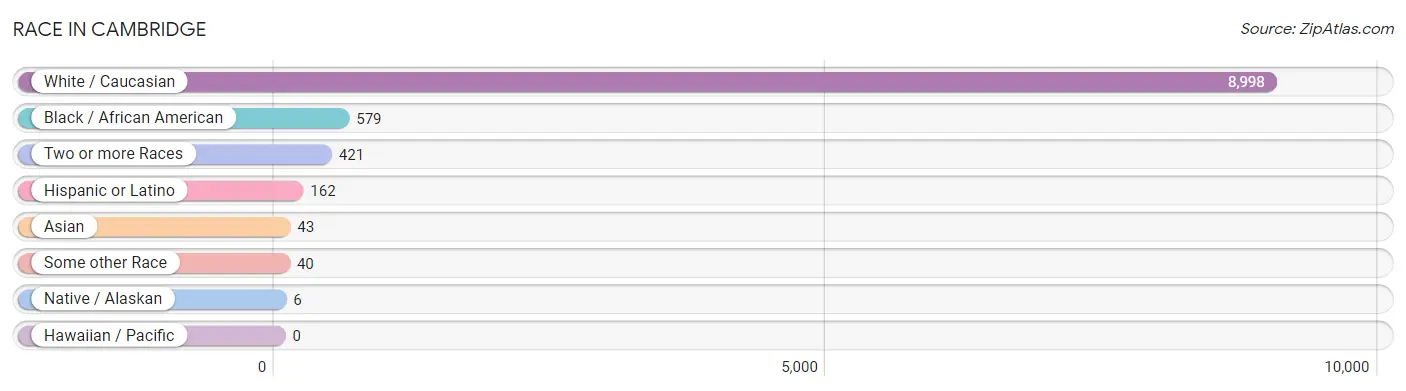
| Race | # Population | % Population |
| Asian | 43 | 0.4% |
| Black / African American | 579 | 5.7% |
| Hawaiian / Pacific | 0 | 0.0% |
| Hispanic or Latino | 162 | 1.6% |
| Native / Alaskan | 6 | 0.1% |
| White / Caucasian | 8,998 | 89.2% |
| Two or more Races | 421 | 4.2% |
| Some other Race | 40 | 0.4% |
| Total | 10,087 | 100.0% |
Ancestry in Cambridge
The most populous ancestries reported in Cambridge are German (1,838 | 18.2%), Irish (1,662 | 16.5%), English (1,307 | 13.0%), American (942 | 9.3%), and Italian (616 | 6.1%), together accounting for 63.1% of all Cambridge residents.
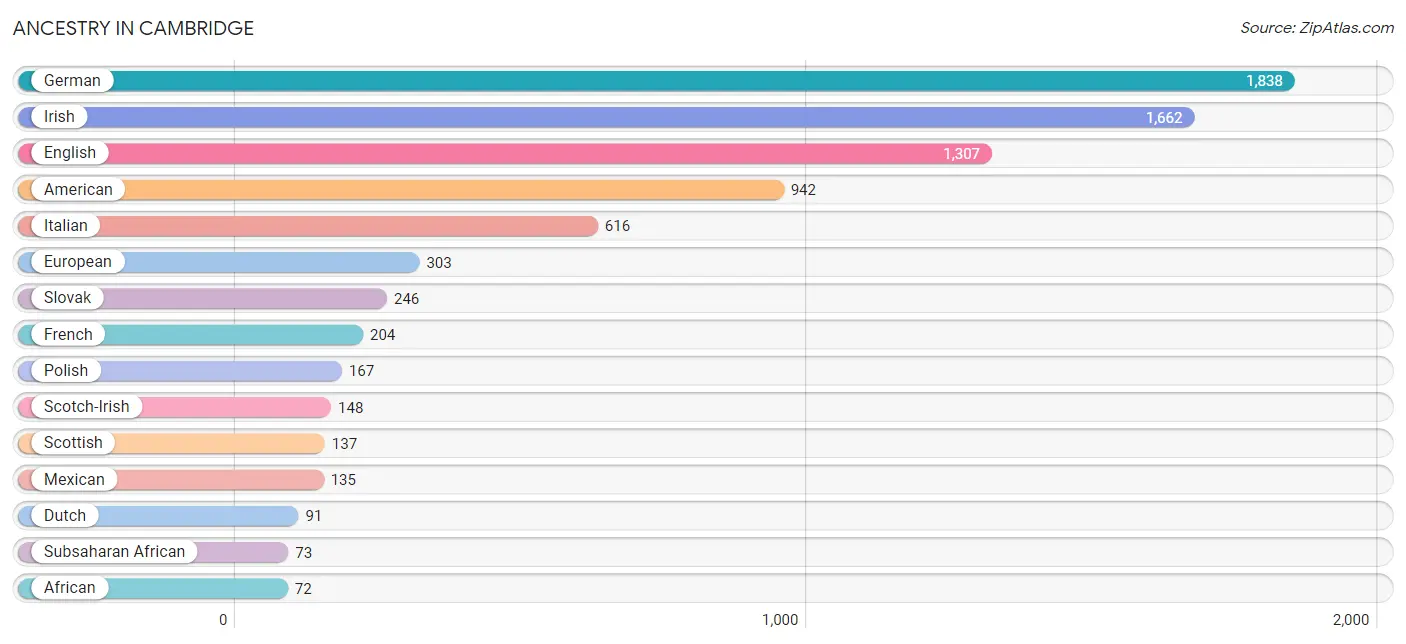
| Ancestry | # Population | % Population |
| African | 72 | 0.7% |
| American | 942 | 9.3% |
| Arab | 56 | 0.6% |
| Blackfeet | 1 | 0.0% |
| British | 8 | 0.1% |
| Burmese | 32 | 0.3% |
| Cherokee | 8 | 0.1% |
| Chippewa | 4 | 0.0% |
| Czech | 58 | 0.6% |
| Czechoslovakian | 26 | 0.3% |
| Dutch | 91 | 0.9% |
| Eastern European | 8 | 0.1% |
| Ecuadorian | 14 | 0.1% |
| English | 1,307 | 13.0% |
| European | 303 | 3.0% |
| French | 204 | 2.0% |
| French Canadian | 47 | 0.5% |
| German | 1,838 | 18.2% |
| Greek | 11 | 0.1% |
| Indian (Asian) | 24 | 0.2% |
| Irish | 1,662 | 16.5% |
| Italian | 616 | 6.1% |
| Jamaican | 20 | 0.2% |
| Lebanese | 50 | 0.5% |
| Mexican | 135 | 1.3% |
| Polish | 167 | 1.7% |
| Puerto Rican | 13 | 0.1% |
| Russian | 13 | 0.1% |
| Scotch-Irish | 148 | 1.5% |
| Scottish | 137 | 1.4% |
| Serbian | 7 | 0.1% |
| Slovak | 246 | 2.4% |
| South American | 14 | 0.1% |
| Subsaharan African | 73 | 0.7% |
| Swiss | 32 | 0.3% |
| Syrian | 7 | 0.1% |
| Ukrainian | 9 | 0.1% |
| Welsh | 32 | 0.3% | View All 38 Rows |
Immigrants in Cambridge
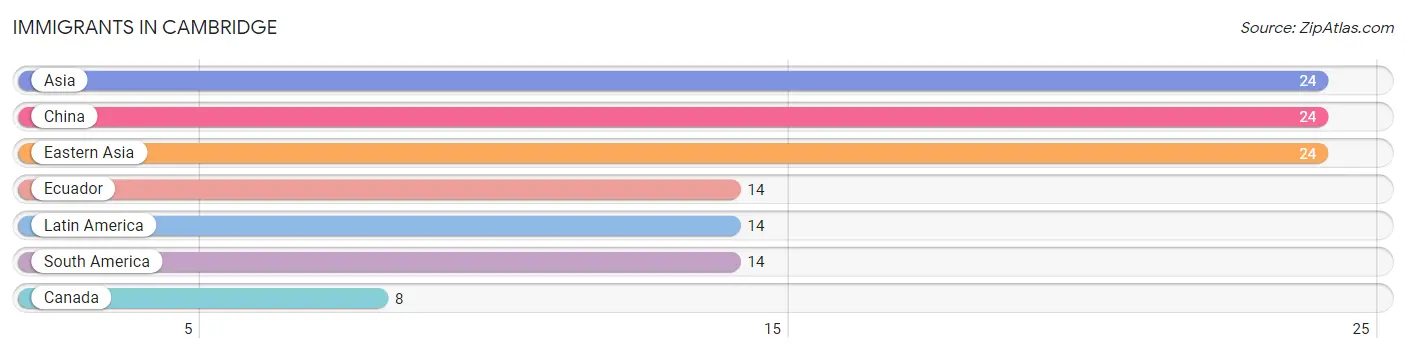
The most numerous immigrant groups reported in Cambridge came from Asia (24 | 0.2%), China (24 | 0.2%), Eastern Asia (24 | 0.2%), Ecuador (14 | 0.1%), and Latin America (14 | 0.1%), together accounting for 1.0% of all Cambridge residents.
| Immigration Origin | # Population | % Population |
| Asia | 24 | 0.2% |
| Canada | 8 | 0.1% |
| China | 24 | 0.2% |
| Eastern Asia | 24 | 0.2% |
| Ecuador | 14 | 0.1% |
| Latin America | 14 | 0.1% |
| South America | 14 | 0.1% | View All 7 Rows |
Sex and Age in Cambridge
Sex and Age in Cambridge
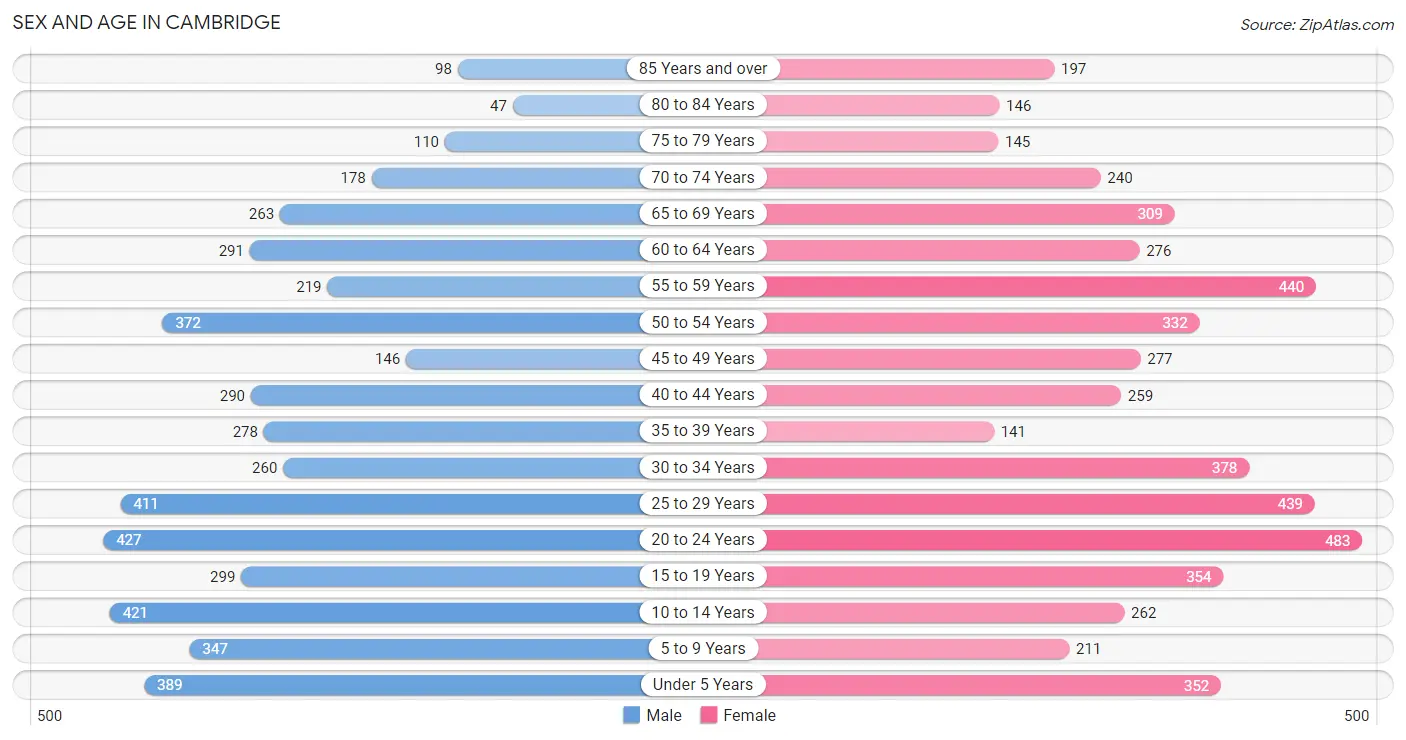
The most populous age groups in Cambridge are 20 to 24 Years (427 | 8.8%) for men and 20 to 24 Years (483 | 9.2%) for women.
| Age Bracket | Male | Female |
| Under 5 Years | 389 (8.0%) | 352 (6.7%) |
| 5 to 9 Years | 347 (7.2%) | 211 (4.0%) |
| 10 to 14 Years | 421 (8.7%) | 262 (5.0%) |
| 15 to 19 Years | 299 (6.2%) | 354 (6.8%) |
| 20 to 24 Years | 427 (8.8%) | 483 (9.2%) |
| 25 to 29 Years | 411 (8.5%) | 439 (8.4%) |
| 30 to 34 Years | 260 (5.4%) | 378 (7.2%) |
| 35 to 39 Years | 278 (5.7%) | 141 (2.7%) |
| 40 to 44 Years | 290 (6.0%) | 259 (4.9%) |
| 45 to 49 Years | 146 (3.0%) | 277 (5.3%) |
| 50 to 54 Years | 372 (7.7%) | 332 (6.3%) |
| 55 to 59 Years | 219 (4.5%) | 440 (8.4%) |
| 60 to 64 Years | 291 (6.0%) | 276 (5.3%) |
| 65 to 69 Years | 263 (5.4%) | 309 (5.9%) |
| 70 to 74 Years | 178 (3.7%) | 240 (4.6%) |
| 75 to 79 Years | 110 (2.3%) | 145 (2.8%) |
| 80 to 84 Years | 47 (1.0%) | 146 (2.8%) |
| 85 Years and over | 98 (2.0%) | 197 (3.8%) |
| Total | 4,846 (100.0%) | 5,241 (100.0%) |
Families and Households in Cambridge
Median Family Size in Cambridge
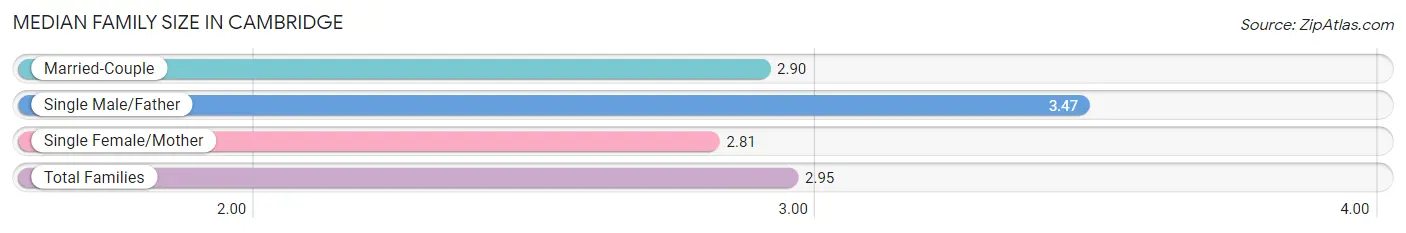
The median family size in Cambridge is 2.95 persons per family, with single male/father families (318 | 13.8%) accounting for the largest median family size of 3.47 persons per family. On the other hand, single female/mother families (719 | 31.1%) represent the smallest median family size with 2.81 persons per family.
| Family Type | # Families | Family Size |
| Married-Couple | 1,272 (55.1%) | 2.90 |
| Single Male/Father | 318 (13.8%) | 3.47 |
| Single Female/Mother | 719 (31.1%) | 2.81 |
| Total Families | 2,309 (100.0%) | 2.95 |
Median Household Size in Cambridge
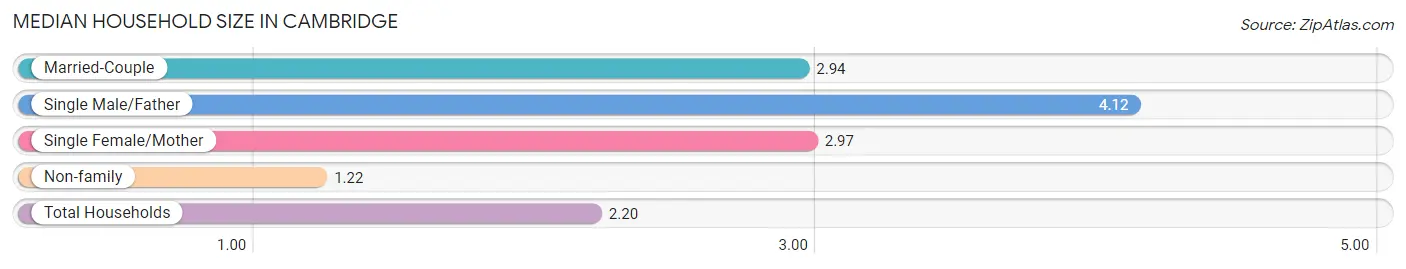
The median household size in Cambridge is 2.20 persons per household, with single male/father households (318 | 7.1%) accounting for the largest median household size of 4.12 persons per household. non-family households (2,156 | 48.3%) represent the smallest median household size with 1.22 persons per household.
| Household Type | # Households | Household Size |
| Married-Couple | 1,272 (28.5%) | 2.94 |
| Single Male/Father | 318 (7.1%) | 4.12 |
| Single Female/Mother | 719 (16.1%) | 2.97 |
| Non-family | 2,156 (48.3%) | 1.22 |
| Total Households | 4,465 (100.0%) | 2.20 |
Household Size by Marriage Status in Cambridge
Out of a total of 4,465 households in Cambridge, 2,309 (51.7%) are family households, while 2,156 (48.3%) are nonfamily households. The most numerous type of family households are 2-person households, comprising 960, and the most common type of nonfamily households are 1-person households, comprising 1,825.
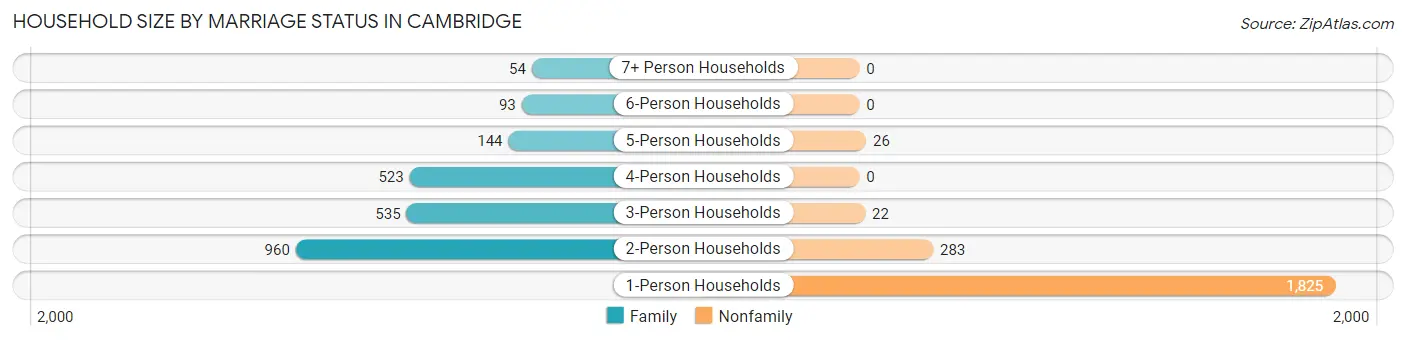
| Household Size | Family Households | Nonfamily Households |
| 1-Person Households | - | 1,825 (40.9%) |
| 2-Person Households | 960 (21.5%) | 283 (6.3%) |
| 3-Person Households | 535 (12.0%) | 22 (0.5%) |
| 4-Person Households | 523 (11.7%) | 0 (0.0%) |
| 5-Person Households | 144 (3.2%) | 26 (0.6%) |
| 6-Person Households | 93 (2.1%) | 0 (0.0%) |
| 7+ Person Households | 54 (1.2%) | 0 (0.0%) |
| Total | 2,309 (51.7%) | 2,156 (48.3%) |
Female Fertility in Cambridge
Fertility by Age in Cambridge
Average fertility rate in Cambridge is 79.0 births per 1,000 women. Women in the age bracket of 20 to 34 years have the highest fertility rate with 143.0 births per 1,000 women. Women in the age bracket of 20 to 34 years acount for 97.9% of all women with births.
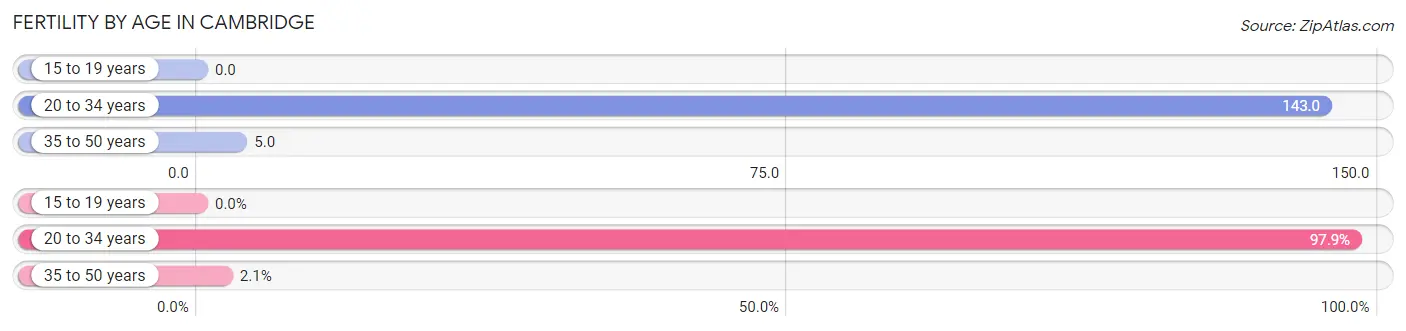
| Age Bracket | Women with Births | Births / 1,000 Women |
| 15 to 19 years | 0 (0.0%) | 0.0 |
| 20 to 34 years | 186 (97.9%) | 143.0 |
| 35 to 50 years | 4 (2.1%) | 5.0 |
| Total | 190 (100.0%) | 79.0 |
Fertility by Age by Marriage Status in Cambridge
22.1% of women with births (190) in Cambridge are married. The highest percentage of unmarried women with births falls into 20 to 34 years age bracket with 79.6% of them unmarried at the time of birth, while the lowest percentage of unmarried women with births belong to 35 to 50 years age bracket with 0.0% of them unmarried.
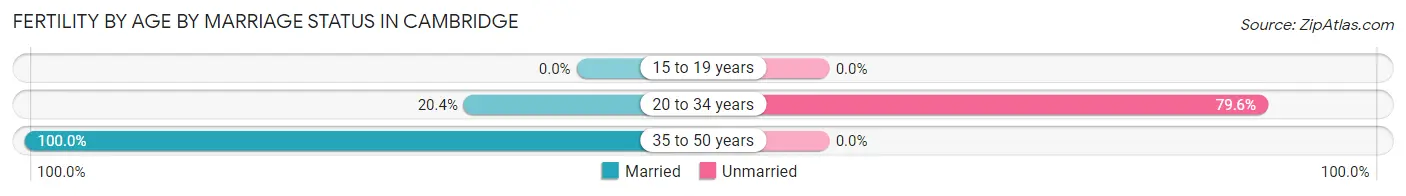
| Age Bracket | Married | Unmarried |
| 15 to 19 years | 0 (0.0%) | 0 (0.0%) |
| 20 to 34 years | 38 (20.4%) | 148 (79.6%) |
| 35 to 50 years | 4 (100.0%) | 0 (0.0%) |
| Total | 42 (22.1%) | 148 (77.9%) |
Fertility by Education in Cambridge
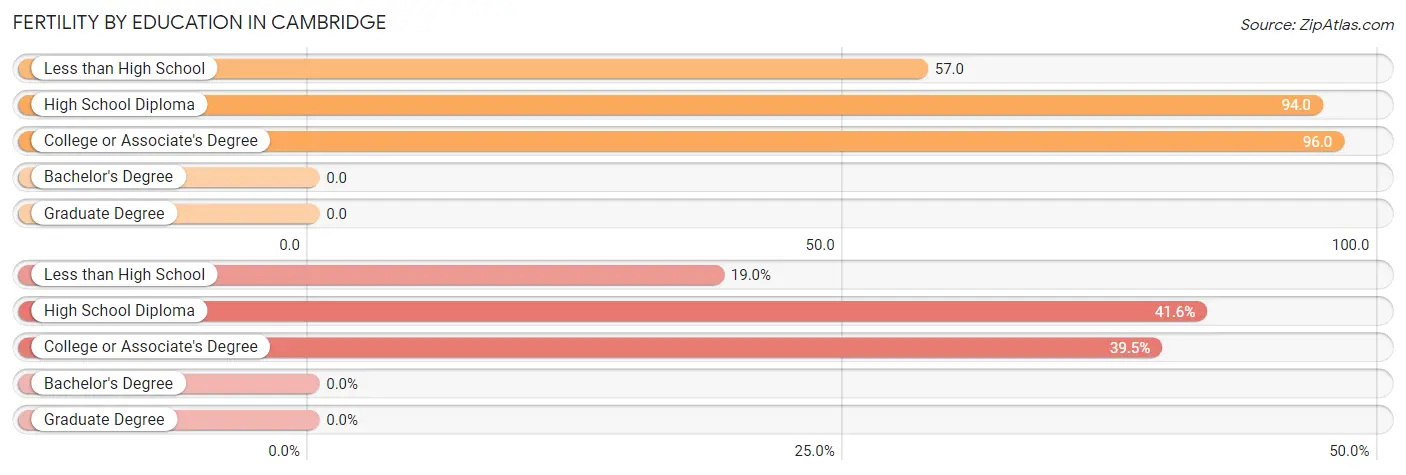
| Educational Attainment | Women with Births | Births / 1,000 Women |
| Less than High School | 36 (19.0%) | 57.0 |
| High School Diploma | 79 (41.6%) | 94.0 |
| College or Associate's Degree | 75 (39.5%) | 96.0 |
| Bachelor's Degree | 0 (0.0%) | 0.0 |
| Graduate Degree | 0 (0.0%) | 0.0 |
| Total | 190 (100.0%) | 79.0 |
Fertility by Education by Marriage Status in Cambridge
77.9% of women with births in Cambridge are unmarried. Women with the educational attainment of high school diploma are most likely to be married with 48.1% of them married at childbirth, while women with the educational attainment of less than high school are least likely to be married with 100.0% of them unmarried at childbirth.
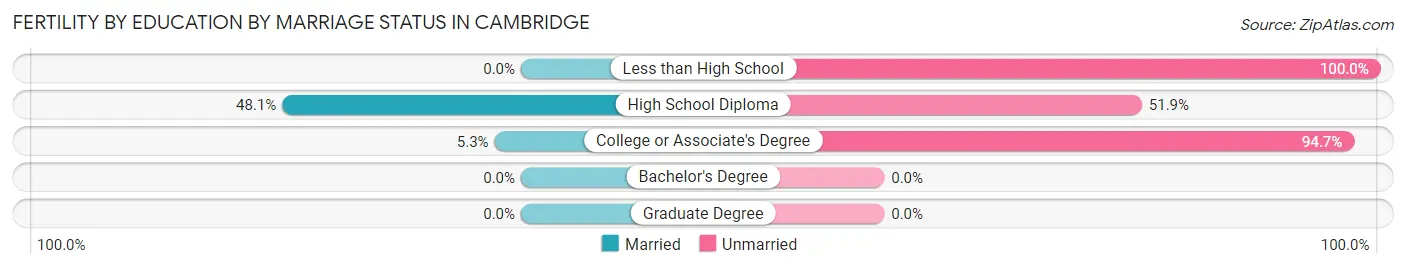
| Educational Attainment | Married | Unmarried |
| Less than High School | 0 (0.0%) | 36 (100.0%) |
| High School Diploma | 38 (48.1%) | 41 (51.9%) |
| College or Associate's Degree | 4 (5.3%) | 71 (94.7%) |
| Bachelor's Degree | 0 (0.0%) | 0 (0.0%) |
| Graduate Degree | 0 (0.0%) | 0 (0.0%) |
| Total | 42 (22.1%) | 148 (77.9%) |
Employment Characteristics in Cambridge
Employment by Class of Employer in Cambridge
Among the 4,450 employed individuals in Cambridge, private company employees (3,099 | 69.6%), local government employees (355 | 8.0%), and not-for-profit organizations (321 | 7.2%) make up the most common classes of employment.
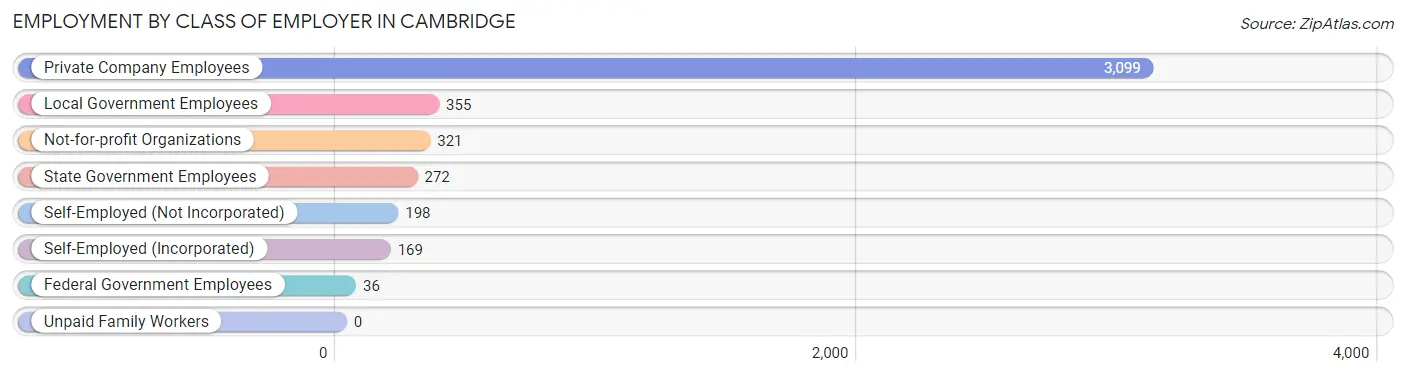
| Employer Class | # Employees | % Employees |
| Private Company Employees | 3,099 | 69.6% |
| Self-Employed (Incorporated) | 169 | 3.8% |
| Self-Employed (Not Incorporated) | 198 | 4.4% |
| Not-for-profit Organizations | 321 | 7.2% |
| Local Government Employees | 355 | 8.0% |
| State Government Employees | 272 | 6.1% |
| Federal Government Employees | 36 | 0.8% |
| Unpaid Family Workers | 0 | 0.0% |
| Total | 4,450 | 100.0% |
Employment Status by Age in Cambridge
According to the labor force statistics for Cambridge, out of the total population over 16 years of age (7,956), 58.0% or 4,614 individuals are in the labor force, with 2.6% or 120 of them unemployed. The age group with the highest labor force participation rate is 25 to 29 years, with 81.9% or 696 individuals in the labor force. Within the labor force, the 60 to 64 years age range has the highest percentage of unemployed individuals, with 6.8% or 21 of them being unemployed.
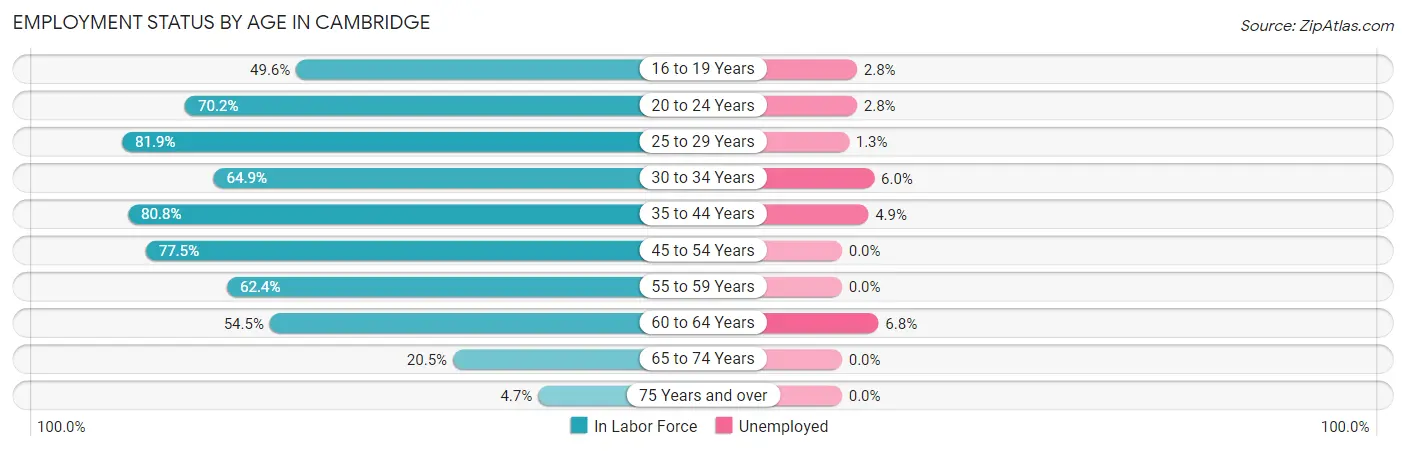
| Age Bracket | In Labor Force | Unemployed |
| 16 to 19 Years | 250 (49.6%) | 7 (2.8%) |
| 20 to 24 Years | 639 (70.2%) | 18 (2.8%) |
| 25 to 29 Years | 696 (81.9%) | 9 (1.3%) |
| 30 to 34 Years | 414 (64.9%) | 25 (6.0%) |
| 35 to 44 Years | 782 (80.8%) | 38 (4.9%) |
| 45 to 54 Years | 873 (77.5%) | 0 (0.0%) |
| 55 to 59 Years | 411 (62.4%) | 0 (0.0%) |
| 60 to 64 Years | 309 (54.5%) | 21 (6.8%) |
| 65 to 74 Years | 203 (20.5%) | 0 (0.0%) |
| 75 Years and over | 35 (4.7%) | 0 (0.0%) |
| Total | 4,614 (58.0%) | 120 (2.6%) |
Employment Status by Educational Attainment in Cambridge
According to labor force statistics for Cambridge, 72.5% of individuals (3,487) out of the total population between 25 and 64 years of age (4,809) are in the labor force, with 2.7% or 94 of them being unemployed. The group with the highest labor force participation rate are those with the educational attainment of bachelor's degree or higher, with 84.8% or 496 individuals in the labor force. Within the labor force, individuals with college / associate degree education have the highest percentage of unemployment, with 3.5% or 38 of them being unemployed.
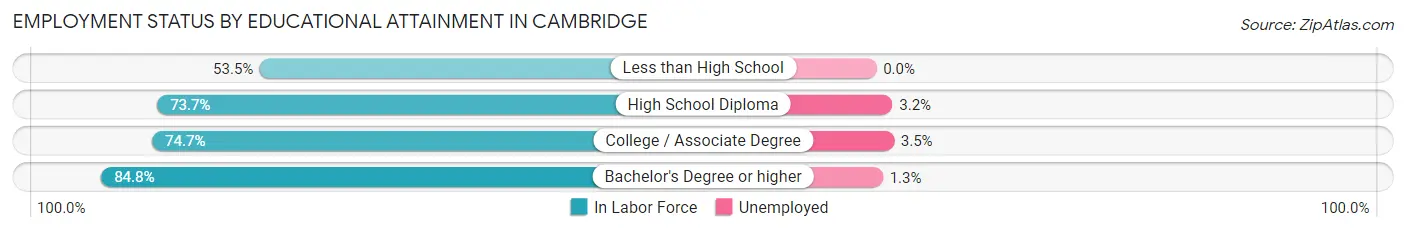
| Educational Attainment | In Labor Force | Unemployed |
| Less than High School | 363 (53.5%) | 0 (0.0%) |
| High School Diploma | 1,554 (73.7%) | 67 (3.2%) |
| College / Associate Degree | 1,073 (74.7%) | 50 (3.5%) |
| Bachelor's Degree or higher | 496 (84.8%) | 8 (1.3%) |
| Total | 3,487 (72.5%) | 130 (2.7%) |
Employment Occupations by Sex in Cambridge
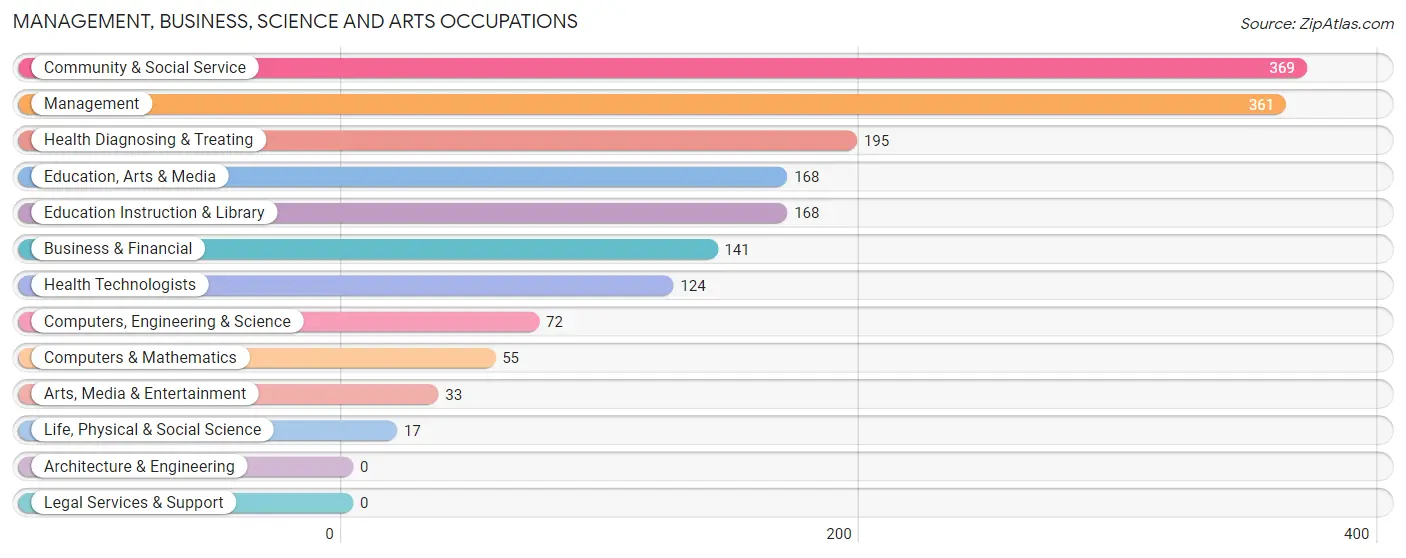
Management, Business, Science and Arts Occupations
The most common Management, Business, Science and Arts occupations in Cambridge are Community & Social Service (369 | 8.3%), Management (361 | 8.1%), Health Diagnosing & Treating (195 | 4.4%), Education, Arts & Media (168 | 3.8%), and Education Instruction & Library (168 | 3.8%).
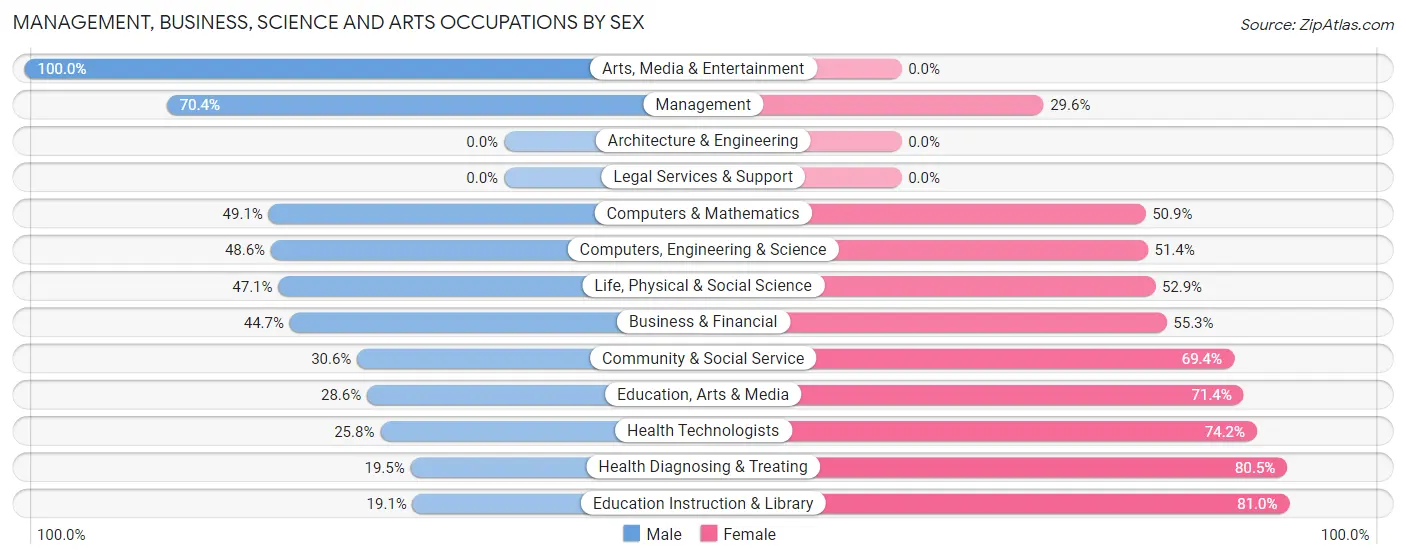
Management, Business, Science and Arts Occupations by Sex
Within the Management, Business, Science and Arts occupations in Cambridge, the most male-oriented occupations are Arts, Media & Entertainment (100.0%), Management (70.4%), and Computers & Mathematics (49.1%), while the most female-oriented occupations are Education Instruction & Library (80.9%), Health Diagnosing & Treating (80.5%), and Health Technologists (74.2%).
| Occupation | Male | Female |
| Management | 254 (70.4%) | 107 (29.6%) |
| Business & Financial | 63 (44.7%) | 78 (55.3%) |
| Computers, Engineering & Science | 35 (48.6%) | 37 (51.4%) |
| Computers & Mathematics | 27 (49.1%) | 28 (50.9%) |
| Architecture & Engineering | 0 (0.0%) | 0 (0.0%) |
| Life, Physical & Social Science | 8 (47.1%) | 9 (52.9%) |
| Community & Social Service | 113 (30.6%) | 256 (69.4%) |
| Education, Arts & Media | 48 (28.6%) | 120 (71.4%) |
| Legal Services & Support | 0 (0.0%) | 0 (0.0%) |
| Education Instruction & Library | 32 (19.1%) | 136 (80.9%) |
| Arts, Media & Entertainment | 33 (100.0%) | 0 (0.0%) |
| Health Diagnosing & Treating | 38 (19.5%) | 157 (80.5%) |
| Health Technologists | 32 (25.8%) | 92 (74.2%) |
| Total (Category) | 503 (44.2%) | 635 (55.8%) |
| Total (Overall) | 2,295 (51.3%) | 2,174 (48.6%) |
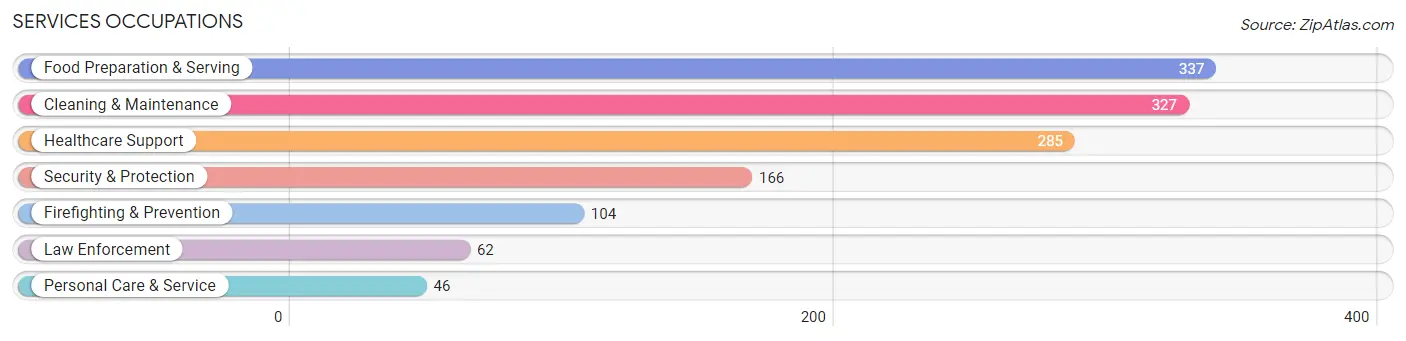
Services Occupations
The most common Services occupations in Cambridge are Food Preparation & Serving (337 | 7.5%), Cleaning & Maintenance (327 | 7.3%), Healthcare Support (285 | 6.4%), Security & Protection (166 | 3.7%), and Firefighting & Prevention (104 | 2.3%).
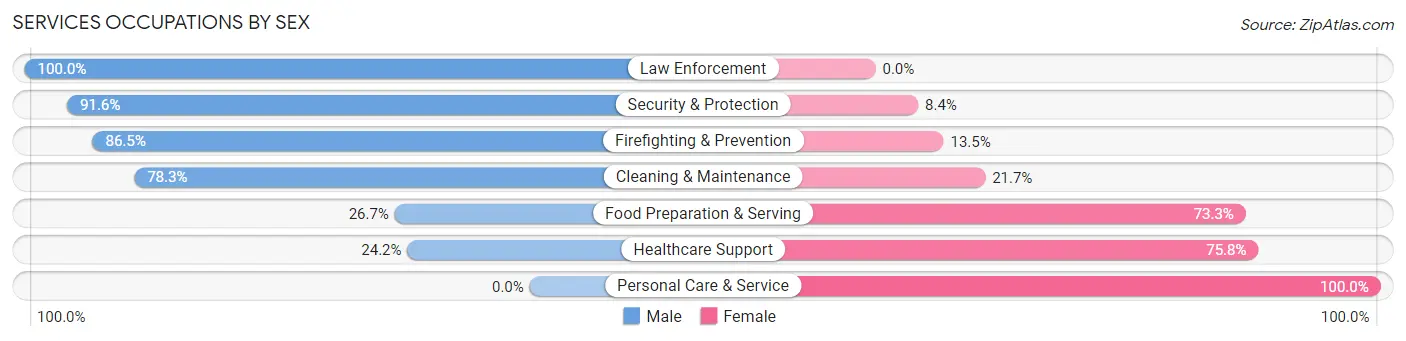
Services Occupations by Sex
Within the Services occupations in Cambridge, the most male-oriented occupations are Law Enforcement (100.0%), Security & Protection (91.6%), and Firefighting & Prevention (86.5%), while the most female-oriented occupations are Personal Care & Service (100.0%), Healthcare Support (75.8%), and Food Preparation & Serving (73.3%).
| Occupation | Male | Female |
| Healthcare Support | 69 (24.2%) | 216 (75.8%) |
| Security & Protection | 152 (91.6%) | 14 (8.4%) |
| Firefighting & Prevention | 90 (86.5%) | 14 (13.5%) |
| Law Enforcement | 62 (100.0%) | 0 (0.0%) |
| Food Preparation & Serving | 90 (26.7%) | 247 (73.3%) |
| Cleaning & Maintenance | 256 (78.3%) | 71 (21.7%) |
| Personal Care & Service | 0 (0.0%) | 46 (100.0%) |
| Total (Category) | 567 (48.8%) | 594 (51.2%) |
| Total (Overall) | 2,295 (51.3%) | 2,174 (48.6%) |
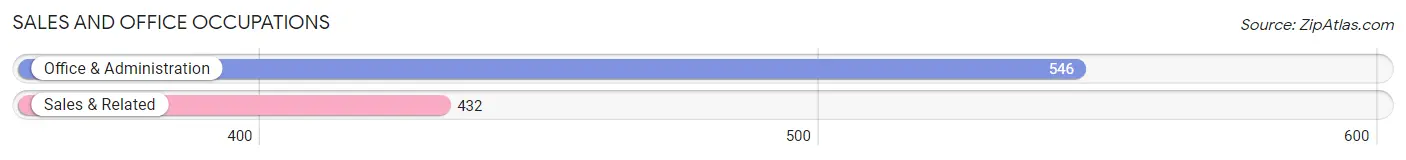
Sales and Office Occupations
The most common Sales and Office occupations in Cambridge are Office & Administration (546 | 12.2%), and Sales & Related (432 | 9.7%).
Sales and Office Occupations by Sex
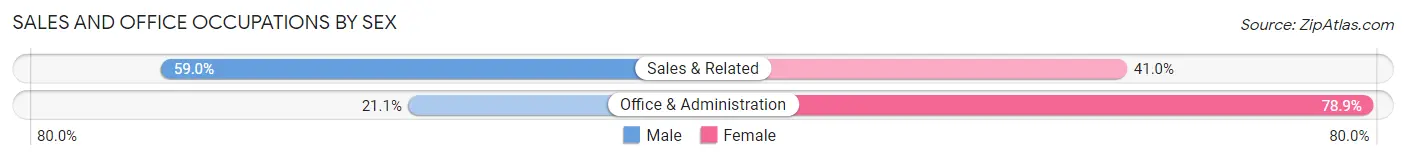
| Occupation | Male | Female |
| Sales & Related | 255 (59.0%) | 177 (41.0%) |
| Office & Administration | 115 (21.1%) | 431 (78.9%) |
| Total (Category) | 370 (37.8%) | 608 (62.2%) |
| Total (Overall) | 2,295 (51.3%) | 2,174 (48.6%) |
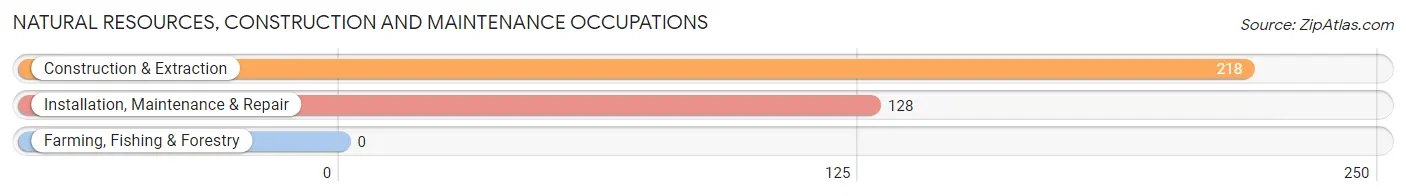
Natural Resources, Construction and Maintenance Occupations
The most common Natural Resources, Construction and Maintenance occupations in Cambridge are Construction & Extraction (218 | 4.9%), and Installation, Maintenance & Repair (128 | 2.9%).
Natural Resources, Construction and Maintenance Occupations by Sex
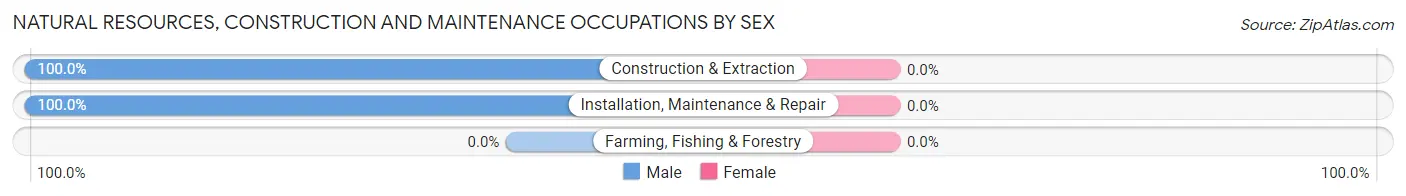
| Occupation | Male | Female |
| Farming, Fishing & Forestry | 0 (0.0%) | 0 (0.0%) |
| Construction & Extraction | 218 (100.0%) | 0 (0.0%) |
| Installation, Maintenance & Repair | 128 (100.0%) | 0 (0.0%) |
| Total (Category) | 346 (100.0%) | 0 (0.0%) |
| Total (Overall) | 2,295 (51.3%) | 2,174 (48.6%) |
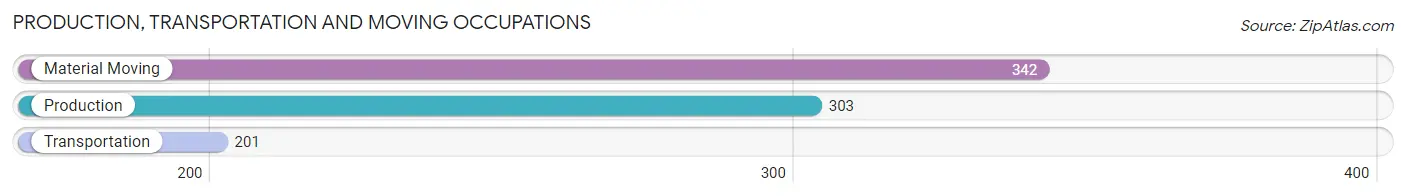
Production, Transportation and Moving Occupations
The most common Production, Transportation and Moving occupations in Cambridge are Material Moving (342 | 7.6%), Production (303 | 6.8%), and Transportation (201 | 4.5%).
Production, Transportation and Moving Occupations by Sex
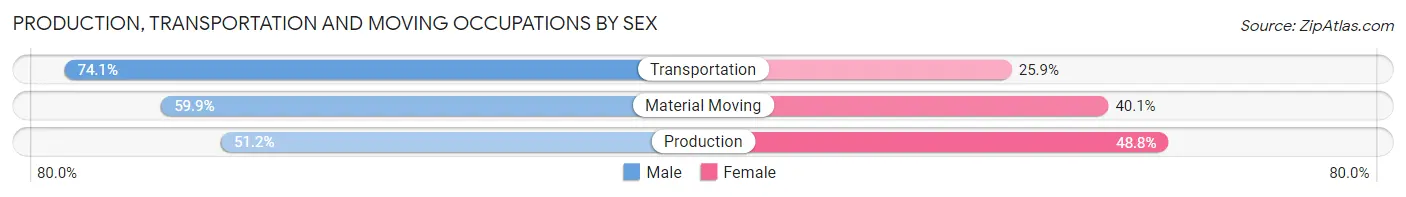
| Occupation | Male | Female |
| Production | 155 (51.2%) | 148 (48.8%) |
| Transportation | 149 (74.1%) | 52 (25.9%) |
| Material Moving | 205 (59.9%) | 137 (40.1%) |
| Total (Category) | 509 (60.2%) | 337 (39.8%) |
| Total (Overall) | 2,295 (51.3%) | 2,174 (48.6%) |
Employment Industries by Sex in Cambridge
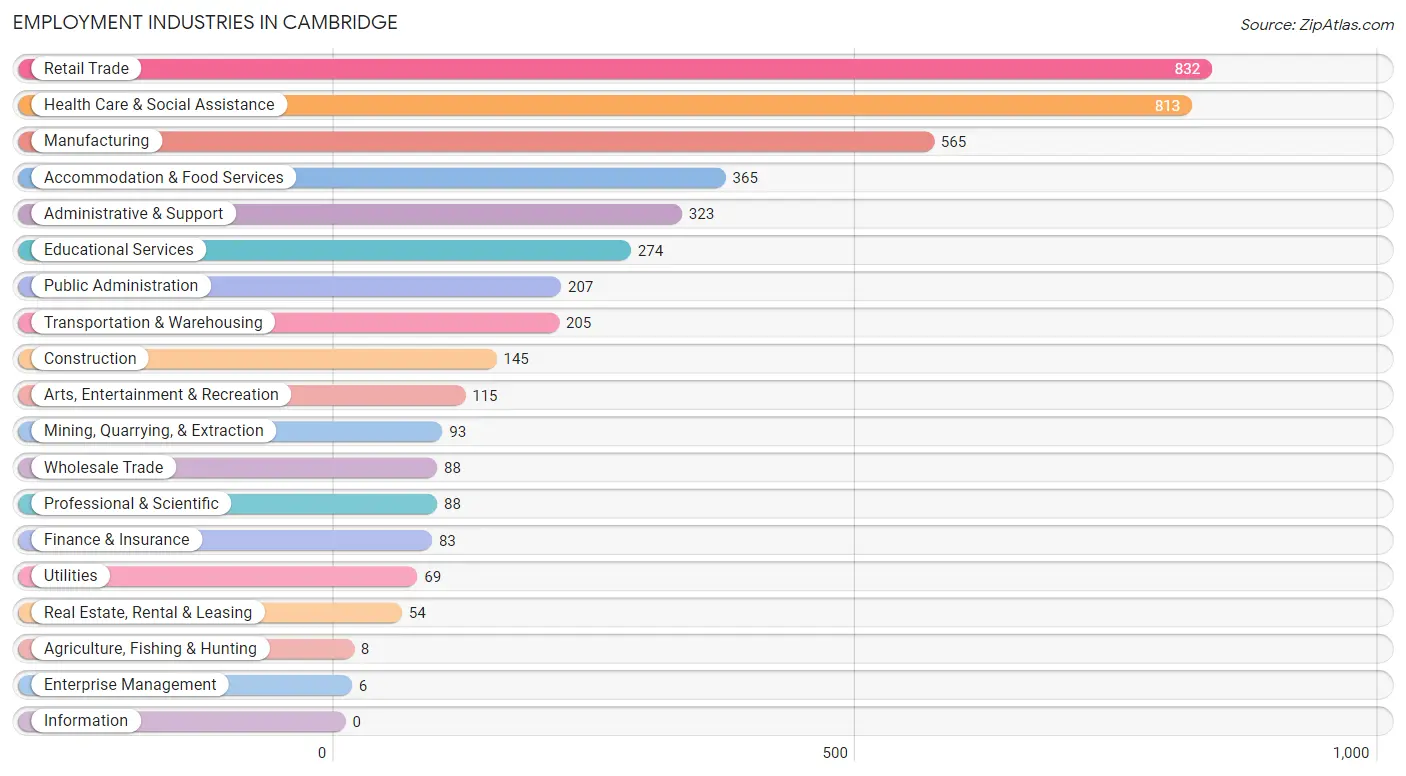
Employment Industries in Cambridge
The major employment industries in Cambridge include Retail Trade (832 | 18.6%), Health Care & Social Assistance (813 | 18.2%), Manufacturing (565 | 12.6%), Accommodation & Food Services (365 | 8.2%), and Administrative & Support (323 | 7.2%).
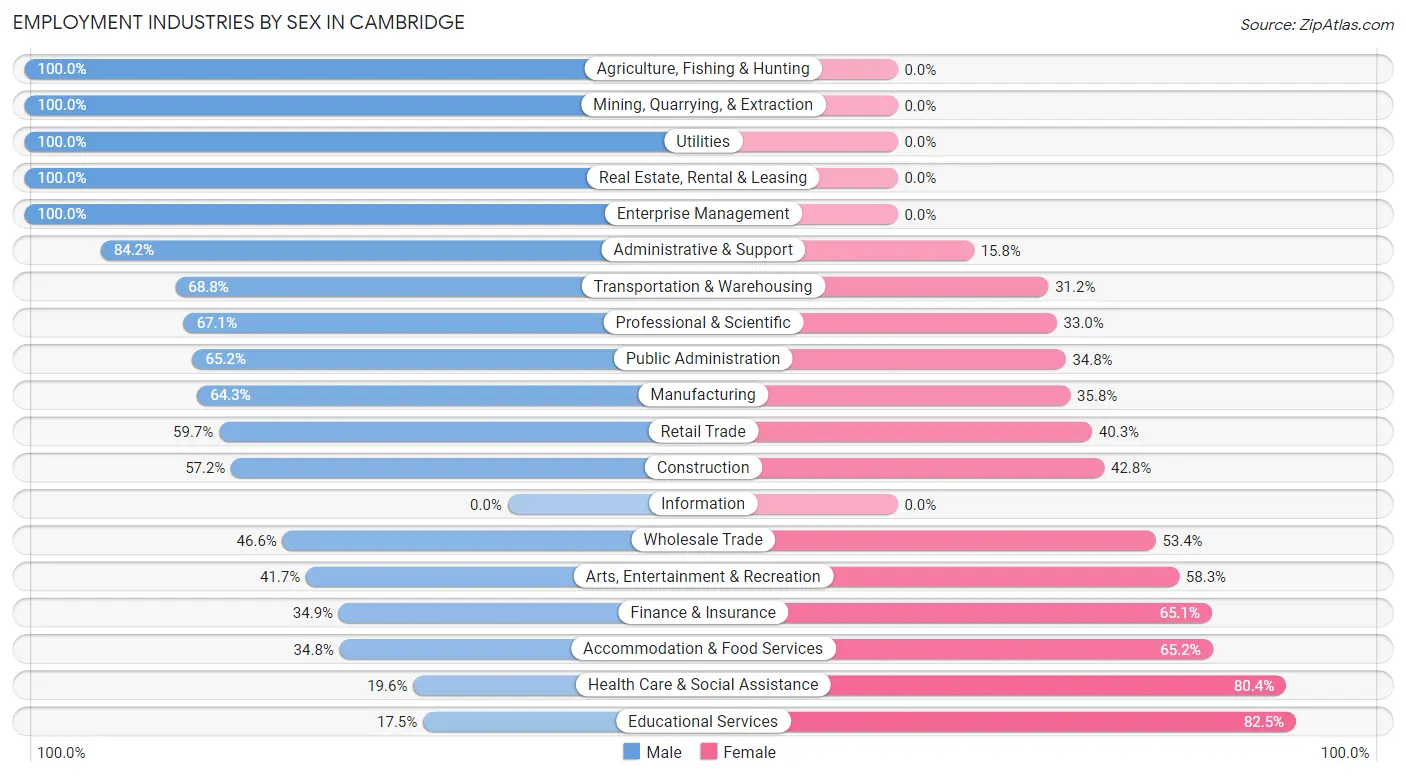
Employment Industries by Sex in Cambridge
The Cambridge industries that see more men than women are Agriculture, Fishing & Hunting (100.0%), Mining, Quarrying, & Extraction (100.0%), and Utilities (100.0%), whereas the industries that tend to have a higher number of women are Educational Services (82.5%), Health Care & Social Assistance (80.4%), and Accommodation & Food Services (65.2%).
| Industry | Male | Female |
| Agriculture, Fishing & Hunting | 8 (100.0%) | 0 (0.0%) |
| Mining, Quarrying, & Extraction | 93 (100.0%) | 0 (0.0%) |
| Construction | 83 (57.2%) | 62 (42.8%) |
| Manufacturing | 363 (64.2%) | 202 (35.7%) |
| Wholesale Trade | 41 (46.6%) | 47 (53.4%) |
| Retail Trade | 497 (59.7%) | 335 (40.3%) |
| Transportation & Warehousing | 141 (68.8%) | 64 (31.2%) |
| Utilities | 69 (100.0%) | 0 (0.0%) |
| Information | 0 (0.0%) | 0 (0.0%) |
| Finance & Insurance | 29 (34.9%) | 54 (65.1%) |
| Real Estate, Rental & Leasing | 54 (100.0%) | 0 (0.0%) |
| Professional & Scientific | 59 (67.0%) | 29 (33.0%) |
| Enterprise Management | 6 (100.0%) | 0 (0.0%) |
| Administrative & Support | 272 (84.2%) | 51 (15.8%) |
| Educational Services | 48 (17.5%) | 226 (82.5%) |
| Health Care & Social Assistance | 159 (19.6%) | 654 (80.4%) |
| Arts, Entertainment & Recreation | 48 (41.7%) | 67 (58.3%) |
| Accommodation & Food Services | 127 (34.8%) | 238 (65.2%) |
| Public Administration | 135 (65.2%) | 72 (34.8%) |
| Total | 2,295 (51.3%) | 2,174 (48.6%) |
Education in Cambridge
School Enrollment in Cambridge
The most common levels of schooling among the 1,971 students in Cambridge are middle school (546 | 27.7%), elementary school (491 | 24.9%), and high school (475 | 24.1%).
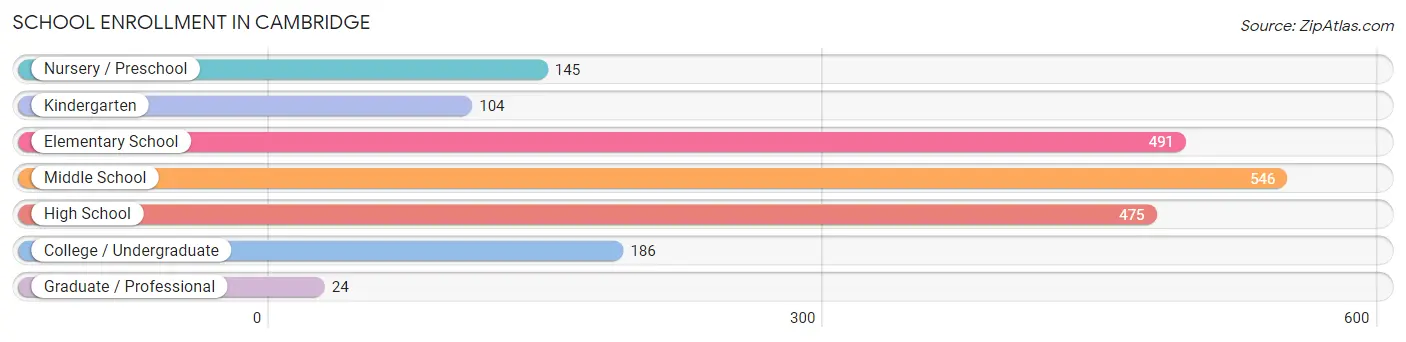
| School Level | # Students | % Students |
| Nursery / Preschool | 145 | 7.4% |
| Kindergarten | 104 | 5.3% |
| Elementary School | 491 | 24.9% |
| Middle School | 546 | 27.7% |
| High School | 475 | 24.1% |
| College / Undergraduate | 186 | 9.4% |
| Graduate / Professional | 24 | 1.2% |
| Total | 1,971 | 100.0% |
School Enrollment by Age by Funding Source in Cambridge
Out of a total of 1,971 students who are enrolled in schools in Cambridge, 162 (8.2%) attend a private institution, while the remaining 1,809 (91.8%) are enrolled in public schools. The age group of 20 to 24 year olds has the highest likelihood of being enrolled in private schools, with 49 (50.0% in the age bracket) enrolled. Conversely, the age group of 3 to 4 year olds has the lowest likelihood of being enrolled in a private school, with 115 (100.0% in the age bracket) attending a public institution.
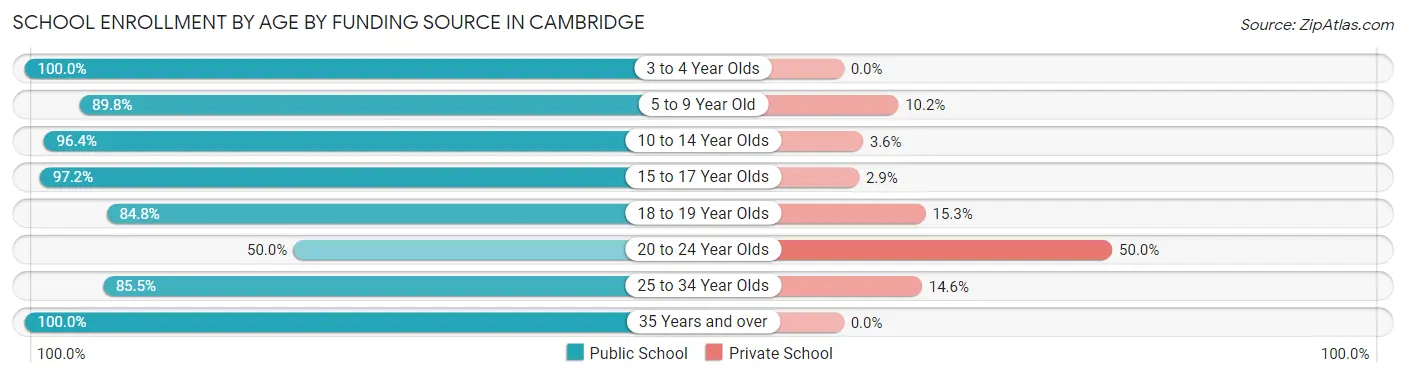
| Age Bracket | Public School | Private School |
| 3 to 4 Year Olds | 115 (100.0%) | 0 (0.0%) |
| 5 to 9 Year Old | 460 (89.8%) | 52 (10.2%) |
| 10 to 14 Year Olds | 651 (96.4%) | 24 (3.6%) |
| 15 to 17 Year Olds | 375 (97.2%) | 11 (2.9%) |
| 18 to 19 Year Olds | 100 (84.8%) | 18 (15.2%) |
| 20 to 24 Year Olds | 49 (50.0%) | 49 (50.0%) |
| 25 to 34 Year Olds | 47 (85.5%) | 8 (14.5%) |
| 35 Years and over | 12 (100.0%) | 0 (0.0%) |
| Total | 1,809 (91.8%) | 162 (8.2%) |
Educational Attainment by Field of Study in Cambridge
Education (301 | 31.2%), liberal arts & history (87 | 9.0%), social sciences (80 | 8.3%), business (77 | 8.0%), and science & technology (75 | 7.8%) are the most common fields of study among 965 individuals in Cambridge who have obtained a bachelor's degree or higher.
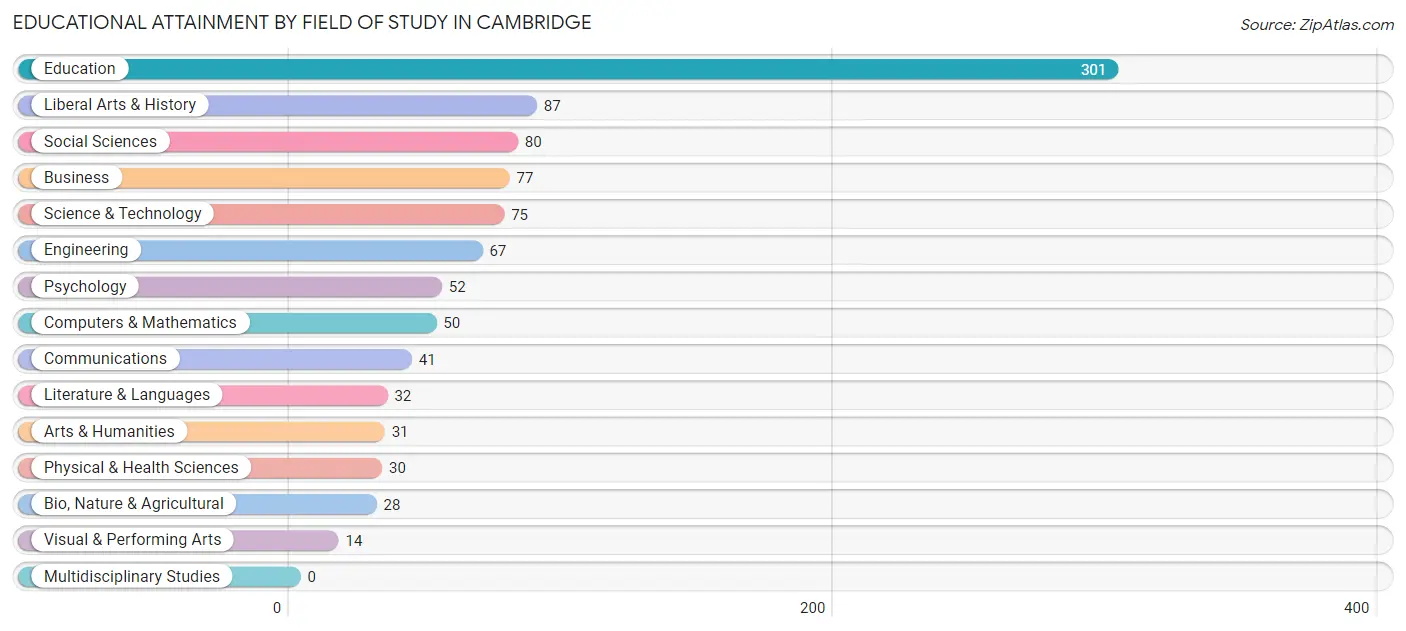
| Field of Study | # Graduates | % Graduates |
| Computers & Mathematics | 50 | 5.2% |
| Bio, Nature & Agricultural | 28 | 2.9% |
| Physical & Health Sciences | 30 | 3.1% |
| Psychology | 52 | 5.4% |
| Social Sciences | 80 | 8.3% |
| Engineering | 67 | 6.9% |
| Multidisciplinary Studies | 0 | 0.0% |
| Science & Technology | 75 | 7.8% |
| Business | 77 | 8.0% |
| Education | 301 | 31.2% |
| Literature & Languages | 32 | 3.3% |
| Liberal Arts & History | 87 | 9.0% |
| Visual & Performing Arts | 14 | 1.5% |
| Communications | 41 | 4.3% |
| Arts & Humanities | 31 | 3.2% |
| Total | 965 | 100.0% |
Transportation & Commute in Cambridge
Vehicle Availability by Sex in Cambridge
The most prevalent vehicle ownership categories in Cambridge are males with 2 vehicles (934, accounting for 40.6%) and females with 2 vehicles (929, making up 43.9%).
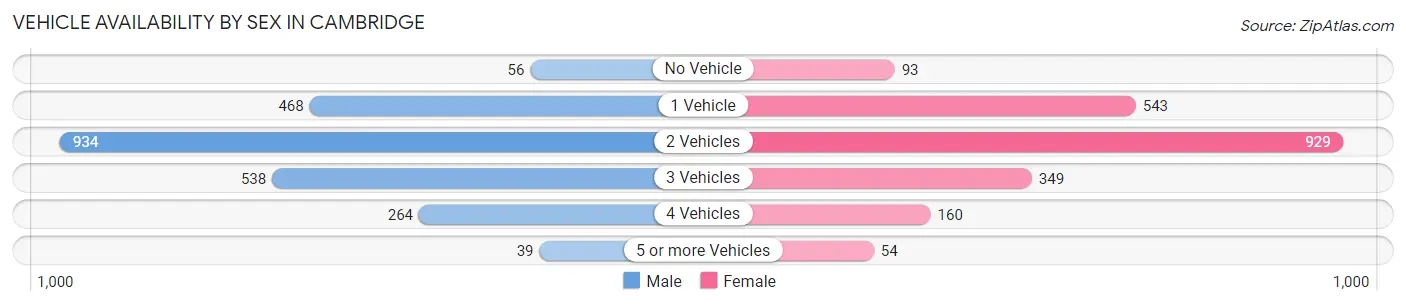
| Vehicles Available | Male | Female |
| No Vehicle | 56 (2.4%) | 93 (4.4%) |
| 1 Vehicle | 468 (20.4%) | 543 (25.5%) |
| 2 Vehicles | 934 (40.6%) | 929 (43.7%) |
| 3 Vehicles | 538 (23.4%) | 349 (16.4%) |
| 4 Vehicles | 264 (11.5%) | 160 (7.5%) |
| 5 or more Vehicles | 39 (1.7%) | 54 (2.5%) |
| Total | 2,299 (100.0%) | 2,128 (100.0%) |
Commute Time in Cambridge
The most frequently occuring commute durations in Cambridge are 5 to 9 minutes (1,155 commuters, 26.4%), 10 to 14 minutes (1,139 commuters, 26.1%), and 15 to 19 minutes (476 commuters, 10.9%).
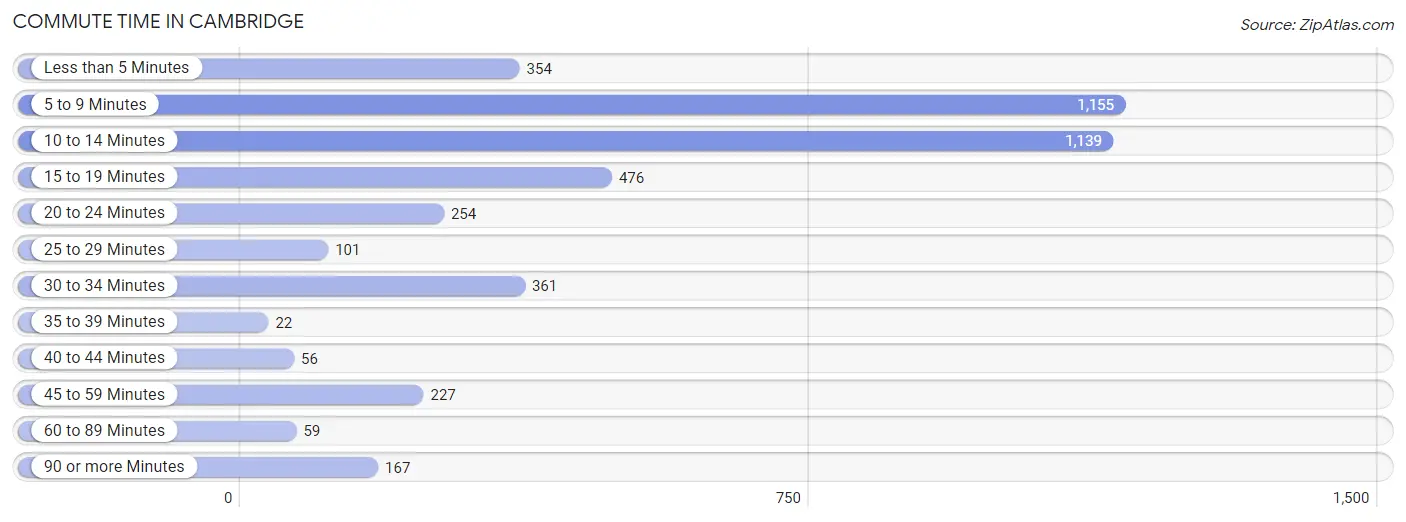
| Commute Time | # Commuters | % Commuters |
| Less than 5 Minutes | 354 | 8.1% |
| 5 to 9 Minutes | 1,155 | 26.4% |
| 10 to 14 Minutes | 1,139 | 26.1% |
| 15 to 19 Minutes | 476 | 10.9% |
| 20 to 24 Minutes | 254 | 5.8% |
| 25 to 29 Minutes | 101 | 2.3% |
| 30 to 34 Minutes | 361 | 8.3% |
| 35 to 39 Minutes | 22 | 0.5% |
| 40 to 44 Minutes | 56 | 1.3% |
| 45 to 59 Minutes | 227 | 5.2% |
| 60 to 89 Minutes | 59 | 1.3% |
| 90 or more Minutes | 167 | 3.8% |
Commute Time by Sex in Cambridge
The most common commute times in Cambridge are 5 to 9 minutes (612 commuters, 26.6%) for males and 10 to 14 minutes (545 commuters, 26.3%) for females.
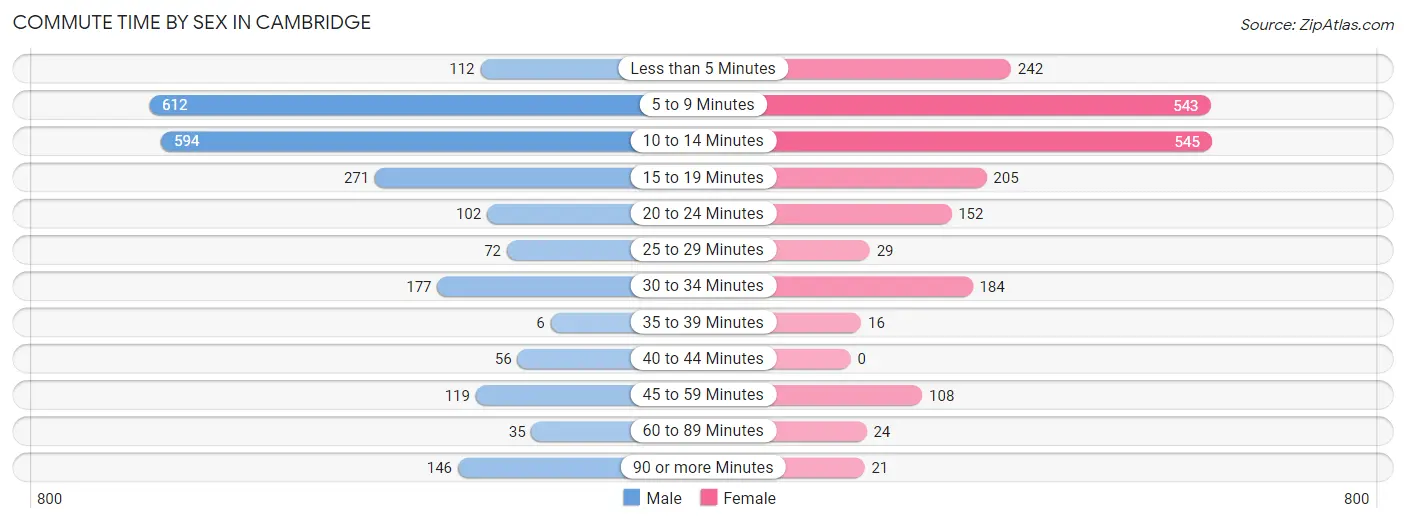
| Commute Time | Male | Female |
| Less than 5 Minutes | 112 (4.9%) | 242 (11.7%) |
| 5 to 9 Minutes | 612 (26.6%) | 543 (26.2%) |
| 10 to 14 Minutes | 594 (25.8%) | 545 (26.3%) |
| 15 to 19 Minutes | 271 (11.8%) | 205 (9.9%) |
| 20 to 24 Minutes | 102 (4.4%) | 152 (7.3%) |
| 25 to 29 Minutes | 72 (3.1%) | 29 (1.4%) |
| 30 to 34 Minutes | 177 (7.7%) | 184 (8.9%) |
| 35 to 39 Minutes | 6 (0.3%) | 16 (0.8%) |
| 40 to 44 Minutes | 56 (2.4%) | 0 (0.0%) |
| 45 to 59 Minutes | 119 (5.2%) | 108 (5.2%) |
| 60 to 89 Minutes | 35 (1.5%) | 24 (1.2%) |
| 90 or more Minutes | 146 (6.3%) | 21 (1.0%) |
Time of Departure to Work by Sex in Cambridge
The most frequent times of departure to work in Cambridge are 7:30 AM to 7:59 AM (371, 16.1%) for males and 7:00 AM to 7:29 AM (365, 17.6%) for females.
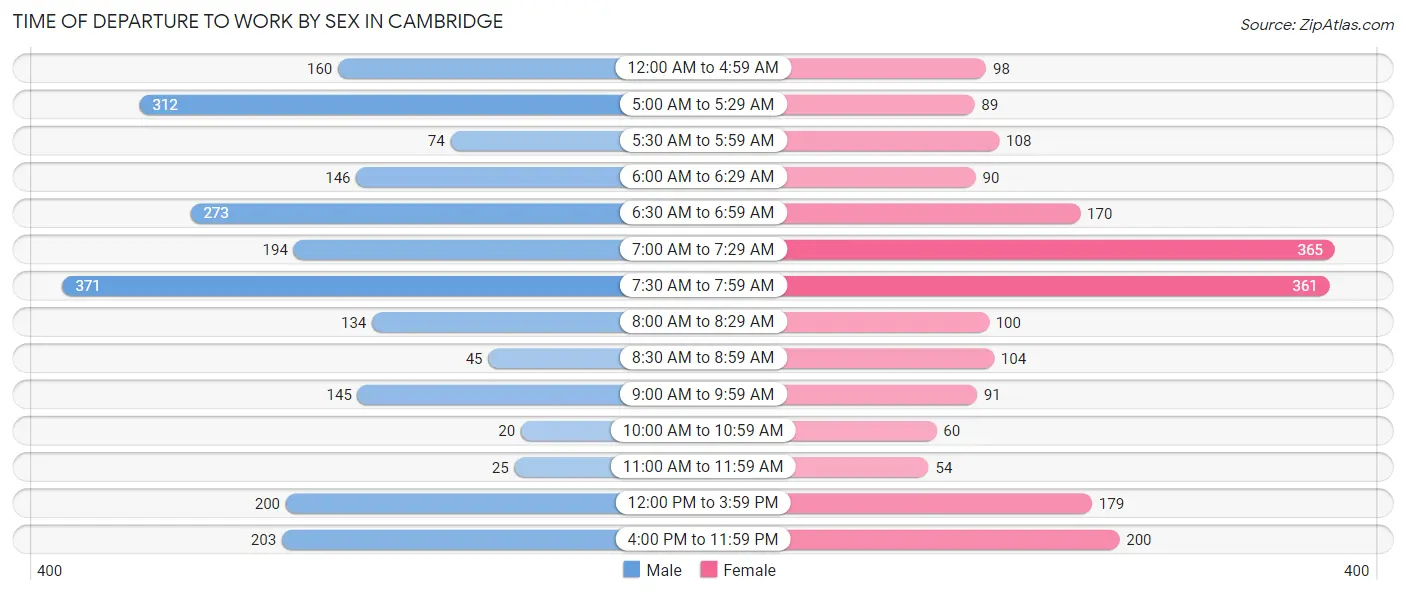
| Time of Departure | Male | Female |
| 12:00 AM to 4:59 AM | 160 (7.0%) | 98 (4.7%) |
| 5:00 AM to 5:29 AM | 312 (13.6%) | 89 (4.3%) |
| 5:30 AM to 5:59 AM | 74 (3.2%) | 108 (5.2%) |
| 6:00 AM to 6:29 AM | 146 (6.3%) | 90 (4.3%) |
| 6:30 AM to 6:59 AM | 273 (11.9%) | 170 (8.2%) |
| 7:00 AM to 7:29 AM | 194 (8.4%) | 365 (17.6%) |
| 7:30 AM to 7:59 AM | 371 (16.1%) | 361 (17.4%) |
| 8:00 AM to 8:29 AM | 134 (5.8%) | 100 (4.8%) |
| 8:30 AM to 8:59 AM | 45 (1.9%) | 104 (5.0%) |
| 9:00 AM to 9:59 AM | 145 (6.3%) | 91 (4.4%) |
| 10:00 AM to 10:59 AM | 20 (0.9%) | 60 (2.9%) |
| 11:00 AM to 11:59 AM | 25 (1.1%) | 54 (2.6%) |
| 12:00 PM to 3:59 PM | 200 (8.7%) | 179 (8.6%) |
| 4:00 PM to 11:59 PM | 203 (8.8%) | 200 (9.7%) |
| Total | 2,302 (100.0%) | 2,069 (100.0%) |
Housing Occupancy in Cambridge
Occupancy by Ownership in Cambridge
Of the total 4,465 dwellings in Cambridge, owner-occupied units account for 2,137 (47.9%), while renter-occupied units make up 2,328 (52.1%).
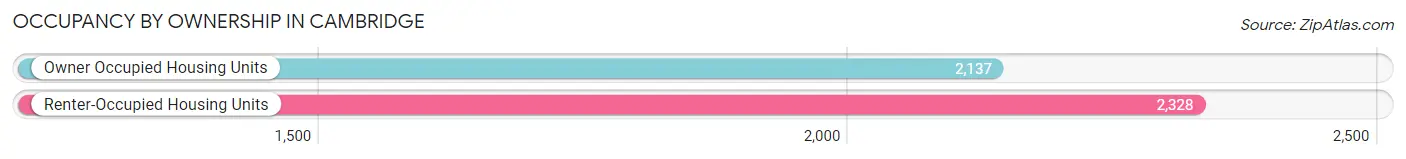
| Occupancy | # Housing Units | % Housing Units |
| Owner Occupied Housing Units | 2,137 | 47.9% |
| Renter-Occupied Housing Units | 2,328 | 52.1% |
| Total Occupied Housing Units | 4,465 | 100.0% |
Occupancy by Household Size in Cambridge

| Household Size | # Housing Units | % Housing Units |
| 1-Person Household | 1,825 | 40.9% |
| 2-Person Household | 1,243 | 27.8% |
| 3-Person Household | 557 | 12.5% |
| 4+ Person Household | 840 | 18.8% |
| Total Housing Units | 4,465 | 100.0% |
Occupancy by Ownership by Household Size in Cambridge
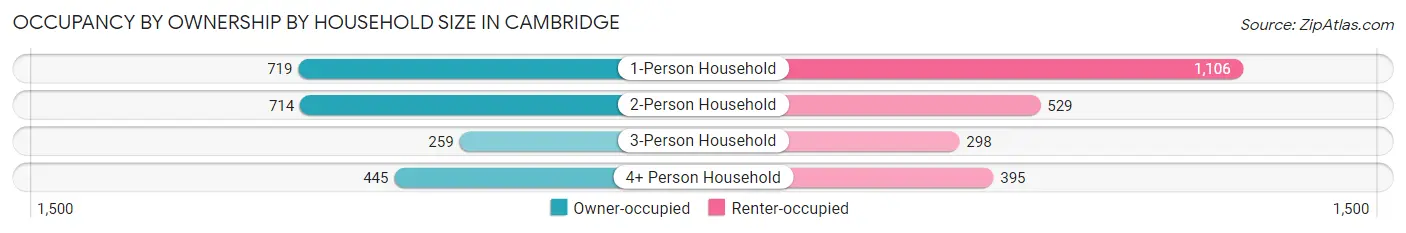
| Household Size | Owner-occupied | Renter-occupied |
| 1-Person Household | 719 (39.4%) | 1,106 (60.6%) |
| 2-Person Household | 714 (57.4%) | 529 (42.6%) |
| 3-Person Household | 259 (46.5%) | 298 (53.5%) |
| 4+ Person Household | 445 (53.0%) | 395 (47.0%) |
| Total Housing Units | 2,137 (47.9%) | 2,328 (52.1%) |
Occupancy by Educational Attainment in Cambridge
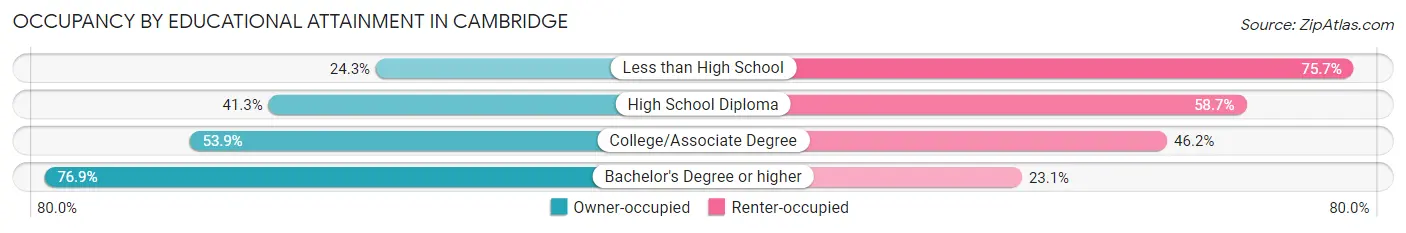
| Household Size | Owner-occupied | Renter-occupied |
| Less than High School | 151 (24.3%) | 471 (75.7%) |
| High School Diploma | 770 (41.3%) | 1,094 (58.7%) |
| College/Associate Degree | 714 (53.8%) | 612 (46.2%) |
| Bachelor's Degree or higher | 502 (76.9%) | 151 (23.1%) |
Occupancy by Age of Householder in Cambridge
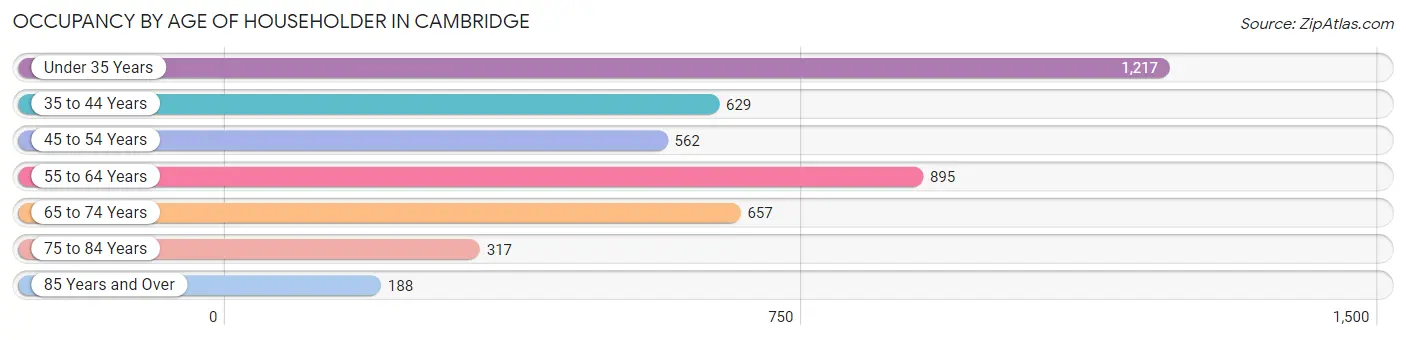
| Age Bracket | # Households | % Households |
| Under 35 Years | 1,217 | 27.3% |
| 35 to 44 Years | 629 | 14.1% |
| 45 to 54 Years | 562 | 12.6% |
| 55 to 64 Years | 895 | 20.0% |
| 65 to 74 Years | 657 | 14.7% |
| 75 to 84 Years | 317 | 7.1% |
| 85 Years and Over | 188 | 4.2% |
| Total | 4,465 | 100.0% |
Housing Finances in Cambridge
Median Income by Occupancy in Cambridge
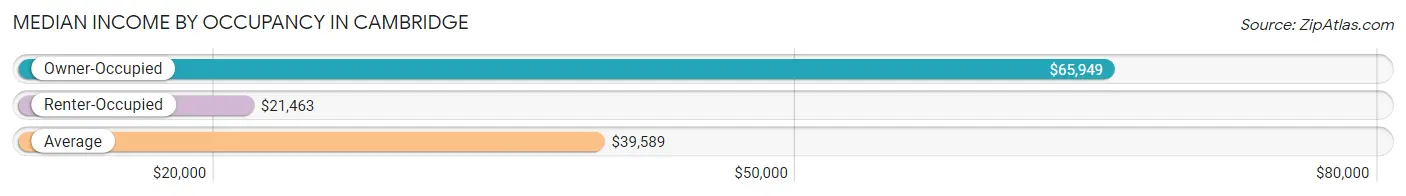
| Occupancy Type | # Households | Median Income |
| Owner-Occupied | 2,137 (47.9%) | $65,949 |
| Renter-Occupied | 2,328 (52.1%) | $21,463 |
| Average | 4,465 (100.0%) | $39,589 |
Occupancy by Householder Income Bracket in Cambridge
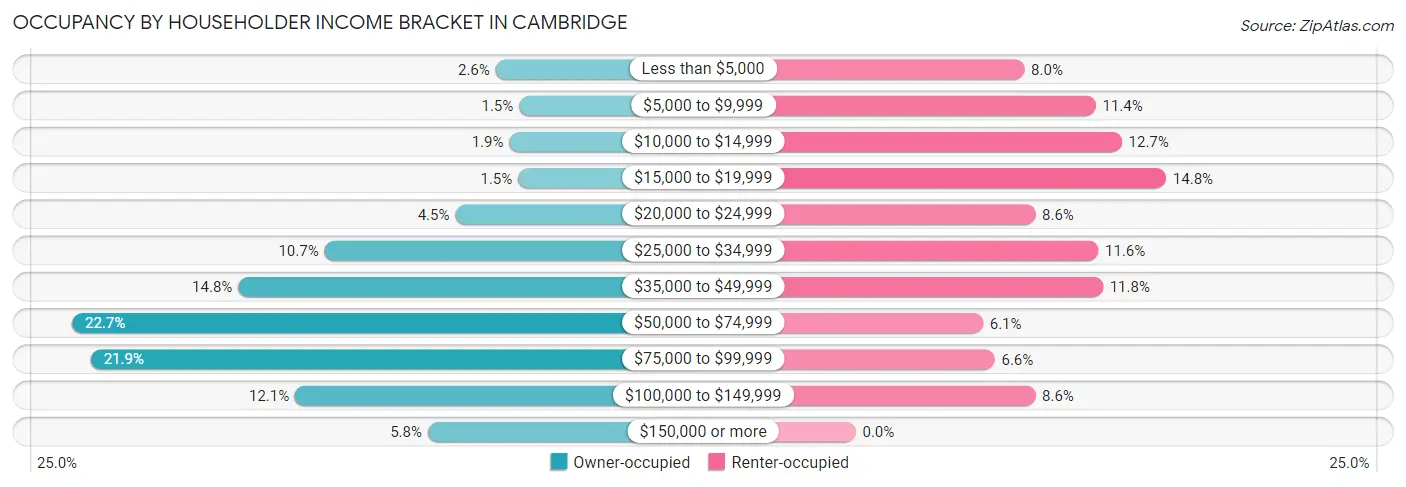
| Income Bracket | Owner-occupied | Renter-occupied |
| Less than $5,000 | 55 (2.6%) | 187 (8.0%) |
| $5,000 to $9,999 | 31 (1.5%) | 266 (11.4%) |
| $10,000 to $14,999 | 41 (1.9%) | 295 (12.7%) |
| $15,000 to $19,999 | 32 (1.5%) | 344 (14.8%) |
| $20,000 to $24,999 | 96 (4.5%) | 199 (8.6%) |
| $25,000 to $34,999 | 229 (10.7%) | 269 (11.6%) |
| $35,000 to $49,999 | 317 (14.8%) | 274 (11.8%) |
| $50,000 to $74,999 | 486 (22.7%) | 141 (6.1%) |
| $75,000 to $99,999 | 467 (21.8%) | 154 (6.6%) |
| $100,000 to $149,999 | 259 (12.1%) | 199 (8.6%) |
| $150,000 or more | 124 (5.8%) | 0 (0.0%) |
| Total | 2,137 (100.0%) | 2,328 (100.0%) |
Monthly Housing Cost Tiers in Cambridge
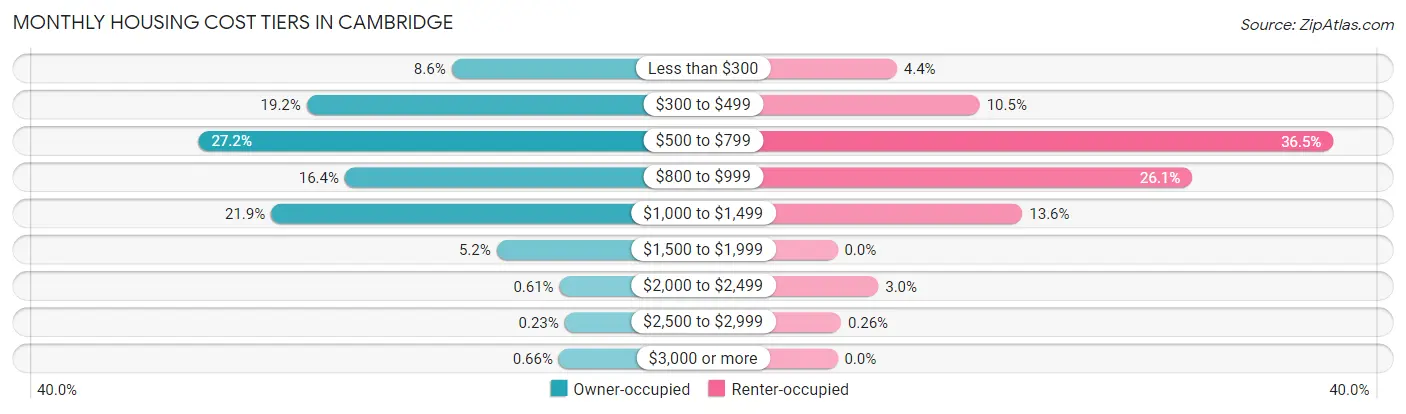
| Monthly Cost | Owner-occupied | Renter-occupied |
| Less than $300 | 183 (8.6%) | 102 (4.4%) |
| $300 to $499 | 411 (19.2%) | 244 (10.5%) |
| $500 to $799 | 581 (27.2%) | 850 (36.5%) |
| $800 to $999 | 351 (16.4%) | 608 (26.1%) |
| $1,000 to $1,499 | 467 (21.8%) | 317 (13.6%) |
| $1,500 to $1,999 | 112 (5.2%) | 0 (0.0%) |
| $2,000 to $2,499 | 13 (0.6%) | 70 (3.0%) |
| $2,500 to $2,999 | 5 (0.2%) | 6 (0.3%) |
| $3,000 or more | 14 (0.7%) | 0 (0.0%) |
| Total | 2,137 (100.0%) | 2,328 (100.0%) |
Physical Housing Characteristics in Cambridge
Housing Structures in Cambridge
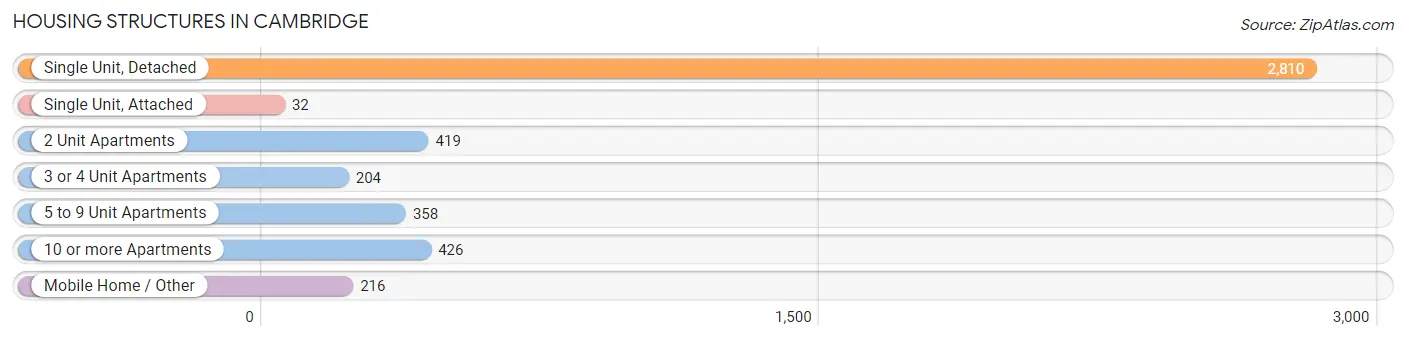
| Structure Type | # Housing Units | % Housing Units |
| Single Unit, Detached | 2,810 | 62.9% |
| Single Unit, Attached | 32 | 0.7% |
| 2 Unit Apartments | 419 | 9.4% |
| 3 or 4 Unit Apartments | 204 | 4.6% |
| 5 to 9 Unit Apartments | 358 | 8.0% |
| 10 or more Apartments | 426 | 9.5% |
| Mobile Home / Other | 216 | 4.8% |
| Total | 4,465 | 100.0% |
Housing Structures by Occupancy in Cambridge
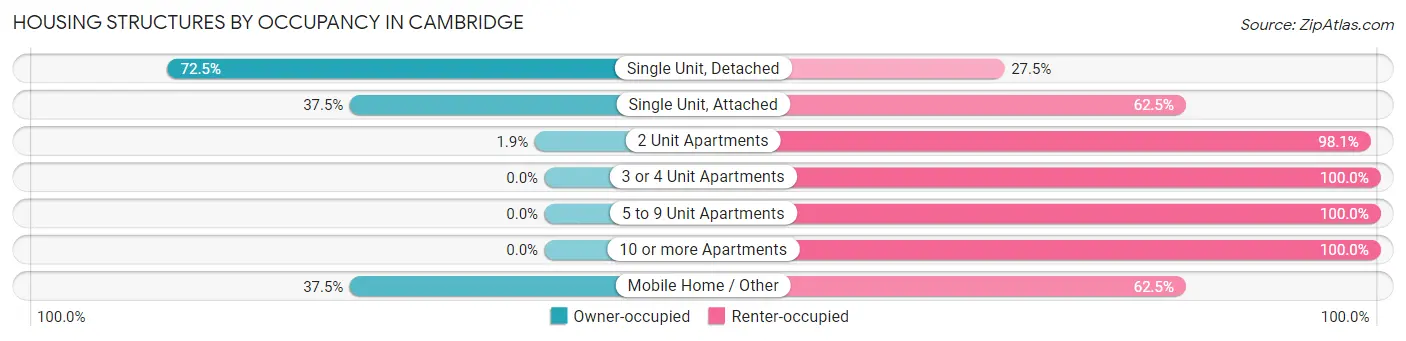
| Structure Type | Owner-occupied | Renter-occupied |
| Single Unit, Detached | 2,036 (72.5%) | 774 (27.5%) |
| Single Unit, Attached | 12 (37.5%) | 20 (62.5%) |
| 2 Unit Apartments | 8 (1.9%) | 411 (98.1%) |
| 3 or 4 Unit Apartments | 0 (0.0%) | 204 (100.0%) |
| 5 to 9 Unit Apartments | 0 (0.0%) | 358 (100.0%) |
| 10 or more Apartments | 0 (0.0%) | 426 (100.0%) |
| Mobile Home / Other | 81 (37.5%) | 135 (62.5%) |
| Total | 2,137 (47.9%) | 2,328 (52.1%) |
Housing Structures by Number of Rooms in Cambridge
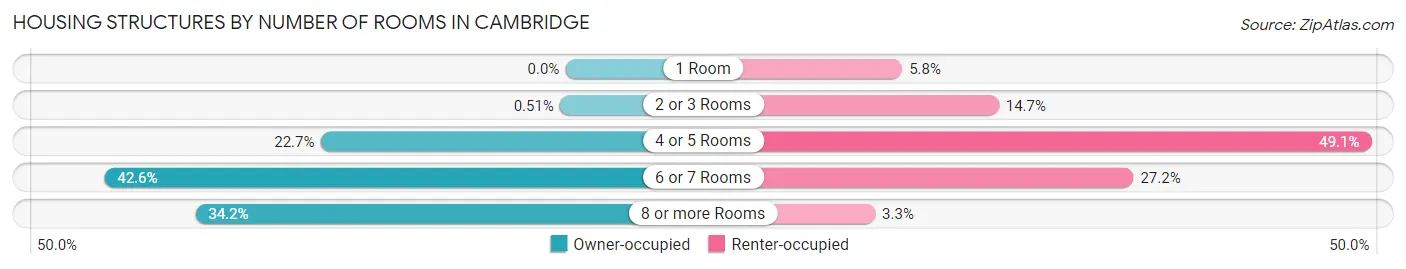
| Number of Rooms | Owner-occupied | Renter-occupied |
| 1 Room | 0 (0.0%) | 134 (5.8%) |
| 2 or 3 Rooms | 11 (0.5%) | 342 (14.7%) |
| 4 or 5 Rooms | 484 (22.7%) | 1,144 (49.1%) |
| 6 or 7 Rooms | 911 (42.6%) | 632 (27.2%) |
| 8 or more Rooms | 731 (34.2%) | 76 (3.3%) |
| Total | 2,137 (100.0%) | 2,328 (100.0%) |
Housing Structure by Heating Type in Cambridge
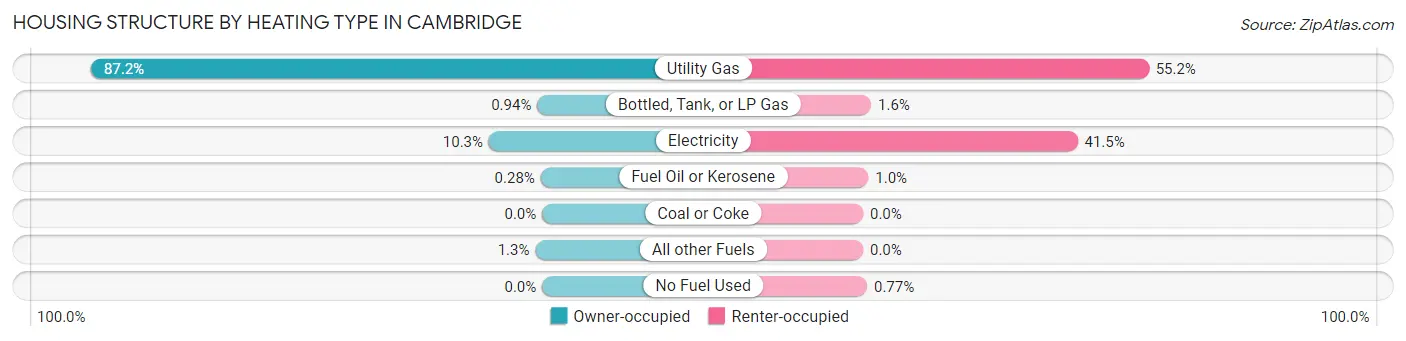
| Heating Type | Owner-occupied | Renter-occupied |
| Utility Gas | 1,863 (87.2%) | 1,285 (55.2%) |
| Bottled, Tank, or LP Gas | 20 (0.9%) | 36 (1.5%) |
| Electricity | 220 (10.3%) | 965 (41.4%) |
| Fuel Oil or Kerosene | 6 (0.3%) | 24 (1.0%) |
| Coal or Coke | 0 (0.0%) | 0 (0.0%) |
| All other Fuels | 28 (1.3%) | 0 (0.0%) |
| No Fuel Used | 0 (0.0%) | 18 (0.8%) |
| Total | 2,137 (100.0%) | 2,328 (100.0%) |
Household Vehicle Usage in Cambridge
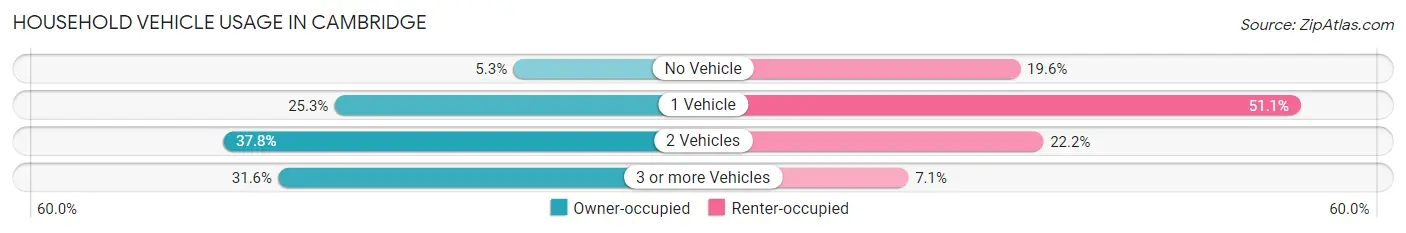
| Vehicles per Household | Owner-occupied | Renter-occupied |
| No Vehicle | 113 (5.3%) | 457 (19.6%) |
| 1 Vehicle | 541 (25.3%) | 1,189 (51.1%) |
| 2 Vehicles | 807 (37.8%) | 517 (22.2%) |
| 3 or more Vehicles | 676 (31.6%) | 165 (7.1%) |
| Total | 2,137 (100.0%) | 2,328 (100.0%) |
Real Estate & Mortgages in Cambridge
Real Estate and Mortgage Overview in Cambridge
| Characteristic | Without Mortgage | With Mortgage |
| Housing Units | 895 | 1,242 |
| Median Property Value | $105,300 | $108,500 |
| Median Household Income | $56,563 | $109 |
| Monthly Housing Costs | $442 | $14 |
| Real Estate Taxes | $1,129 | $52 |
Property Value by Mortgage Status in Cambridge
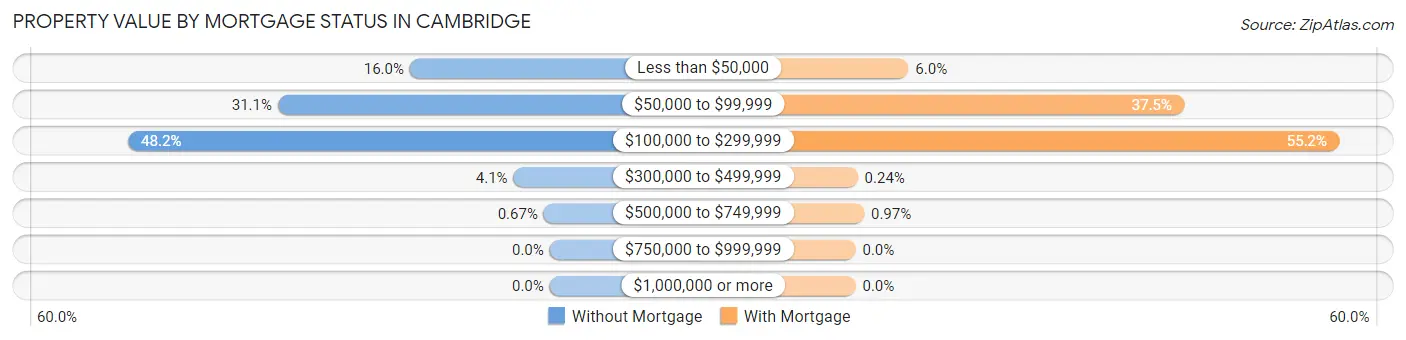
| Property Value | Without Mortgage | With Mortgage |
| Less than $50,000 | 143 (16.0%) | 75 (6.0%) |
| $50,000 to $99,999 | 278 (31.1%) | 466 (37.5%) |
| $100,000 to $299,999 | 431 (48.2%) | 686 (55.2%) |
| $300,000 to $499,999 | 37 (4.1%) | 3 (0.2%) |
| $500,000 to $749,999 | 6 (0.7%) | 12 (1.0%) |
| $750,000 to $999,999 | 0 (0.0%) | 0 (0.0%) |
| $1,000,000 or more | 0 (0.0%) | 0 (0.0%) |
| Total | 895 (100.0%) | 1,242 (100.0%) |
Household Income by Mortgage Status in Cambridge
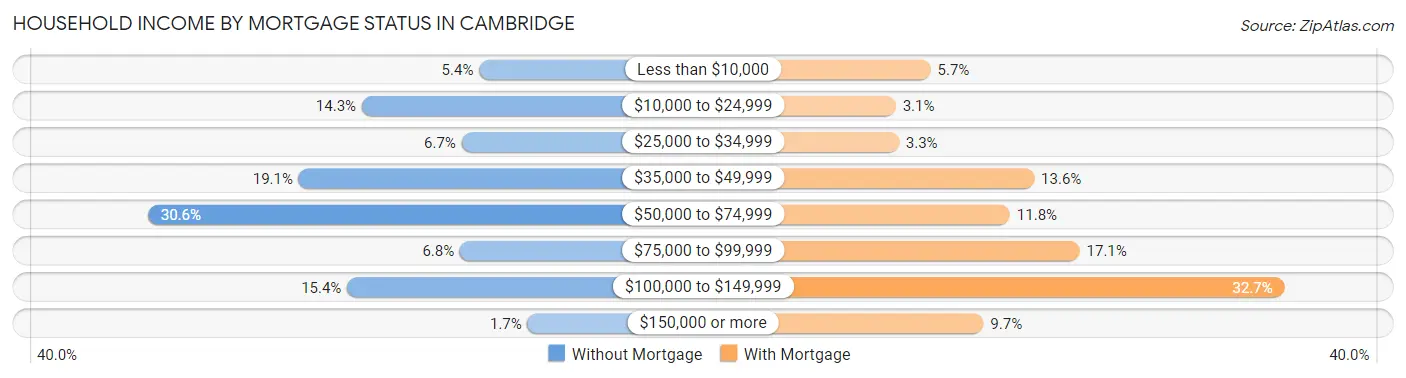
| Household Income | Without Mortgage | With Mortgage |
| Less than $10,000 | 48 (5.4%) | 71 (5.7%) |
| $10,000 to $24,999 | 128 (14.3%) | 38 (3.1%) |
| $25,000 to $34,999 | 60 (6.7%) | 41 (3.3%) |
| $35,000 to $49,999 | 171 (19.1%) | 169 (13.6%) |
| $50,000 to $74,999 | 274 (30.6%) | 146 (11.8%) |
| $75,000 to $99,999 | 61 (6.8%) | 212 (17.1%) |
| $100,000 to $149,999 | 138 (15.4%) | 406 (32.7%) |
| $150,000 or more | 15 (1.7%) | 121 (9.7%) |
| Total | 895 (100.0%) | 1,242 (100.0%) |
Property Value to Household Income Ratio in Cambridge
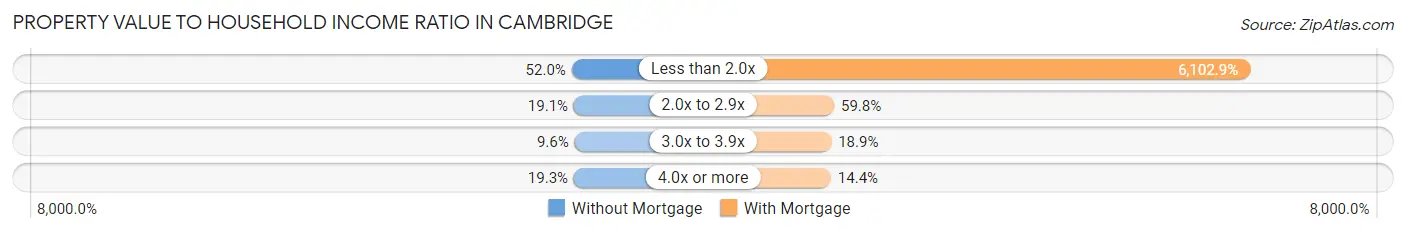
| Value-to-Income Ratio | Without Mortgage | With Mortgage |
| Less than 2.0x | 465 (52.0%) | 75,798 (6,102.9%) |
| 2.0x to 2.9x | 171 (19.1%) | 743 (59.8%) |
| 3.0x to 3.9x | 86 (9.6%) | 235 (18.9%) |
| 4.0x or more | 173 (19.3%) | 179 (14.4%) |
| Total | 895 (100.0%) | 1,242 (100.0%) |
Real Estate Taxes by Mortgage Status in Cambridge
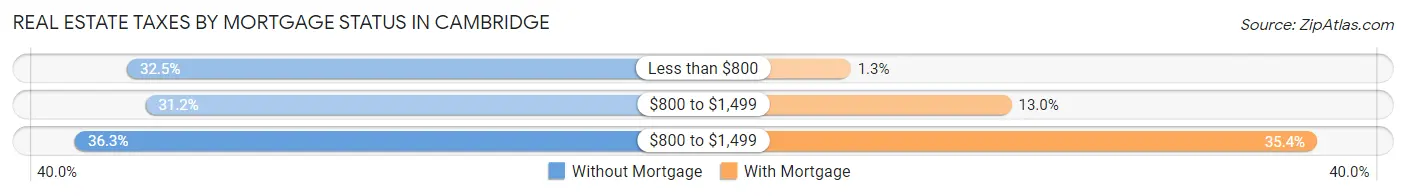
| Property Taxes | Without Mortgage | With Mortgage |
| Less than $800 | 291 (32.5%) | 16 (1.3%) |
| $800 to $1,499 | 279 (31.2%) | 162 (13.0%) |
| $800 to $1,499 | 325 (36.3%) | 439 (35.3%) |
| Total | 895 (100.0%) | 1,242 (100.0%) |
Health & Disability in Cambridge
Health Insurance Coverage by Age in Cambridge
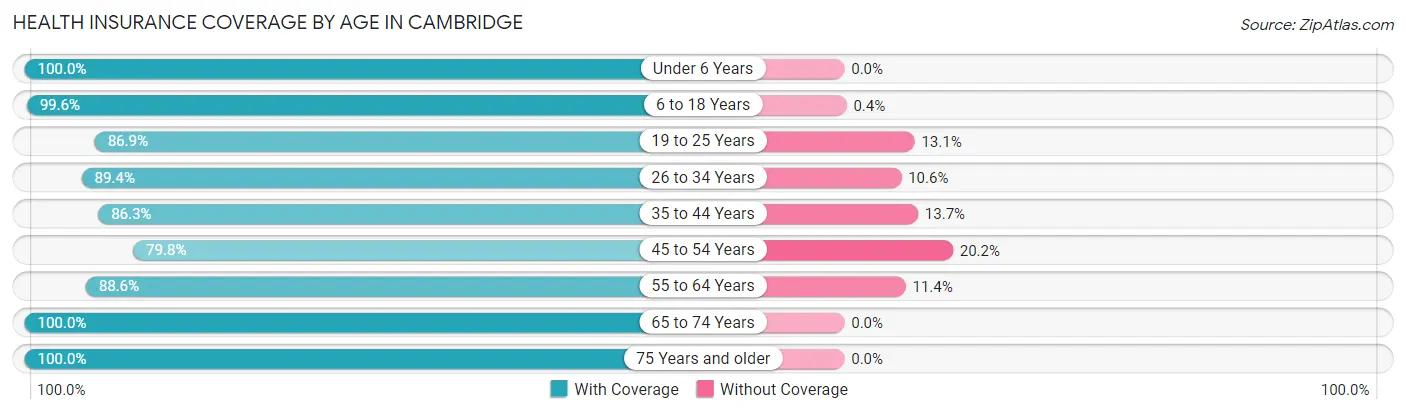
| Age Bracket | With Coverage | Without Coverage |
| Under 6 Years | 809 (100.0%) | 0 (0.0%) |
| 6 to 18 Years | 1,725 (99.6%) | 7 (0.4%) |
| 19 to 25 Years | 989 (86.9%) | 149 (13.1%) |
| 26 to 34 Years | 1,162 (89.4%) | 138 (10.6%) |
| 35 to 44 Years | 792 (86.3%) | 126 (13.7%) |
| 45 to 54 Years | 891 (79.8%) | 226 (20.2%) |
| 55 to 64 Years | 1,070 (88.6%) | 138 (11.4%) |
| 65 to 74 Years | 962 (100.0%) | 0 (0.0%) |
| 75 Years and older | 658 (100.0%) | 0 (0.0%) |
| Total | 9,058 (92.0%) | 784 (8.0%) |
Health Insurance Coverage by Citizenship Status in Cambridge
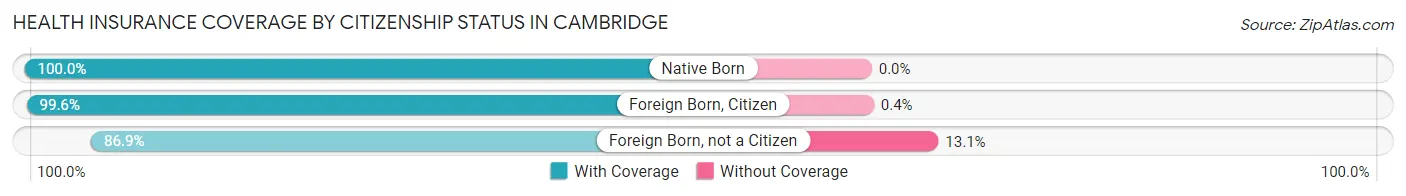
| Citizenship Status | With Coverage | Without Coverage |
| Native Born | 809 (100.0%) | 0 (0.0%) |
| Foreign Born, Citizen | 1,725 (99.6%) | 7 (0.4%) |
| Foreign Born, not a Citizen | 989 (86.9%) | 149 (13.1%) |
Health Insurance Coverage by Household Income in Cambridge
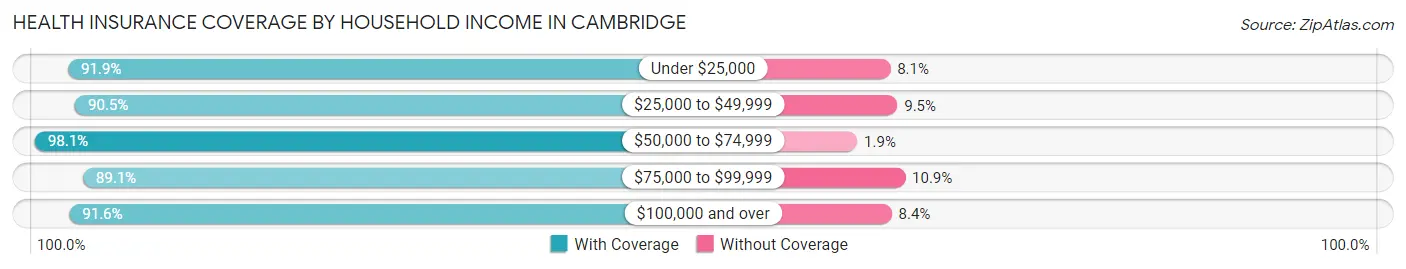
| Household Income | With Coverage | Without Coverage |
| Under $25,000 | 2,403 (91.9%) | 213 (8.1%) |
| $25,000 to $49,999 | 2,373 (90.5%) | 248 (9.5%) |
| $50,000 to $74,999 | 1,413 (98.1%) | 28 (1.9%) |
| $75,000 to $99,999 | 1,230 (89.1%) | 151 (10.9%) |
| $100,000 and over | 1,573 (91.6%) | 144 (8.4%) |
Public vs Private Health Insurance Coverage by Age in Cambridge
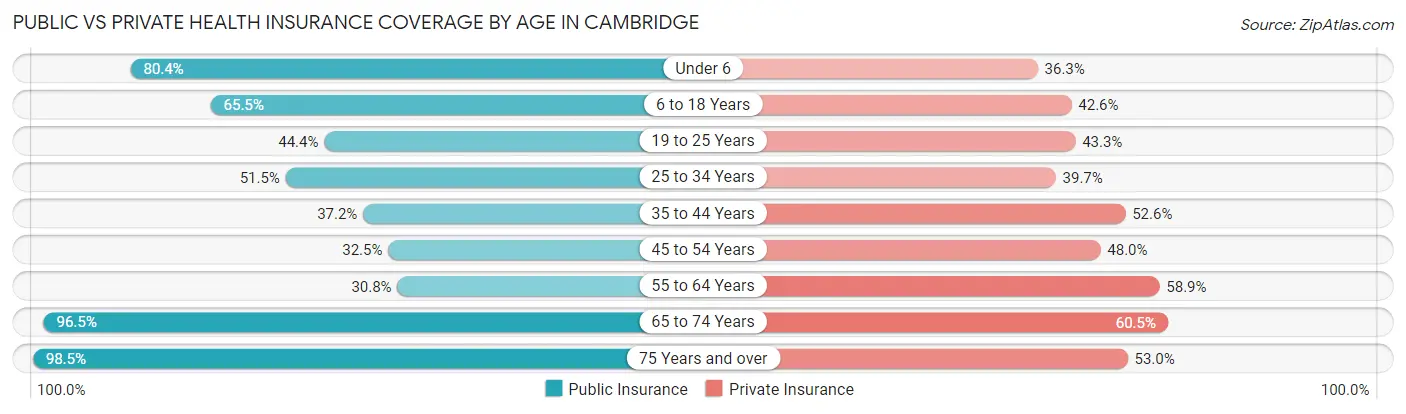
| Age Bracket | Public Insurance | Private Insurance |
| Under 6 | 650 (80.3%) | 294 (36.3%) |
| 6 to 18 Years | 1,134 (65.5%) | 738 (42.6%) |
| 19 to 25 Years | 505 (44.4%) | 493 (43.3%) |
| 25 to 34 Years | 670 (51.5%) | 516 (39.7%) |
| 35 to 44 Years | 341 (37.1%) | 483 (52.6%) |
| 45 to 54 Years | 363 (32.5%) | 536 (48.0%) |
| 55 to 64 Years | 372 (30.8%) | 712 (58.9%) |
| 65 to 74 Years | 928 (96.5%) | 582 (60.5%) |
| 75 Years and over | 648 (98.5%) | 349 (53.0%) |
| Total | 5,611 (57.0%) | 4,703 (47.8%) |
Disability Status by Sex by Age in Cambridge
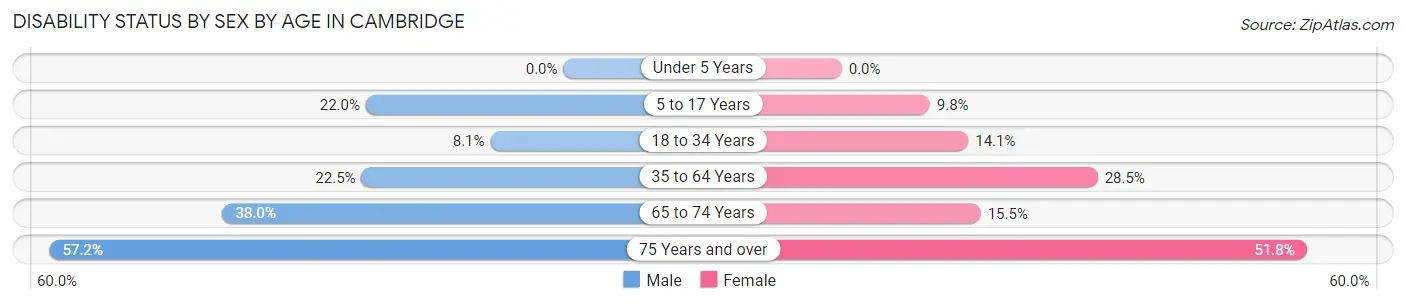
| Age Bracket | Male | Female |
| Under 5 Years | 0 (0.0%) | 0 (0.0%) |
| 5 to 17 Years | 200 (22.0%) | 72 (9.8%) |
| 18 to 34 Years | 99 (8.1%) | 194 (14.1%) |
| 35 to 64 Years | 345 (22.5%) | 487 (28.5%) |
| 65 to 74 Years | 164 (38.0%) | 82 (15.5%) |
| 75 Years and over | 131 (57.2%) | 222 (51.7%) |
Disability Class by Sex by Age in Cambridge
Disability Class: Hearing Difficulty
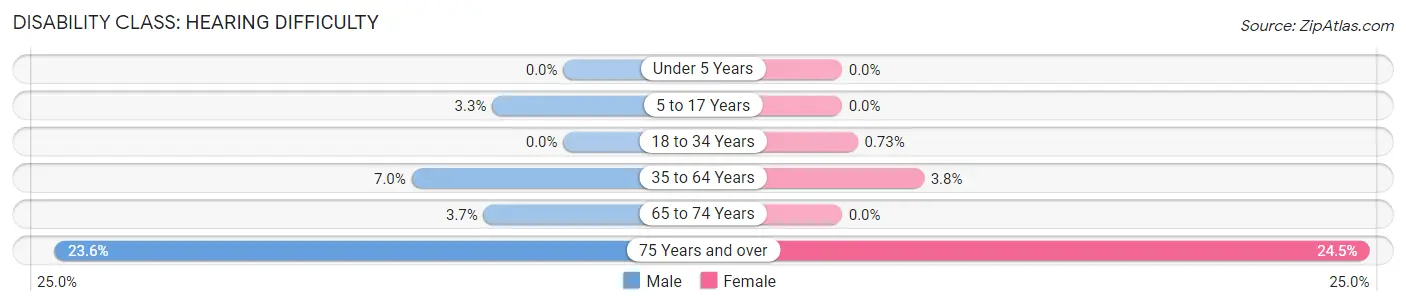
| Age Bracket | Male | Female |
| Under 5 Years | 0 (0.0%) | 0 (0.0%) |
| 5 to 17 Years | 30 (3.3%) | 0 (0.0%) |
| 18 to 34 Years | 0 (0.0%) | 10 (0.7%) |
| 35 to 64 Years | 108 (7.0%) | 65 (3.8%) |
| 65 to 74 Years | 16 (3.7%) | 0 (0.0%) |
| 75 Years and over | 54 (23.6%) | 105 (24.5%) |
Disability Class: Vision Difficulty
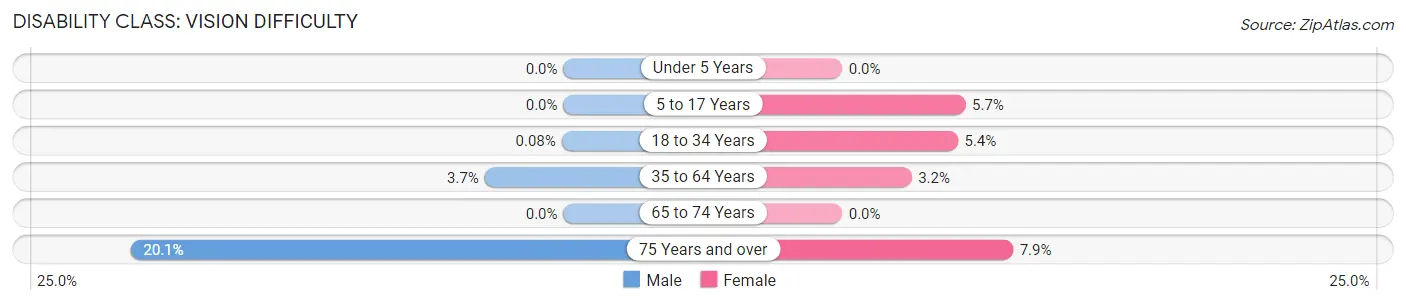
| Age Bracket | Male | Female |
| Under 5 Years | 0 (0.0%) | 0 (0.0%) |
| 5 to 17 Years | 0 (0.0%) | 42 (5.7%) |
| 18 to 34 Years | 1 (0.1%) | 74 (5.4%) |
| 35 to 64 Years | 56 (3.6%) | 55 (3.2%) |
| 65 to 74 Years | 0 (0.0%) | 0 (0.0%) |
| 75 Years and over | 46 (20.1%) | 34 (7.9%) |
Disability Class: Cognitive Difficulty
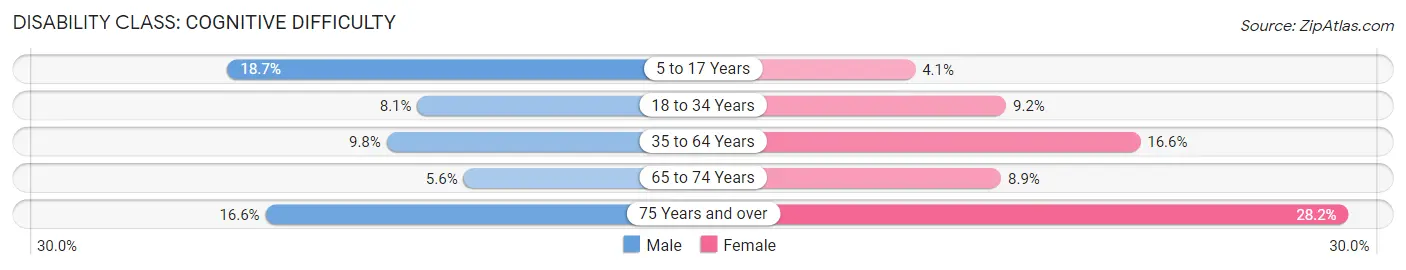
| Age Bracket | Male | Female |
| 5 to 17 Years | 170 (18.7%) | 30 (4.1%) |
| 18 to 34 Years | 99 (8.1%) | 126 (9.1%) |
| 35 to 64 Years | 151 (9.8%) | 284 (16.6%) |
| 65 to 74 Years | 24 (5.6%) | 47 (8.9%) |
| 75 Years and over | 38 (16.6%) | 121 (28.2%) |
Disability Class: Ambulatory Difficulty
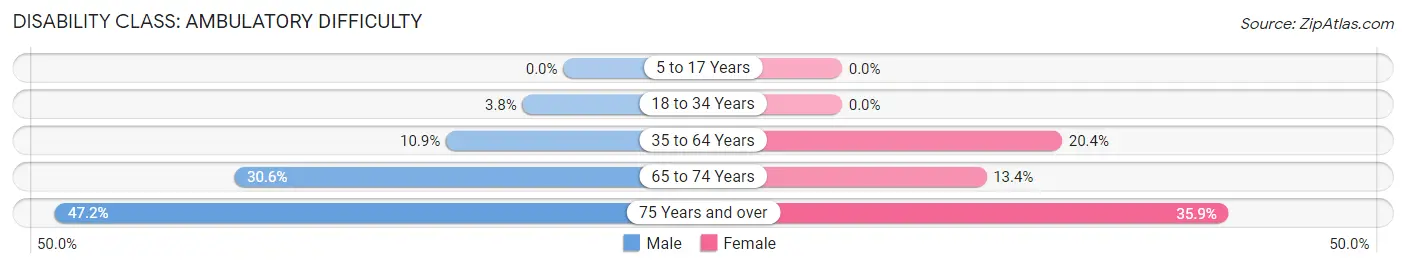
| Age Bracket | Male | Female |
| 5 to 17 Years | 0 (0.0%) | 0 (0.0%) |
| 18 to 34 Years | 46 (3.8%) | 0 (0.0%) |
| 35 to 64 Years | 167 (10.9%) | 349 (20.4%) |
| 65 to 74 Years | 132 (30.6%) | 71 (13.4%) |
| 75 Years and over | 108 (47.2%) | 154 (35.9%) |
Disability Class: Self-Care Difficulty
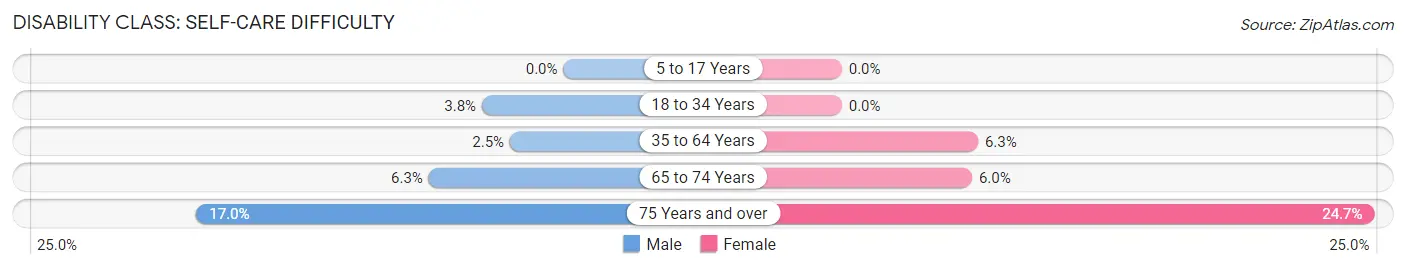
| Age Bracket | Male | Female |
| 5 to 17 Years | 0 (0.0%) | 0 (0.0%) |
| 18 to 34 Years | 46 (3.8%) | 0 (0.0%) |
| 35 to 64 Years | 38 (2.5%) | 108 (6.3%) |
| 65 to 74 Years | 27 (6.2%) | 32 (6.0%) |
| 75 Years and over | 39 (17.0%) | 106 (24.7%) |
Technology Access in Cambridge
Computing Device Access in Cambridge
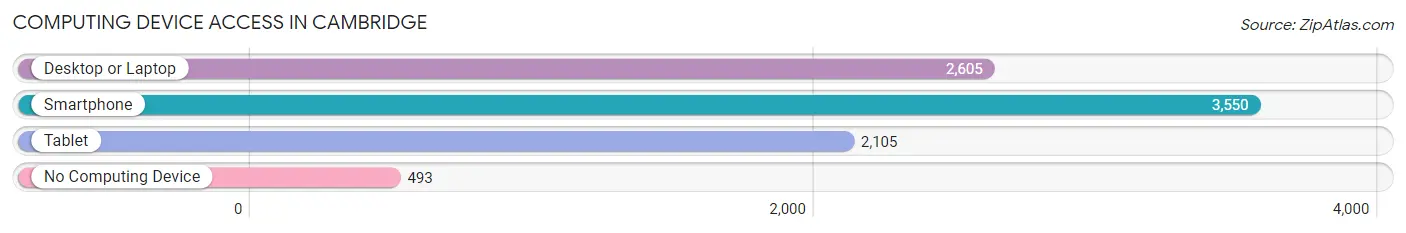
| Device Type | # Households | % Households |
| Desktop or Laptop | 2,605 | 58.3% |
| Smartphone | 3,550 | 79.5% |
| Tablet | 2,105 | 47.1% |
| No Computing Device | 493 | 11.0% |
| Total | 4,465 | 100.0% |
Internet Access in Cambridge
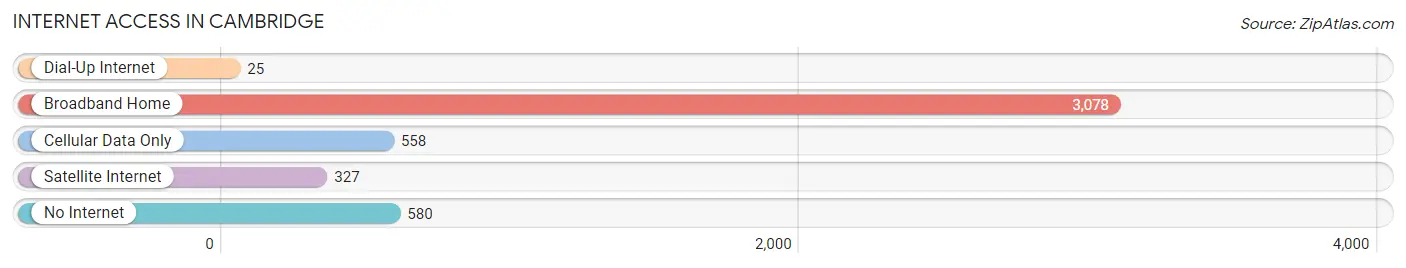
| Internet Type | # Households | % Households |
| Dial-Up Internet | 25 | 0.6% |
| Broadband Home | 3,078 | 68.9% |
| Cellular Data Only | 558 | 12.5% |
| Satellite Internet | 327 | 7.3% |
| No Internet | 580 | 13.0% |
| Total | 4,465 | 100.0% |
Cambridge Summary
Cambridge, Ohio is a city located in Guernsey County in the state of Ohio. It is the county seat of Guernsey County and is located along the banks of Wills Creek. The city has a population of 10,635 as of the 2010 census.
History
The area that is now Cambridge was first settled in 1798 by a group of settlers from New England. The settlement was originally known as Cambridge, after the city of Cambridge, Massachusetts. The settlement was incorporated as a village in 1806 and as a city in 1834.
The city was an important stop on the Underground Railroad, with many of the city's residents helping to hide and transport escaped slaves. The city was also an important center of industry during the 19th century, with several factories and mills located in the city.
Geography
Cambridge is located at 39°57'N 81°35'W (39.95, -81.58). The city is situated along the banks of Wills Creek, a tributary of the Muskingum River. The city has a total area of 5.3 square miles, all of which is land.
The city is located in the Appalachian Plateau region of Ohio, and is surrounded by rolling hills and forests. The city is located approximately 50 miles east of Columbus, Ohio and approximately 80 miles south of Cleveland, Ohio.
Economy
The economy of Cambridge is largely based on manufacturing and services. The city is home to several manufacturing companies, including Cambridge Industries, Cambridge Metals, and Cambridge Plastics. The city is also home to several service-based businesses, including banks, restaurants, and retail stores.
The city is also home to several educational institutions, including Ohio University-Zanesville, Zane State College, and the Cambridge City School District.
Demographics
As of the 2010 census, the population of Cambridge was 10,635. The racial makeup of the city was 92.3% White, 4.2% African American, 0.3% Native American, 0.7% Asian, 0.1% Pacific Islander, 0.7% from other races, and 1.7% from two or more races. Hispanic or Latino of any race were 1.7% of the population.
The median income for a household in the city was $31,944, and the median income for a family was $41,944. The per capita income for the city was $17,845. About 16.2% of families and 19.2% of the population were below the poverty line, including 28.2% of those under age 18 and 11.2% of those age 65 or over.
Common Questions
What is Per Capita Income in Cambridge?
Per Capita income in Cambridge is $23,361.
What is the Median Family Income in Cambridge?
Median Family Income in Cambridge is $52,527.
What is the Median Household income in Cambridge?
Median Household Income in Cambridge is $39,589.
What is Income or Wage Gap in Cambridge?
Income or Wage Gap in Cambridge is 24.1%.
Women in Cambridge earn 75.9 cents for every dollar earned by a man.
What is Family Income Deficit in Cambridge?
Family Income Deficit in Cambridge is $12,887.
Families that are below poverty line in Cambridge earn $12,887 less on average than the poverty threshold level.
What is Inequality or Gini Index in Cambridge?
Inequality or Gini Index in Cambridge is 0.44.
What is the Total Population of Cambridge?
Total Population of Cambridge is 10,087.
What is the Total Male Population of Cambridge?
Total Male Population of Cambridge is 4,846.
What is the Total Female Population of Cambridge?
Total Female Population of Cambridge is 5,241.
What is the Ratio of Males per 100 Females in Cambridge?
There are 92.46 Males per 100 Females in Cambridge.
What is the Ratio of Females per 100 Males in Cambridge?
There are 108.15 Females per 100 Males in Cambridge.
What is the Median Population Age in Cambridge?
Median Population Age in Cambridge is 35.1 Years.
What is the Average Family Size in Cambridge
Average Family Size in Cambridge is 3.0 People.
What is the Average Household Size in Cambridge
Average Household Size in Cambridge is 2.2 People.
How Large is the Labor Force in Cambridge?
There are 4,614 People in the Labor Forcein in Cambridge.
What is the Percentage of People in the Labor Force in Cambridge?
58.0% of People are in the Labor Force in Cambridge.
What is the Unemployment Rate in Cambridge?
Unemployment Rate in Cambridge is 2.6%.