Brookville, OH Map & Demographics
Brookville Map
Brookville Overview
$35,371
PER CAPITA INCOME
$81,847
AVG FAMILY INCOME
$59,158
AVG HOUSEHOLD INCOME
44.9%
WAGE / INCOME GAP [ % ]
55.1¢/ $1
WAGE / INCOME GAP [ $ ]
0.44
INEQUALITY / GINI INDEX
6,035
TOTAL POPULATION
3,069
MALE POPULATION
2,966
FEMALE POPULATION
103.47
MALES / 100 FEMALES
96.64
FEMALES / 100 MALES
49.1
MEDIAN AGE
3.0
AVG FAMILY SIZE
2.3
AVG HOUSEHOLD SIZE
2,691
LABOR FORCE [ PEOPLE ]
54.6%
PERCENT IN LABOR FORCE
3.2%
UNEMPLOYMENT RATE
Brookville Zip Codes
Brookville Area Codes
Income in Brookville
Income Overview in Brookville
Per Capita Income in Brookville is $35,371, while median incomes of families and households are $81,847 and $59,158 respectively.
| Characteristic | Number | Measure |
| Per Capita Income | 6,035 | $35,371 |
| Median Family Income | 1,579 | $81,847 |
| Mean Family Income | 1,579 | $108,777 |
| Median Household Income | 2,582 | $59,158 |
| Mean Household Income | 2,582 | $81,896 |
| Income Deficit | 1,579 | $0 |
| Wage / Income Gap (%) | 6,035 | 44.86% |
| Wage / Income Gap ($) | 6,035 | 55.14¢ per $1 |
| Gini / Inequality Index | 6,035 | 0.44 |
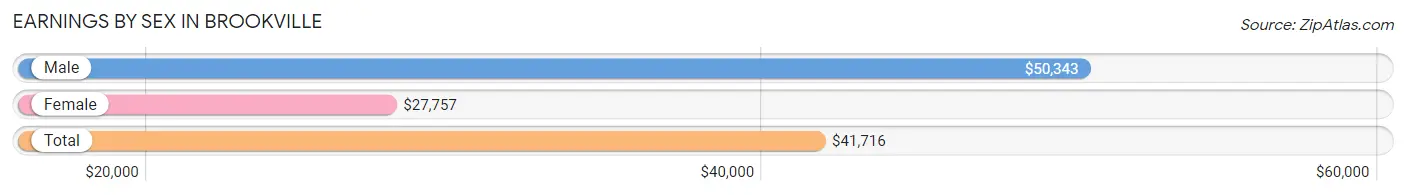
Earnings by Sex in Brookville
Average Earnings in Brookville are $41,716, $50,343 for men and $27,757 for women, a difference of 44.9%.
| Sex | Number | Average Earnings |
| Male | 1,501 (53.7%) | $50,343 |
| Female | 1,293 (46.3%) | $27,757 |
| Total | 2,794 (100.0%) | $41,716 |
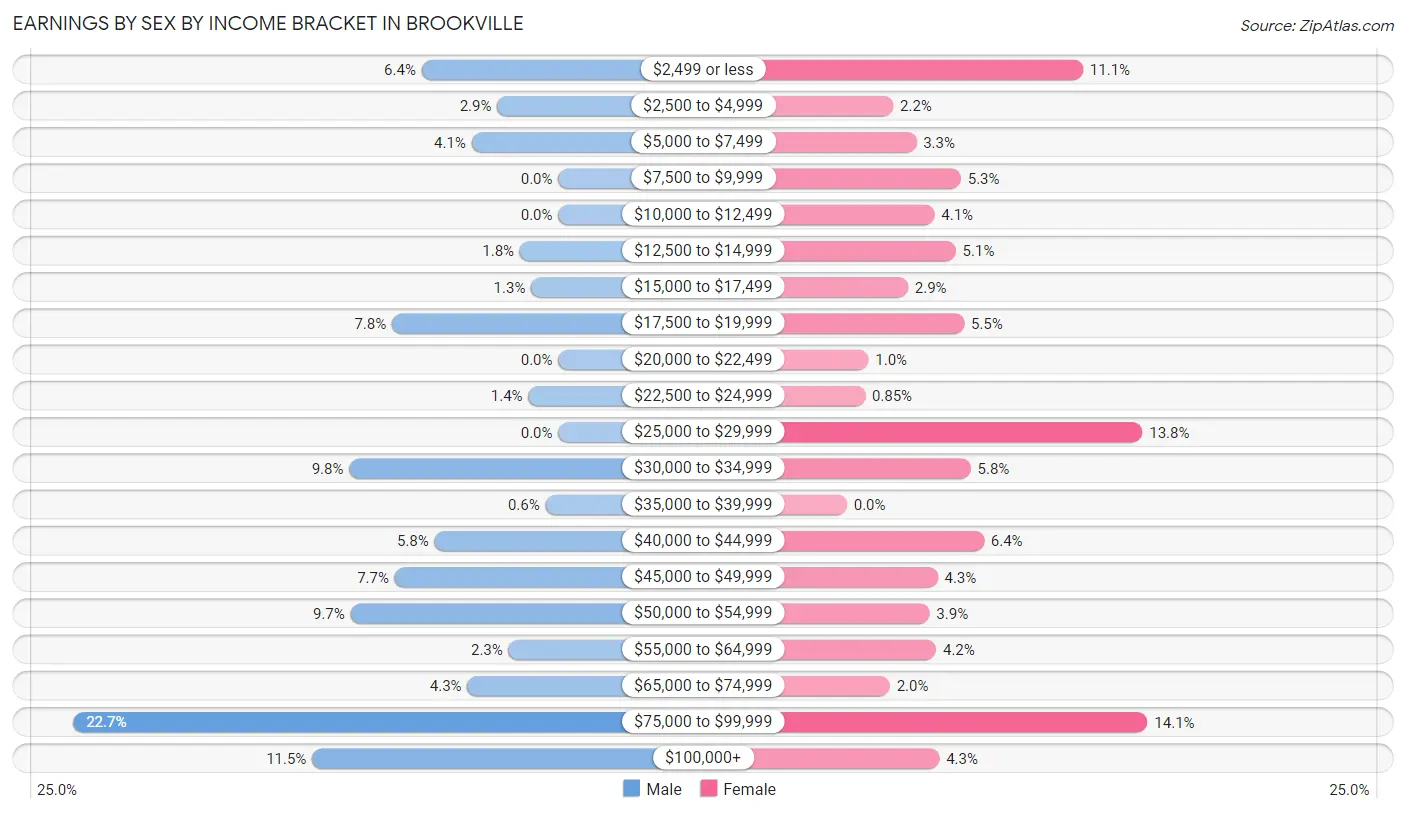
Earnings by Sex by Income Bracket in Brookville
The most common earnings brackets in Brookville are $75,000 to $99,999 for men (341 | 22.7%) and $75,000 to $99,999 for women (182 | 14.1%).
| Income | Male | Female |
| $2,499 or less | 96 (6.4%) | 143 (11.1%) |
| $2,500 to $4,999 | 43 (2.9%) | 28 (2.2%) |
| $5,000 to $7,499 | 61 (4.1%) | 42 (3.3%) |
| $7,500 to $9,999 | 0 (0.0%) | 69 (5.3%) |
| $10,000 to $12,499 | 0 (0.0%) | 53 (4.1%) |
| $12,500 to $14,999 | 27 (1.8%) | 66 (5.1%) |
| $15,000 to $17,499 | 19 (1.3%) | 37 (2.9%) |
| $17,500 to $19,999 | 117 (7.8%) | 71 (5.5%) |
| $20,000 to $22,499 | 0 (0.0%) | 13 (1.0%) |
| $22,500 to $24,999 | 21 (1.4%) | 11 (0.9%) |
| $25,000 to $29,999 | 0 (0.0%) | 179 (13.8%) |
| $30,000 to $34,999 | 147 (9.8%) | 75 (5.8%) |
| $35,000 to $39,999 | 9 (0.6%) | 0 (0.0%) |
| $40,000 to $44,999 | 87 (5.8%) | 83 (6.4%) |
| $45,000 to $49,999 | 115 (7.7%) | 55 (4.3%) |
| $50,000 to $54,999 | 146 (9.7%) | 50 (3.9%) |
| $55,000 to $64,999 | 35 (2.3%) | 54 (4.2%) |
| $65,000 to $74,999 | 64 (4.3%) | 26 (2.0%) |
| $75,000 to $99,999 | 341 (22.7%) | 182 (14.1%) |
| $100,000+ | 173 (11.5%) | 56 (4.3%) |
| Total | 1,501 (100.0%) | 1,293 (100.0%) |
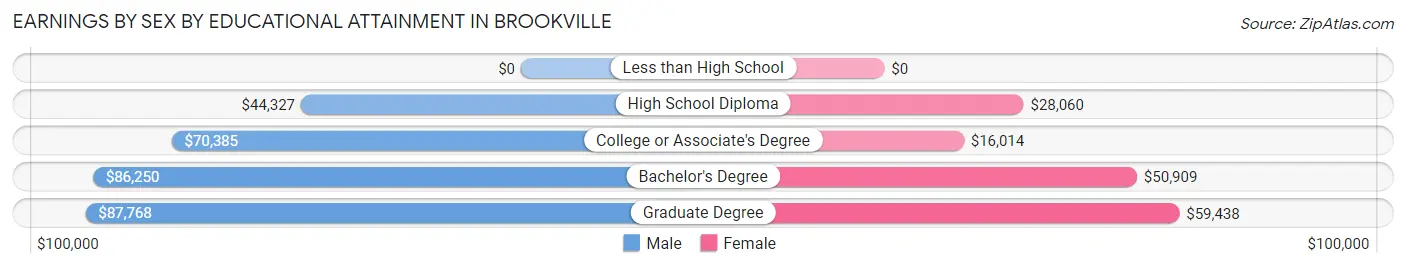
Earnings by Sex by Educational Attainment in Brookville
Average earnings in Brookville are $53,854 for men and $30,962 for women, a difference of 42.5%. Men with an educational attainment of graduate degree enjoy the highest average annual earnings of $87,768, while those with high school diploma education earn the least with $44,327. Women with an educational attainment of graduate degree earn the most with the average annual earnings of $59,438, while those with college or associate's degree education have the smallest earnings of $16,014.
| Educational Attainment | Male Income | Female Income |
| Less than High School | - | - |
| High School Diploma | $44,327 | $28,060 |
| College or Associate's Degree | $70,385 | $16,014 |
| Bachelor's Degree | $86,250 | $50,909 |
| Graduate Degree | $87,768 | $59,438 |
| Total | $53,854 | $30,962 |
Family Income in Brookville
Family Income Brackets in Brookville
According to the Brookville family income data, there are 433 families falling into the $50,000 to $74,999 income range, which is the most common income bracket and makes up 27.4% of all families.
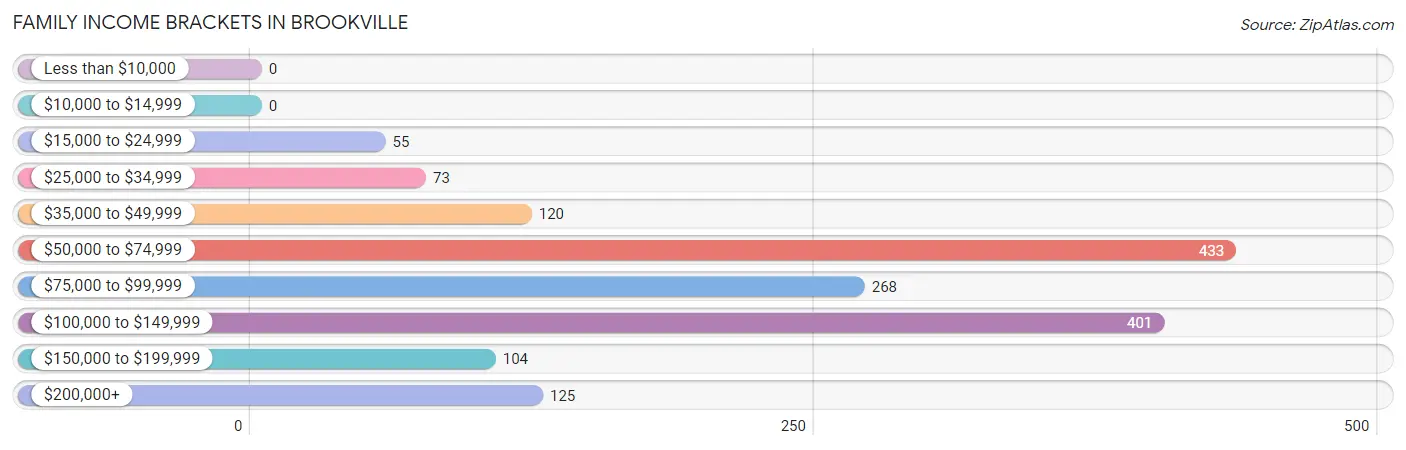
| Income Bracket | # Families | % Families |
| Less than $10,000 | 0 | 0.0% |
| $10,000 to $14,999 | 0 | 0.0% |
| $15,000 to $24,999 | 55 | 3.5% |
| $25,000 to $34,999 | 73 | 4.6% |
| $35,000 to $49,999 | 120 | 7.6% |
| $50,000 to $74,999 | 433 | 27.4% |
| $75,000 to $99,999 | 268 | 17.0% |
| $100,000 to $149,999 | 401 | 25.4% |
| $150,000 to $199,999 | 104 | 6.6% |
| $200,000+ | 125 | 7.9% |
Family Income by Famaliy Size in Brookville
3-person families (276 | 17.5%) account for the highest median family income in Brookville with $137,500 per family, while 3-person families (276 | 17.5%) have the highest median income of $45,833 per family member.
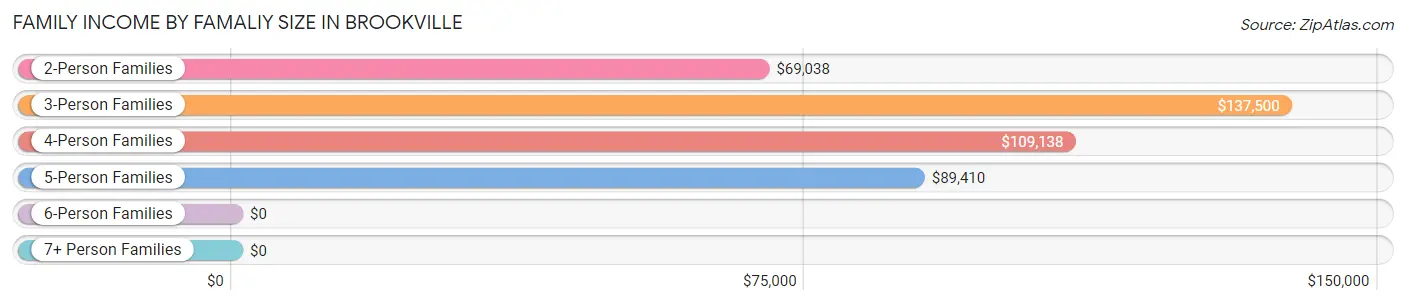
| Income Bracket | # Families | Median Income |
| 2-Person Families | 924 (58.5%) | $69,038 |
| 3-Person Families | 276 (17.5%) | $137,500 |
| 4-Person Families | 162 (10.3%) | $109,138 |
| 5-Person Families | 121 (7.7%) | $89,410 |
| 6-Person Families | 34 (2.1%) | $0 |
| 7+ Person Families | 62 (3.9%) | $0 |
| Total | 1,579 (100.0%) | $81,847 |
Family Income by Number of Earners in Brookville
The median family income in Brookville is $81,847, with families comprising 3+ earners (182) having the highest median family income of $143,409, while families with no earners (328) have the lowest median family income of $53,833, accounting for 11.5% and 20.8% of families, respectively.
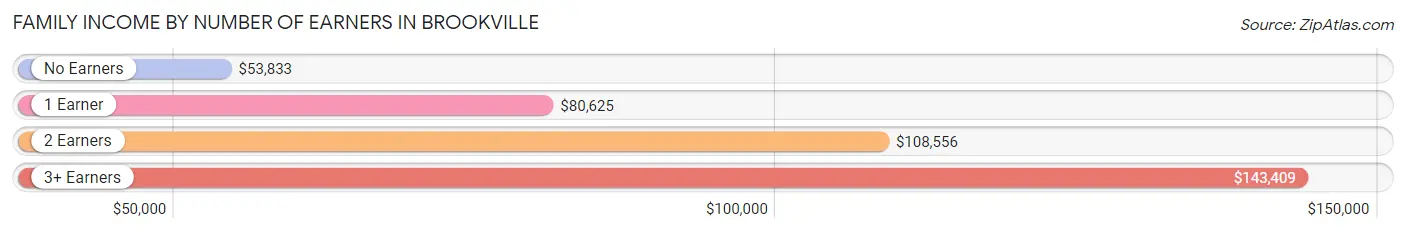
| Number of Earners | # Families | Median Income |
| No Earners | 328 (20.8%) | $53,833 |
| 1 Earner | 442 (28.0%) | $80,625 |
| 2 Earners | 627 (39.7%) | $108,556 |
| 3+ Earners | 182 (11.5%) | $143,409 |
| Total | 1,579 (100.0%) | $81,847 |
Household Income in Brookville
Household Income Brackets in Brookville
With 622 households falling in the category, the $50,000 to $74,999 income range is the most frequent in Brookville, accounting for 24.1% of all households. In contrast, only 85 households (3.3%) fall into the less than $10,000 income bracket, making it the least populous group.
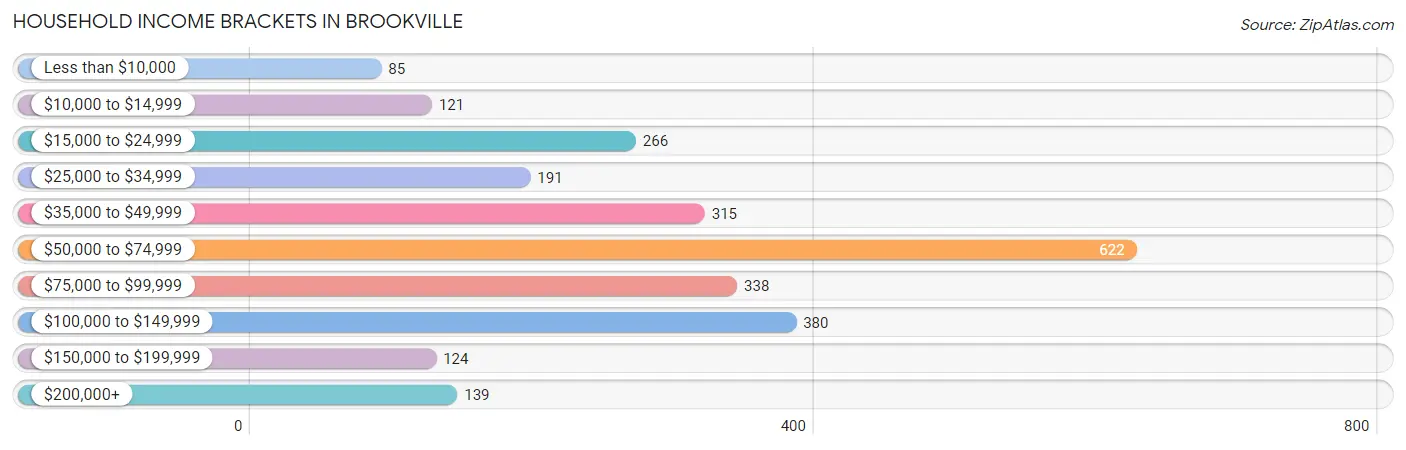
| Income Bracket | # Households | % Households |
| Less than $10,000 | 85 | 3.3% |
| $10,000 to $14,999 | 121 | 4.7% |
| $15,000 to $24,999 | 266 | 10.3% |
| $25,000 to $34,999 | 191 | 7.4% |
| $35,000 to $49,999 | 315 | 12.2% |
| $50,000 to $74,999 | 622 | 24.1% |
| $75,000 to $99,999 | 338 | 13.1% |
| $100,000 to $149,999 | 380 | 14.7% |
| $150,000 to $199,999 | 124 | 4.8% |
| $200,000+ | 139 | 5.4% |
Household Income by Householder Age in Brookville
The median household income in Brookville is $59,158, with the highest median household income of $77,878 found in the 25 to 44 years age bracket for the primary householder. A total of 689 households (26.7%) fall into this category. Meanwhile, the 15 to 24 years age bracket for the primary householder has the lowest median household income of $0, with 41 households (1.6%) in this group.
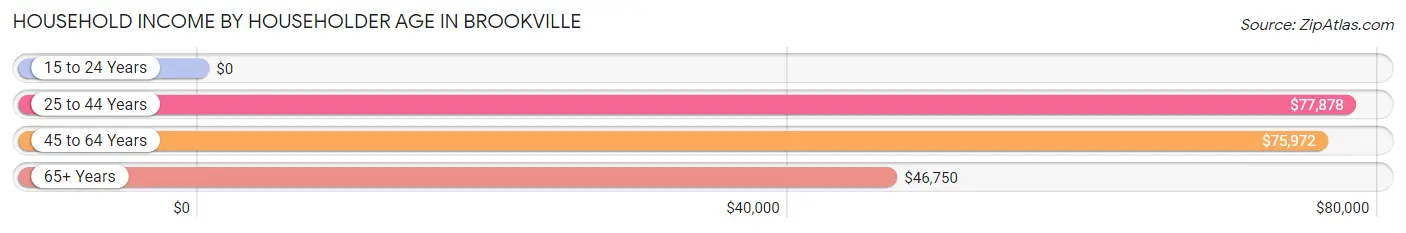
| Income Bracket | # Households | Median Income |
| 15 to 24 Years | 41 (1.6%) | $0 |
| 25 to 44 Years | 689 (26.7%) | $77,878 |
| 45 to 64 Years | 801 (31.0%) | $75,972 |
| 65+ Years | 1,051 (40.7%) | $46,750 |
| Total | 2,582 (100.0%) | $59,158 |
Poverty in Brookville
Income Below Poverty by Sex and Age in Brookville
With 7.3% poverty level for males and 13.0% for females among the residents of Brookville, 18 to 24 year old males and 25 to 34 year old females are the most vulnerable to poverty, with 31 males (26.7%) and 116 females (36.4%) in their respective age groups living below the poverty level.
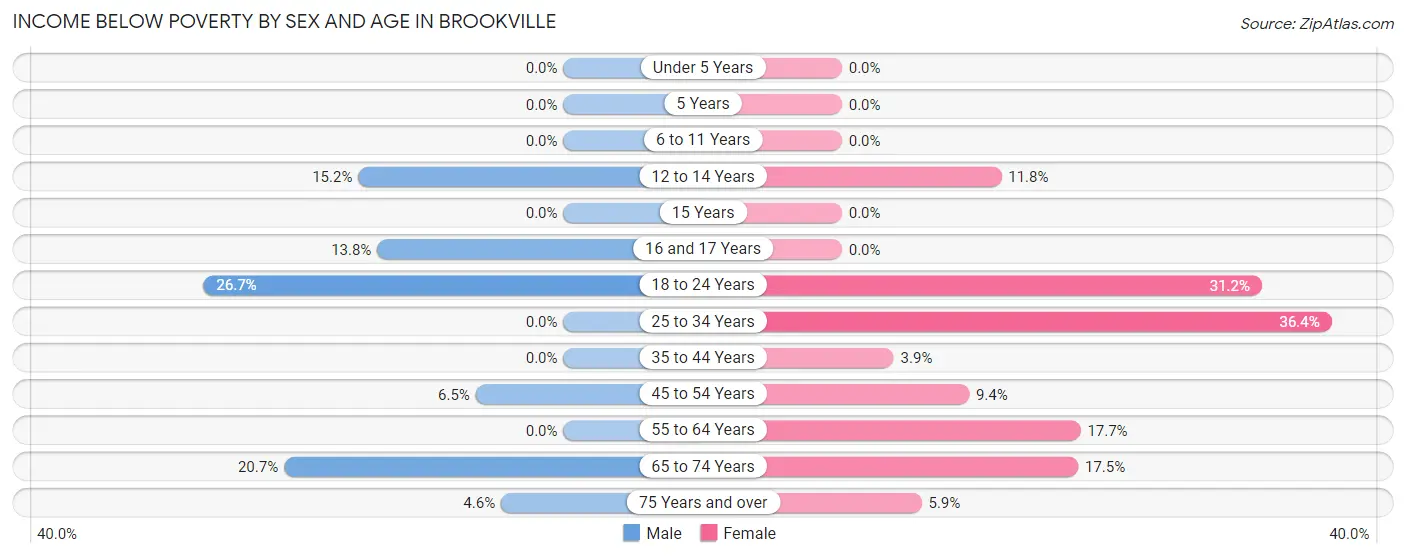
| Age Bracket | Male | Female |
| Under 5 Years | 0 (0.0%) | 0 (0.0%) |
| 5 Years | 0 (0.0%) | 0 (0.0%) |
| 6 to 11 Years | 0 (0.0%) | 0 (0.0%) |
| 12 to 14 Years | 30 (15.2%) | 18 (11.8%) |
| 15 Years | 0 (0.0%) | 0 (0.0%) |
| 16 and 17 Years | 17 (13.8%) | 0 (0.0%) |
| 18 to 24 Years | 31 (26.7%) | 29 (31.2%) |
| 25 to 34 Years | 0 (0.0%) | 116 (36.4%) |
| 35 to 44 Years | 0 (0.0%) | 12 (3.8%) |
| 45 to 54 Years | 19 (6.5%) | 32 (9.4%) |
| 55 to 64 Years | 0 (0.0%) | 67 (17.7%) |
| 65 to 74 Years | 107 (20.7%) | 70 (17.5%) |
| 75 Years and over | 15 (4.6%) | 26 (5.9%) |
| Total | 219 (7.3%) | 370 (13.0%) |
Income Above Poverty by Sex and Age in Brookville
According to the poverty statistics in Brookville, males aged under 5 years and females aged under 5 years are the age groups that are most secure financially, with 100.0% of males and 100.0% of females in these age groups living above the poverty line.
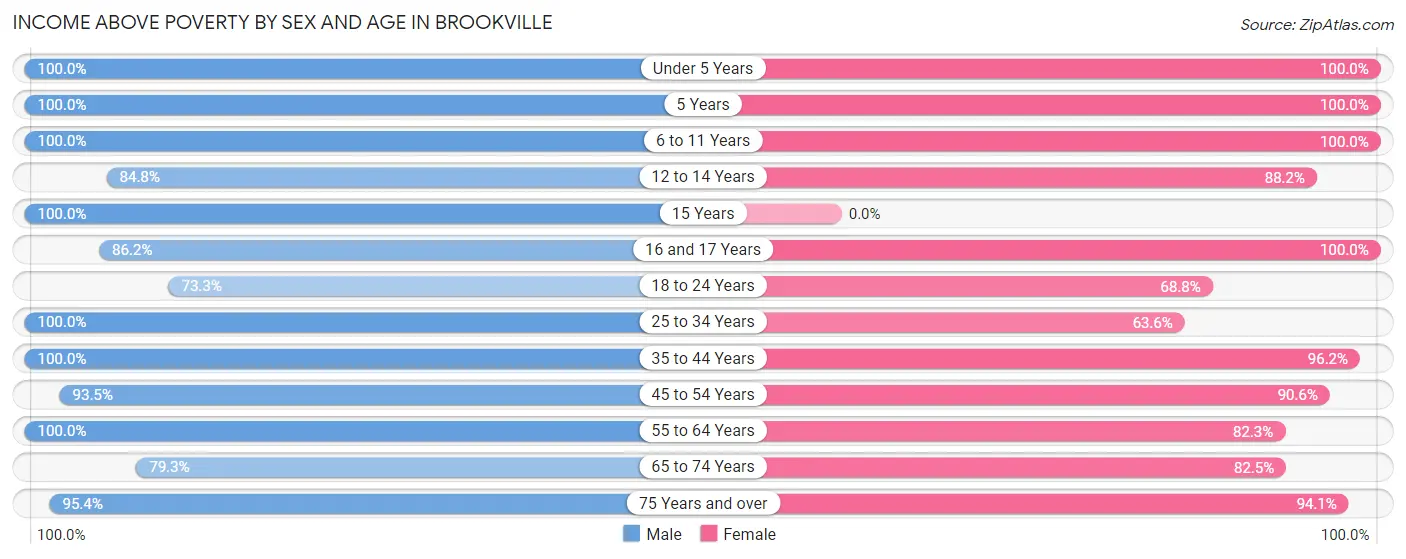
| Age Bracket | Male | Female |
| Under 5 Years | 133 (100.0%) | 138 (100.0%) |
| 5 Years | 95 (100.0%) | 79 (100.0%) |
| 6 to 11 Years | 146 (100.0%) | 127 (100.0%) |
| 12 to 14 Years | 167 (84.8%) | 134 (88.2%) |
| 15 Years | 40 (100.0%) | 0 (0.0%) |
| 16 and 17 Years | 106 (86.2%) | 68 (100.0%) |
| 18 to 24 Years | 85 (73.3%) | 64 (68.8%) |
| 25 to 34 Years | 396 (100.0%) | 203 (63.6%) |
| 35 to 44 Years | 280 (100.0%) | 300 (96.2%) |
| 45 to 54 Years | 273 (93.5%) | 307 (90.6%) |
| 55 to 64 Years | 357 (100.0%) | 311 (82.3%) |
| 65 to 74 Years | 409 (79.3%) | 329 (82.5%) |
| 75 Years and over | 309 (95.4%) | 413 (94.1%) |
| Total | 2,796 (92.7%) | 2,473 (87.0%) |
Income Below Poverty Among Married-Couple Families in Brookville
The poverty statistics for married-couple families in Brookville show that 1.5% or 19 of the total 1,286 families live below the poverty line. Families with 1 or 2 children have the highest poverty rate of 6.2%, comprising of 19 families. On the other hand, families with no children have the lowest poverty rate of 0.0%, which includes 0 families.
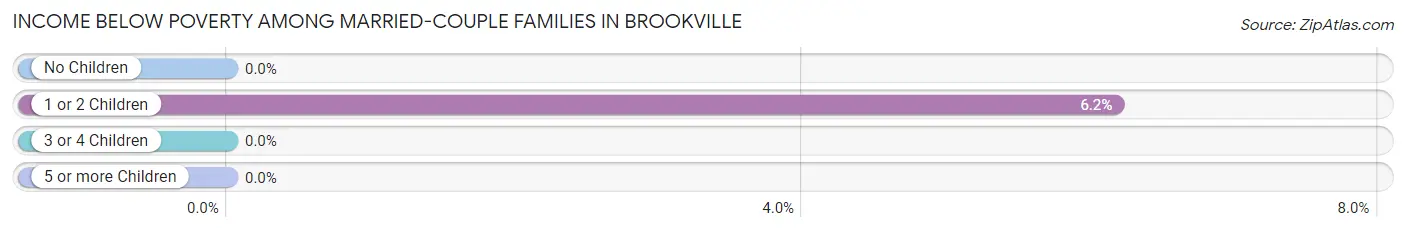
| Children | Above Poverty | Below Poverty |
| No Children | 818 (100.0%) | 0 (0.0%) |
| 1 or 2 Children | 289 (93.8%) | 19 (6.2%) |
| 3 or 4 Children | 117 (100.0%) | 0 (0.0%) |
| 5 or more Children | 43 (100.0%) | 0 (0.0%) |
| Total | 1,267 (98.5%) | 19 (1.5%) |
Income Below Poverty Among Single-Parent Households in Brookville
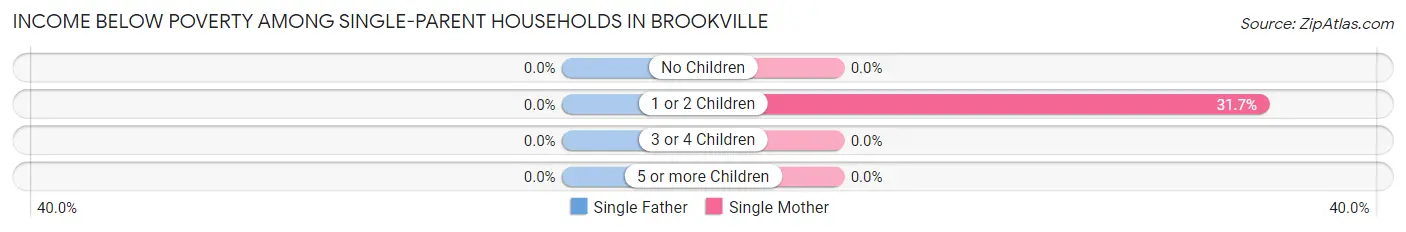
| Children | Single Father | Single Mother |
| No Children | 0 (0.0%) | 0 (0.0%) |
| 1 or 2 Children | 0 (0.0%) | 19 (31.7%) |
| 3 or 4 Children | 0 (0.0%) | 0 (0.0%) |
| 5 or more Children | 0 (0.0%) | 0 (0.0%) |
| Total | 0 (0.0%) | 19 (11.3%) |
Income Below Poverty Among Married-Couple vs Single-Parent Households in Brookville
The poverty data for Brookville shows that 19 of the married-couple family households (1.5%) and 19 of the single-parent households (6.5%) are living below the poverty level. Within the married-couple family households, those with 1 or 2 children have the highest poverty rate, with 19 households (6.2%) falling below the poverty line. Among the single-parent households, those with 1 or 2 children have the highest poverty rate, with 19 household (20.9%) living below poverty.
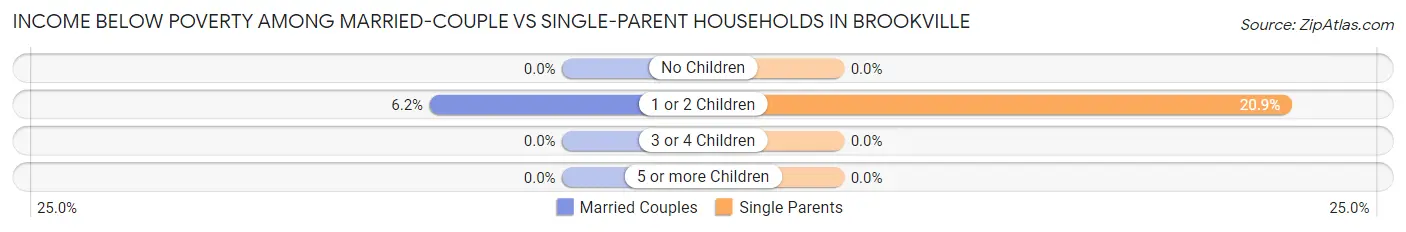
| Children | Married-Couple Families | Single-Parent Households |
| No Children | 0 (0.0%) | 0 (0.0%) |
| 1 or 2 Children | 19 (6.2%) | 19 (20.9%) |
| 3 or 4 Children | 0 (0.0%) | 0 (0.0%) |
| 5 or more Children | 0 (0.0%) | 0 (0.0%) |
| Total | 19 (1.5%) | 19 (6.5%) |
Race in Brookville
The most populous races in Brookville are White / Caucasian (5,341 | 88.5%), Asian (350 | 5.8%), and Two or more Races (230 | 3.8%).
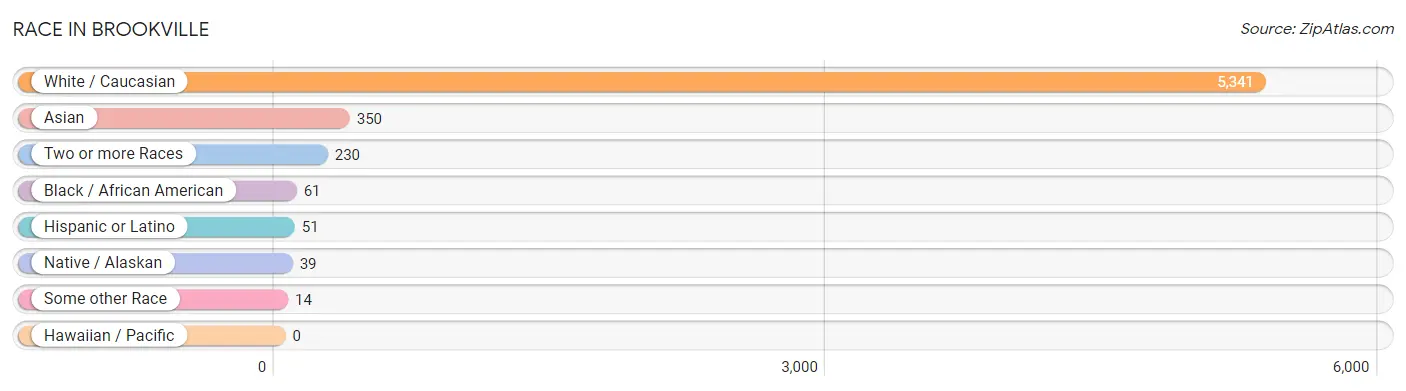
| Race | # Population | % Population |
| Asian | 350 | 5.8% |
| Black / African American | 61 | 1.0% |
| Hawaiian / Pacific | 0 | 0.0% |
| Hispanic or Latino | 51 | 0.9% |
| Native / Alaskan | 39 | 0.6% |
| White / Caucasian | 5,341 | 88.5% |
| Two or more Races | 230 | 3.8% |
| Some other Race | 14 | 0.2% |
| Total | 6,035 | 100.0% |
Ancestry in Brookville
The most populous ancestries reported in Brookville are German (1,375 | 22.8%), English (888 | 14.7%), Irish (639 | 10.6%), American (530 | 8.8%), and Thai (286 | 4.7%), together accounting for 61.6% of all Brookville residents.
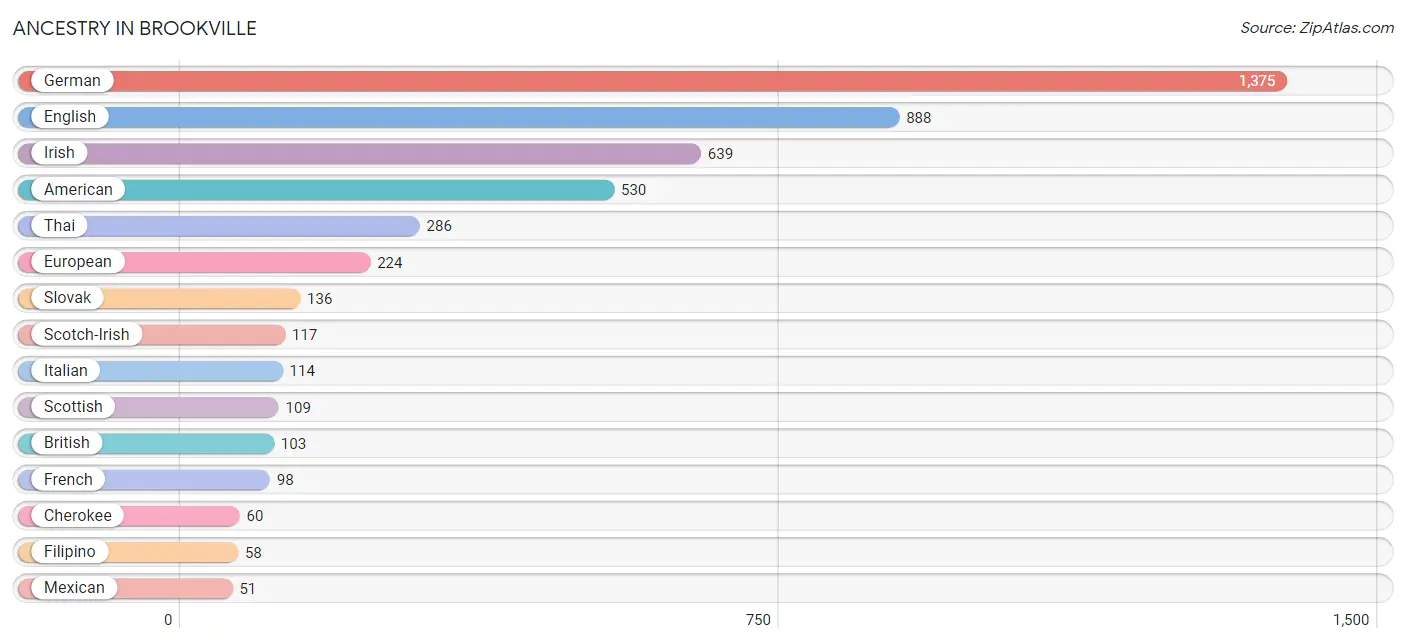
| Ancestry | # Population | % Population |
| American | 530 | 8.8% |
| Apache | 19 | 0.3% |
| Austrian | 21 | 0.4% |
| British | 103 | 1.7% |
| Cherokee | 60 | 1.0% |
| Czech | 12 | 0.2% |
| Dutch | 34 | 0.6% |
| English | 888 | 14.7% |
| European | 224 | 3.7% |
| Filipino | 58 | 1.0% |
| French | 98 | 1.6% |
| French Canadian | 12 | 0.2% |
| German | 1,375 | 22.8% |
| Irish | 639 | 10.6% |
| Italian | 114 | 1.9% |
| Korean | 11 | 0.2% |
| Mexican | 51 | 0.9% |
| Northern European | 17 | 0.3% |
| Norwegian | 14 | 0.2% |
| Polish | 13 | 0.2% |
| Scotch-Irish | 117 | 1.9% |
| Scottish | 109 | 1.8% |
| Slovak | 136 | 2.2% |
| Swedish | 43 | 0.7% |
| Swiss | 25 | 0.4% |
| Thai | 286 | 4.7% |
| Welsh | 28 | 0.5% | View All 27 Rows |
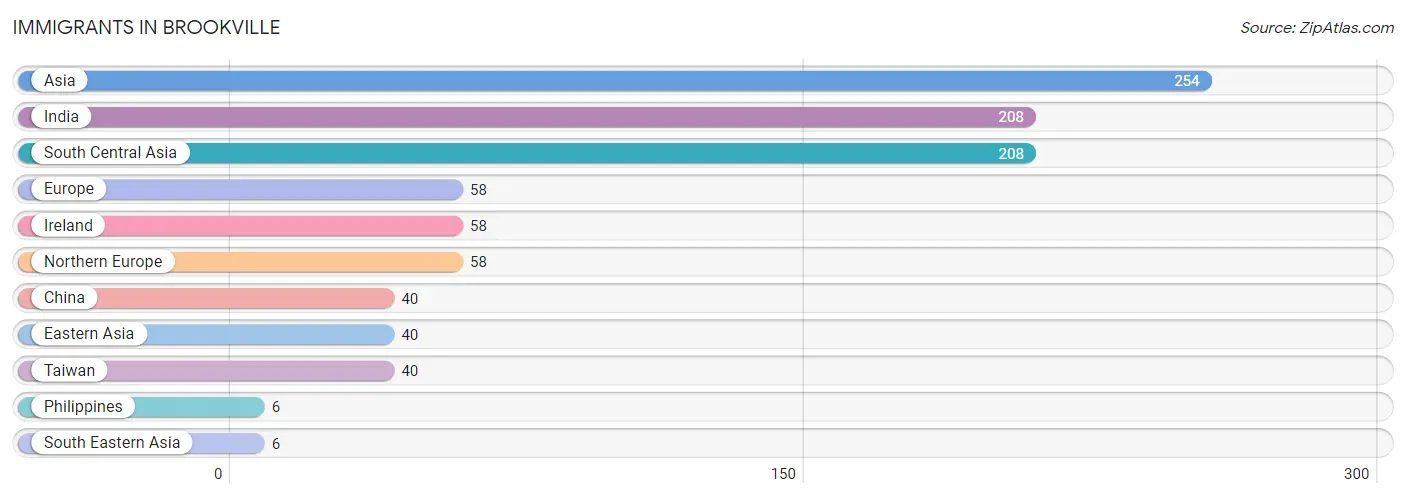
Immigrants in Brookville
The most numerous immigrant groups reported in Brookville came from Asia (254 | 4.2%), India (208 | 3.5%), South Central Asia (208 | 3.5%), Europe (58 | 1.0%), and Ireland (58 | 1.0%), together accounting for 13.0% of all Brookville residents.
| Immigration Origin | # Population | % Population |
| Asia | 254 | 4.2% |
| China | 40 | 0.7% |
| Eastern Asia | 40 | 0.7% |
| Europe | 58 | 1.0% |
| India | 208 | 3.5% |
| Ireland | 58 | 1.0% |
| Northern Europe | 58 | 1.0% |
| Philippines | 6 | 0.1% |
| South Central Asia | 208 | 3.5% |
| South Eastern Asia | 6 | 0.1% |
| Taiwan | 40 | 0.7% | View All 11 Rows |
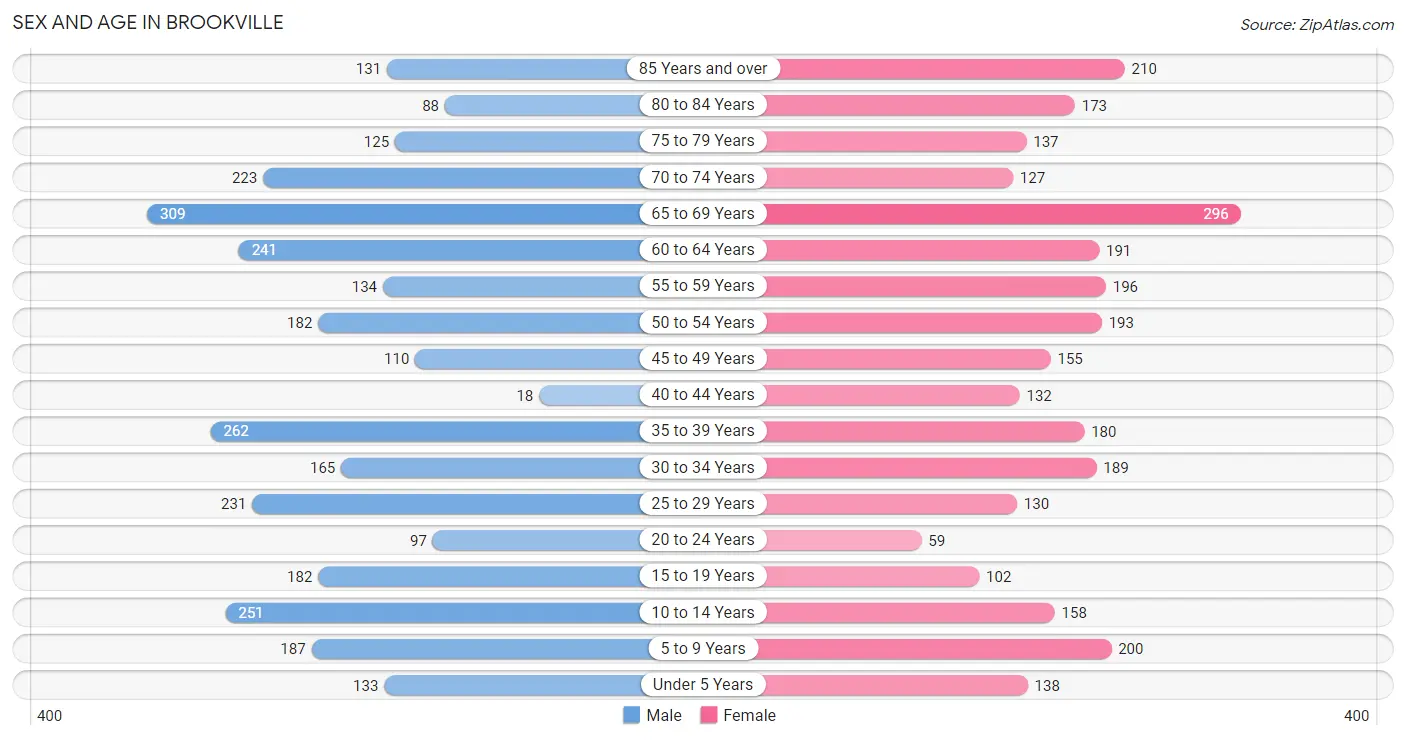
Sex and Age in Brookville
Sex and Age in Brookville
The most populous age groups in Brookville are 65 to 69 Years (309 | 10.1%) for men and 65 to 69 Years (296 | 10.0%) for women.
| Age Bracket | Male | Female |
| Under 5 Years | 133 (4.3%) | 138 (4.6%) |
| 5 to 9 Years | 187 (6.1%) | 200 (6.7%) |
| 10 to 14 Years | 251 (8.2%) | 158 (5.3%) |
| 15 to 19 Years | 182 (5.9%) | 102 (3.4%) |
| 20 to 24 Years | 97 (3.2%) | 59 (2.0%) |
| 25 to 29 Years | 231 (7.5%) | 130 (4.4%) |
| 30 to 34 Years | 165 (5.4%) | 189 (6.4%) |
| 35 to 39 Years | 262 (8.5%) | 180 (6.1%) |
| 40 to 44 Years | 18 (0.6%) | 132 (4.4%) |
| 45 to 49 Years | 110 (3.6%) | 155 (5.2%) |
| 50 to 54 Years | 182 (5.9%) | 193 (6.5%) |
| 55 to 59 Years | 134 (4.4%) | 196 (6.6%) |
| 60 to 64 Years | 241 (7.9%) | 191 (6.4%) |
| 65 to 69 Years | 309 (10.1%) | 296 (10.0%) |
| 70 to 74 Years | 223 (7.3%) | 127 (4.3%) |
| 75 to 79 Years | 125 (4.1%) | 137 (4.6%) |
| 80 to 84 Years | 88 (2.9%) | 173 (5.8%) |
| 85 Years and over | 131 (4.3%) | 210 (7.1%) |
| Total | 3,069 (100.0%) | 2,966 (100.0%) |
Families and Households in Brookville
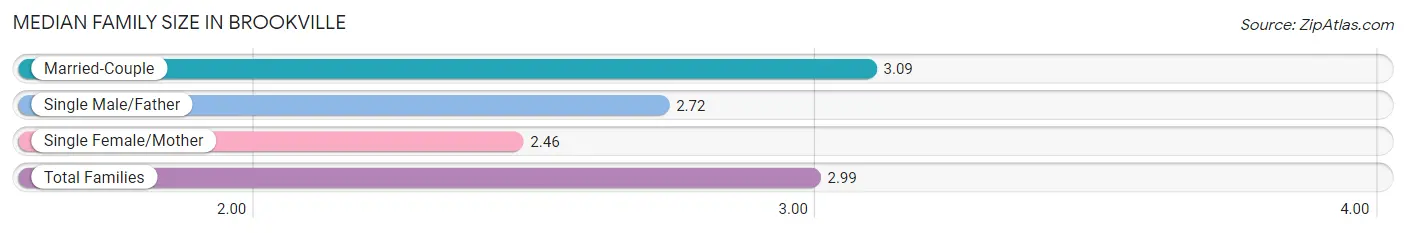
Median Family Size in Brookville
The median family size in Brookville is 2.99 persons per family, with married-couple families (1,286 | 81.4%) accounting for the largest median family size of 3.09 persons per family. On the other hand, single female/mother families (168 | 10.6%) represent the smallest median family size with 2.46 persons per family.
| Family Type | # Families | Family Size |
| Married-Couple | 1,286 (81.4%) | 3.09 |
| Single Male/Father | 125 (7.9%) | 2.72 |
| Single Female/Mother | 168 (10.6%) | 2.46 |
| Total Families | 1,579 (100.0%) | 2.99 |
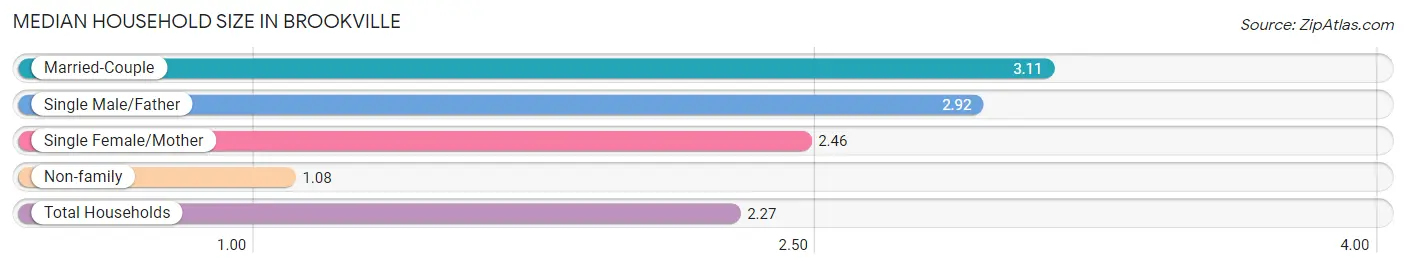
Median Household Size in Brookville
The median household size in Brookville is 2.27 persons per household, with married-couple households (1,286 | 49.8%) accounting for the largest median household size of 3.11 persons per household. non-family households (1,003 | 38.9%) represent the smallest median household size with 1.08 persons per household.
| Household Type | # Households | Household Size |
| Married-Couple | 1,286 (49.8%) | 3.11 |
| Single Male/Father | 125 (4.8%) | 2.92 |
| Single Female/Mother | 168 (6.5%) | 2.46 |
| Non-family | 1,003 (38.9%) | 1.08 |
| Total Households | 2,582 (100.0%) | 2.27 |
Household Size by Marriage Status in Brookville
Out of a total of 2,582 households in Brookville, 1,579 (61.2%) are family households, while 1,003 (38.9%) are nonfamily households. The most numerous type of family households are 2-person households, comprising 893, and the most common type of nonfamily households are 1-person households, comprising 931.
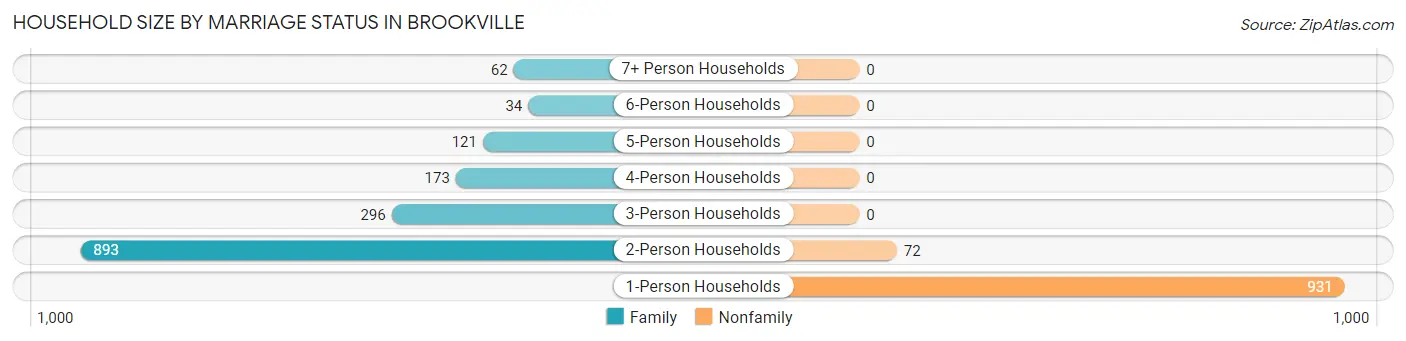
| Household Size | Family Households | Nonfamily Households |
| 1-Person Households | - | 931 (36.1%) |
| 2-Person Households | 893 (34.6%) | 72 (2.8%) |
| 3-Person Households | 296 (11.5%) | 0 (0.0%) |
| 4-Person Households | 173 (6.7%) | 0 (0.0%) |
| 5-Person Households | 121 (4.7%) | 0 (0.0%) |
| 6-Person Households | 34 (1.3%) | 0 (0.0%) |
| 7+ Person Households | 62 (2.4%) | 0 (0.0%) |
| Total | 1,579 (61.2%) | 1,003 (38.9%) |
Female Fertility in Brookville
Fertility by Age in Brookville
Average fertility rate in Brookville is 95.0 births per 1,000 women. Women in the age bracket of 15 to 19 years have the highest fertility rate with 196.0 births per 1,000 women. Women in the age bracket of 35 to 50 years acount for 45.3% of all women with births.
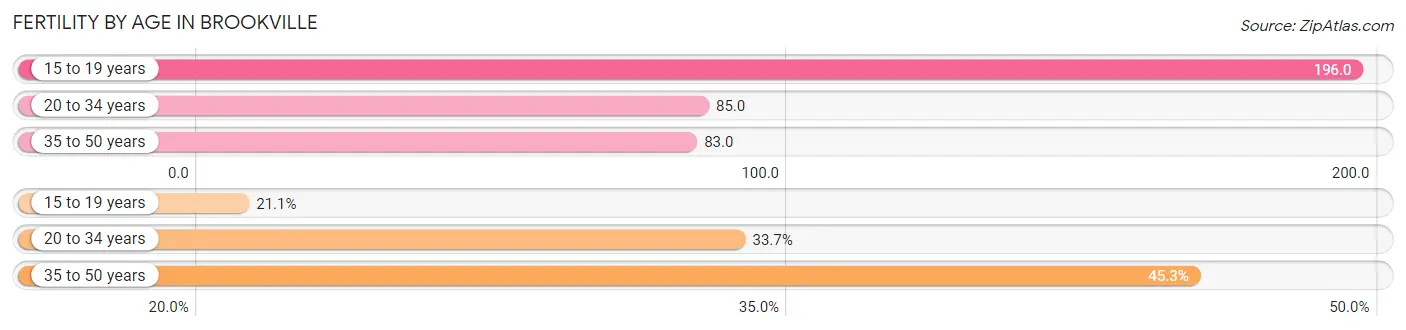
| Age Bracket | Women with Births | Births / 1,000 Women |
| 15 to 19 years | 20 (21.0%) | 196.0 |
| 20 to 34 years | 32 (33.7%) | 85.0 |
| 35 to 50 years | 43 (45.3%) | 83.0 |
| Total | 95 (100.0%) | 95.0 |
Fertility by Age by Marriage Status in Brookville
78.9% of women with births (95) in Brookville are married. The highest percentage of unmarried women with births falls into 15 to 19 years age bracket with 100.0% of them unmarried at the time of birth, while the lowest percentage of unmarried women with births belong to 20 to 34 years age bracket with 0.0% of them unmarried.
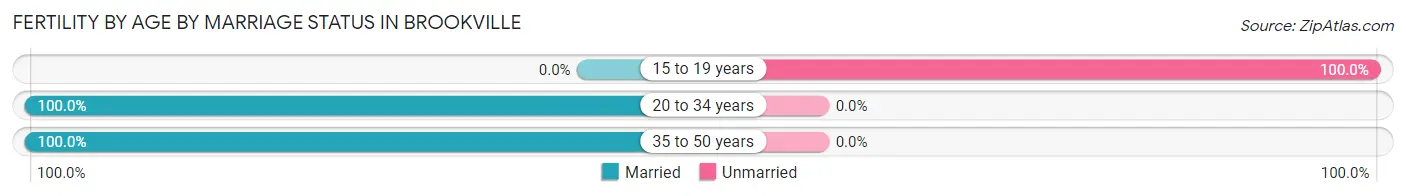
| Age Bracket | Married | Unmarried |
| 15 to 19 years | 0 (0.0%) | 20 (100.0%) |
| 20 to 34 years | 32 (100.0%) | 0 (0.0%) |
| 35 to 50 years | 43 (100.0%) | 0 (0.0%) |
| Total | 75 (78.9%) | 20 (21.0%) |
Fertility by Education in Brookville
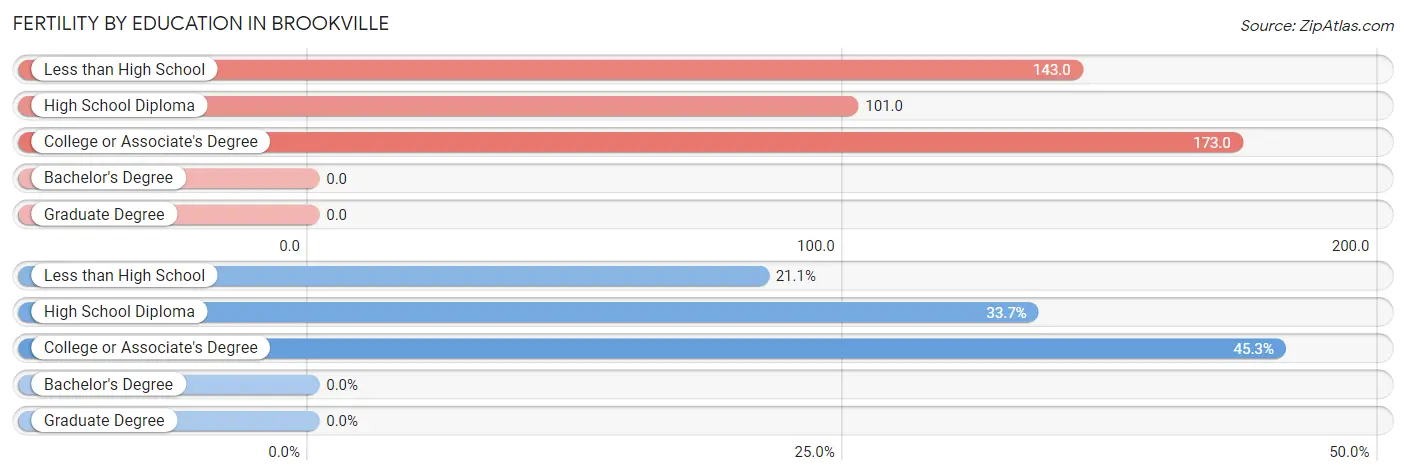
| Educational Attainment | Women with Births | Births / 1,000 Women |
| Less than High School | 20 (21.0%) | 143.0 |
| High School Diploma | 32 (33.7%) | 101.0 |
| College or Associate's Degree | 43 (45.3%) | 173.0 |
| Bachelor's Degree | 0 (0.0%) | 0.0 |
| Graduate Degree | 0 (0.0%) | 0.0 |
| Total | 95 (100.0%) | 95.0 |
Fertility by Education by Marriage Status in Brookville
21.0% of women with births in Brookville are unmarried. Women with the educational attainment of high school diploma are most likely to be married with 100.0% of them married at childbirth, while women with the educational attainment of less than high school are least likely to be married with 100.0% of them unmarried at childbirth.
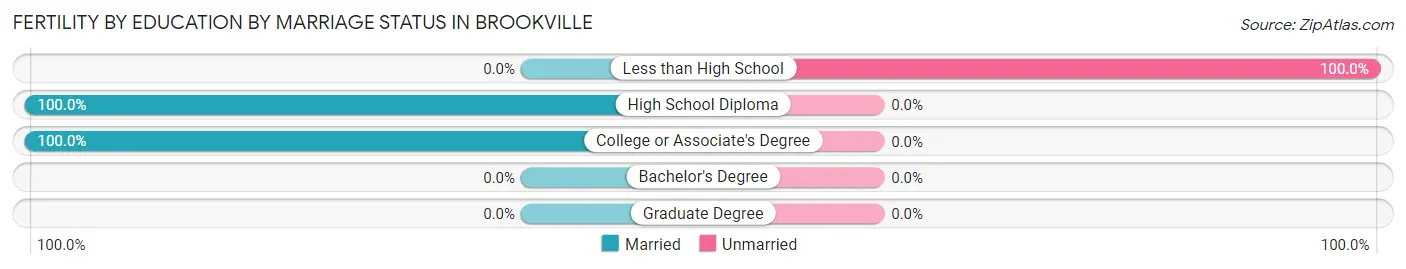
| Educational Attainment | Married | Unmarried |
| Less than High School | 0 (0.0%) | 20 (100.0%) |
| High School Diploma | 32 (100.0%) | 0 (0.0%) |
| College or Associate's Degree | 43 (100.0%) | 0 (0.0%) |
| Bachelor's Degree | 0 (0.0%) | 0 (0.0%) |
| Graduate Degree | 0 (0.0%) | 0 (0.0%) |
| Total | 75 (78.9%) | 20 (21.0%) |
Employment Characteristics in Brookville
Employment by Class of Employer in Brookville
Among the 2,533 employed individuals in Brookville, private company employees (1,804 | 71.2%), local government employees (224 | 8.8%), and not-for-profit organizations (194 | 7.7%) make up the most common classes of employment.
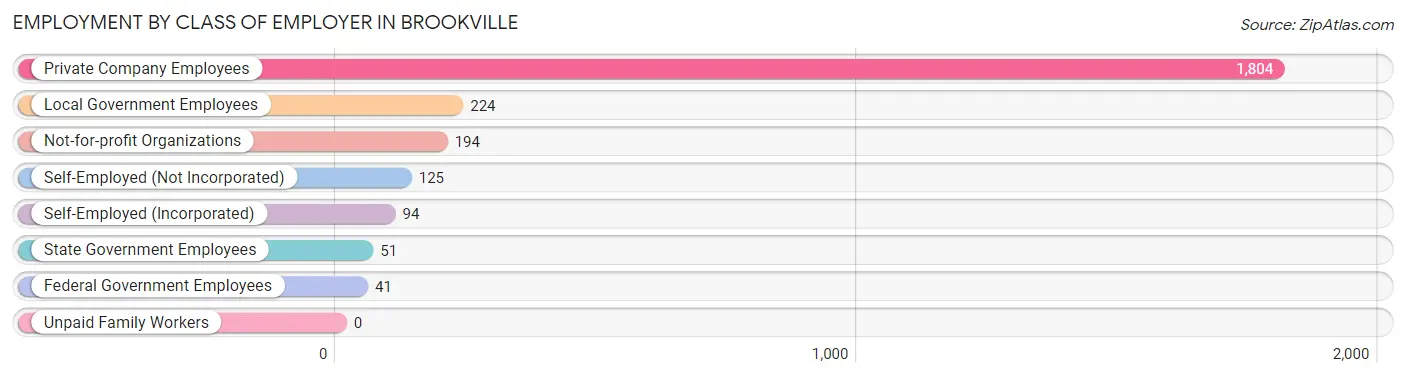
| Employer Class | # Employees | % Employees |
| Private Company Employees | 1,804 | 71.2% |
| Self-Employed (Incorporated) | 94 | 3.7% |
| Self-Employed (Not Incorporated) | 125 | 4.9% |
| Not-for-profit Organizations | 194 | 7.7% |
| Local Government Employees | 224 | 8.8% |
| State Government Employees | 51 | 2.0% |
| Federal Government Employees | 41 | 1.6% |
| Unpaid Family Workers | 0 | 0.0% |
| Total | 2,533 | 100.0% |
Employment Status by Age in Brookville
According to the labor force statistics for Brookville, out of the total population over 16 years of age (4,928), 54.6% or 2,691 individuals are in the labor force, with 3.2% or 86 of them unemployed. The age group with the highest labor force participation rate is 20 to 24 years, with 100.0% or 156 individuals in the labor force. Within the labor force, the 20 to 24 years age range has the highest percentage of unemployed individuals, with 16.7% or 26 of them being unemployed.
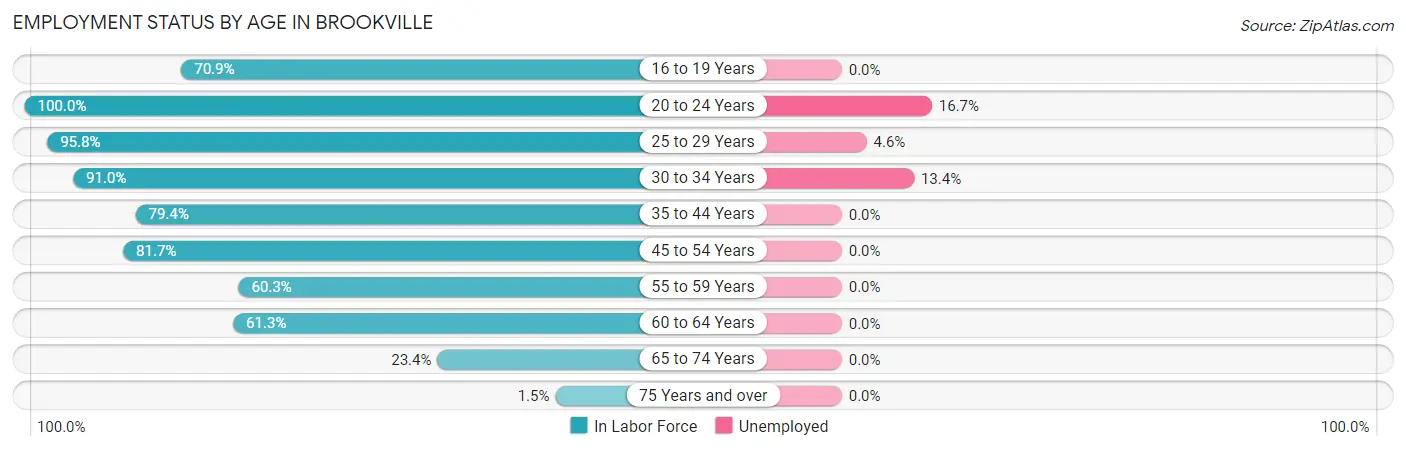
| Age Bracket | In Labor Force | Unemployed |
| 16 to 19 Years | 173 (70.9%) | 0 (0.0%) |
| 20 to 24 Years | 156 (100.0%) | 26 (16.7%) |
| 25 to 29 Years | 346 (95.8%) | 16 (4.6%) |
| 30 to 34 Years | 322 (91.0%) | 43 (13.4%) |
| 35 to 44 Years | 470 (79.4%) | 0 (0.0%) |
| 45 to 54 Years | 523 (81.7%) | 0 (0.0%) |
| 55 to 59 Years | 199 (60.3%) | 0 (0.0%) |
| 60 to 64 Years | 265 (61.3%) | 0 (0.0%) |
| 65 to 74 Years | 223 (23.4%) | 0 (0.0%) |
| 75 Years and over | 13 (1.5%) | 0 (0.0%) |
| Total | 2,691 (54.6%) | 86 (3.2%) |
Employment Status by Educational Attainment in Brookville
According to labor force statistics for Brookville, 78.4% of individuals (2,124) out of the total population between 25 and 64 years of age (2,709) are in the labor force, with 2.8% or 59 of them being unemployed. The group with the highest labor force participation rate are those with the educational attainment of bachelor's degree or higher, with 87.1% or 634 individuals in the labor force. Within the labor force, individuals with college / associate degree education have the highest percentage of unemployment, with 7.6% or 43 of them being unemployed.
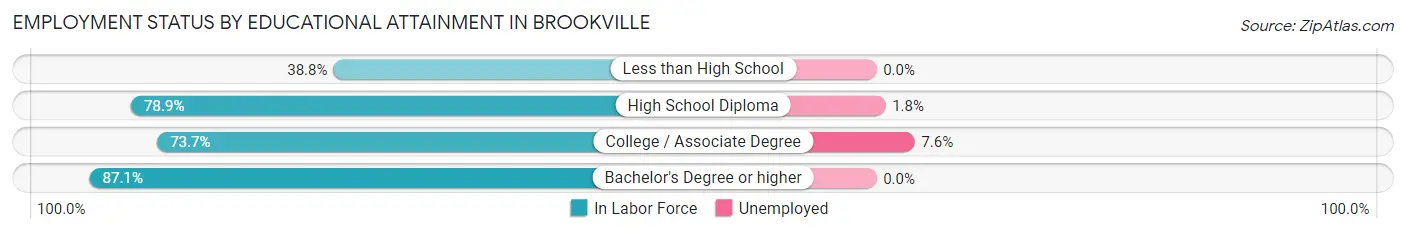
| Educational Attainment | In Labor Force | Unemployed |
| Less than High School | 31 (38.8%) | 0 (0.0%) |
| High School Diploma | 894 (78.9%) | 20 (1.8%) |
| College / Associate Degree | 566 (73.7%) | 58 (7.6%) |
| Bachelor's Degree or higher | 634 (87.1%) | 0 (0.0%) |
| Total | 2,124 (78.4%) | 76 (2.8%) |
Employment Occupations by Sex in Brookville
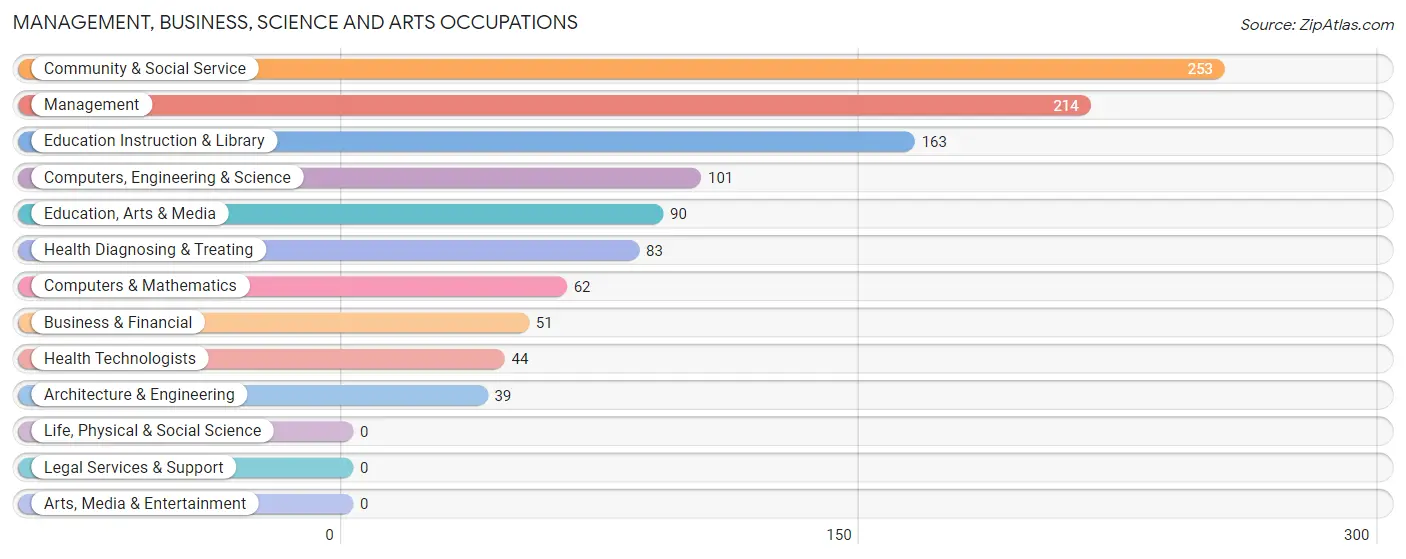
Management, Business, Science and Arts Occupations
The most common Management, Business, Science and Arts occupations in Brookville are Community & Social Service (253 | 9.7%), Management (214 | 8.2%), Education Instruction & Library (163 | 6.3%), Computers, Engineering & Science (101 | 3.9%), and Education, Arts & Media (90 | 3.5%).
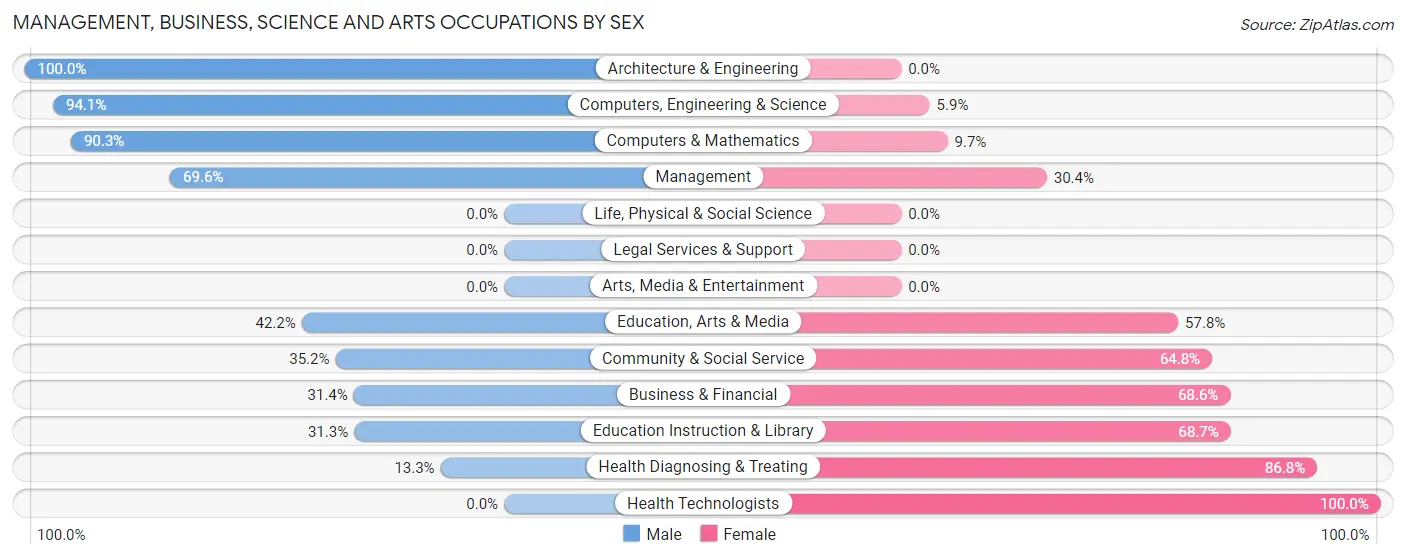
Management, Business, Science and Arts Occupations by Sex
Within the Management, Business, Science and Arts occupations in Brookville, the most male-oriented occupations are Architecture & Engineering (100.0%), Computers, Engineering & Science (94.1%), and Computers & Mathematics (90.3%), while the most female-oriented occupations are Health Technologists (100.0%), Health Diagnosing & Treating (86.8%), and Education Instruction & Library (68.7%).
| Occupation | Male | Female |
| Management | 149 (69.6%) | 65 (30.4%) |
| Business & Financial | 16 (31.4%) | 35 (68.6%) |
| Computers, Engineering & Science | 95 (94.1%) | 6 (5.9%) |
| Computers & Mathematics | 56 (90.3%) | 6 (9.7%) |
| Architecture & Engineering | 39 (100.0%) | 0 (0.0%) |
| Life, Physical & Social Science | 0 (0.0%) | 0 (0.0%) |
| Community & Social Service | 89 (35.2%) | 164 (64.8%) |
| Education, Arts & Media | 38 (42.2%) | 52 (57.8%) |
| Legal Services & Support | 0 (0.0%) | 0 (0.0%) |
| Education Instruction & Library | 51 (31.3%) | 112 (68.7%) |
| Arts, Media & Entertainment | 0 (0.0%) | 0 (0.0%) |
| Health Diagnosing & Treating | 11 (13.3%) | 72 (86.8%) |
| Health Technologists | 0 (0.0%) | 44 (100.0%) |
| Total (Category) | 360 (51.3%) | 342 (48.7%) |
| Total (Overall) | 1,410 (54.1%) | 1,195 (45.9%) |
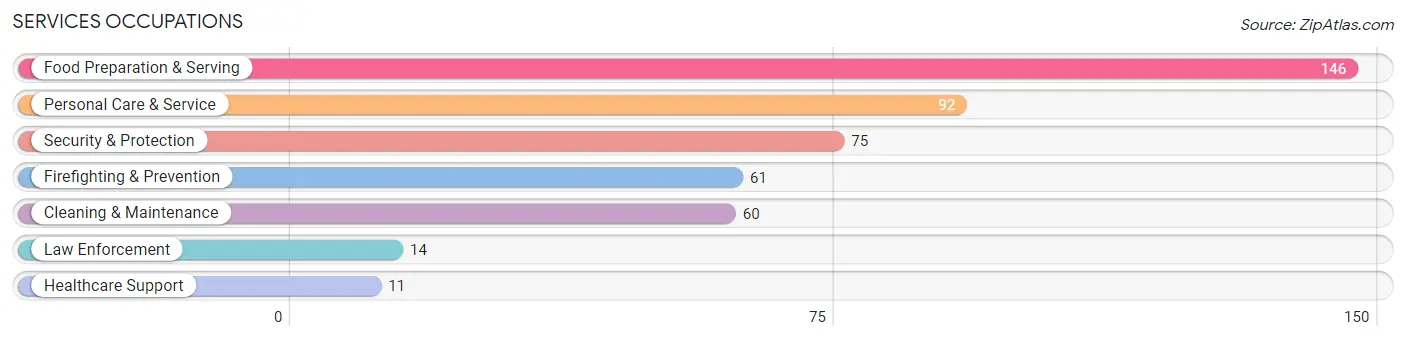
Services Occupations
The most common Services occupations in Brookville are Food Preparation & Serving (146 | 5.6%), Personal Care & Service (92 | 3.5%), Security & Protection (75 | 2.9%), Firefighting & Prevention (61 | 2.3%), and Cleaning & Maintenance (60 | 2.3%).
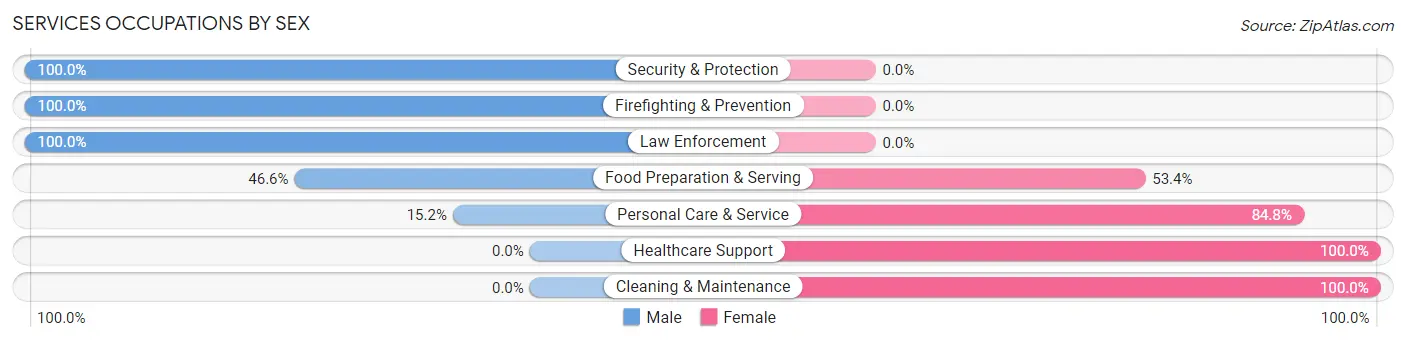
Services Occupations by Sex
Within the Services occupations in Brookville, the most male-oriented occupations are Security & Protection (100.0%), Firefighting & Prevention (100.0%), and Law Enforcement (100.0%), while the most female-oriented occupations are Healthcare Support (100.0%), Cleaning & Maintenance (100.0%), and Personal Care & Service (84.8%).
| Occupation | Male | Female |
| Healthcare Support | 0 (0.0%) | 11 (100.0%) |
| Security & Protection | 75 (100.0%) | 0 (0.0%) |
| Firefighting & Prevention | 61 (100.0%) | 0 (0.0%) |
| Law Enforcement | 14 (100.0%) | 0 (0.0%) |
| Food Preparation & Serving | 68 (46.6%) | 78 (53.4%) |
| Cleaning & Maintenance | 0 (0.0%) | 60 (100.0%) |
| Personal Care & Service | 14 (15.2%) | 78 (84.8%) |
| Total (Category) | 157 (40.9%) | 227 (59.1%) |
| Total (Overall) | 1,410 (54.1%) | 1,195 (45.9%) |
Sales and Office Occupations
The most common Sales and Office occupations in Brookville are Office & Administration (390 | 15.0%), and Sales & Related (262 | 10.1%).

Sales and Office Occupations by Sex
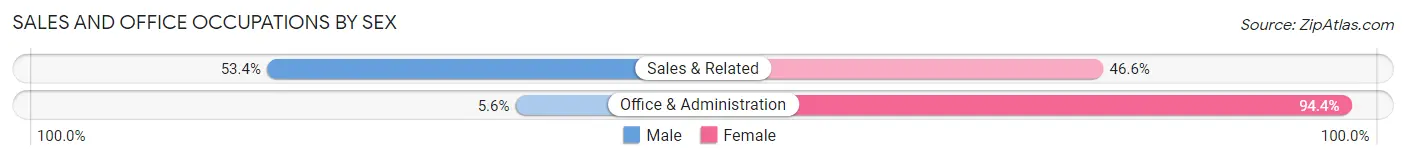
| Occupation | Male | Female |
| Sales & Related | 140 (53.4%) | 122 (46.6%) |
| Office & Administration | 22 (5.6%) | 368 (94.4%) |
| Total (Category) | 162 (24.8%) | 490 (75.1%) |
| Total (Overall) | 1,410 (54.1%) | 1,195 (45.9%) |
Natural Resources, Construction and Maintenance Occupations
The most common Natural Resources, Construction and Maintenance occupations in Brookville are Installation, Maintenance & Repair (169 | 6.5%), and Construction & Extraction (95 | 3.6%).

Natural Resources, Construction and Maintenance Occupations by Sex
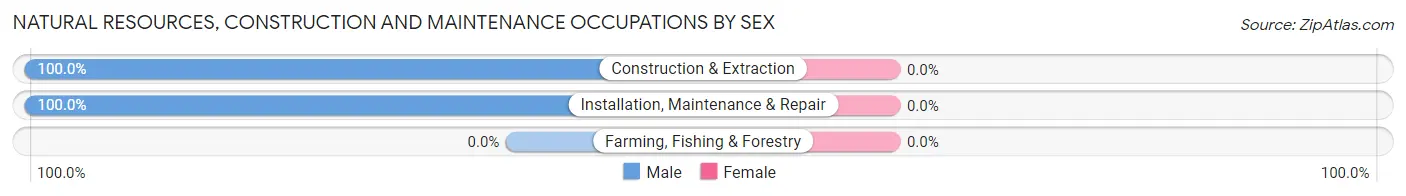
| Occupation | Male | Female |
| Farming, Fishing & Forestry | 0 (0.0%) | 0 (0.0%) |
| Construction & Extraction | 95 (100.0%) | 0 (0.0%) |
| Installation, Maintenance & Repair | 169 (100.0%) | 0 (0.0%) |
| Total (Category) | 264 (100.0%) | 0 (0.0%) |
| Total (Overall) | 1,410 (54.1%) | 1,195 (45.9%) |
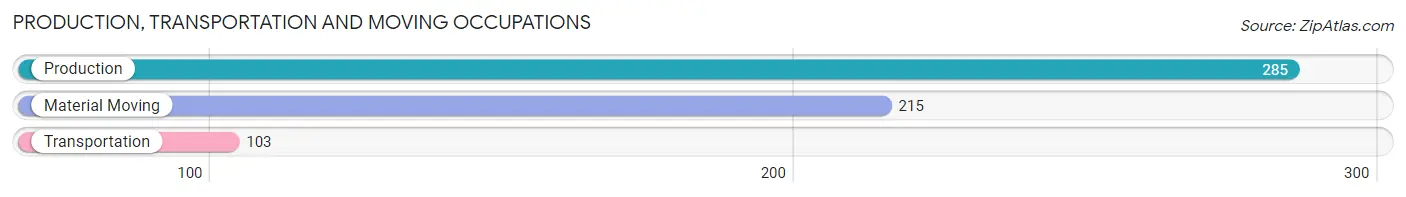
Production, Transportation and Moving Occupations
The most common Production, Transportation and Moving occupations in Brookville are Production (285 | 10.9%), Material Moving (215 | 8.3%), and Transportation (103 | 4.0%).
Production, Transportation and Moving Occupations by Sex
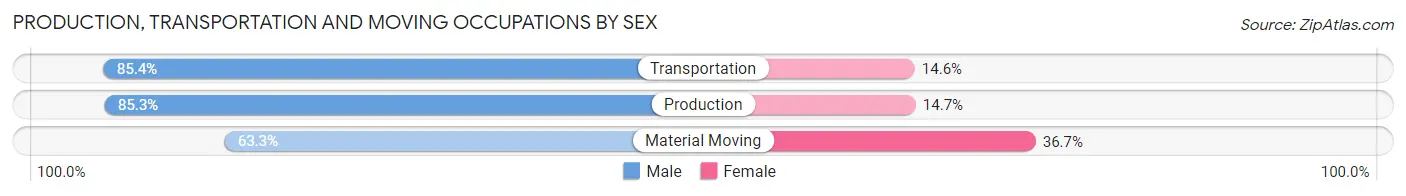
| Occupation | Male | Female |
| Production | 243 (85.3%) | 42 (14.7%) |
| Transportation | 88 (85.4%) | 15 (14.6%) |
| Material Moving | 136 (63.3%) | 79 (36.7%) |
| Total (Category) | 467 (77.4%) | 136 (22.6%) |
| Total (Overall) | 1,410 (54.1%) | 1,195 (45.9%) |
Employment Industries by Sex in Brookville
Employment Industries in Brookville
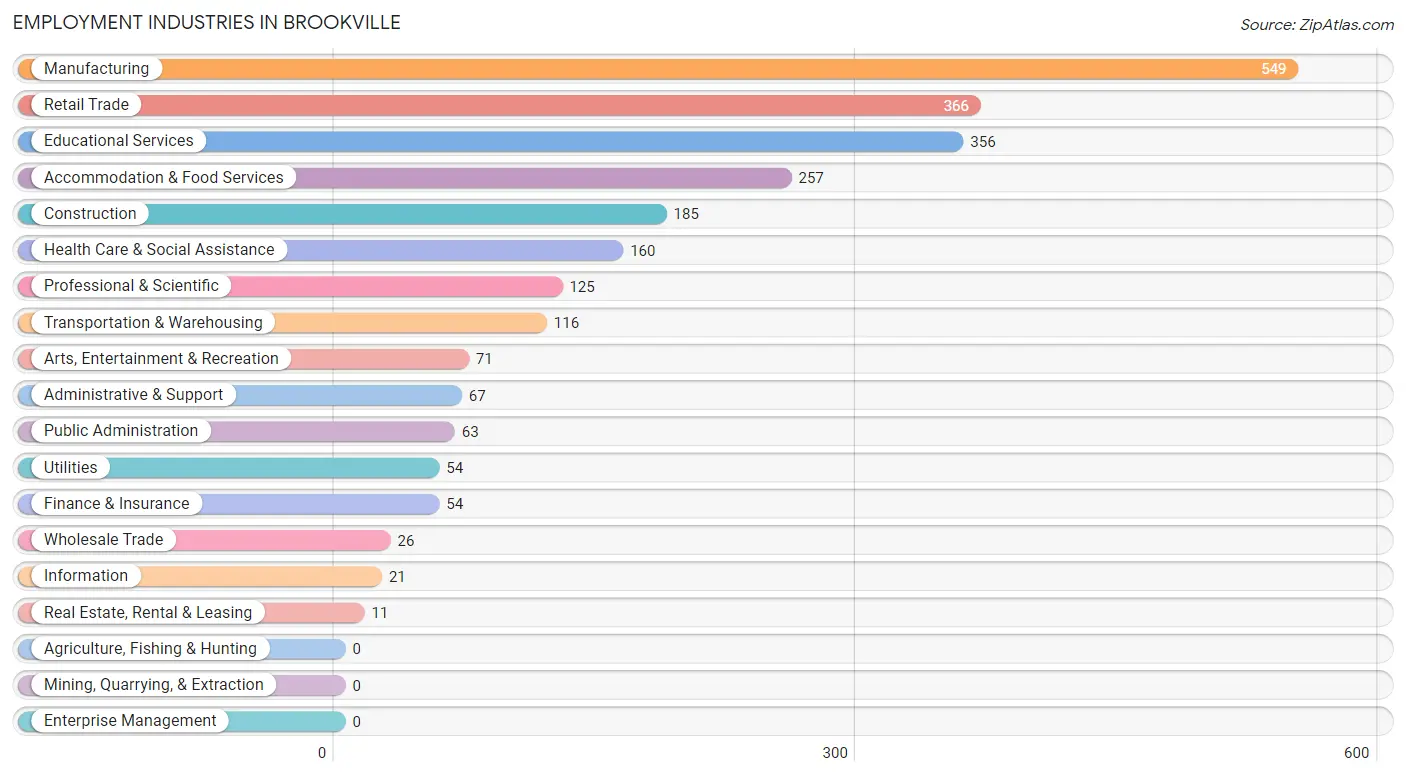
The major employment industries in Brookville include Manufacturing (549 | 21.1%), Retail Trade (366 | 14.1%), Educational Services (356 | 13.7%), Accommodation & Food Services (257 | 9.9%), and Construction (185 | 7.1%).
Employment Industries by Sex in Brookville
The Brookville industries that see more men than women are Transportation & Warehousing (100.0%), Utilities (100.0%), and Real Estate, Rental & Leasing (100.0%), whereas the industries that tend to have a higher number of women are Wholesale Trade (100.0%), Health Care & Social Assistance (100.0%), and Finance & Insurance (83.3%).
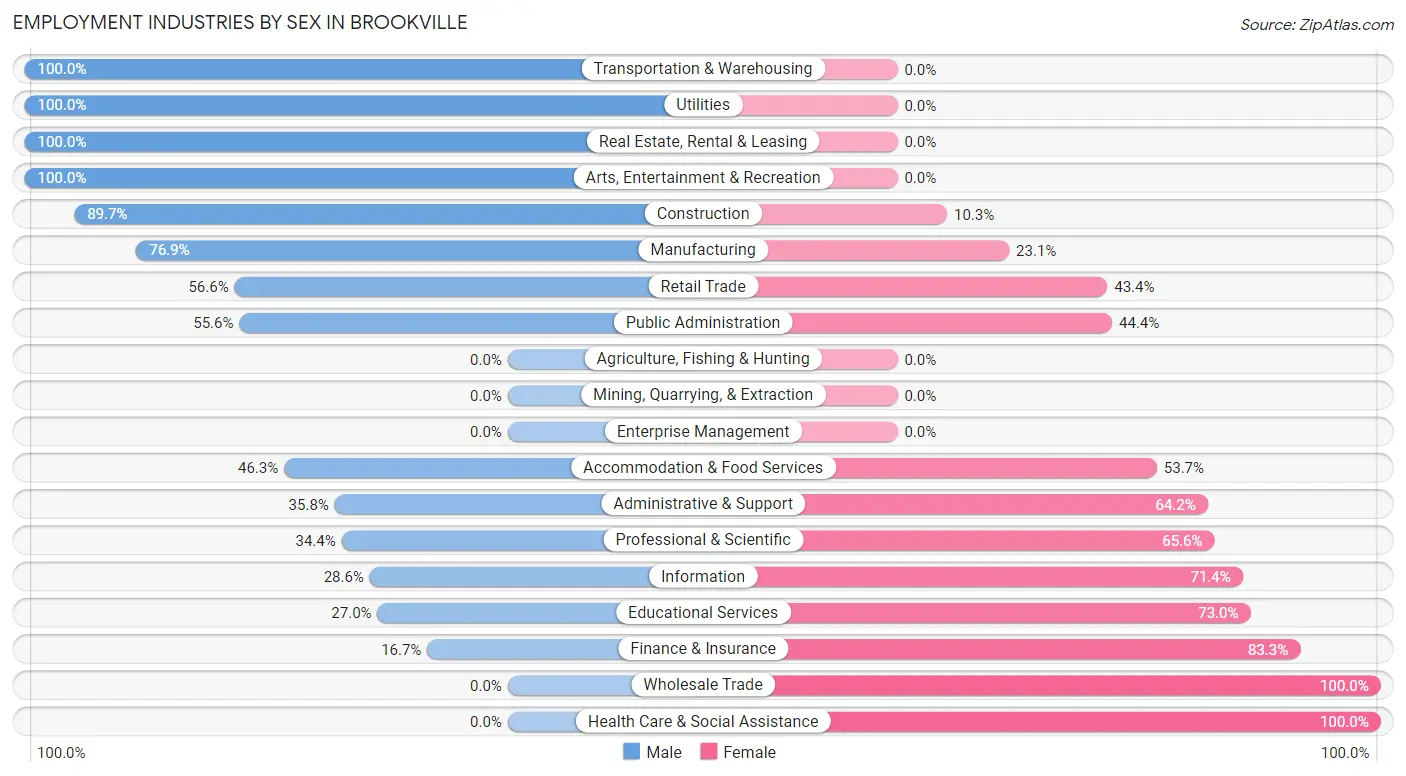
| Industry | Male | Female |
| Agriculture, Fishing & Hunting | 0 (0.0%) | 0 (0.0%) |
| Mining, Quarrying, & Extraction | 0 (0.0%) | 0 (0.0%) |
| Construction | 166 (89.7%) | 19 (10.3%) |
| Manufacturing | 422 (76.9%) | 127 (23.1%) |
| Wholesale Trade | 0 (0.0%) | 26 (100.0%) |
| Retail Trade | 207 (56.6%) | 159 (43.4%) |
| Transportation & Warehousing | 116 (100.0%) | 0 (0.0%) |
| Utilities | 54 (100.0%) | 0 (0.0%) |
| Information | 6 (28.6%) | 15 (71.4%) |
| Finance & Insurance | 9 (16.7%) | 45 (83.3%) |
| Real Estate, Rental & Leasing | 11 (100.0%) | 0 (0.0%) |
| Professional & Scientific | 43 (34.4%) | 82 (65.6%) |
| Enterprise Management | 0 (0.0%) | 0 (0.0%) |
| Administrative & Support | 24 (35.8%) | 43 (64.2%) |
| Educational Services | 96 (27.0%) | 260 (73.0%) |
| Health Care & Social Assistance | 0 (0.0%) | 160 (100.0%) |
| Arts, Entertainment & Recreation | 71 (100.0%) | 0 (0.0%) |
| Accommodation & Food Services | 119 (46.3%) | 138 (53.7%) |
| Public Administration | 35 (55.6%) | 28 (44.4%) |
| Total | 1,410 (54.1%) | 1,195 (45.9%) |
Education in Brookville
School Enrollment in Brookville
The most common levels of schooling among the 1,288 students in Brookville are middle school (373 | 29.0%), high school (258 | 20.0%), and college / undergraduate (215 | 16.7%).
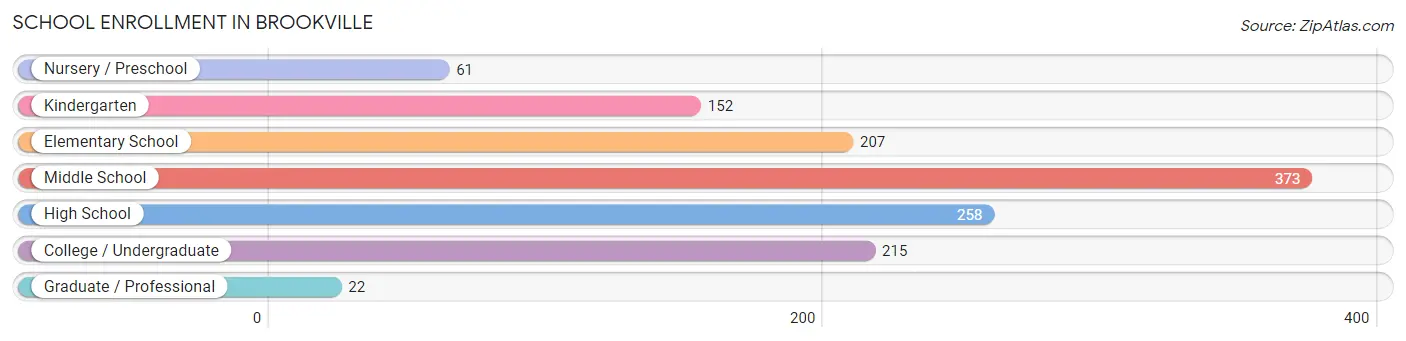
| School Level | # Students | % Students |
| Nursery / Preschool | 61 | 4.7% |
| Kindergarten | 152 | 11.8% |
| Elementary School | 207 | 16.1% |
| Middle School | 373 | 29.0% |
| High School | 258 | 20.0% |
| College / Undergraduate | 215 | 16.7% |
| Graduate / Professional | 22 | 1.7% |
| Total | 1,288 | 100.0% |
School Enrollment by Age by Funding Source in Brookville
Out of a total of 1,288 students who are enrolled in schools in Brookville, 155 (12.0%) attend a private institution, while the remaining 1,133 (88.0%) are enrolled in public schools. The age group of 25 to 34 year olds has the highest likelihood of being enrolled in private schools, with 37 (32.7% in the age bracket) enrolled. Conversely, the age group of 15 to 17 year olds has the lowest likelihood of being enrolled in a private school, with 231 (100.0% in the age bracket) attending a public institution.
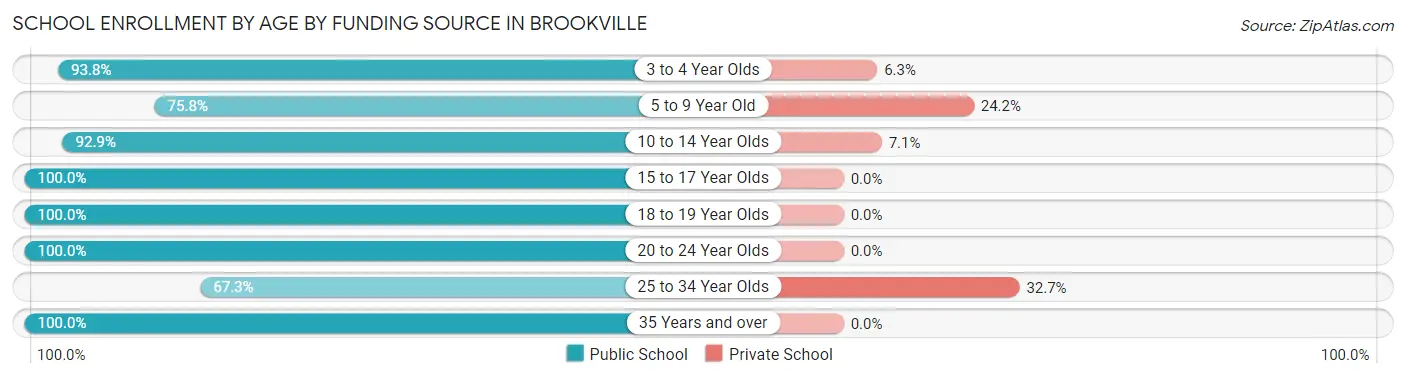
| Age Bracket | Public School | Private School |
| 3 to 4 Year Olds | 30 (93.8%) | 2 (6.2%) |
| 5 to 9 Year Old | 272 (75.8%) | 87 (24.2%) |
| 10 to 14 Year Olds | 380 (92.9%) | 29 (7.1%) |
| 15 to 17 Year Olds | 231 (100.0%) | 0 (0.0%) |
| 18 to 19 Year Olds | 53 (100.0%) | 0 (0.0%) |
| 20 to 24 Year Olds | 34 (100.0%) | 0 (0.0%) |
| 25 to 34 Year Olds | 76 (67.3%) | 37 (32.7%) |
| 35 Years and over | 57 (100.0%) | 0 (0.0%) |
| Total | 1,133 (88.0%) | 155 (12.0%) |
Educational Attainment by Field of Study in Brookville
Business (254 | 22.2%), education (176 | 15.4%), science & technology (168 | 14.7%), liberal arts & history (140 | 12.2%), and bio, nature & agricultural (97 | 8.5%) are the most common fields of study among 1,145 individuals in Brookville who have obtained a bachelor's degree or higher.
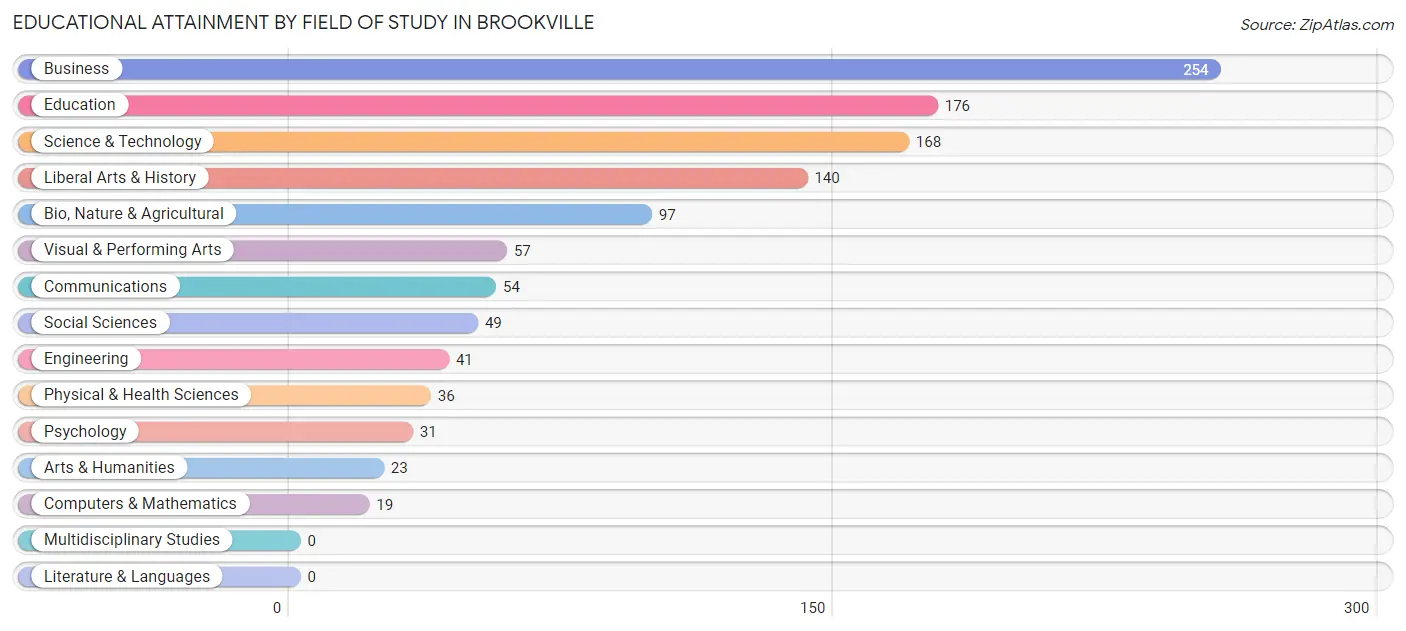
| Field of Study | # Graduates | % Graduates |
| Computers & Mathematics | 19 | 1.7% |
| Bio, Nature & Agricultural | 97 | 8.5% |
| Physical & Health Sciences | 36 | 3.1% |
| Psychology | 31 | 2.7% |
| Social Sciences | 49 | 4.3% |
| Engineering | 41 | 3.6% |
| Multidisciplinary Studies | 0 | 0.0% |
| Science & Technology | 168 | 14.7% |
| Business | 254 | 22.2% |
| Education | 176 | 15.4% |
| Literature & Languages | 0 | 0.0% |
| Liberal Arts & History | 140 | 12.2% |
| Visual & Performing Arts | 57 | 5.0% |
| Communications | 54 | 4.7% |
| Arts & Humanities | 23 | 2.0% |
| Total | 1,145 | 100.0% |
Transportation & Commute in Brookville
Vehicle Availability by Sex in Brookville
The most prevalent vehicle ownership categories in Brookville are males with 2 vehicles (720, accounting for 53.2%) and females with 2 vehicles (625, making up 61.1%).
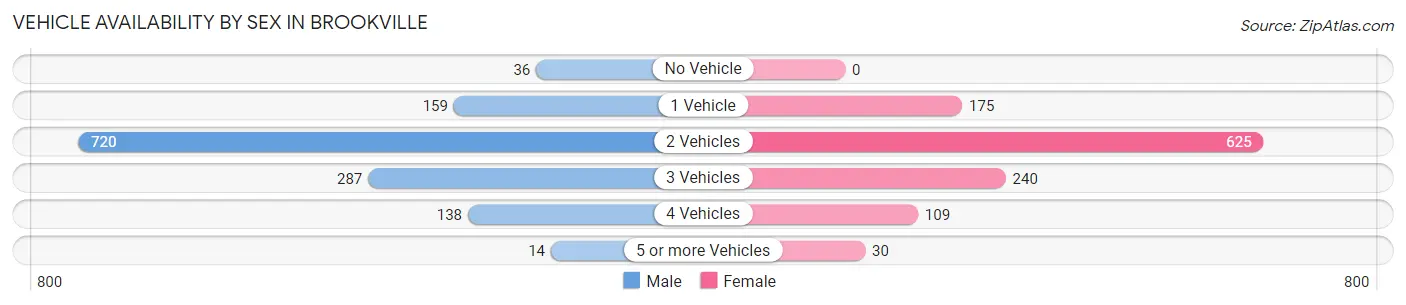
| Vehicles Available | Male | Female |
| No Vehicle | 36 (2.7%) | 0 (0.0%) |
| 1 Vehicle | 159 (11.7%) | 175 (14.8%) |
| 2 Vehicles | 720 (53.2%) | 625 (53.0%) |
| 3 Vehicles | 287 (21.2%) | 240 (20.4%) |
| 4 Vehicles | 138 (10.2%) | 109 (9.2%) |
| 5 or more Vehicles | 14 (1.0%) | 30 (2.5%) |
| Total | 1,354 (100.0%) | 1,179 (100.0%) |
Commute Time in Brookville
The most frequently occuring commute durations in Brookville are 15 to 19 minutes (472 commuters, 19.3%), 5 to 9 minutes (278 commuters, 11.4%), and 20 to 24 minutes (249 commuters, 10.2%).
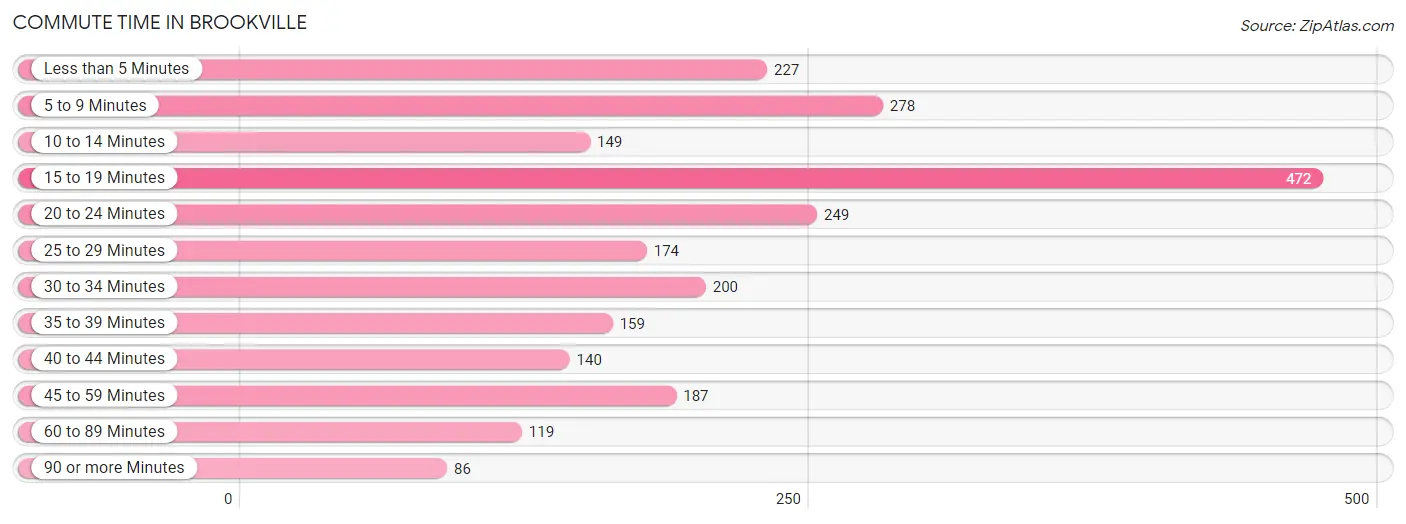
| Commute Time | # Commuters | % Commuters |
| Less than 5 Minutes | 227 | 9.3% |
| 5 to 9 Minutes | 278 | 11.4% |
| 10 to 14 Minutes | 149 | 6.1% |
| 15 to 19 Minutes | 472 | 19.3% |
| 20 to 24 Minutes | 249 | 10.2% |
| 25 to 29 Minutes | 174 | 7.1% |
| 30 to 34 Minutes | 200 | 8.2% |
| 35 to 39 Minutes | 159 | 6.5% |
| 40 to 44 Minutes | 140 | 5.7% |
| 45 to 59 Minutes | 187 | 7.7% |
| 60 to 89 Minutes | 119 | 4.9% |
| 90 or more Minutes | 86 | 3.5% |
Commute Time by Sex in Brookville
The most common commute times in Brookville are 15 to 19 minutes (225 commuters, 17.7%) for males and 15 to 19 minutes (247 commuters, 21.1%) for females.
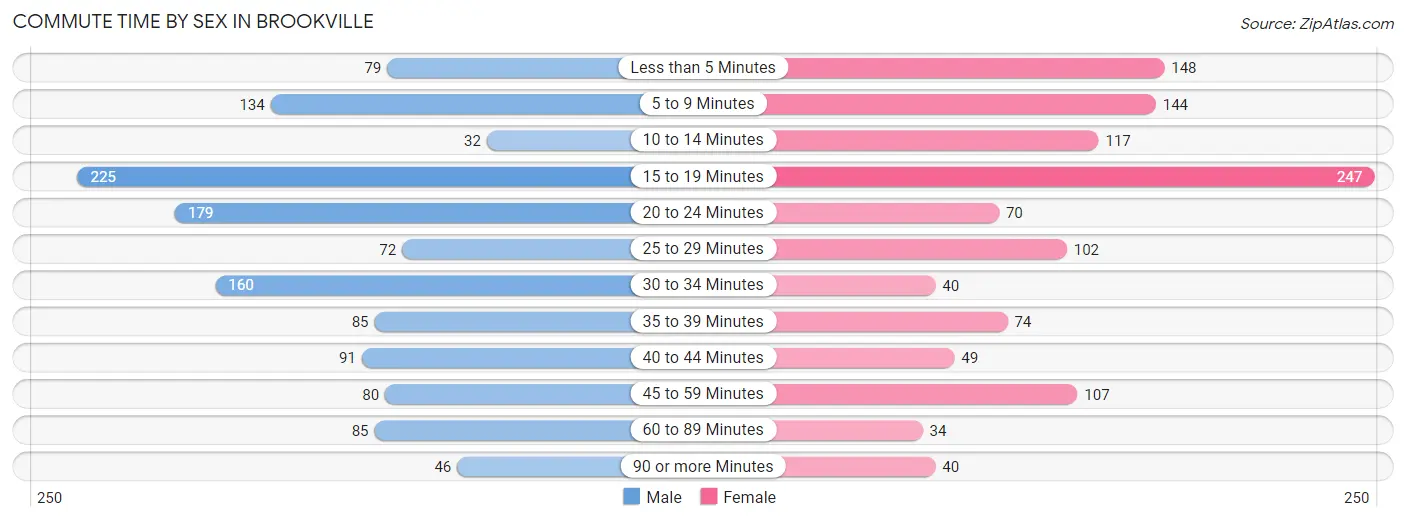
| Commute Time | Male | Female |
| Less than 5 Minutes | 79 (6.2%) | 148 (12.6%) |
| 5 to 9 Minutes | 134 (10.6%) | 144 (12.3%) |
| 10 to 14 Minutes | 32 (2.5%) | 117 (10.0%) |
| 15 to 19 Minutes | 225 (17.7%) | 247 (21.1%) |
| 20 to 24 Minutes | 179 (14.1%) | 70 (6.0%) |
| 25 to 29 Minutes | 72 (5.7%) | 102 (8.7%) |
| 30 to 34 Minutes | 160 (12.6%) | 40 (3.4%) |
| 35 to 39 Minutes | 85 (6.7%) | 74 (6.3%) |
| 40 to 44 Minutes | 91 (7.2%) | 49 (4.2%) |
| 45 to 59 Minutes | 80 (6.3%) | 107 (9.1%) |
| 60 to 89 Minutes | 85 (6.7%) | 34 (2.9%) |
| 90 or more Minutes | 46 (3.6%) | 40 (3.4%) |
Time of Departure to Work by Sex in Brookville
The most frequent times of departure to work in Brookville are 6:00 AM to 6:29 AM (329, 26.0%) for males and 7:00 AM to 7:29 AM (219, 18.7%) for females.
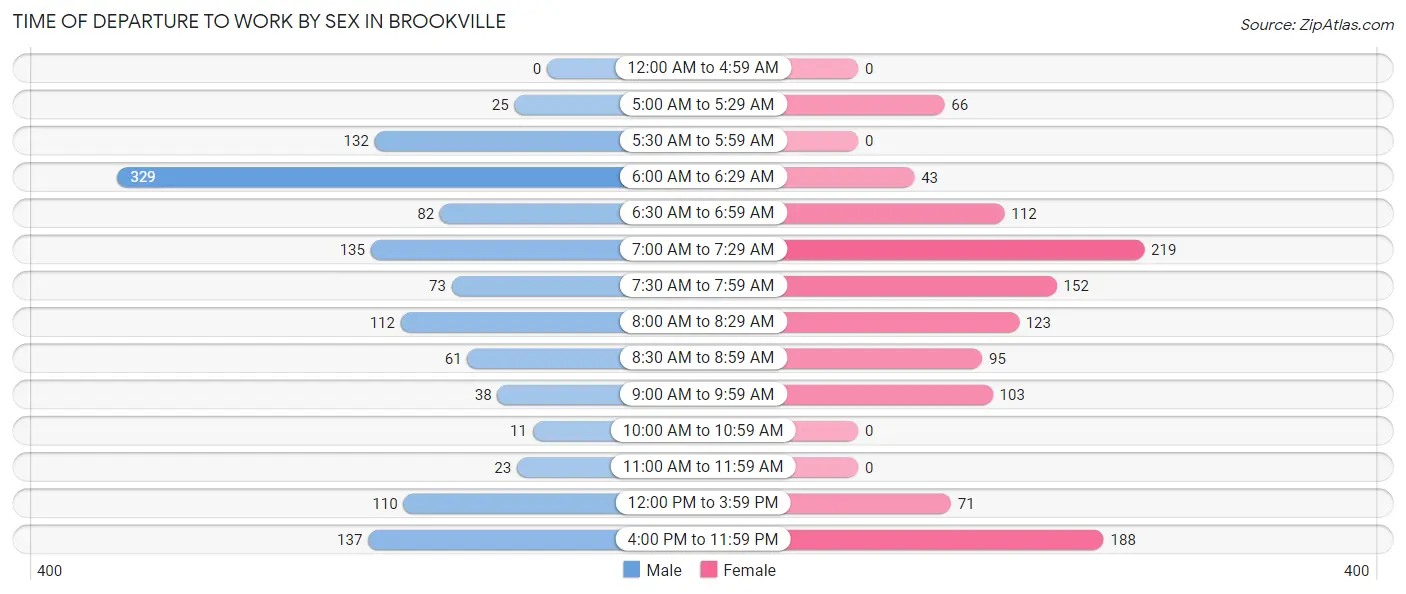
| Time of Departure | Male | Female |
| 12:00 AM to 4:59 AM | 0 (0.0%) | 0 (0.0%) |
| 5:00 AM to 5:29 AM | 25 (2.0%) | 66 (5.6%) |
| 5:30 AM to 5:59 AM | 132 (10.4%) | 0 (0.0%) |
| 6:00 AM to 6:29 AM | 329 (26.0%) | 43 (3.7%) |
| 6:30 AM to 6:59 AM | 82 (6.5%) | 112 (9.6%) |
| 7:00 AM to 7:29 AM | 135 (10.6%) | 219 (18.7%) |
| 7:30 AM to 7:59 AM | 73 (5.8%) | 152 (13.0%) |
| 8:00 AM to 8:29 AM | 112 (8.8%) | 123 (10.5%) |
| 8:30 AM to 8:59 AM | 61 (4.8%) | 95 (8.1%) |
| 9:00 AM to 9:59 AM | 38 (3.0%) | 103 (8.8%) |
| 10:00 AM to 10:59 AM | 11 (0.9%) | 0 (0.0%) |
| 11:00 AM to 11:59 AM | 23 (1.8%) | 0 (0.0%) |
| 12:00 PM to 3:59 PM | 110 (8.7%) | 71 (6.1%) |
| 4:00 PM to 11:59 PM | 137 (10.8%) | 188 (16.0%) |
| Total | 1,268 (100.0%) | 1,172 (100.0%) |
Housing Occupancy in Brookville
Occupancy by Ownership in Brookville
Of the total 2,582 dwellings in Brookville, owner-occupied units account for 1,646 (63.7%), while renter-occupied units make up 936 (36.2%).
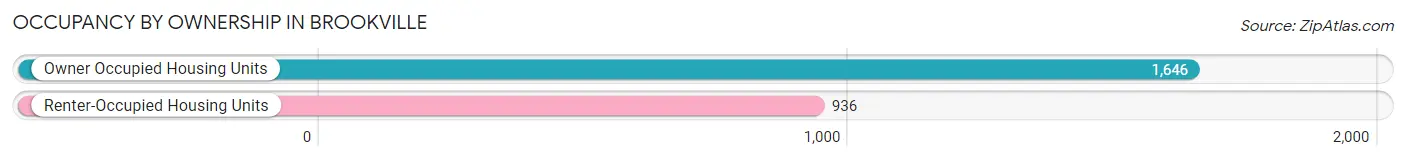
| Occupancy | # Housing Units | % Housing Units |
| Owner Occupied Housing Units | 1,646 | 63.7% |
| Renter-Occupied Housing Units | 936 | 36.2% |
| Total Occupied Housing Units | 2,582 | 100.0% |
Occupancy by Household Size in Brookville
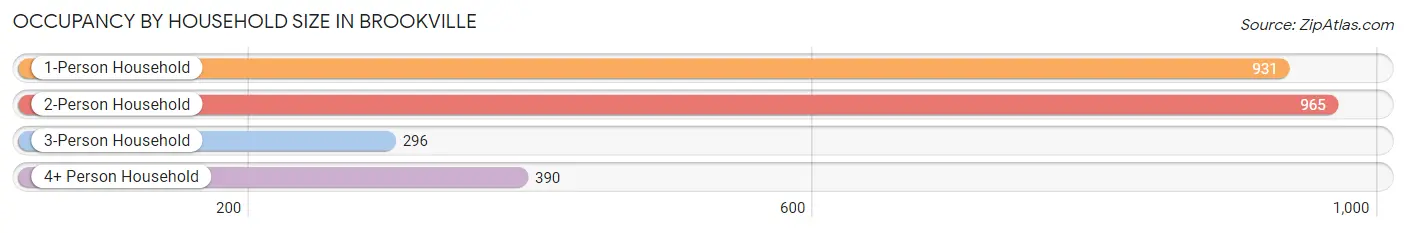
| Household Size | # Housing Units | % Housing Units |
| 1-Person Household | 931 | 36.1% |
| 2-Person Household | 965 | 37.4% |
| 3-Person Household | 296 | 11.5% |
| 4+ Person Household | 390 | 15.1% |
| Total Housing Units | 2,582 | 100.0% |
Occupancy by Ownership by Household Size in Brookville
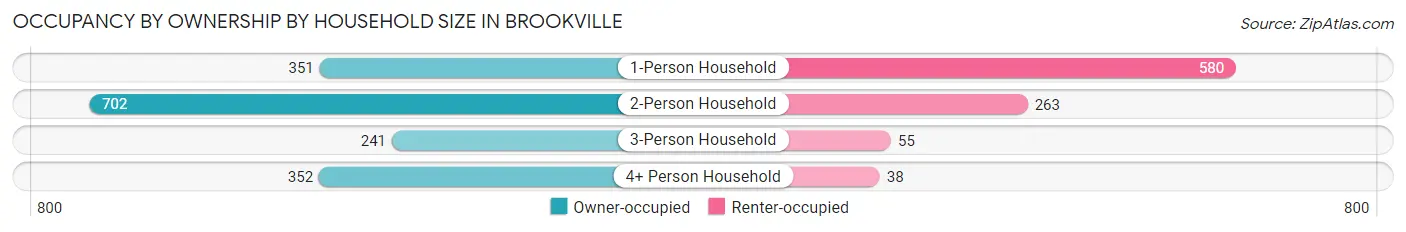
| Household Size | Owner-occupied | Renter-occupied |
| 1-Person Household | 351 (37.7%) | 580 (62.3%) |
| 2-Person Household | 702 (72.8%) | 263 (27.3%) |
| 3-Person Household | 241 (81.4%) | 55 (18.6%) |
| 4+ Person Household | 352 (90.3%) | 38 (9.7%) |
| Total Housing Units | 1,646 (63.7%) | 936 (36.2%) |
Occupancy by Educational Attainment in Brookville
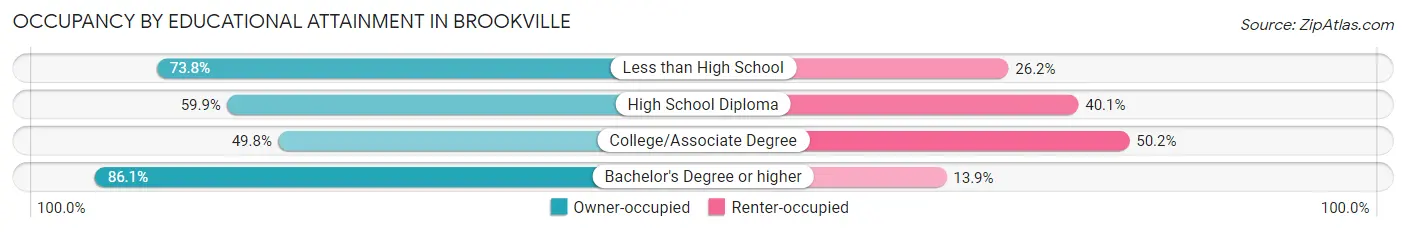
| Household Size | Owner-occupied | Renter-occupied |
| Less than High School | 76 (73.8%) | 27 (26.2%) |
| High School Diploma | 643 (59.9%) | 430 (40.1%) |
| College/Associate Degree | 389 (49.8%) | 392 (50.2%) |
| Bachelor's Degree or higher | 538 (86.1%) | 87 (13.9%) |
Occupancy by Age of Householder in Brookville
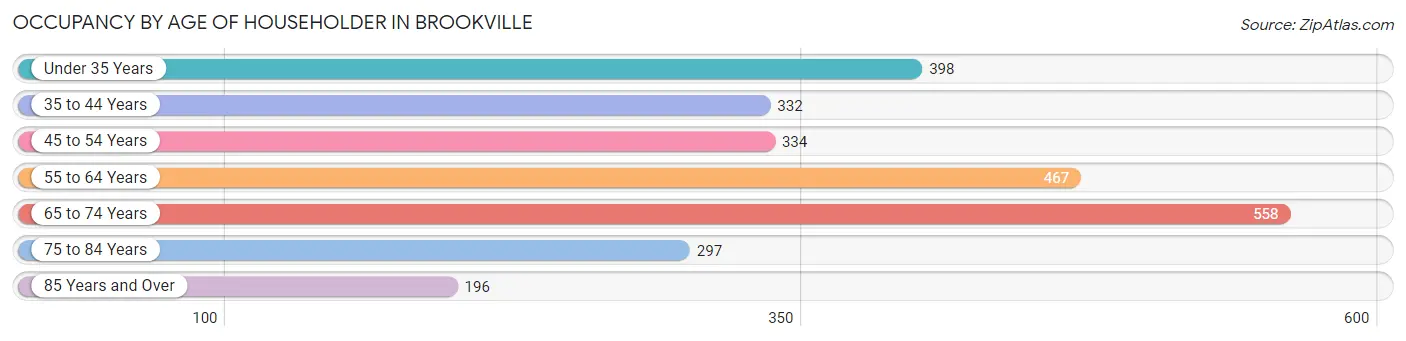
| Age Bracket | # Households | % Households |
| Under 35 Years | 398 | 15.4% |
| 35 to 44 Years | 332 | 12.9% |
| 45 to 54 Years | 334 | 12.9% |
| 55 to 64 Years | 467 | 18.1% |
| 65 to 74 Years | 558 | 21.6% |
| 75 to 84 Years | 297 | 11.5% |
| 85 Years and Over | 196 | 7.6% |
| Total | 2,582 | 100.0% |
Housing Finances in Brookville
Median Income by Occupancy in Brookville
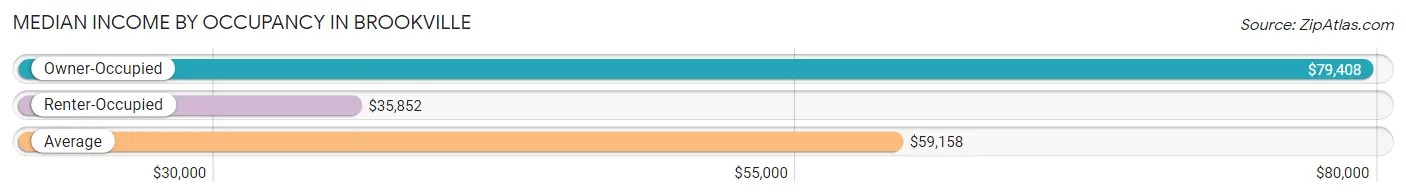
| Occupancy Type | # Households | Median Income |
| Owner-Occupied | 1,646 (63.7%) | $79,408 |
| Renter-Occupied | 936 (36.2%) | $35,852 |
| Average | 2,582 (100.0%) | $59,158 |
Occupancy by Householder Income Bracket in Brookville
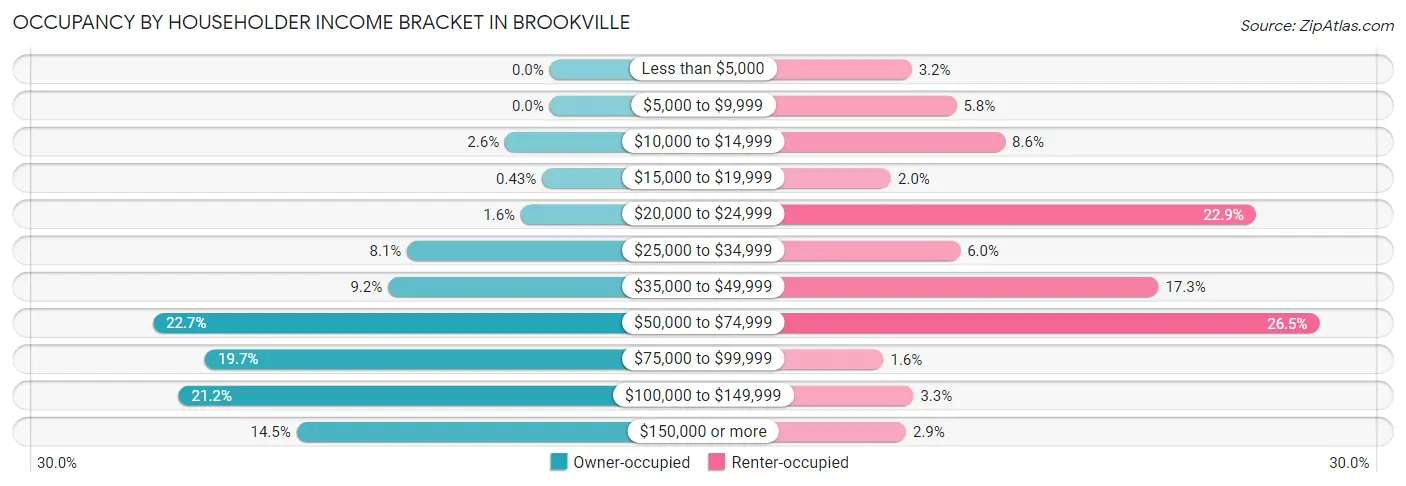
| Income Bracket | Owner-occupied | Renter-occupied |
| Less than $5,000 | 0 (0.0%) | 30 (3.2%) |
| $5,000 to $9,999 | 0 (0.0%) | 54 (5.8%) |
| $10,000 to $14,999 | 42 (2.5%) | 80 (8.6%) |
| $15,000 to $19,999 | 7 (0.4%) | 19 (2.0%) |
| $20,000 to $24,999 | 27 (1.6%) | 214 (22.9%) |
| $25,000 to $34,999 | 134 (8.1%) | 56 (6.0%) |
| $35,000 to $49,999 | 152 (9.2%) | 162 (17.3%) |
| $50,000 to $74,999 | 373 (22.7%) | 248 (26.5%) |
| $75,000 to $99,999 | 324 (19.7%) | 15 (1.6%) |
| $100,000 to $149,999 | 349 (21.2%) | 31 (3.3%) |
| $150,000 or more | 238 (14.5%) | 27 (2.9%) |
| Total | 1,646 (100.0%) | 936 (100.0%) |
Monthly Housing Cost Tiers in Brookville
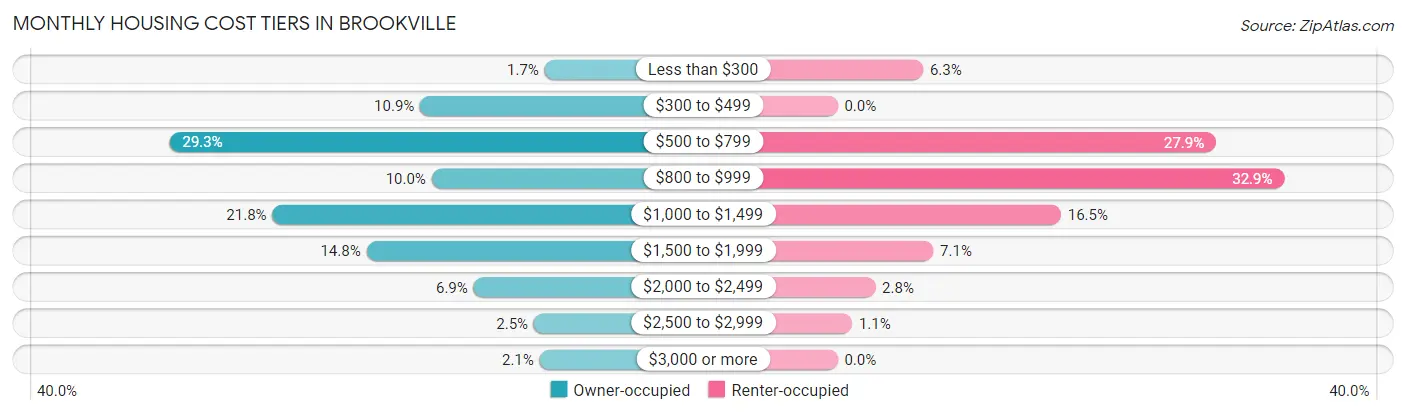
| Monthly Cost | Owner-occupied | Renter-occupied |
| Less than $300 | 28 (1.7%) | 59 (6.3%) |
| $300 to $499 | 179 (10.9%) | 0 (0.0%) |
| $500 to $799 | 483 (29.3%) | 261 (27.9%) |
| $800 to $999 | 165 (10.0%) | 308 (32.9%) |
| $1,000 to $1,499 | 358 (21.7%) | 154 (16.5%) |
| $1,500 to $1,999 | 244 (14.8%) | 66 (7.0%) |
| $2,000 to $2,499 | 114 (6.9%) | 26 (2.8%) |
| $2,500 to $2,999 | 41 (2.5%) | 10 (1.1%) |
| $3,000 or more | 34 (2.1%) | 0 (0.0%) |
| Total | 1,646 (100.0%) | 936 (100.0%) |
Physical Housing Characteristics in Brookville
Housing Structures in Brookville
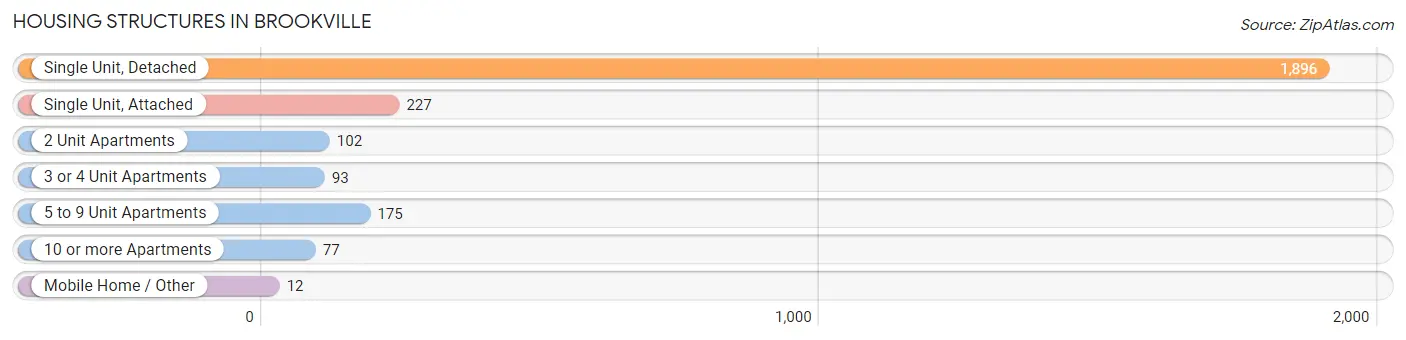
| Structure Type | # Housing Units | % Housing Units |
| Single Unit, Detached | 1,896 | 73.4% |
| Single Unit, Attached | 227 | 8.8% |
| 2 Unit Apartments | 102 | 4.0% |
| 3 or 4 Unit Apartments | 93 | 3.6% |
| 5 to 9 Unit Apartments | 175 | 6.8% |
| 10 or more Apartments | 77 | 3.0% |
| Mobile Home / Other | 12 | 0.5% |
| Total | 2,582 | 100.0% |
Housing Structures by Occupancy in Brookville
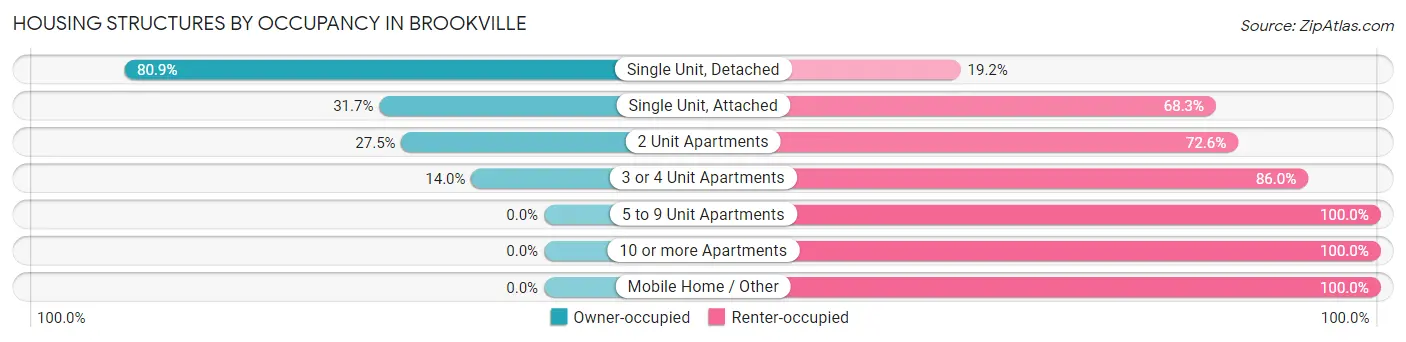
| Structure Type | Owner-occupied | Renter-occupied |
| Single Unit, Detached | 1,533 (80.8%) | 363 (19.2%) |
| Single Unit, Attached | 72 (31.7%) | 155 (68.3%) |
| 2 Unit Apartments | 28 (27.5%) | 74 (72.6%) |
| 3 or 4 Unit Apartments | 13 (14.0%) | 80 (86.0%) |
| 5 to 9 Unit Apartments | 0 (0.0%) | 175 (100.0%) |
| 10 or more Apartments | 0 (0.0%) | 77 (100.0%) |
| Mobile Home / Other | 0 (0.0%) | 12 (100.0%) |
| Total | 1,646 (63.7%) | 936 (36.2%) |
Housing Structures by Number of Rooms in Brookville
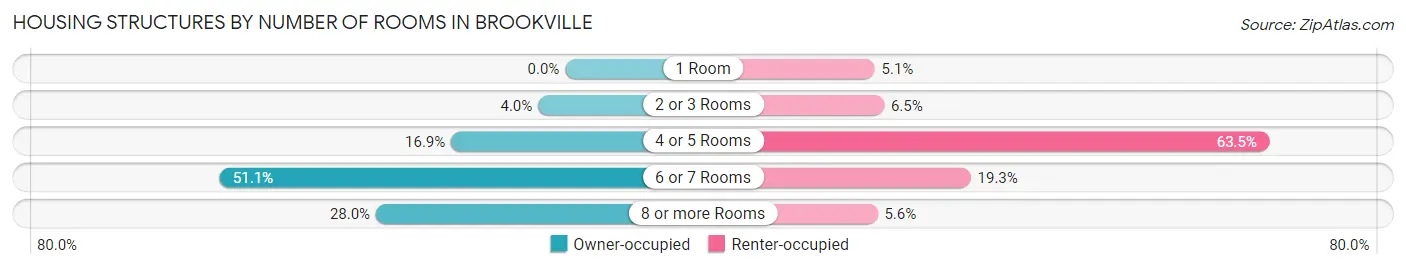
| Number of Rooms | Owner-occupied | Renter-occupied |
| 1 Room | 0 (0.0%) | 48 (5.1%) |
| 2 or 3 Rooms | 66 (4.0%) | 61 (6.5%) |
| 4 or 5 Rooms | 278 (16.9%) | 594 (63.5%) |
| 6 or 7 Rooms | 841 (51.1%) | 181 (19.3%) |
| 8 or more Rooms | 461 (28.0%) | 52 (5.6%) |
| Total | 1,646 (100.0%) | 936 (100.0%) |
Housing Structure by Heating Type in Brookville
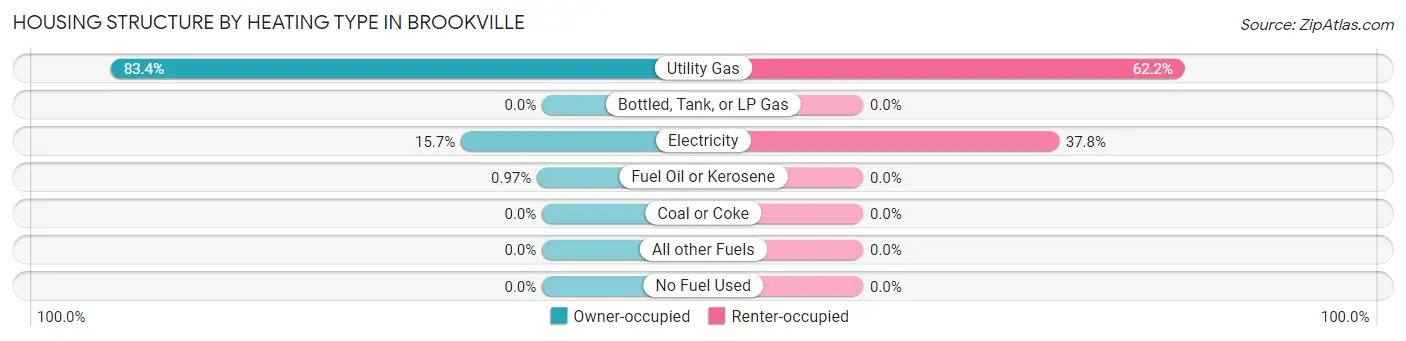
| Heating Type | Owner-occupied | Renter-occupied |
| Utility Gas | 1,372 (83.4%) | 582 (62.2%) |
| Bottled, Tank, or LP Gas | 0 (0.0%) | 0 (0.0%) |
| Electricity | 258 (15.7%) | 354 (37.8%) |
| Fuel Oil or Kerosene | 16 (1.0%) | 0 (0.0%) |
| Coal or Coke | 0 (0.0%) | 0 (0.0%) |
| All other Fuels | 0 (0.0%) | 0 (0.0%) |
| No Fuel Used | 0 (0.0%) | 0 (0.0%) |
| Total | 1,646 (100.0%) | 936 (100.0%) |
Household Vehicle Usage in Brookville
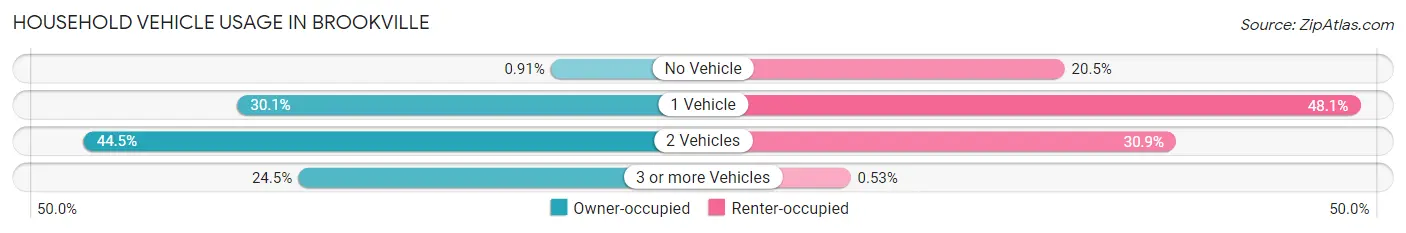
| Vehicles per Household | Owner-occupied | Renter-occupied |
| No Vehicle | 15 (0.9%) | 192 (20.5%) |
| 1 Vehicle | 496 (30.1%) | 450 (48.1%) |
| 2 Vehicles | 732 (44.5%) | 289 (30.9%) |
| 3 or more Vehicles | 403 (24.5%) | 5 (0.5%) |
| Total | 1,646 (100.0%) | 936 (100.0%) |
Real Estate & Mortgages in Brookville
Real Estate and Mortgage Overview in Brookville
| Characteristic | Without Mortgage | With Mortgage |
| Housing Units | 664 | 982 |
| Median Property Value | $148,900 | $173,500 |
| Median Household Income | $60,769 | $154 |
| Monthly Housing Costs | $566 | $19 |
| Real Estate Taxes | $2,412 | $58 |
Property Value by Mortgage Status in Brookville
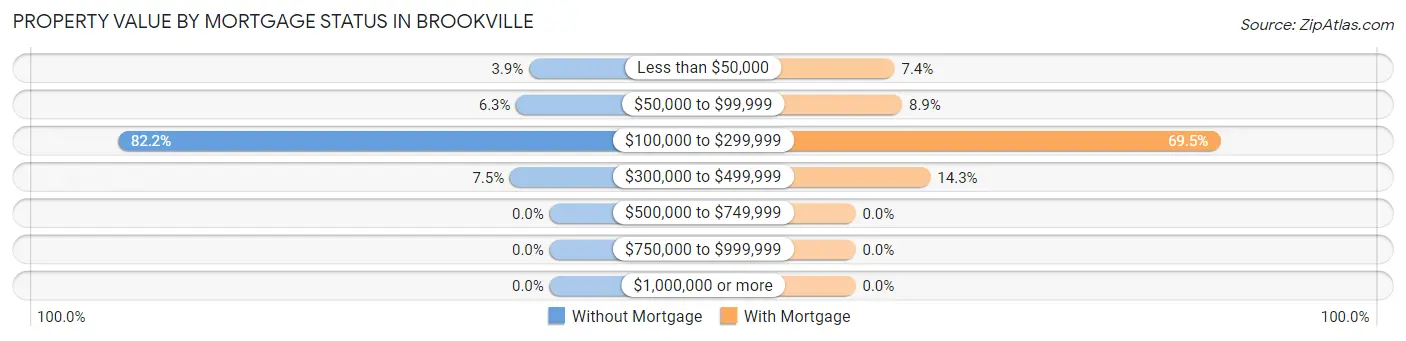
| Property Value | Without Mortgage | With Mortgage |
| Less than $50,000 | 26 (3.9%) | 73 (7.4%) |
| $50,000 to $99,999 | 42 (6.3%) | 87 (8.9%) |
| $100,000 to $299,999 | 546 (82.2%) | 682 (69.5%) |
| $300,000 to $499,999 | 50 (7.5%) | 140 (14.3%) |
| $500,000 to $749,999 | 0 (0.0%) | 0 (0.0%) |
| $750,000 to $999,999 | 0 (0.0%) | 0 (0.0%) |
| $1,000,000 or more | 0 (0.0%) | 0 (0.0%) |
| Total | 664 (100.0%) | 982 (100.0%) |
Household Income by Mortgage Status in Brookville
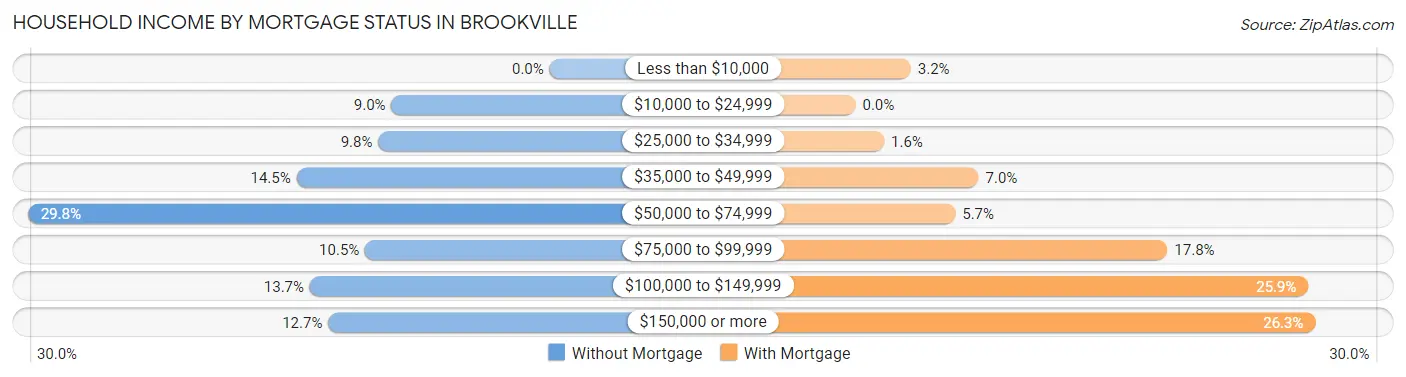
| Household Income | Without Mortgage | With Mortgage |
| Less than $10,000 | 0 (0.0%) | 31 (3.2%) |
| $10,000 to $24,999 | 60 (9.0%) | 0 (0.0%) |
| $25,000 to $34,999 | 65 (9.8%) | 16 (1.6%) |
| $35,000 to $49,999 | 96 (14.5%) | 69 (7.0%) |
| $50,000 to $74,999 | 198 (29.8%) | 56 (5.7%) |
| $75,000 to $99,999 | 70 (10.5%) | 175 (17.8%) |
| $100,000 to $149,999 | 91 (13.7%) | 254 (25.9%) |
| $150,000 or more | 84 (12.7%) | 258 (26.3%) |
| Total | 664 (100.0%) | 982 (100.0%) |
Property Value to Household Income Ratio in Brookville
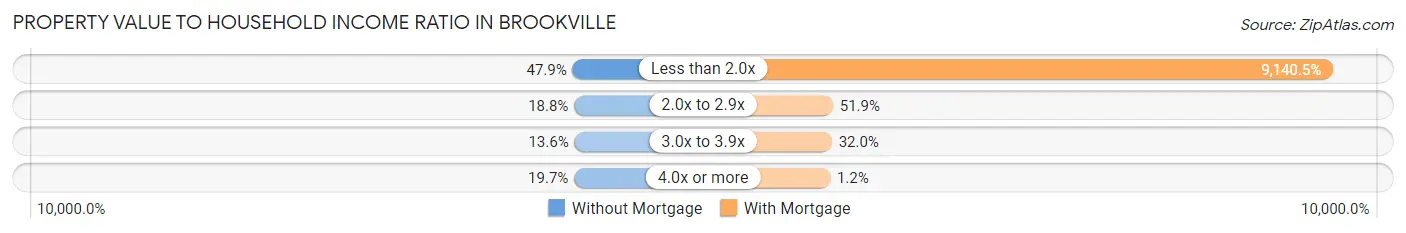
| Value-to-Income Ratio | Without Mortgage | With Mortgage |
| Less than 2.0x | 318 (47.9%) | 89,760 (9,140.5%) |
| 2.0x to 2.9x | 125 (18.8%) | 510 (51.9%) |
| 3.0x to 3.9x | 90 (13.6%) | 314 (32.0%) |
| 4.0x or more | 131 (19.7%) | 12 (1.2%) |
| Total | 664 (100.0%) | 982 (100.0%) |
Real Estate Taxes by Mortgage Status in Brookville
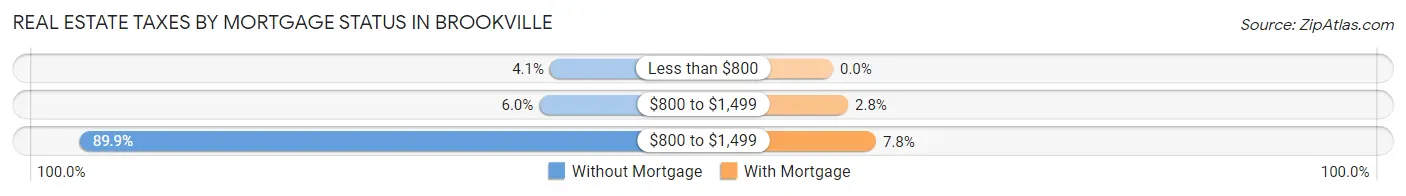
| Property Taxes | Without Mortgage | With Mortgage |
| Less than $800 | 27 (4.1%) | 0 (0.0%) |
| $800 to $1,499 | 40 (6.0%) | 27 (2.8%) |
| $800 to $1,499 | 597 (89.9%) | 77 (7.8%) |
| Total | 664 (100.0%) | 982 (100.0%) |
Health & Disability in Brookville
Health Insurance Coverage by Age in Brookville
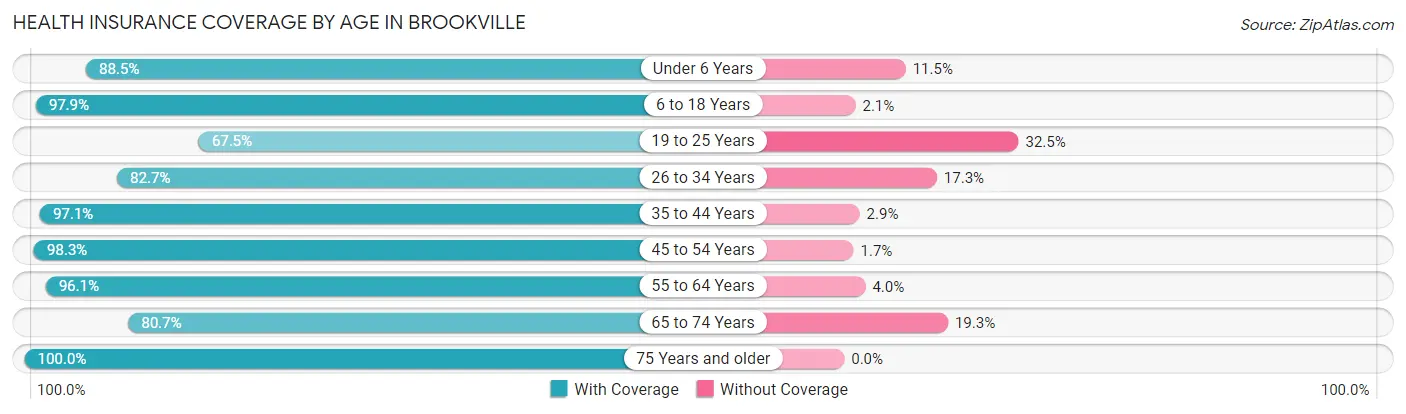
| Age Bracket | With Coverage | Without Coverage |
| Under 6 Years | 394 (88.5%) | 51 (11.5%) |
| 6 to 18 Years | 887 (97.9%) | 19 (2.1%) |
| 19 to 25 Years | 162 (67.5%) | 78 (32.5%) |
| 26 to 34 Years | 522 (82.7%) | 109 (17.3%) |
| 35 to 44 Years | 575 (97.1%) | 17 (2.9%) |
| 45 to 54 Years | 620 (98.3%) | 11 (1.7%) |
| 55 to 64 Years | 706 (96.1%) | 29 (4.0%) |
| 65 to 74 Years | 738 (80.7%) | 177 (19.3%) |
| 75 Years and older | 763 (100.0%) | 0 (0.0%) |
| Total | 5,367 (91.6%) | 491 (8.4%) |
Health Insurance Coverage by Citizenship Status in Brookville
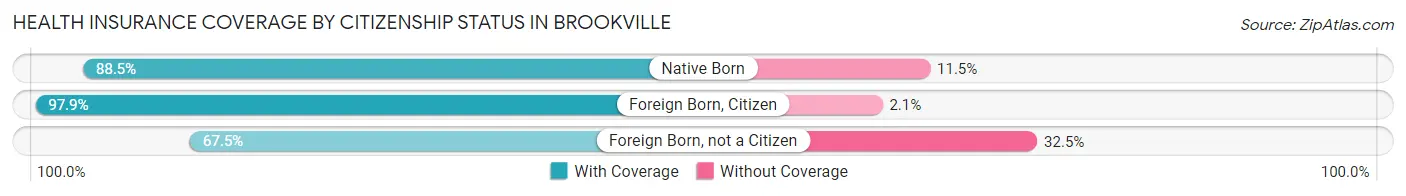
| Citizenship Status | With Coverage | Without Coverage |
| Native Born | 394 (88.5%) | 51 (11.5%) |
| Foreign Born, Citizen | 887 (97.9%) | 19 (2.1%) |
| Foreign Born, not a Citizen | 162 (67.5%) | 78 (32.5%) |
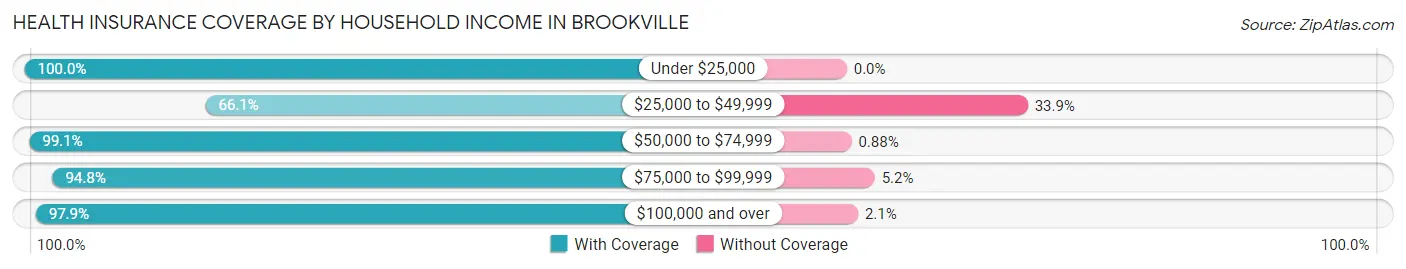
Health Insurance Coverage by Household Income in Brookville
| Household Income | With Coverage | Without Coverage |
| Under $25,000 | 540 (100.0%) | 0 (0.0%) |
| $25,000 to $49,999 | 751 (66.1%) | 385 (33.9%) |
| $50,000 to $74,999 | 1,243 (99.1%) | 11 (0.9%) |
| $75,000 to $99,999 | 1,014 (94.8%) | 56 (5.2%) |
| $100,000 and over | 1,819 (97.9%) | 39 (2.1%) |
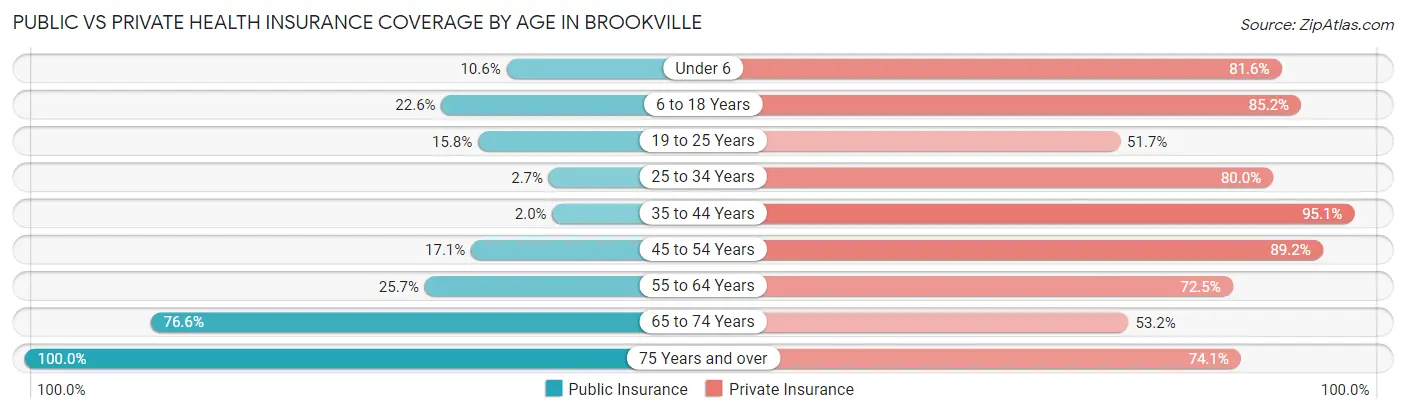
Public vs Private Health Insurance Coverage by Age in Brookville
| Age Bracket | Public Insurance | Private Insurance |
| Under 6 | 47 (10.6%) | 363 (81.6%) |
| 6 to 18 Years | 205 (22.6%) | 772 (85.2%) |
| 19 to 25 Years | 38 (15.8%) | 124 (51.7%) |
| 25 to 34 Years | 17 (2.7%) | 505 (80.0%) |
| 35 to 44 Years | 12 (2.0%) | 563 (95.1%) |
| 45 to 54 Years | 108 (17.1%) | 563 (89.2%) |
| 55 to 64 Years | 189 (25.7%) | 533 (72.5%) |
| 65 to 74 Years | 701 (76.6%) | 487 (53.2%) |
| 75 Years and over | 763 (100.0%) | 565 (74.1%) |
| Total | 2,080 (35.5%) | 4,475 (76.4%) |
Disability Status by Sex by Age in Brookville
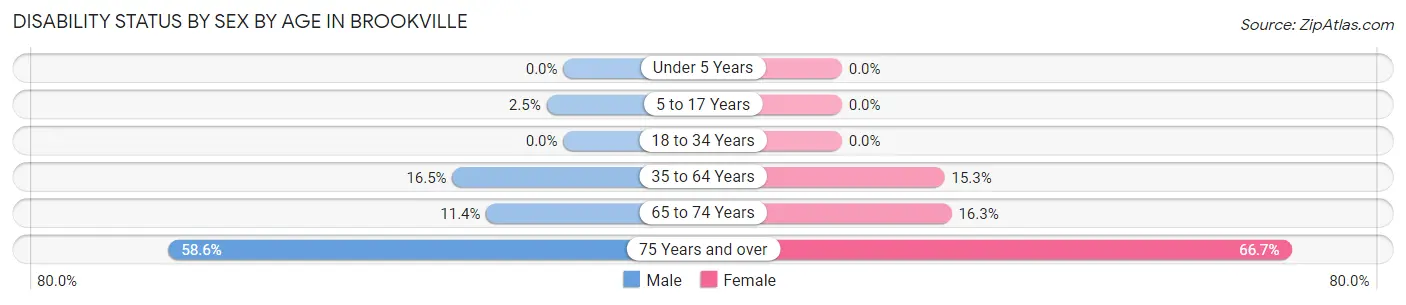
| Age Bracket | Male | Female |
| Under 5 Years | 0 (0.0%) | 0 (0.0%) |
| 5 to 17 Years | 15 (2.5%) | 0 (0.0%) |
| 18 to 34 Years | 0 (0.0%) | 0 (0.0%) |
| 35 to 64 Years | 153 (16.5%) | 157 (15.3%) |
| 65 to 74 Years | 59 (11.4%) | 65 (16.3%) |
| 75 Years and over | 190 (58.6%) | 293 (66.7%) |
Disability Class by Sex by Age in Brookville
Disability Class: Hearing Difficulty
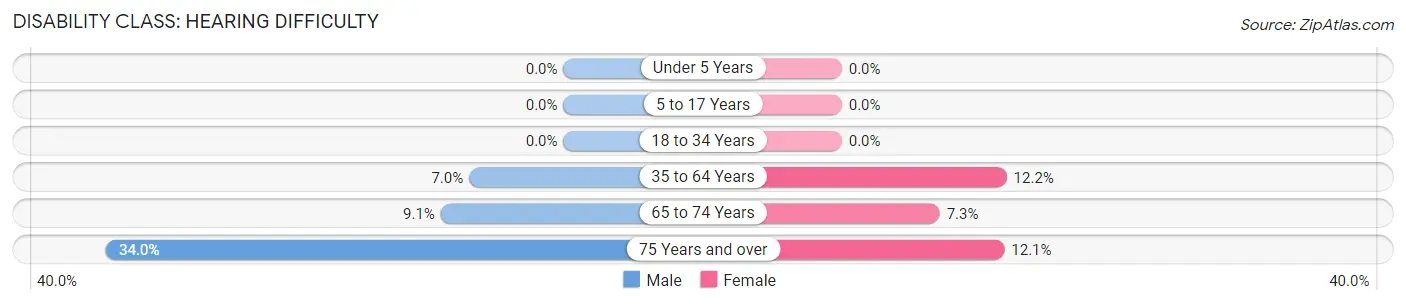
| Age Bracket | Male | Female |
| Under 5 Years | 0 (0.0%) | 0 (0.0%) |
| 5 to 17 Years | 0 (0.0%) | 0 (0.0%) |
| 18 to 34 Years | 0 (0.0%) | 0 (0.0%) |
| 35 to 64 Years | 65 (7.0%) | 126 (12.2%) |
| 65 to 74 Years | 47 (9.1%) | 29 (7.3%) |
| 75 Years and over | 110 (34.0%) | 53 (12.1%) |
Disability Class: Vision Difficulty
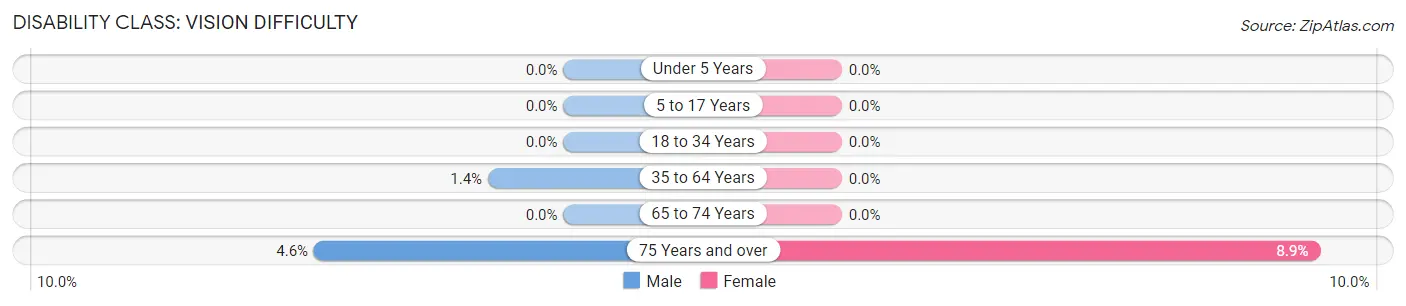
| Age Bracket | Male | Female |
| Under 5 Years | 0 (0.0%) | 0 (0.0%) |
| 5 to 17 Years | 0 (0.0%) | 0 (0.0%) |
| 18 to 34 Years | 0 (0.0%) | 0 (0.0%) |
| 35 to 64 Years | 13 (1.4%) | 0 (0.0%) |
| 65 to 74 Years | 0 (0.0%) | 0 (0.0%) |
| 75 Years and over | 15 (4.6%) | 39 (8.9%) |
Disability Class: Cognitive Difficulty
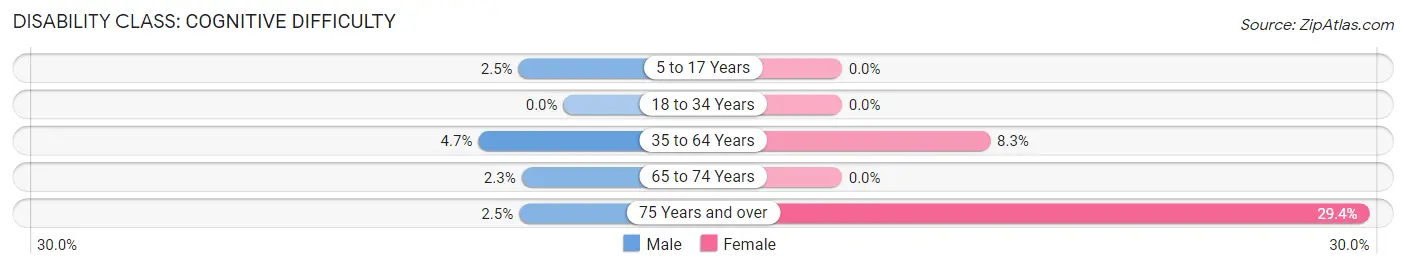
| Age Bracket | Male | Female |
| 5 to 17 Years | 15 (2.5%) | 0 (0.0%) |
| 18 to 34 Years | 0 (0.0%) | 0 (0.0%) |
| 35 to 64 Years | 44 (4.7%) | 85 (8.3%) |
| 65 to 74 Years | 12 (2.3%) | 0 (0.0%) |
| 75 Years and over | 8 (2.5%) | 129 (29.4%) |
Disability Class: Ambulatory Difficulty
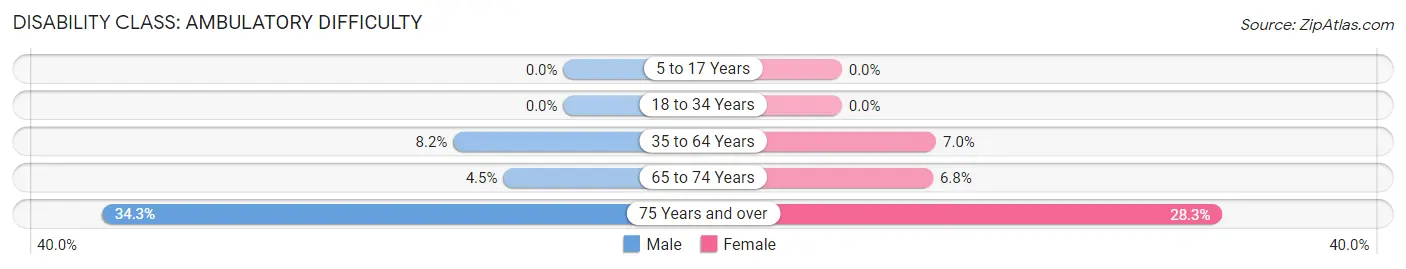
| Age Bracket | Male | Female |
| 5 to 17 Years | 0 (0.0%) | 0 (0.0%) |
| 18 to 34 Years | 0 (0.0%) | 0 (0.0%) |
| 35 to 64 Years | 76 (8.2%) | 72 (7.0%) |
| 65 to 74 Years | 23 (4.5%) | 27 (6.8%) |
| 75 Years and over | 111 (34.3%) | 124 (28.2%) |
Disability Class: Self-Care Difficulty
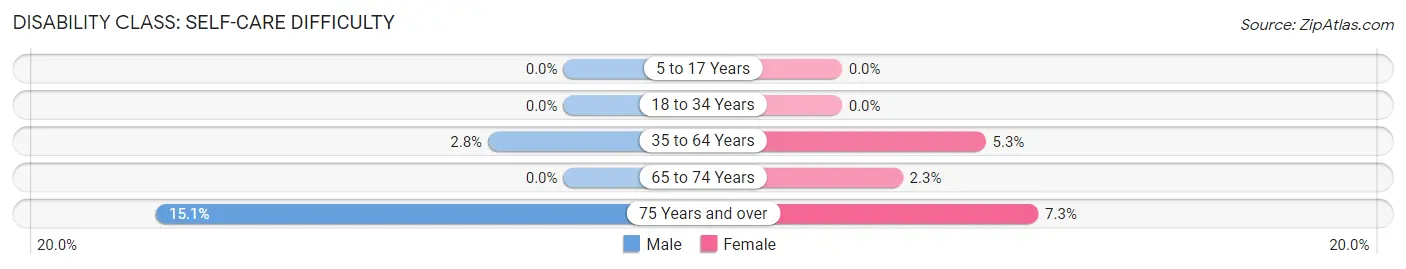
| Age Bracket | Male | Female |
| 5 to 17 Years | 0 (0.0%) | 0 (0.0%) |
| 18 to 34 Years | 0 (0.0%) | 0 (0.0%) |
| 35 to 64 Years | 26 (2.8%) | 55 (5.3%) |
| 65 to 74 Years | 0 (0.0%) | 9 (2.3%) |
| 75 Years and over | 49 (15.1%) | 32 (7.3%) |
Technology Access in Brookville
Computing Device Access in Brookville
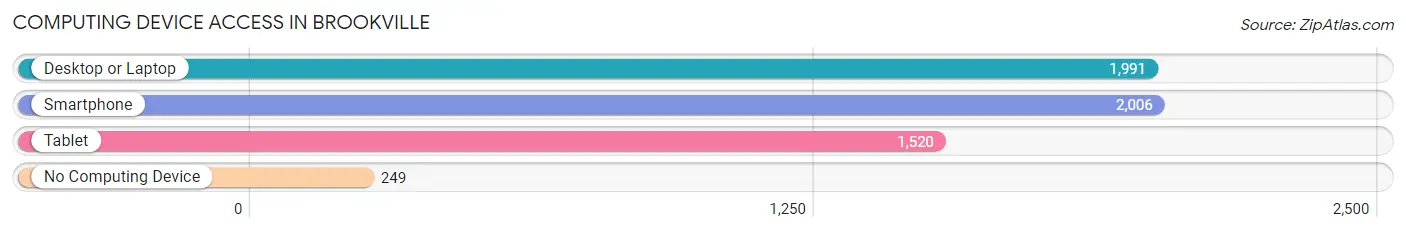
| Device Type | # Households | % Households |
| Desktop or Laptop | 1,991 | 77.1% |
| Smartphone | 2,006 | 77.7% |
| Tablet | 1,520 | 58.9% |
| No Computing Device | 249 | 9.6% |
| Total | 2,582 | 100.0% |
Internet Access in Brookville
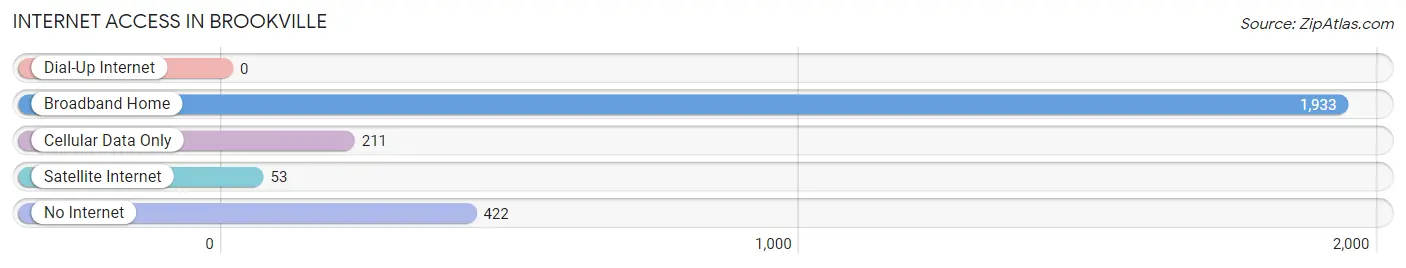
| Internet Type | # Households | % Households |
| Dial-Up Internet | 0 | 0.0% |
| Broadband Home | 1,933 | 74.9% |
| Cellular Data Only | 211 | 8.2% |
| Satellite Internet | 53 | 2.1% |
| No Internet | 422 | 16.3% |
| Total | 2,582 | 100.0% |
Brookville Summary
History
The city of Brookville, Ohio is located in Montgomery County, Ohio and is part of the Dayton metropolitan area. The city was founded in 1805 by William and Mary Brook, who were among the first settlers in the area. The city was originally known as Brookville, but was later changed to Brookville in 1818.
The city was an important stop on the Miami and Erie Canal, which was built in the early 1800s. The canal was a major transportation route for goods and people, and it helped to spur the growth of the city. The canal was eventually replaced by the railroad, which further increased the city's importance as a transportation hub.
The city was also an important stop on the Underground Railroad, which was used by slaves escaping to freedom in the north. The city was home to several prominent abolitionists, including the Reverend John Rankin, who was a leader in the anti-slavery movement.
The city was also home to several important industries, including the Brookville Manufacturing Company, which was founded in 1845 and produced a variety of products, including furniture, tools, and agricultural implements. The company was eventually sold to the International Harvester Company in the early 1900s.
The city was also home to several important educational institutions, including the Brookville Academy, which was founded in 1845 and was the first school in the area to offer a high school education. The school was eventually replaced by the Brookville High School, which is still in operation today.
Geography
Brookville is located in Montgomery County, Ohio, and is part of the Dayton metropolitan area. The city is situated on the Great Miami River, and is bordered by the cities of Dayton, Miamisburg, and Franklin. The city covers an area of 4.3 square miles, and has a population of approximately 8,000 people.
The city is located in a predominantly rural area, and is surrounded by farmland and wooded areas. The city is also home to several parks, including the Brookville Nature Preserve, which is a popular destination for hikers and nature lovers.
Economy
The economy of Brookville is largely based on manufacturing and agriculture. The city is home to several manufacturing companies, including the Brookville Manufacturing Company, which produces a variety of products, including furniture, tools, and agricultural implements. The city is also home to several agricultural businesses, including dairy farms, grain farms, and vegetable farms.
The city is also home to several retail businesses, including several restaurants, grocery stores, and other retail outlets. The city is also home to several banks, insurance companies, and other financial institutions.
Demographics
As of the 2010 census, the population of Brookville was 8,000 people. The racial makeup of the city was 94.3% White, 2.2% African American, 0.3% Native American, 0.7% Asian, 0.1% Pacific Islander, 0.7% from other races, and 1.9% from two or more races. Hispanic or Latino of any race were 2.2% of the population.
The median income for a household in the city was $45,000, and the median income for a family was $50,000. The per capita income for the city was $20,000. About 8.3% of families and 10.2% of the population were below the poverty line, including 14.3% of those under age 18 and 6.2% of those age 65 or over.
Common Questions
What is Per Capita Income in Brookville?
Per Capita income in Brookville is $35,371.
What is the Median Family Income in Brookville?
Median Family Income in Brookville is $81,847.
What is the Median Household income in Brookville?
Median Household Income in Brookville is $59,158.
What is Income or Wage Gap in Brookville?
Income or Wage Gap in Brookville is 44.9%.
Women in Brookville earn 55.1 cents for every dollar earned by a man.
What is Inequality or Gini Index in Brookville?
Inequality or Gini Index in Brookville is 0.44.
What is the Total Population of Brookville?
Total Population of Brookville is 6,035.
What is the Total Male Population of Brookville?
Total Male Population of Brookville is 3,069.
What is the Total Female Population of Brookville?
Total Female Population of Brookville is 2,966.
What is the Ratio of Males per 100 Females in Brookville?
There are 103.47 Males per 100 Females in Brookville.
What is the Ratio of Females per 100 Males in Brookville?
There are 96.64 Females per 100 Males in Brookville.
What is the Median Population Age in Brookville?
Median Population Age in Brookville is 49.1 Years.
What is the Average Family Size in Brookville
Average Family Size in Brookville is 3.0 People.
What is the Average Household Size in Brookville
Average Household Size in Brookville is 2.3 People.
How Large is the Labor Force in Brookville?
There are 2,691 People in the Labor Forcein in Brookville.
What is the Percentage of People in the Labor Force in Brookville?
54.6% of People are in the Labor Force in Brookville.
What is the Unemployment Rate in Brookville?
Unemployment Rate in Brookville is 3.2%.