Bridgeport, OH Map & Demographics
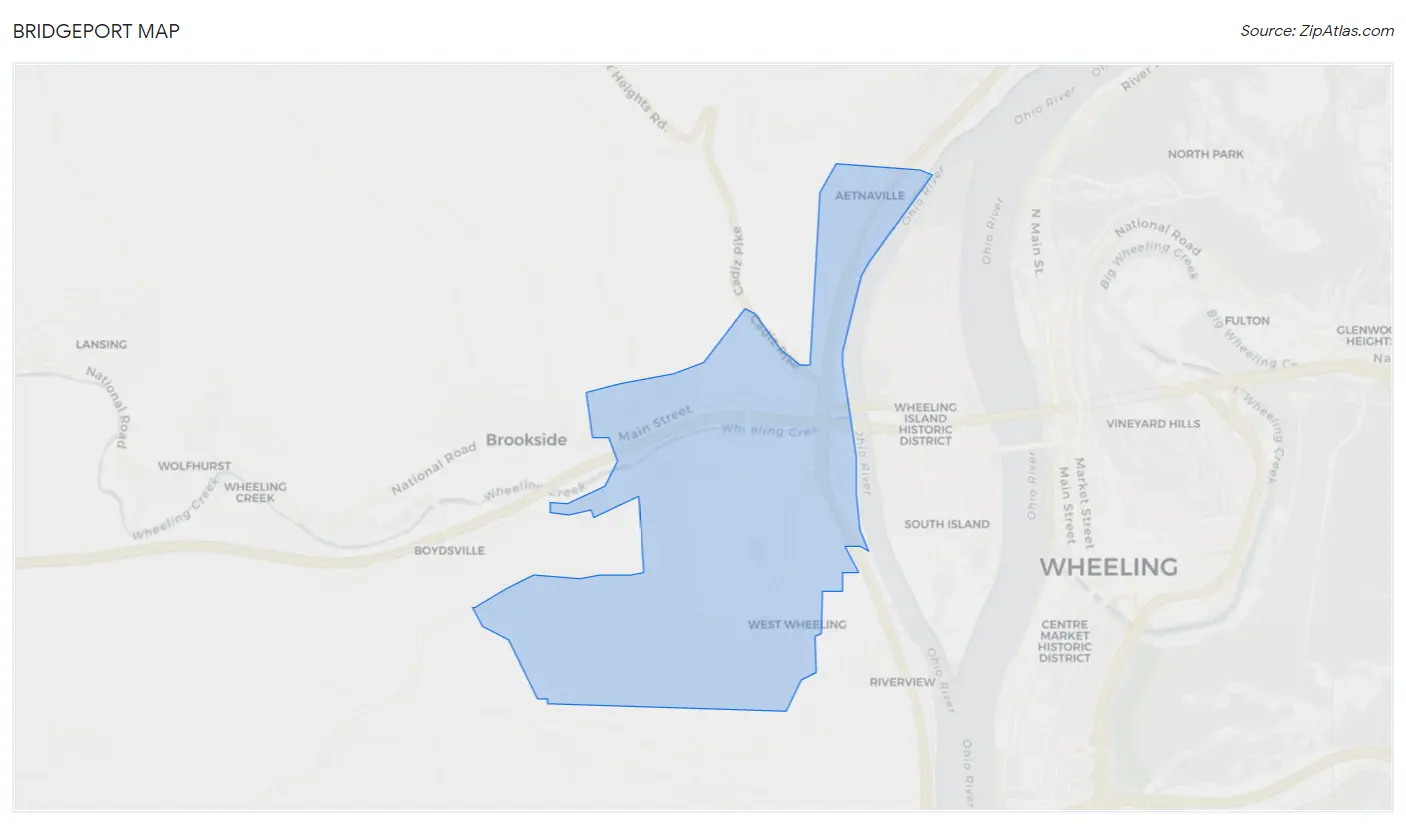
Bridgeport Map
Bridgeport Overview
$29,362
PER CAPITA INCOME
$52,193
AVG FAMILY INCOME
$51,045
AVG HOUSEHOLD INCOME
6.9%
WAGE / INCOME GAP [ % ]
93.1¢/ $1
WAGE / INCOME GAP [ $ ]
0.45
INEQUALITY / GINI INDEX
1,449
TOTAL POPULATION
805
MALE POPULATION
644
FEMALE POPULATION
125.00
MALES / 100 FEMALES
80.00
FEMALES / 100 MALES
42.9
MEDIAN AGE
3.0
AVG FAMILY SIZE
2.4
AVG HOUSEHOLD SIZE
721
LABOR FORCE [ PEOPLE ]
60.0%
PERCENT IN LABOR FORCE
8.3%
UNEMPLOYMENT RATE
Bridgeport Zip Codes
Bridgeport Area Codes
Income in Bridgeport
Income Overview in Bridgeport
Per Capita Income in Bridgeport is $29,362, while median incomes of families and households are $52,193 and $51,045 respectively.
| Characteristic | Number | Measure |
| Per Capita Income | 1,449 | $29,362 |
| Median Family Income | 369 | $52,193 |
| Mean Family Income | 369 | $60,658 |
| Median Household Income | 602 | $51,045 |
| Mean Household Income | 602 | $64,319 |
| Income Deficit | 369 | $0 |
| Wage / Income Gap (%) | 1,449 | 6.91% |
| Wage / Income Gap ($) | 1,449 | 93.09¢ per $1 |
| Gini / Inequality Index | 1,449 | 0.45 |
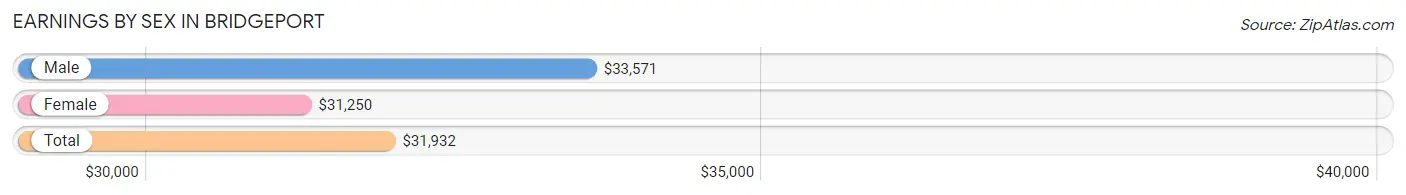
Earnings by Sex in Bridgeport
Average Earnings in Bridgeport are $31,932, $33,571 for men and $31,250 for women, a difference of 6.9%.
| Sex | Number | Average Earnings |
| Male | 392 (54.1%) | $33,571 |
| Female | 333 (45.9%) | $31,250 |
| Total | 725 (100.0%) | $31,932 |
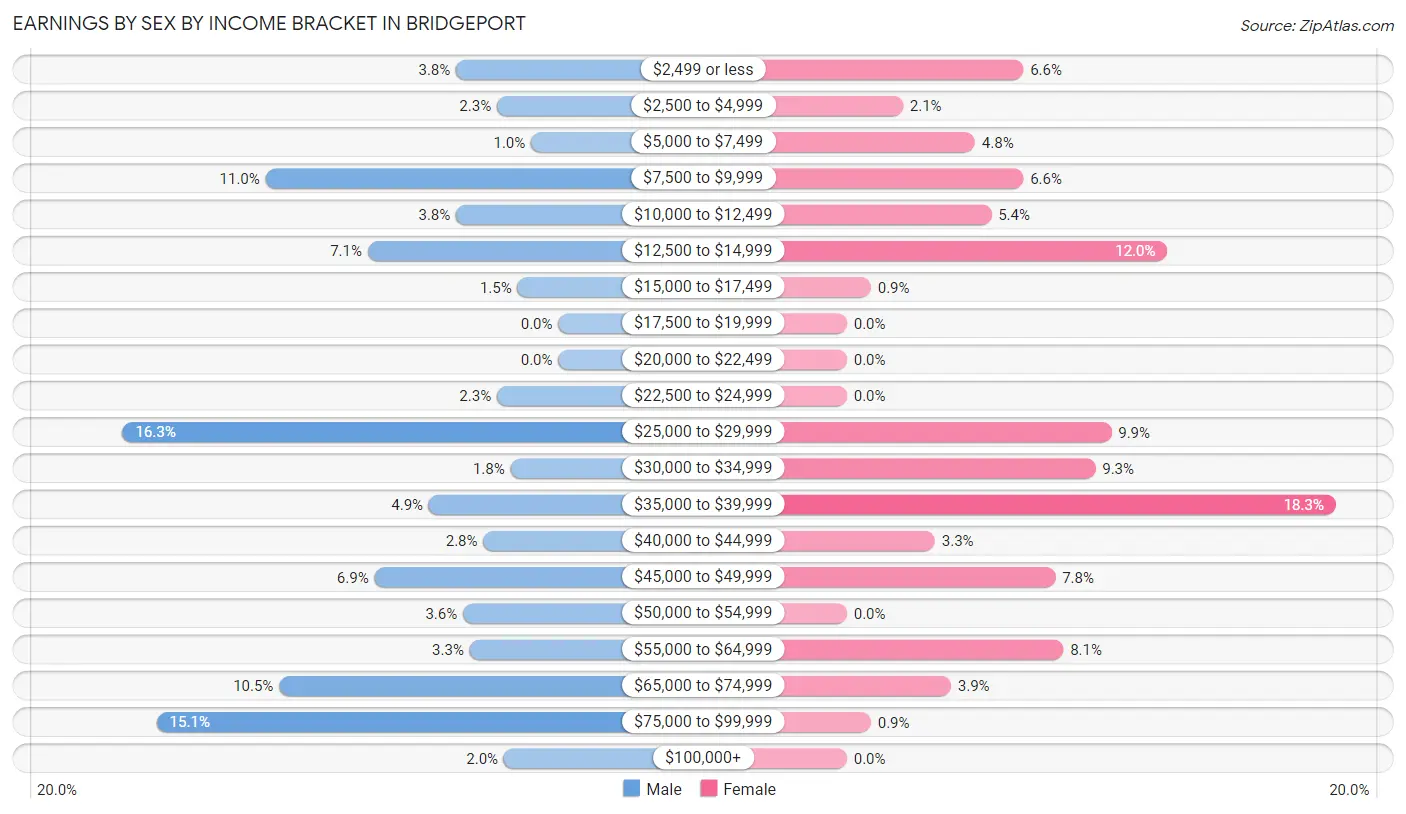
Earnings by Sex by Income Bracket in Bridgeport
The most common earnings brackets in Bridgeport are $25,000 to $29,999 for men (64 | 16.3%) and $35,000 to $39,999 for women (61 | 18.3%).
| Income | Male | Female |
| $2,499 or less | 15 (3.8%) | 22 (6.6%) |
| $2,500 to $4,999 | 9 (2.3%) | 7 (2.1%) |
| $5,000 to $7,499 | 4 (1.0%) | 16 (4.8%) |
| $7,500 to $9,999 | 43 (11.0%) | 22 (6.6%) |
| $10,000 to $12,499 | 15 (3.8%) | 18 (5.4%) |
| $12,500 to $14,999 | 28 (7.1%) | 40 (12.0%) |
| $15,000 to $17,499 | 6 (1.5%) | 3 (0.9%) |
| $17,500 to $19,999 | 0 (0.0%) | 0 (0.0%) |
| $20,000 to $22,499 | 0 (0.0%) | 0 (0.0%) |
| $22,500 to $24,999 | 9 (2.3%) | 0 (0.0%) |
| $25,000 to $29,999 | 64 (16.3%) | 33 (9.9%) |
| $30,000 to $34,999 | 7 (1.8%) | 31 (9.3%) |
| $35,000 to $39,999 | 19 (4.9%) | 61 (18.3%) |
| $40,000 to $44,999 | 11 (2.8%) | 11 (3.3%) |
| $45,000 to $49,999 | 27 (6.9%) | 26 (7.8%) |
| $50,000 to $54,999 | 14 (3.6%) | 0 (0.0%) |
| $55,000 to $64,999 | 13 (3.3%) | 27 (8.1%) |
| $65,000 to $74,999 | 41 (10.5%) | 13 (3.9%) |
| $75,000 to $99,999 | 59 (15.0%) | 3 (0.9%) |
| $100,000+ | 8 (2.0%) | 0 (0.0%) |
| Total | 392 (100.0%) | 333 (100.0%) |
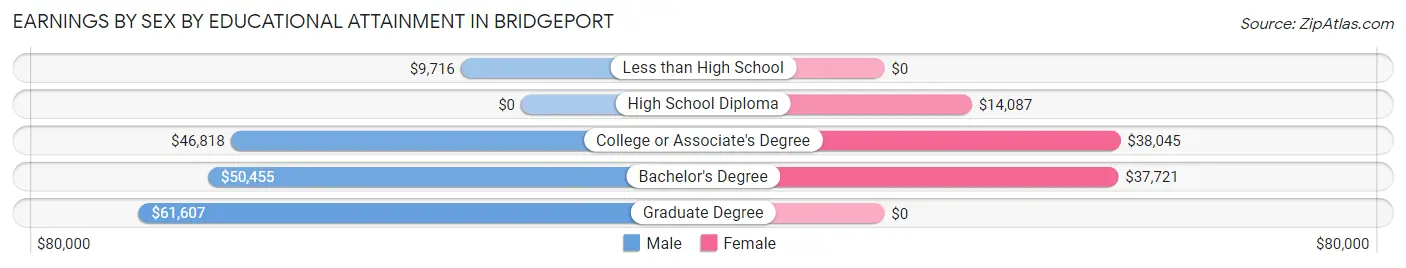
Earnings by Sex by Educational Attainment in Bridgeport
Average earnings in Bridgeport are $44,500 for men and $33,563 for women, a difference of 24.6%. Men with an educational attainment of graduate degree enjoy the highest average annual earnings of $61,607, while those with less than high school education earn the least with $9,716. Women with an educational attainment of college or associate's degree earn the most with the average annual earnings of $38,045, while those with high school diploma education have the smallest earnings of $14,087.
| Educational Attainment | Male Income | Female Income |
| Less than High School | $9,716 | $0 |
| High School Diploma | - | - |
| College or Associate's Degree | $46,818 | $38,045 |
| Bachelor's Degree | $50,455 | $37,721 |
| Graduate Degree | $61,607 | $0 |
| Total | $44,500 | $33,563 |
Family Income in Bridgeport
Family Income Brackets in Bridgeport
According to the Bridgeport family income data, there are 126 families falling into the $50,000 to $74,999 income range, which is the most common income bracket and makes up 34.2% of all families.
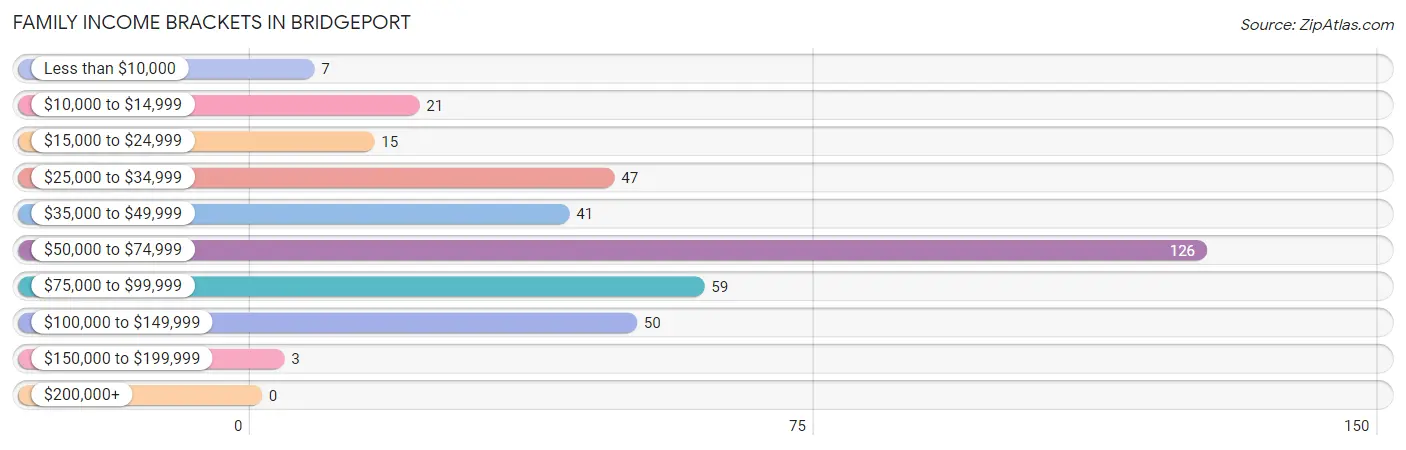
| Income Bracket | # Families | % Families |
| Less than $10,000 | 7 | 1.9% |
| $10,000 to $14,999 | 21 | 5.7% |
| $15,000 to $24,999 | 15 | 4.1% |
| $25,000 to $34,999 | 47 | 12.7% |
| $35,000 to $49,999 | 41 | 11.1% |
| $50,000 to $74,999 | 126 | 34.1% |
| $75,000 to $99,999 | 59 | 16.0% |
| $100,000 to $149,999 | 50 | 13.6% |
| $150,000 to $199,999 | 3 | 0.8% |
| $200,000+ | 0 | 0.0% |
Family Income by Famaliy Size in Bridgeport
4-person families (30 | 8.1%) account for the highest median family income in Bridgeport with $100,833 per family, while 2-person families (214 | 58.0%) have the highest median income of $25,860 per family member.
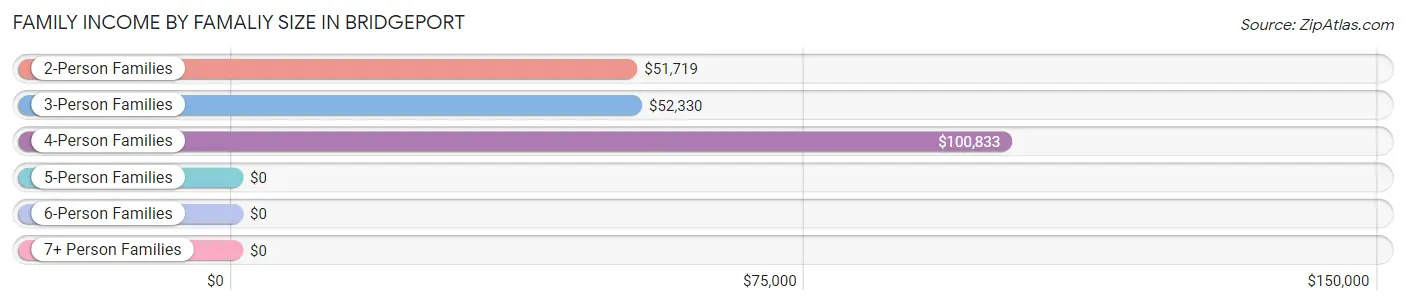
| Income Bracket | # Families | Median Income |
| 2-Person Families | 214 (58.0%) | $51,719 |
| 3-Person Families | 89 (24.1%) | $52,330 |
| 4-Person Families | 30 (8.1%) | $100,833 |
| 5-Person Families | 19 (5.1%) | $0 |
| 6-Person Families | 17 (4.6%) | $0 |
| 7+ Person Families | 0 (0.0%) | $0 |
| Total | 369 (100.0%) | $52,193 |
Family Income by Number of Earners in Bridgeport
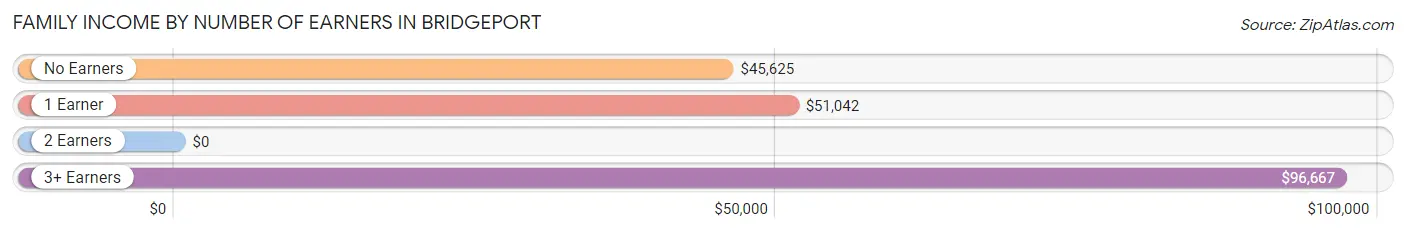
| Number of Earners | # Families | Median Income |
| No Earners | 66 (17.9%) | $45,625 |
| 1 Earner | 164 (44.4%) | $51,042 |
| 2 Earners | 117 (31.7%) | $0 |
| 3+ Earners | 22 (6.0%) | $96,667 |
| Total | 369 (100.0%) | $52,193 |
Household Income in Bridgeport
Household Income Brackets in Bridgeport
With 177 households falling in the category, the $50,000 to $74,999 income range is the most frequent in Bridgeport, accounting for 29.4% of all households. In contrast, only 3 households (0.5%) fall into the $150,000 to $199,999 income bracket, making it the least populous group.
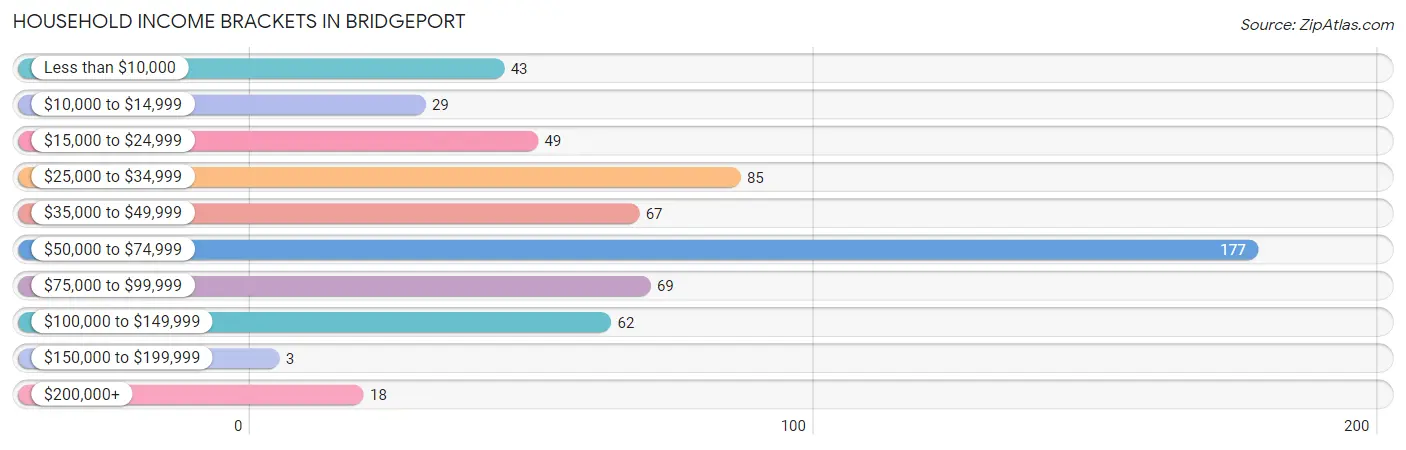
| Income Bracket | # Households | % Households |
| Less than $10,000 | 43 | 7.1% |
| $10,000 to $14,999 | 29 | 4.8% |
| $15,000 to $24,999 | 49 | 8.1% |
| $25,000 to $34,999 | 85 | 14.1% |
| $35,000 to $49,999 | 67 | 11.1% |
| $50,000 to $74,999 | 177 | 29.4% |
| $75,000 to $99,999 | 69 | 11.5% |
| $100,000 to $149,999 | 62 | 10.3% |
| $150,000 to $199,999 | 3 | 0.5% |
| $200,000+ | 18 | 3.0% |
Household Income by Householder Age in Bridgeport
The median household income in Bridgeport is $51,045, with the highest median household income of $67,083 found in the 25 to 44 years age bracket for the primary householder. A total of 149 households (24.7%) fall into this category. Meanwhile, the 15 to 24 years age bracket for the primary householder has the lowest median household income of $0, with 6 households (1.0%) in this group.
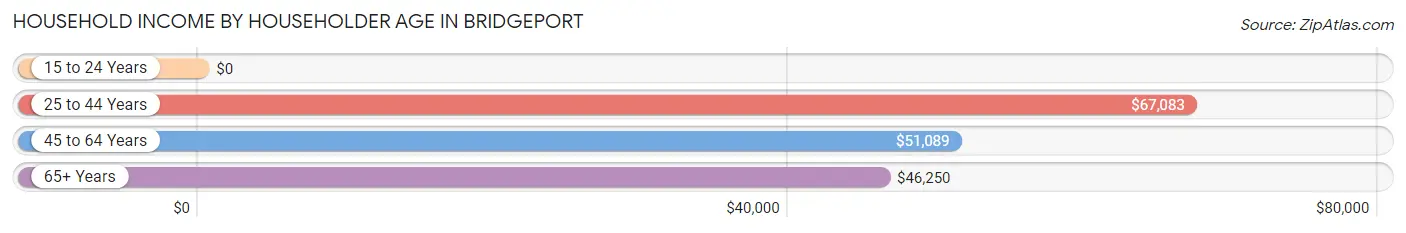
| Income Bracket | # Households | Median Income |
| 15 to 24 Years | 6 (1.0%) | $0 |
| 25 to 44 Years | 149 (24.7%) | $67,083 |
| 45 to 64 Years | 253 (42.0%) | $51,089 |
| 65+ Years | 194 (32.2%) | $46,250 |
| Total | 602 (100.0%) | $51,045 |
Poverty in Bridgeport
Income Below Poverty by Sex and Age in Bridgeport
With 14.0% poverty level for males and 23.6% for females among the residents of Bridgeport, 5 year old males and 18 to 24 year old females are the most vulnerable to poverty, with 5 males (100.0%) and 14 females (50.0%) in their respective age groups living below the poverty level.
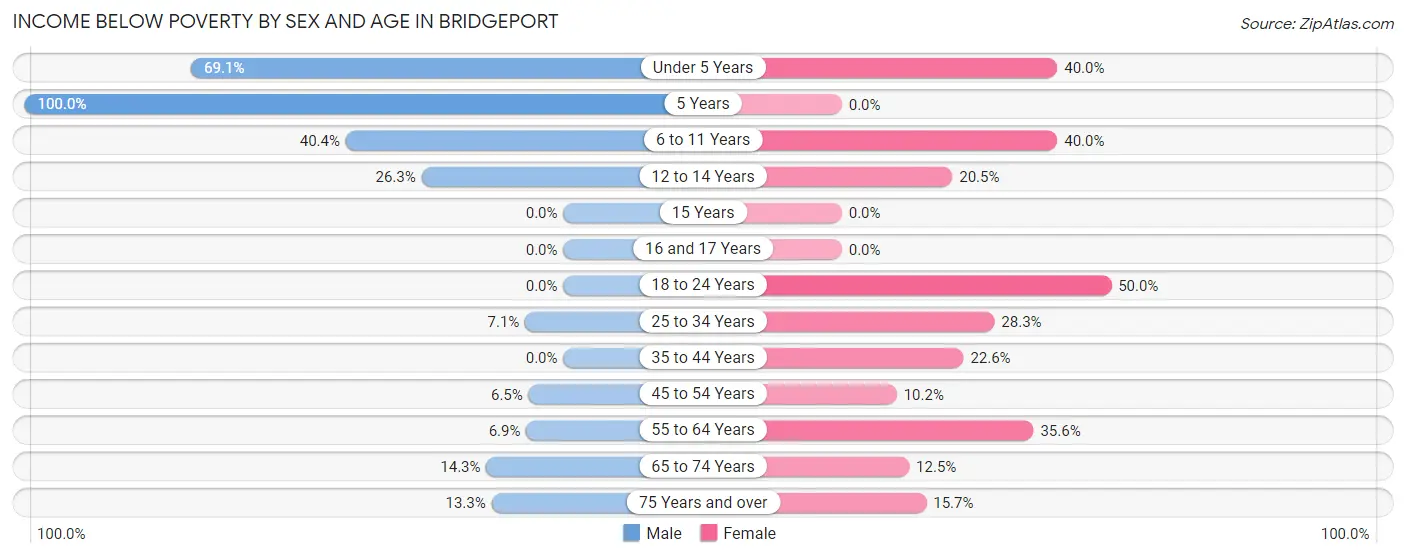
| Age Bracket | Male | Female |
| Under 5 Years | 38 (69.1%) | 12 (40.0%) |
| 5 Years | 5 (100.0%) | 0 (0.0%) |
| 6 to 11 Years | 21 (40.4%) | 8 (40.0%) |
| 12 to 14 Years | 5 (26.3%) | 8 (20.5%) |
| 15 Years | 0 (0.0%) | 0 (0.0%) |
| 16 and 17 Years | 0 (0.0%) | 0 (0.0%) |
| 18 to 24 Years | 0 (0.0%) | 14 (50.0%) |
| 25 to 34 Years | 10 (7.1%) | 34 (28.3%) |
| 35 to 44 Years | 0 (0.0%) | 7 (22.6%) |
| 45 to 54 Years | 8 (6.5%) | 10 (10.2%) |
| 55 to 64 Years | 9 (6.9%) | 37 (35.6%) |
| 65 to 74 Years | 6 (14.3%) | 14 (12.5%) |
| 75 Years and over | 8 (13.3%) | 8 (15.7%) |
| Total | 110 (14.0%) | 152 (23.6%) |
Income Above Poverty by Sex and Age in Bridgeport
According to the poverty statistics in Bridgeport, males aged 16 and 17 years and females aged 15 years are the age groups that are most secure financially, with 100.0% of males and 100.0% of females in these age groups living above the poverty line.
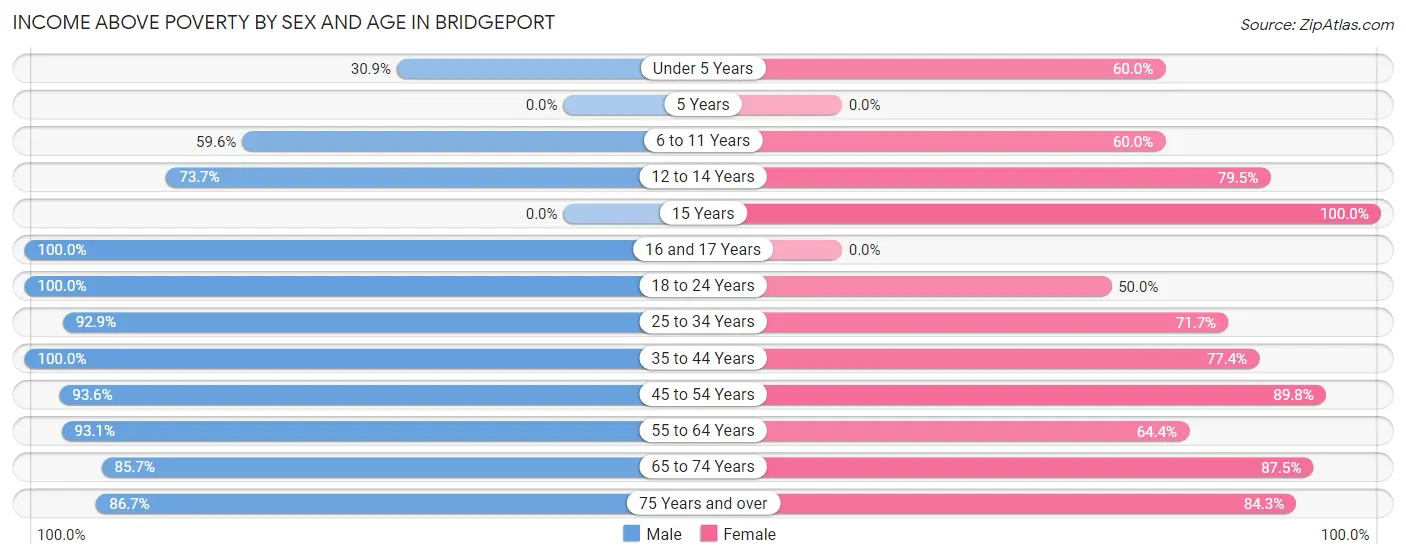
| Age Bracket | Male | Female |
| Under 5 Years | 17 (30.9%) | 18 (60.0%) |
| 5 Years | 0 (0.0%) | 0 (0.0%) |
| 6 to 11 Years | 31 (59.6%) | 12 (60.0%) |
| 12 to 14 Years | 14 (73.7%) | 31 (79.5%) |
| 15 Years | 0 (0.0%) | 11 (100.0%) |
| 16 and 17 Years | 43 (100.0%) | 0 (0.0%) |
| 18 to 24 Years | 78 (100.0%) | 14 (50.0%) |
| 25 to 34 Years | 131 (92.9%) | 86 (71.7%) |
| 35 to 44 Years | 38 (100.0%) | 24 (77.4%) |
| 45 to 54 Years | 116 (93.5%) | 88 (89.8%) |
| 55 to 64 Years | 122 (93.1%) | 67 (64.4%) |
| 65 to 74 Years | 36 (85.7%) | 98 (87.5%) |
| 75 Years and over | 52 (86.7%) | 43 (84.3%) |
| Total | 678 (86.0%) | 492 (76.4%) |
Income Below Poverty Among Married-Couple Families in Bridgeport
The poverty statistics for married-couple families in Bridgeport show that 8.1% or 20 of the total 247 families live below the poverty line. Families with no children have the highest poverty rate of 11.9%, comprising of 20 families. On the other hand, families with 1 or 2 children have the lowest poverty rate of 0.0%, which includes 0 families.
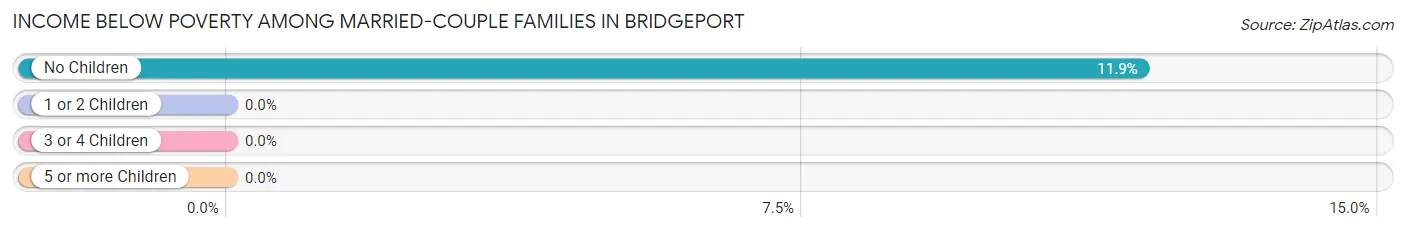
| Children | Above Poverty | Below Poverty |
| No Children | 148 (88.1%) | 20 (11.9%) |
| 1 or 2 Children | 72 (100.0%) | 0 (0.0%) |
| 3 or 4 Children | 7 (100.0%) | 0 (0.0%) |
| 5 or more Children | 0 (0.0%) | 0 (0.0%) |
| Total | 227 (91.9%) | 20 (8.1%) |
Income Below Poverty Among Single-Parent Households in Bridgeport
According to the poverty data in Bridgeport, 23.8% or 10 single-father households and 21.2% or 17 single-mother households are living below the poverty line. Among single-father households, those with 5 or more children have the highest poverty rate, with 10 households (100.0%) experiencing poverty. Likewise, among single-mother households, those with 3 or 4 children have the highest poverty rate, with 12 households (46.2%) falling below the poverty line.
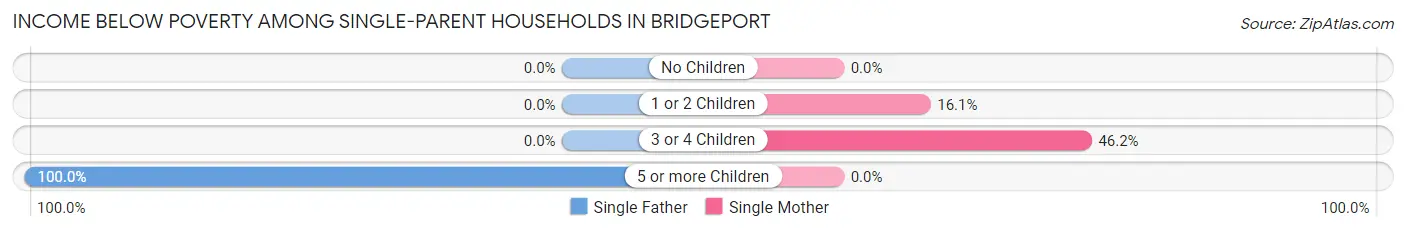
| Children | Single Father | Single Mother |
| No Children | 0 (0.0%) | 0 (0.0%) |
| 1 or 2 Children | 0 (0.0%) | 5 (16.1%) |
| 3 or 4 Children | 0 (0.0%) | 12 (46.2%) |
| 5 or more Children | 10 (100.0%) | 0 (0.0%) |
| Total | 10 (23.8%) | 17 (21.2%) |
Income Below Poverty Among Married-Couple vs Single-Parent Households in Bridgeport
The poverty data for Bridgeport shows that 20 of the married-couple family households (8.1%) and 27 of the single-parent households (22.1%) are living below the poverty level. Within the married-couple family households, those with no children have the highest poverty rate, with 20 households (11.9%) falling below the poverty line. Among the single-parent households, those with 5 or more children have the highest poverty rate, with 10 household (100.0%) living below poverty.
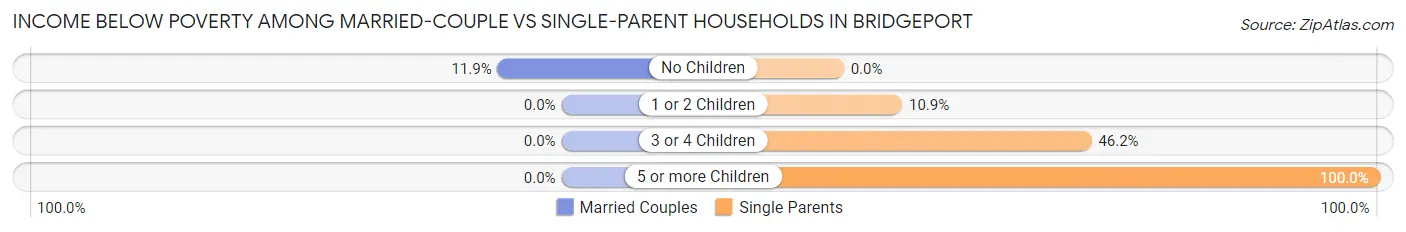
| Children | Married-Couple Families | Single-Parent Households |
| No Children | 20 (11.9%) | 0 (0.0%) |
| 1 or 2 Children | 0 (0.0%) | 5 (10.9%) |
| 3 or 4 Children | 0 (0.0%) | 12 (46.2%) |
| 5 or more Children | 0 (0.0%) | 10 (100.0%) |
| Total | 20 (8.1%) | 27 (22.1%) |
Race in Bridgeport
The most populous races in Bridgeport are White / Caucasian (1,206 | 83.2%), Two or more Races (170 | 11.7%), and Black / African American (67 | 4.6%).
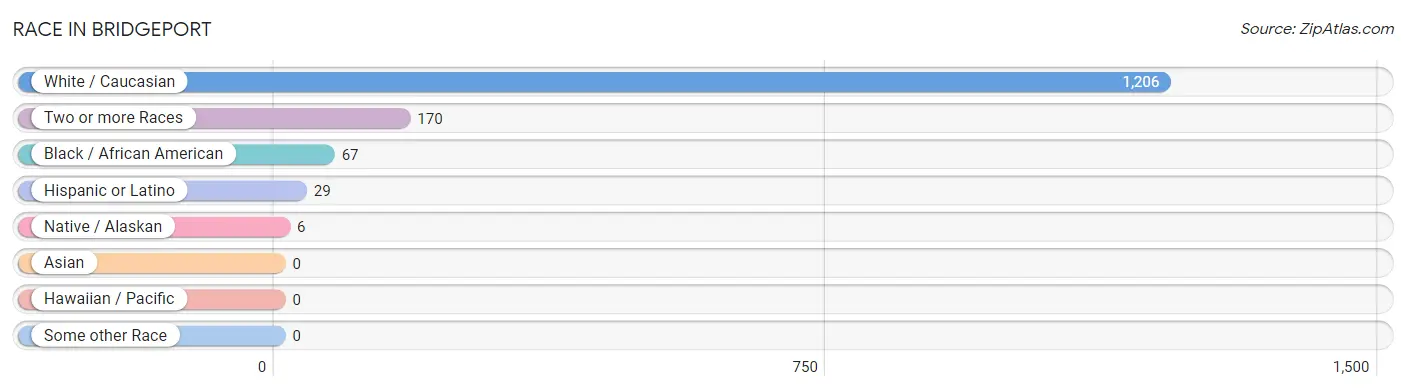
| Race | # Population | % Population |
| Asian | 0 | 0.0% |
| Black / African American | 67 | 4.6% |
| Hawaiian / Pacific | 0 | 0.0% |
| Hispanic or Latino | 29 | 2.0% |
| Native / Alaskan | 6 | 0.4% |
| White / Caucasian | 1,206 | 83.2% |
| Two or more Races | 170 | 11.7% |
| Some other Race | 0 | 0.0% |
| Total | 1,449 | 100.0% |
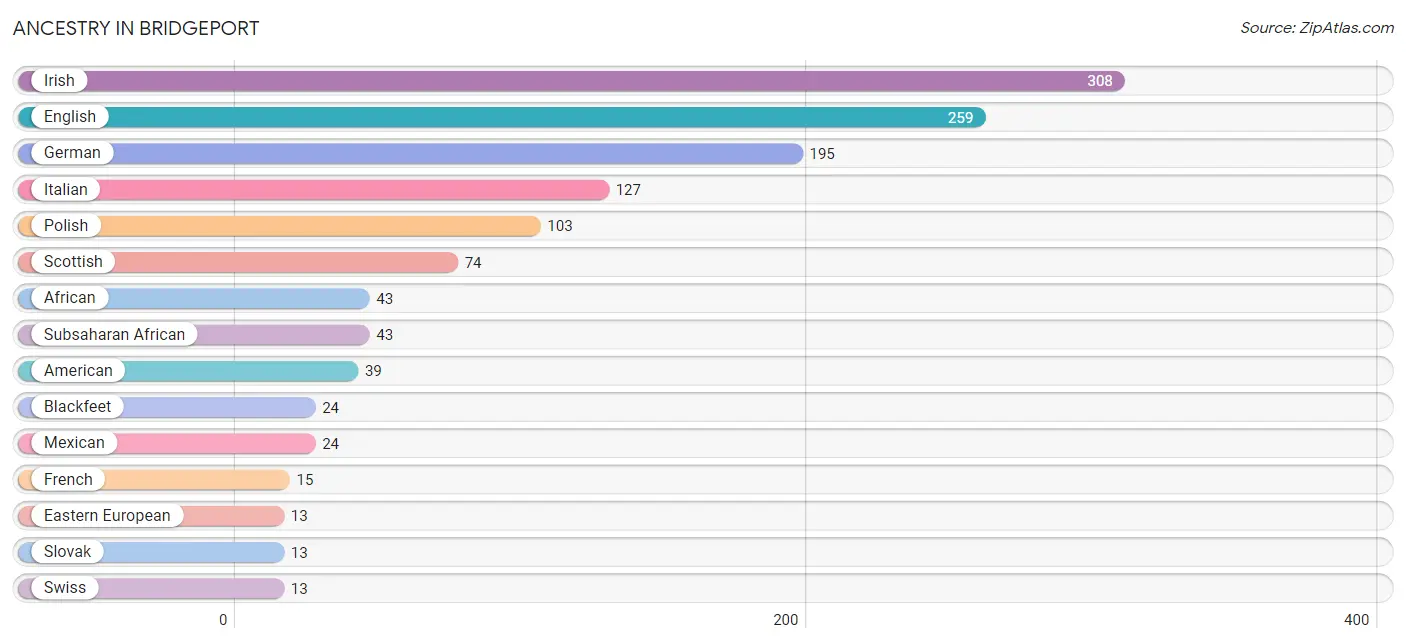
Ancestry in Bridgeport
The most populous ancestries reported in Bridgeport are Irish (308 | 21.3%), English (259 | 17.9%), German (195 | 13.5%), Italian (127 | 8.8%), and Polish (103 | 7.1%), together accounting for 68.5% of all Bridgeport residents.
| Ancestry | # Population | % Population |
| African | 43 | 3.0% |
| American | 39 | 2.7% |
| Arab | 12 | 0.8% |
| Austrian | 2 | 0.1% |
| Blackfeet | 24 | 1.7% |
| Cherokee | 7 | 0.5% |
| Croatian | 3 | 0.2% |
| Czech | 5 | 0.4% |
| Czechoslovakian | 12 | 0.8% |
| Dutch | 8 | 0.5% |
| Eastern European | 13 | 0.9% |
| Egyptian | 2 | 0.1% |
| English | 259 | 17.9% |
| European | 4 | 0.3% |
| French | 15 | 1.0% |
| French Canadian | 9 | 0.6% |
| German | 195 | 13.5% |
| Greek | 7 | 0.5% |
| Hungarian | 4 | 0.3% |
| Irish | 308 | 21.3% |
| Italian | 127 | 8.8% |
| Lebanese | 4 | 0.3% |
| Mexican | 24 | 1.7% |
| Polish | 103 | 7.1% |
| Romanian | 10 | 0.7% |
| Scotch-Irish | 8 | 0.5% |
| Scottish | 74 | 5.1% |
| Slovak | 13 | 0.9% |
| Slovene | 5 | 0.4% |
| Subsaharan African | 43 | 3.0% |
| Swedish | 7 | 0.5% |
| Swiss | 13 | 0.9% |
| Welsh | 12 | 0.8% | View All 33 Rows |
Immigrants in Bridgeport
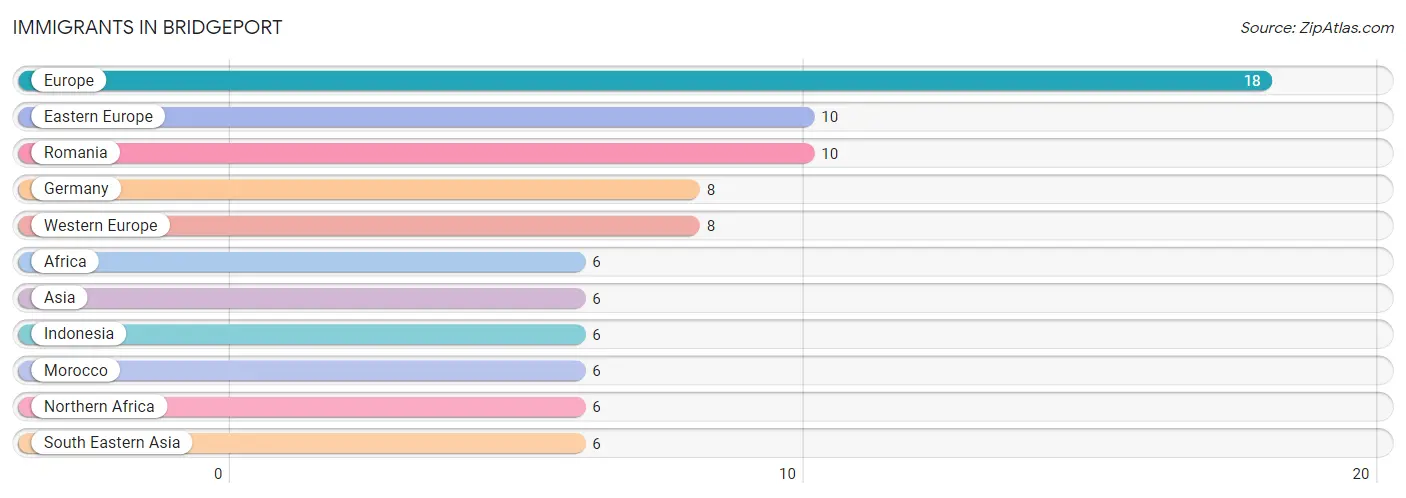
The most numerous immigrant groups reported in Bridgeport came from Europe (18 | 1.2%), Eastern Europe (10 | 0.7%), Romania (10 | 0.7%), Germany (8 | 0.5%), and Western Europe (8 | 0.5%), together accounting for 3.7% of all Bridgeport residents.
| Immigration Origin | # Population | % Population |
| Africa | 6 | 0.4% |
| Asia | 6 | 0.4% |
| Eastern Europe | 10 | 0.7% |
| Europe | 18 | 1.2% |
| Germany | 8 | 0.5% |
| Indonesia | 6 | 0.4% |
| Morocco | 6 | 0.4% |
| Northern Africa | 6 | 0.4% |
| Romania | 10 | 0.7% |
| South Eastern Asia | 6 | 0.4% |
| Western Europe | 8 | 0.5% | View All 11 Rows |
Sex and Age in Bridgeport
Sex and Age in Bridgeport
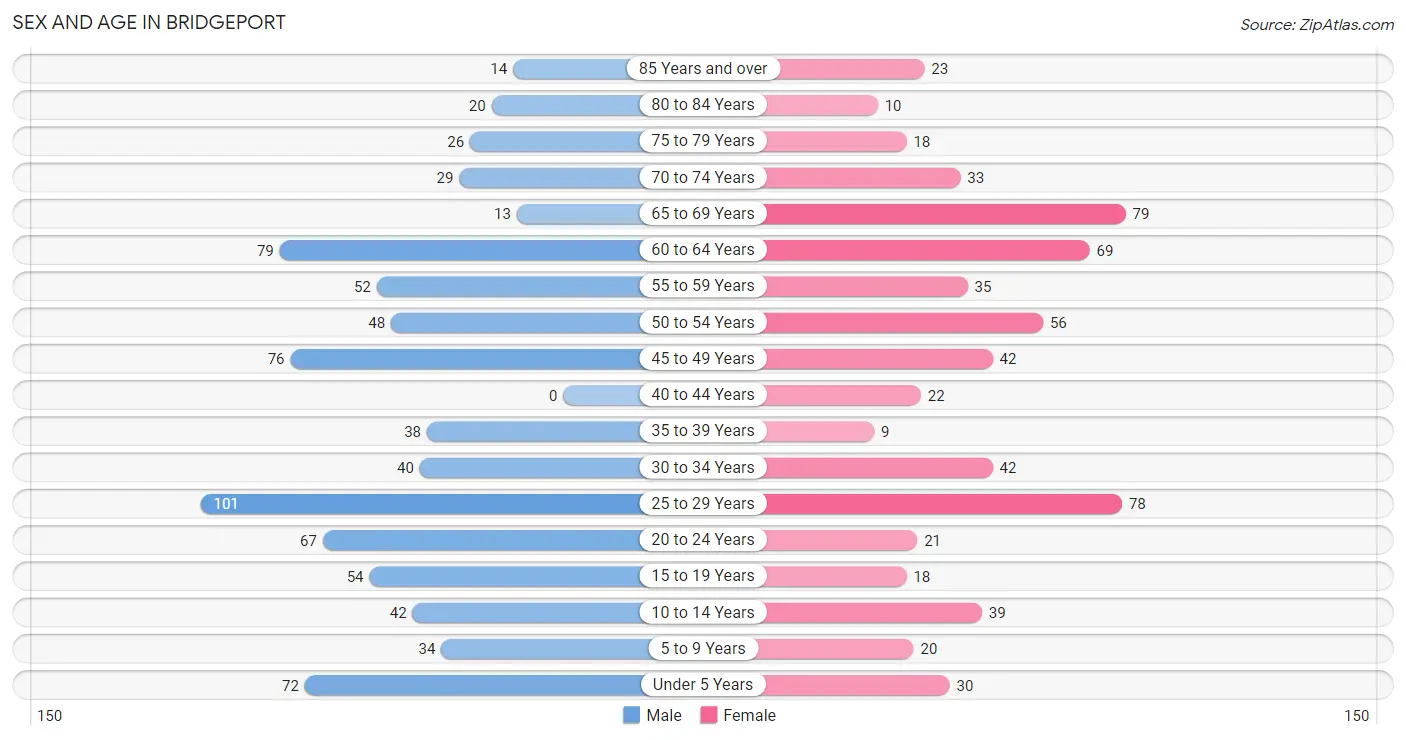
The most populous age groups in Bridgeport are 25 to 29 Years (101 | 12.6%) for men and 65 to 69 Years (79 | 12.3%) for women.
| Age Bracket | Male | Female |
| Under 5 Years | 72 (8.9%) | 30 (4.7%) |
| 5 to 9 Years | 34 (4.2%) | 20 (3.1%) |
| 10 to 14 Years | 42 (5.2%) | 39 (6.1%) |
| 15 to 19 Years | 54 (6.7%) | 18 (2.8%) |
| 20 to 24 Years | 67 (8.3%) | 21 (3.3%) |
| 25 to 29 Years | 101 (12.6%) | 78 (12.1%) |
| 30 to 34 Years | 40 (5.0%) | 42 (6.5%) |
| 35 to 39 Years | 38 (4.7%) | 9 (1.4%) |
| 40 to 44 Years | 0 (0.0%) | 22 (3.4%) |
| 45 to 49 Years | 76 (9.4%) | 42 (6.5%) |
| 50 to 54 Years | 48 (6.0%) | 56 (8.7%) |
| 55 to 59 Years | 52 (6.5%) | 35 (5.4%) |
| 60 to 64 Years | 79 (9.8%) | 69 (10.7%) |
| 65 to 69 Years | 13 (1.6%) | 79 (12.3%) |
| 70 to 74 Years | 29 (3.6%) | 33 (5.1%) |
| 75 to 79 Years | 26 (3.2%) | 18 (2.8%) |
| 80 to 84 Years | 20 (2.5%) | 10 (1.5%) |
| 85 Years and over | 14 (1.7%) | 23 (3.6%) |
| Total | 805 (100.0%) | 644 (100.0%) |
Families and Households in Bridgeport
Median Family Size in Bridgeport
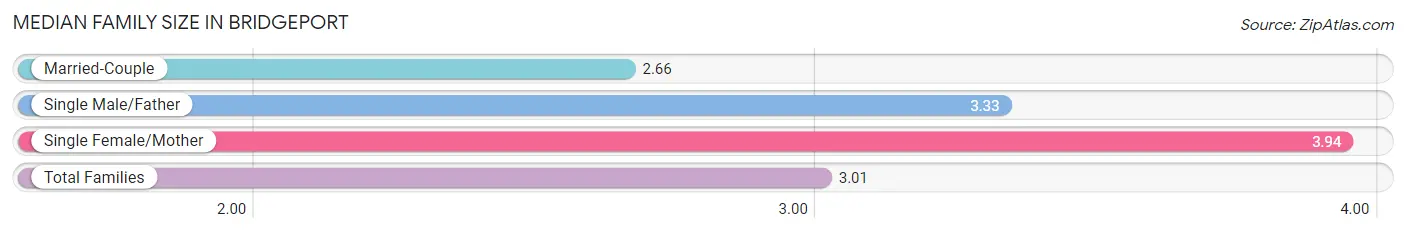
The median family size in Bridgeport is 3.01 persons per family, with single female/mother families (80 | 21.7%) accounting for the largest median family size of 3.94 persons per family. On the other hand, married-couple families (247 | 66.9%) represent the smallest median family size with 2.66 persons per family.
| Family Type | # Families | Family Size |
| Married-Couple | 247 (66.9%) | 2.66 |
| Single Male/Father | 42 (11.4%) | 3.33 |
| Single Female/Mother | 80 (21.7%) | 3.94 |
| Total Families | 369 (100.0%) | 3.01 |
Median Household Size in Bridgeport
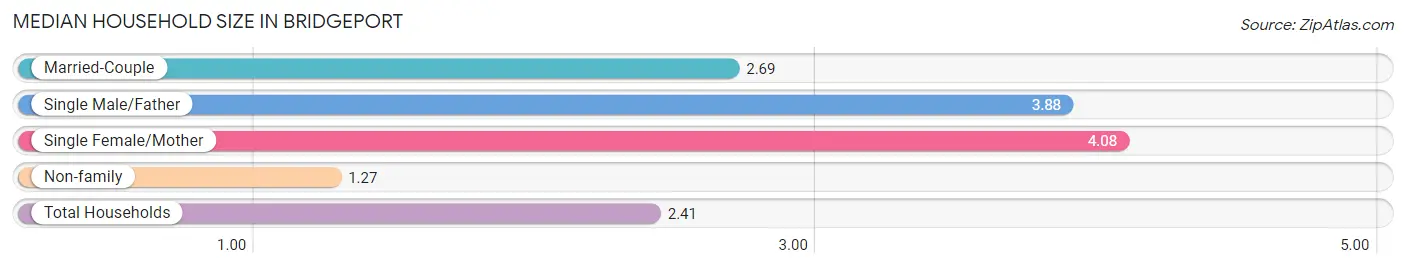
The median household size in Bridgeport is 2.41 persons per household, with single female/mother households (80 | 13.3%) accounting for the largest median household size of 4.08 persons per household. non-family households (233 | 38.7%) represent the smallest median household size with 1.27 persons per household.
| Household Type | # Households | Household Size |
| Married-Couple | 247 (41.0%) | 2.69 |
| Single Male/Father | 42 (7.0%) | 3.88 |
| Single Female/Mother | 80 (13.3%) | 4.08 |
| Non-family | 233 (38.7%) | 1.27 |
| Total Households | 602 (100.0%) | 2.41 |
Household Size by Marriage Status in Bridgeport
Out of a total of 602 households in Bridgeport, 369 (61.3%) are family households, while 233 (38.7%) are nonfamily households. The most numerous type of family households are 2-person households, comprising 194, and the most common type of nonfamily households are 1-person households, comprising 193.
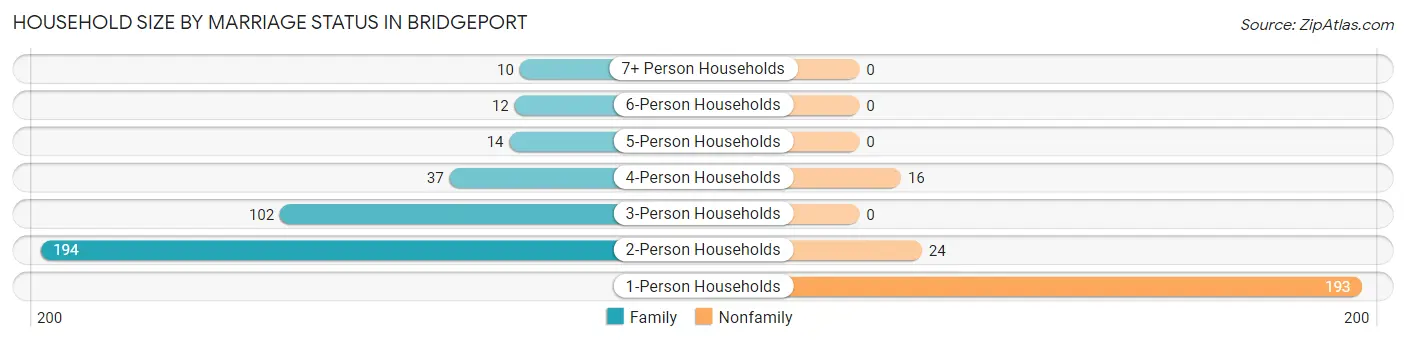
| Household Size | Family Households | Nonfamily Households |
| 1-Person Households | - | 193 (32.1%) |
| 2-Person Households | 194 (32.2%) | 24 (4.0%) |
| 3-Person Households | 102 (16.9%) | 0 (0.0%) |
| 4-Person Households | 37 (6.1%) | 16 (2.7%) |
| 5-Person Households | 14 (2.3%) | 0 (0.0%) |
| 6-Person Households | 12 (2.0%) | 0 (0.0%) |
| 7+ Person Households | 10 (1.7%) | 0 (0.0%) |
| Total | 369 (61.3%) | 233 (38.7%) |
Female Fertility in Bridgeport
Fertility by Age in Bridgeport
Average fertility rate in Bridgeport is 97.0 births per 1,000 women. Women in the age bracket of 20 to 34 years have the highest fertility rate with 113.0 births per 1,000 women. Women in the age bracket of 20 to 34 years acount for 69.6% of all women with births.
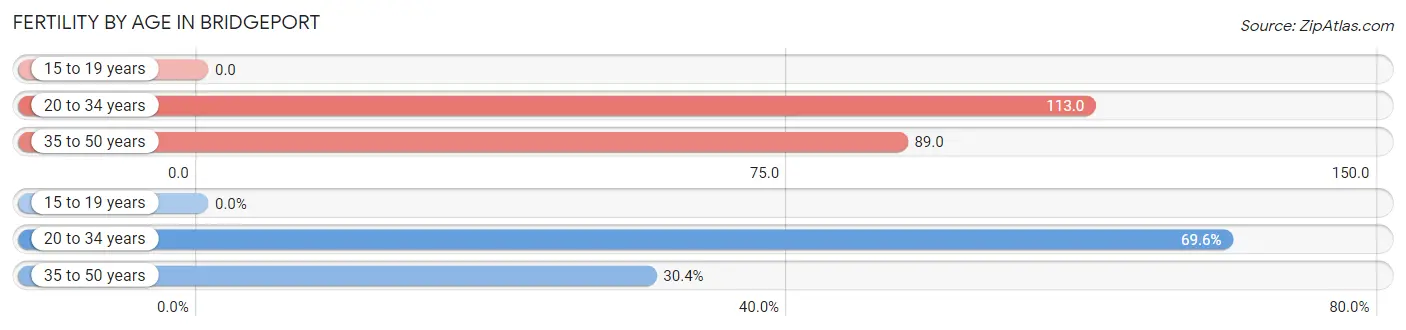
| Age Bracket | Women with Births | Births / 1,000 Women |
| 15 to 19 years | 0 (0.0%) | 0.0 |
| 20 to 34 years | 16 (69.6%) | 113.0 |
| 35 to 50 years | 7 (30.4%) | 89.0 |
| Total | 23 (100.0%) | 97.0 |
Fertility by Age by Marriage Status in Bridgeport
69.6% of women with births (23) in Bridgeport are married. The highest percentage of unmarried women with births falls into 35 to 50 years age bracket with 100.0% of them unmarried at the time of birth, while the lowest percentage of unmarried women with births belong to 20 to 34 years age bracket with 0.0% of them unmarried.
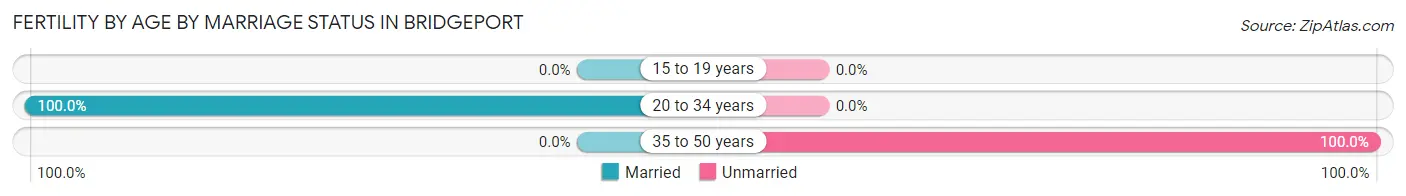
| Age Bracket | Married | Unmarried |
| 15 to 19 years | 0 (0.0%) | 0 (0.0%) |
| 20 to 34 years | 16 (100.0%) | 0 (0.0%) |
| 35 to 50 years | 0 (0.0%) | 7 (100.0%) |
| Total | 16 (69.6%) | 7 (30.4%) |
Fertility by Education in Bridgeport
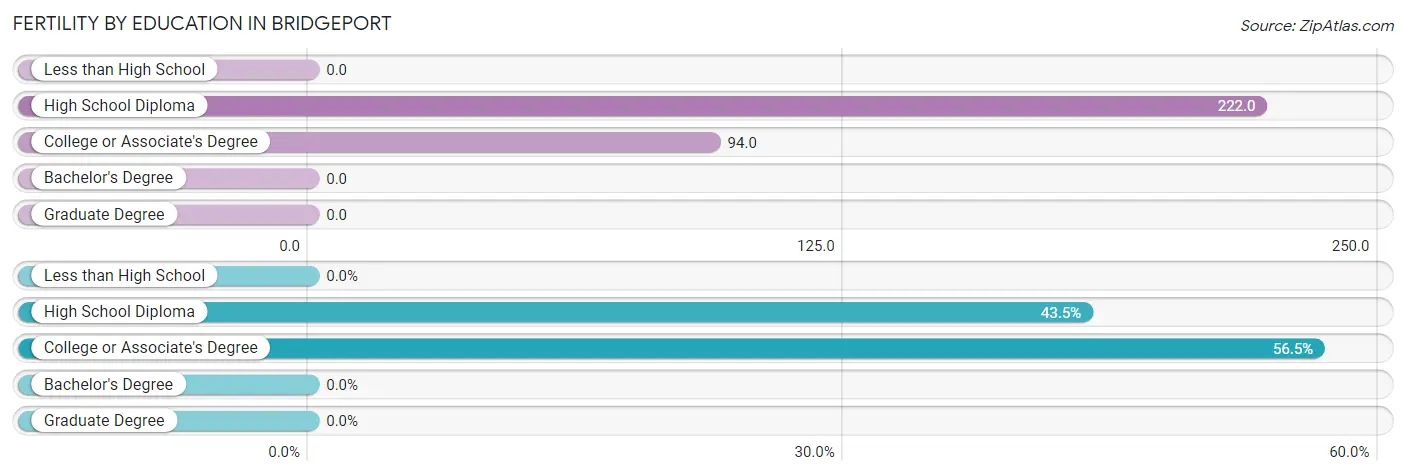
| Educational Attainment | Women with Births | Births / 1,000 Women |
| Less than High School | 0 (0.0%) | 0.0 |
| High School Diploma | 10 (43.5%) | 222.0 |
| College or Associate's Degree | 13 (56.5%) | 94.0 |
| Bachelor's Degree | 0 (0.0%) | 0.0 |
| Graduate Degree | 0 (0.0%) | 0.0 |
| Total | 23 (100.0%) | 97.0 |
Fertility by Education by Marriage Status in Bridgeport
30.4% of women with births in Bridgeport are unmarried. Women with the educational attainment of college or associate's degree are most likely to be married with 100.0% of them married at childbirth, while women with the educational attainment of high school diploma are least likely to be married with 70.0% of them unmarried at childbirth.
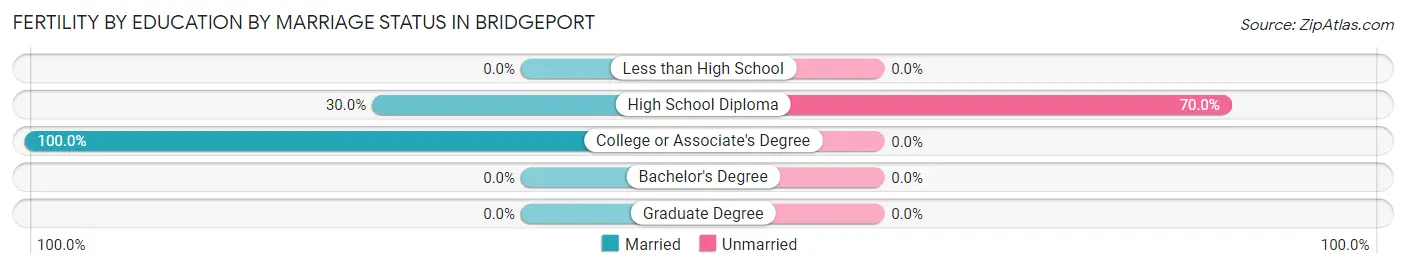
| Educational Attainment | Married | Unmarried |
| Less than High School | 0 (0.0%) | 0 (0.0%) |
| High School Diploma | 3 (30.0%) | 7 (70.0%) |
| College or Associate's Degree | 13 (100.0%) | 0 (0.0%) |
| Bachelor's Degree | 0 (0.0%) | 0 (0.0%) |
| Graduate Degree | 0 (0.0%) | 0 (0.0%) |
| Total | 16 (69.6%) | 7 (30.4%) |
Employment Characteristics in Bridgeport
Employment by Class of Employer in Bridgeport
Among the 655 employed individuals in Bridgeport, private company employees (499 | 76.2%), state government employees (51 | 7.8%), and not-for-profit organizations (36 | 5.5%) make up the most common classes of employment.
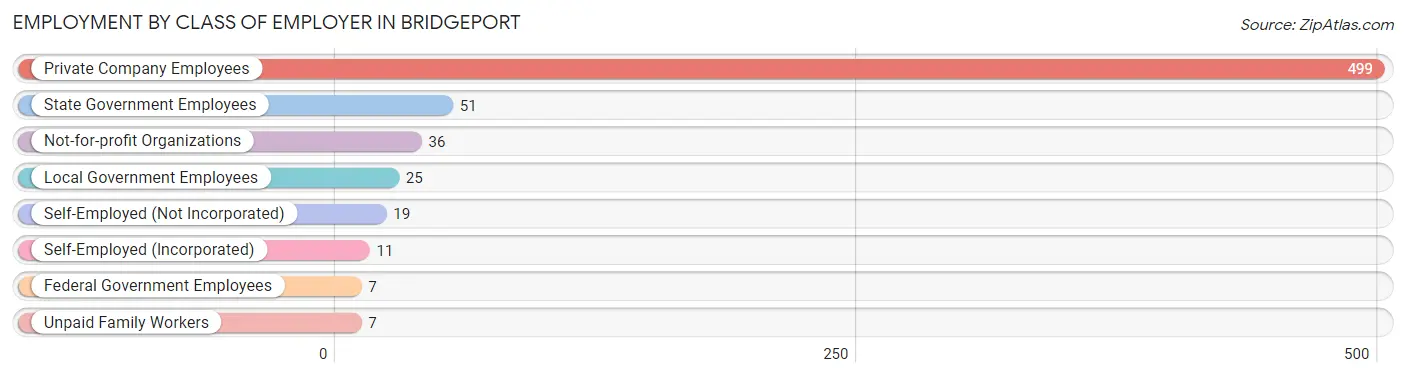
| Employer Class | # Employees | % Employees |
| Private Company Employees | 499 | 76.2% |
| Self-Employed (Incorporated) | 11 | 1.7% |
| Self-Employed (Not Incorporated) | 19 | 2.9% |
| Not-for-profit Organizations | 36 | 5.5% |
| Local Government Employees | 25 | 3.8% |
| State Government Employees | 51 | 7.8% |
| Federal Government Employees | 7 | 1.1% |
| Unpaid Family Workers | 7 | 1.1% |
| Total | 655 | 100.0% |
Employment Status by Age in Bridgeport
According to the labor force statistics for Bridgeport, out of the total population over 16 years of age (1,201), 60.0% or 721 individuals are in the labor force, with 8.3% or 60 of them unemployed. The age group with the highest labor force participation rate is 25 to 29 years, with 89.4% or 160 individuals in the labor force. Within the labor force, the 16 to 19 years age range has the highest percentage of unemployed individuals, with 40.0% or 12 of them being unemployed.
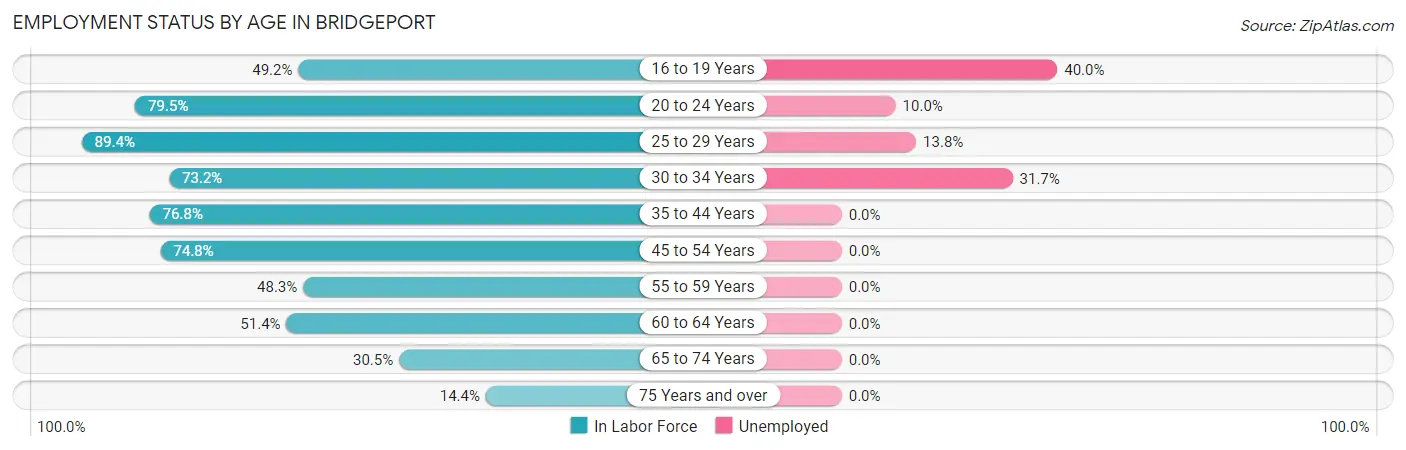
| Age Bracket | In Labor Force | Unemployed |
| 16 to 19 Years | 30 (49.2%) | 12 (40.0%) |
| 20 to 24 Years | 70 (79.5%) | 7 (10.0%) |
| 25 to 29 Years | 160 (89.4%) | 22 (13.8%) |
| 30 to 34 Years | 60 (73.2%) | 19 (31.7%) |
| 35 to 44 Years | 53 (76.8%) | 0 (0.0%) |
| 45 to 54 Years | 166 (74.8%) | 0 (0.0%) |
| 55 to 59 Years | 42 (48.3%) | 0 (0.0%) |
| 60 to 64 Years | 76 (51.4%) | 0 (0.0%) |
| 65 to 74 Years | 47 (30.5%) | 0 (0.0%) |
| 75 Years and over | 16 (14.4%) | 0 (0.0%) |
| Total | 721 (60.0%) | 60 (8.3%) |
Employment Status by Educational Attainment in Bridgeport
According to labor force statistics for Bridgeport, 70.8% of individuals (557) out of the total population between 25 and 64 years of age (787) are in the labor force, with 7.4% or 41 of them being unemployed. The group with the highest labor force participation rate are those with the educational attainment of bachelor's degree or higher, with 89.9% or 107 individuals in the labor force. Within the labor force, individuals with less than high school education have the highest percentage of unemployment, with 100.0% or 22 of them being unemployed.
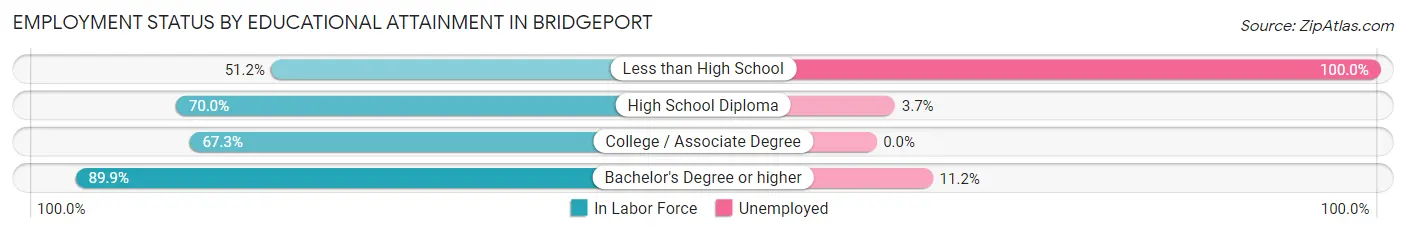
| Educational Attainment | In Labor Force | Unemployed |
| Less than High School | 22 (51.2%) | 43 (100.0%) |
| High School Diploma | 187 (70.0%) | 10 (3.7%) |
| College / Associate Degree | 241 (67.3%) | 0 (0.0%) |
| Bachelor's Degree or higher | 107 (89.9%) | 13 (11.2%) |
| Total | 557 (70.8%) | 58 (7.4%) |
Employment Occupations by Sex in Bridgeport
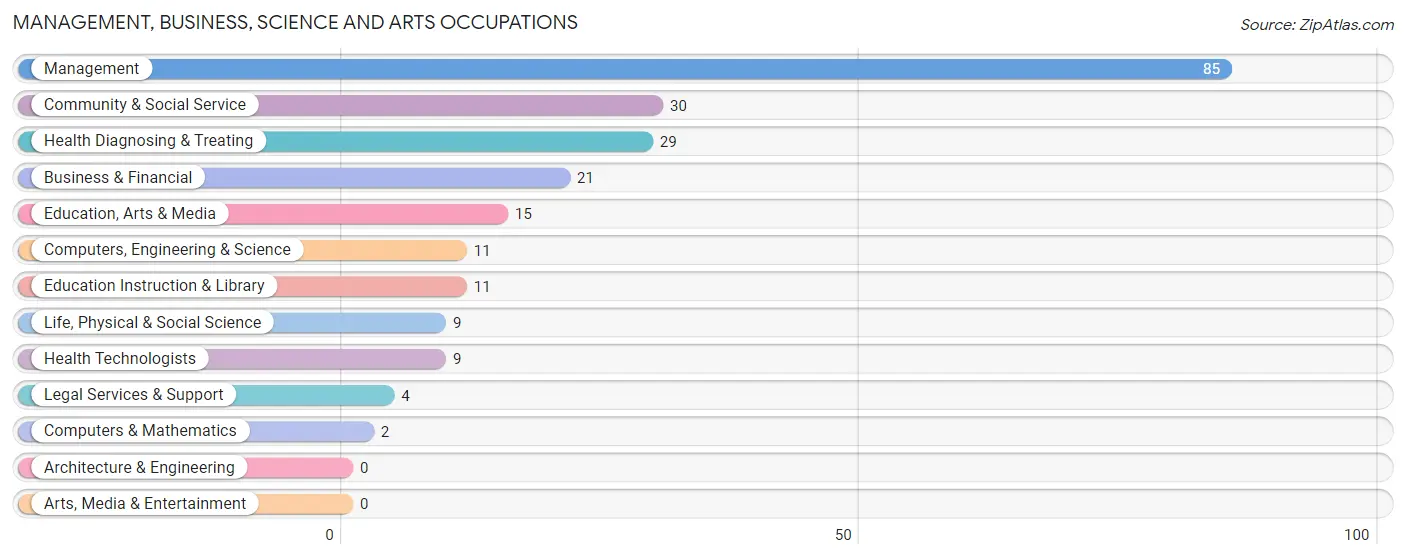
Management, Business, Science and Arts Occupations
The most common Management, Business, Science and Arts occupations in Bridgeport are Management (85 | 12.9%), Community & Social Service (30 | 4.5%), Health Diagnosing & Treating (29 | 4.4%), Business & Financial (21 | 3.2%), and Education, Arts & Media (15 | 2.3%).
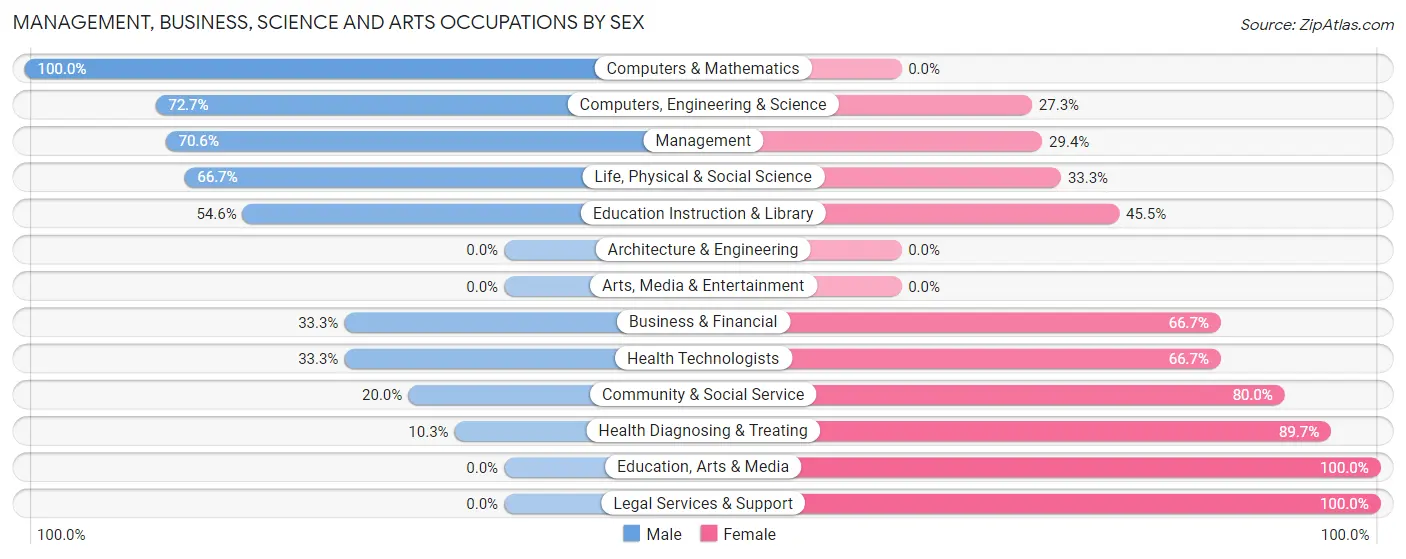
Management, Business, Science and Arts Occupations by Sex
Within the Management, Business, Science and Arts occupations in Bridgeport, the most male-oriented occupations are Computers & Mathematics (100.0%), Computers, Engineering & Science (72.7%), and Management (70.6%), while the most female-oriented occupations are Education, Arts & Media (100.0%), Legal Services & Support (100.0%), and Health Diagnosing & Treating (89.7%).
| Occupation | Male | Female |
| Management | 60 (70.6%) | 25 (29.4%) |
| Business & Financial | 7 (33.3%) | 14 (66.7%) |
| Computers, Engineering & Science | 8 (72.7%) | 3 (27.3%) |
| Computers & Mathematics | 2 (100.0%) | 0 (0.0%) |
| Architecture & Engineering | 0 (0.0%) | 0 (0.0%) |
| Life, Physical & Social Science | 6 (66.7%) | 3 (33.3%) |
| Community & Social Service | 6 (20.0%) | 24 (80.0%) |
| Education, Arts & Media | 0 (0.0%) | 15 (100.0%) |
| Legal Services & Support | 0 (0.0%) | 4 (100.0%) |
| Education Instruction & Library | 6 (54.5%) | 5 (45.5%) |
| Arts, Media & Entertainment | 0 (0.0%) | 0 (0.0%) |
| Health Diagnosing & Treating | 3 (10.3%) | 26 (89.7%) |
| Health Technologists | 3 (33.3%) | 6 (66.7%) |
| Total (Category) | 84 (47.7%) | 92 (52.3%) |
| Total (Overall) | 338 (51.2%) | 322 (48.8%) |
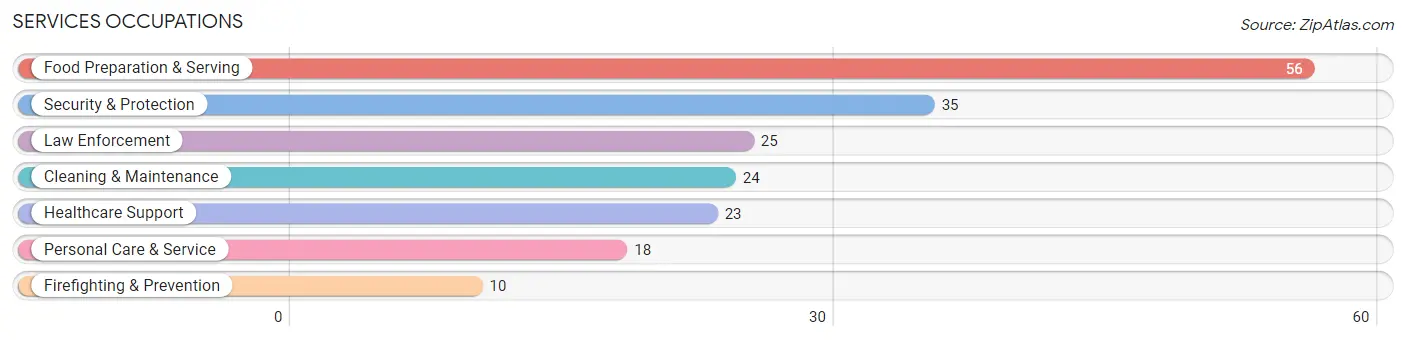
Services Occupations
The most common Services occupations in Bridgeport are Food Preparation & Serving (56 | 8.5%), Security & Protection (35 | 5.3%), Law Enforcement (25 | 3.8%), Cleaning & Maintenance (24 | 3.6%), and Healthcare Support (23 | 3.5%).
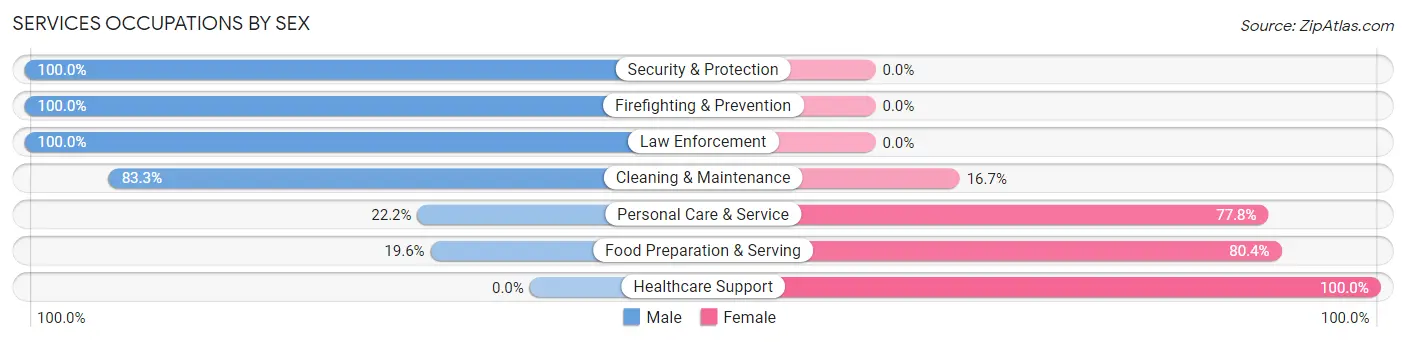
Services Occupations by Sex
Within the Services occupations in Bridgeport, the most male-oriented occupations are Security & Protection (100.0%), Firefighting & Prevention (100.0%), and Law Enforcement (100.0%), while the most female-oriented occupations are Healthcare Support (100.0%), Food Preparation & Serving (80.4%), and Personal Care & Service (77.8%).
| Occupation | Male | Female |
| Healthcare Support | 0 (0.0%) | 23 (100.0%) |
| Security & Protection | 35 (100.0%) | 0 (0.0%) |
| Firefighting & Prevention | 10 (100.0%) | 0 (0.0%) |
| Law Enforcement | 25 (100.0%) | 0 (0.0%) |
| Food Preparation & Serving | 11 (19.6%) | 45 (80.4%) |
| Cleaning & Maintenance | 20 (83.3%) | 4 (16.7%) |
| Personal Care & Service | 4 (22.2%) | 14 (77.8%) |
| Total (Category) | 70 (44.9%) | 86 (55.1%) |
| Total (Overall) | 338 (51.2%) | 322 (48.8%) |
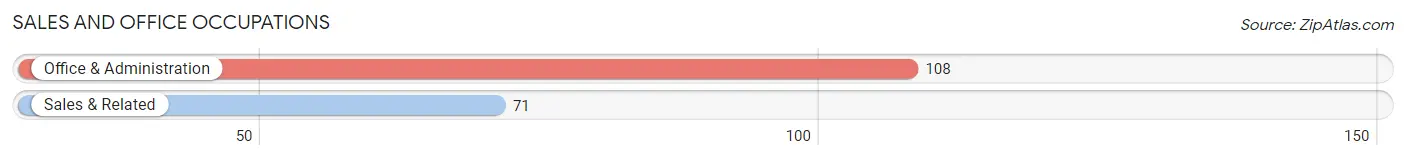
Sales and Office Occupations
The most common Sales and Office occupations in Bridgeport are Office & Administration (108 | 16.4%), and Sales & Related (71 | 10.8%).
Sales and Office Occupations by Sex
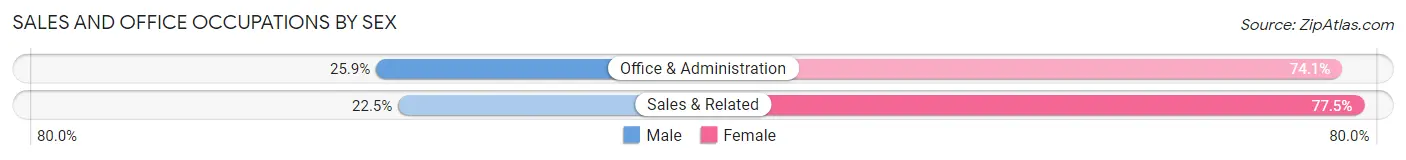
| Occupation | Male | Female |
| Sales & Related | 16 (22.5%) | 55 (77.5%) |
| Office & Administration | 28 (25.9%) | 80 (74.1%) |
| Total (Category) | 44 (24.6%) | 135 (75.4%) |
| Total (Overall) | 338 (51.2%) | 322 (48.8%) |
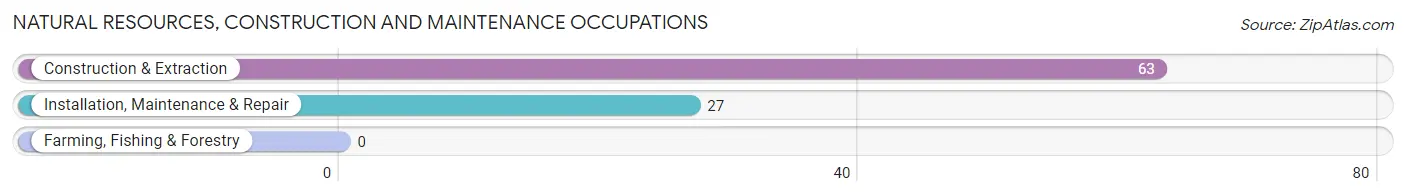
Natural Resources, Construction and Maintenance Occupations
The most common Natural Resources, Construction and Maintenance occupations in Bridgeport are Construction & Extraction (63 | 9.6%), and Installation, Maintenance & Repair (27 | 4.1%).
Natural Resources, Construction and Maintenance Occupations by Sex
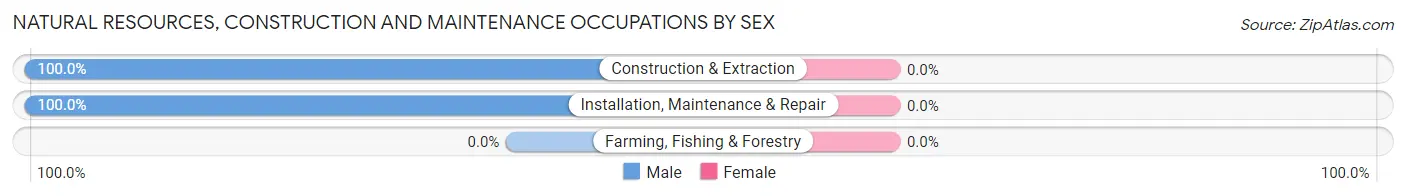
| Occupation | Male | Female |
| Farming, Fishing & Forestry | 0 (0.0%) | 0 (0.0%) |
| Construction & Extraction | 63 (100.0%) | 0 (0.0%) |
| Installation, Maintenance & Repair | 27 (100.0%) | 0 (0.0%) |
| Total (Category) | 90 (100.0%) | 0 (0.0%) |
| Total (Overall) | 338 (51.2%) | 322 (48.8%) |
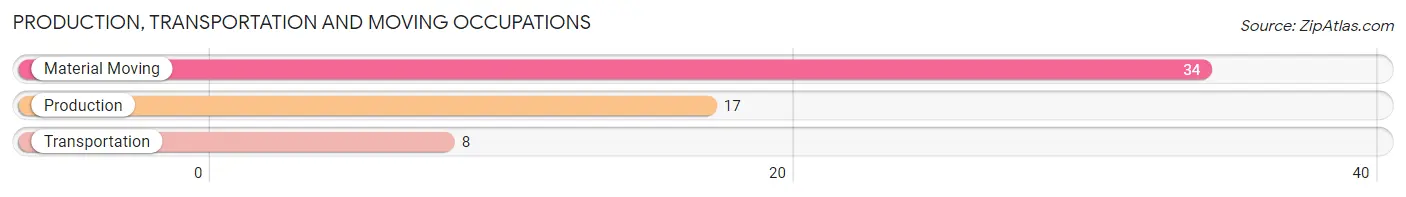
Production, Transportation and Moving Occupations
The most common Production, Transportation and Moving occupations in Bridgeport are Material Moving (34 | 5.1%), Production (17 | 2.6%), and Transportation (8 | 1.2%).
Production, Transportation and Moving Occupations by Sex
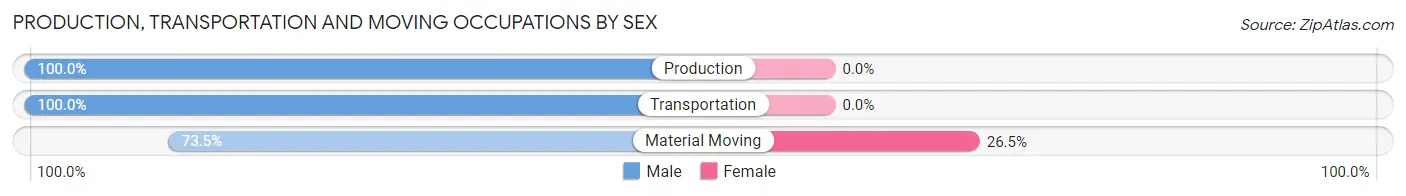
| Occupation | Male | Female |
| Production | 17 (100.0%) | 0 (0.0%) |
| Transportation | 8 (100.0%) | 0 (0.0%) |
| Material Moving | 25 (73.5%) | 9 (26.5%) |
| Total (Category) | 50 (84.8%) | 9 (15.2%) |
| Total (Overall) | 338 (51.2%) | 322 (48.8%) |
Employment Industries by Sex in Bridgeport
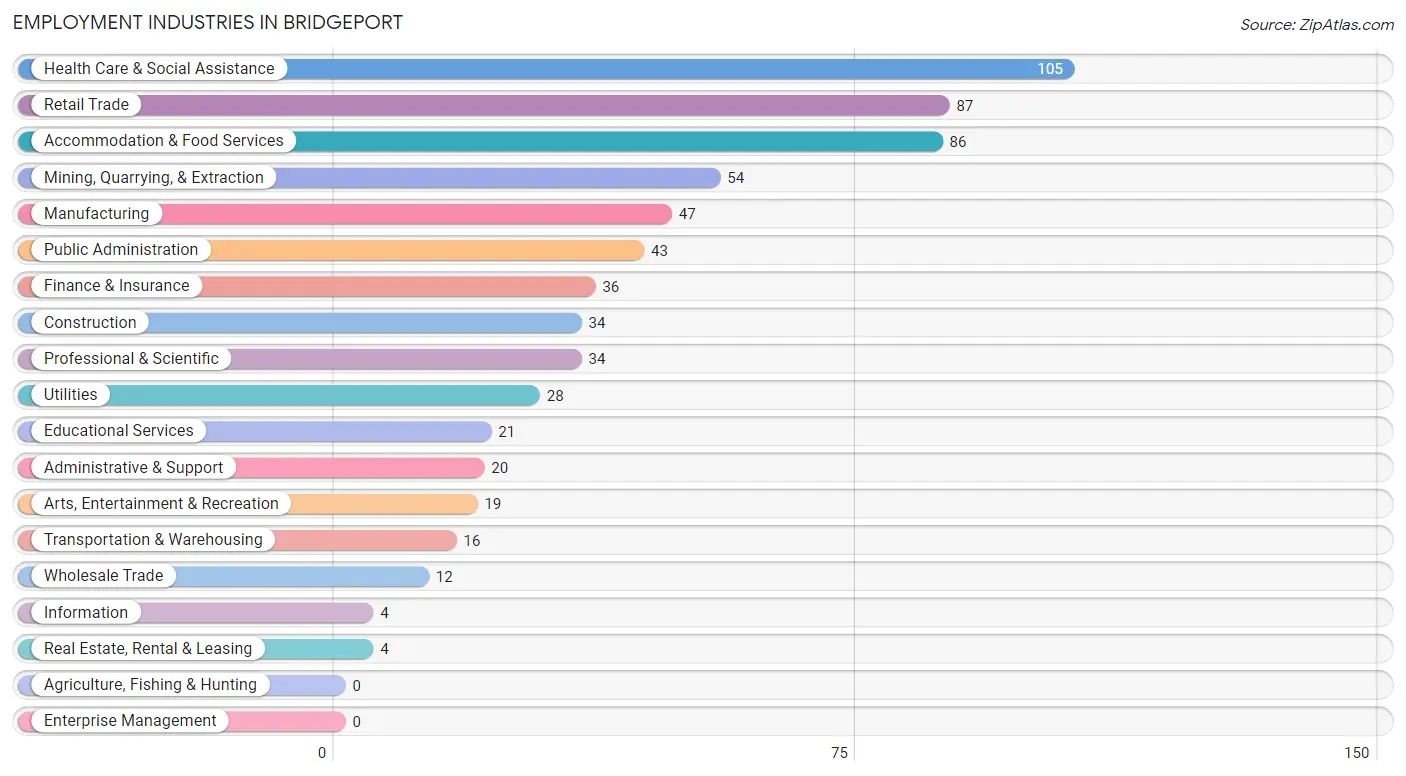
Employment Industries in Bridgeport
The major employment industries in Bridgeport include Health Care & Social Assistance (105 | 15.9%), Retail Trade (87 | 13.2%), Accommodation & Food Services (86 | 13.0%), Mining, Quarrying, & Extraction (54 | 8.2%), and Manufacturing (47 | 7.1%).
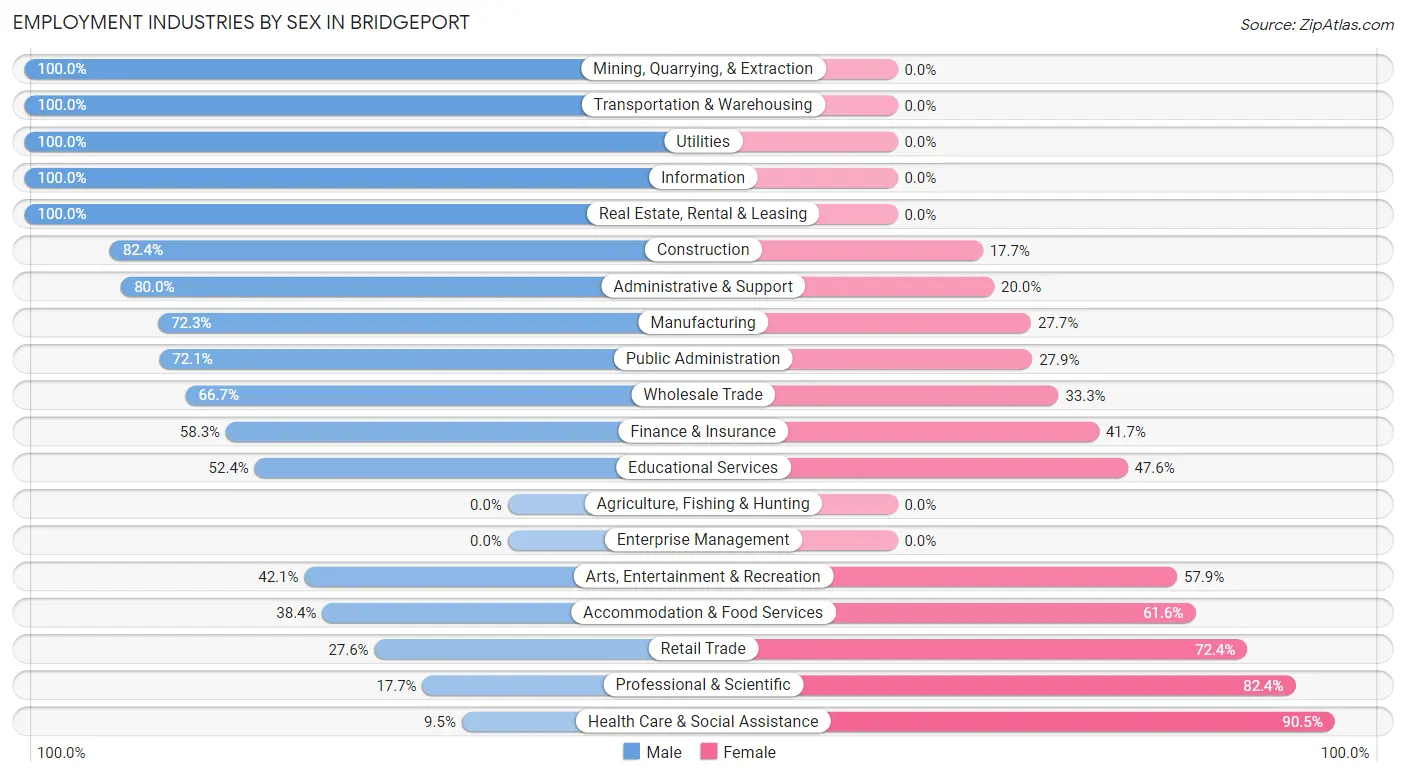
Employment Industries by Sex in Bridgeport
The Bridgeport industries that see more men than women are Mining, Quarrying, & Extraction (100.0%), Transportation & Warehousing (100.0%), and Utilities (100.0%), whereas the industries that tend to have a higher number of women are Health Care & Social Assistance (90.5%), Professional & Scientific (82.4%), and Retail Trade (72.4%).
| Industry | Male | Female |
| Agriculture, Fishing & Hunting | 0 (0.0%) | 0 (0.0%) |
| Mining, Quarrying, & Extraction | 54 (100.0%) | 0 (0.0%) |
| Construction | 28 (82.4%) | 6 (17.6%) |
| Manufacturing | 34 (72.3%) | 13 (27.7%) |
| Wholesale Trade | 8 (66.7%) | 4 (33.3%) |
| Retail Trade | 24 (27.6%) | 63 (72.4%) |
| Transportation & Warehousing | 16 (100.0%) | 0 (0.0%) |
| Utilities | 28 (100.0%) | 0 (0.0%) |
| Information | 4 (100.0%) | 0 (0.0%) |
| Finance & Insurance | 21 (58.3%) | 15 (41.7%) |
| Real Estate, Rental & Leasing | 4 (100.0%) | 0 (0.0%) |
| Professional & Scientific | 6 (17.6%) | 28 (82.4%) |
| Enterprise Management | 0 (0.0%) | 0 (0.0%) |
| Administrative & Support | 16 (80.0%) | 4 (20.0%) |
| Educational Services | 11 (52.4%) | 10 (47.6%) |
| Health Care & Social Assistance | 10 (9.5%) | 95 (90.5%) |
| Arts, Entertainment & Recreation | 8 (42.1%) | 11 (57.9%) |
| Accommodation & Food Services | 33 (38.4%) | 53 (61.6%) |
| Public Administration | 31 (72.1%) | 12 (27.9%) |
| Total | 338 (51.2%) | 322 (48.8%) |
Education in Bridgeport
School Enrollment in Bridgeport
The most common levels of schooling among the 261 students in Bridgeport are middle school (79 | 30.3%), high school (69 | 26.4%), and college / undergraduate (52 | 19.9%).
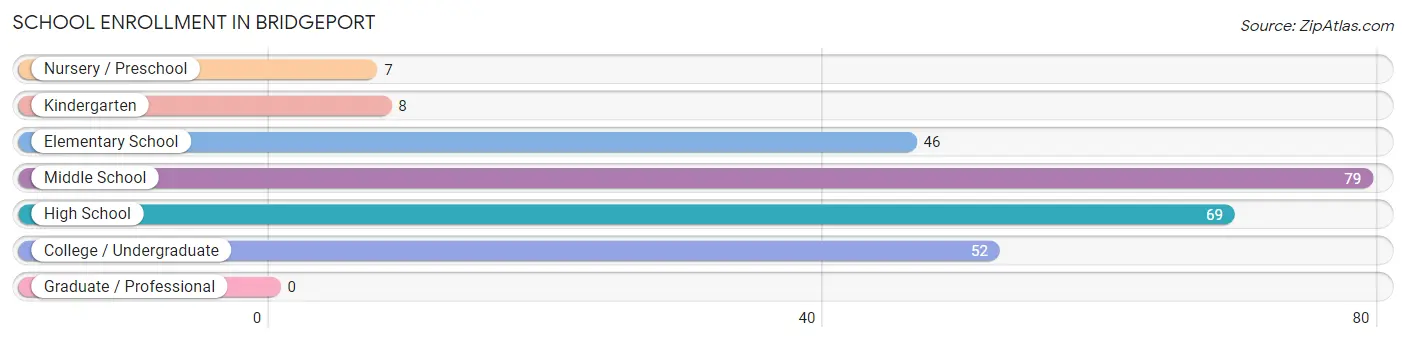
| School Level | # Students | % Students |
| Nursery / Preschool | 7 | 2.7% |
| Kindergarten | 8 | 3.1% |
| Elementary School | 46 | 17.6% |
| Middle School | 79 | 30.3% |
| High School | 69 | 26.4% |
| College / Undergraduate | 52 | 19.9% |
| Graduate / Professional | 0 | 0.0% |
| Total | 261 | 100.0% |
School Enrollment by Age by Funding Source in Bridgeport
Out of a total of 261 students who are enrolled in schools in Bridgeport, 6 (2.3%) attend a private institution, while the remaining 255 (97.7%) are enrolled in public schools. The age group of 15 to 17 year olds has the highest likelihood of being enrolled in private schools, with 6 (11.1% in the age bracket) enrolled. Conversely, the age group of 3 to 4 year olds has the lowest likelihood of being enrolled in a private school, with 7 (100.0% in the age bracket) attending a public institution.
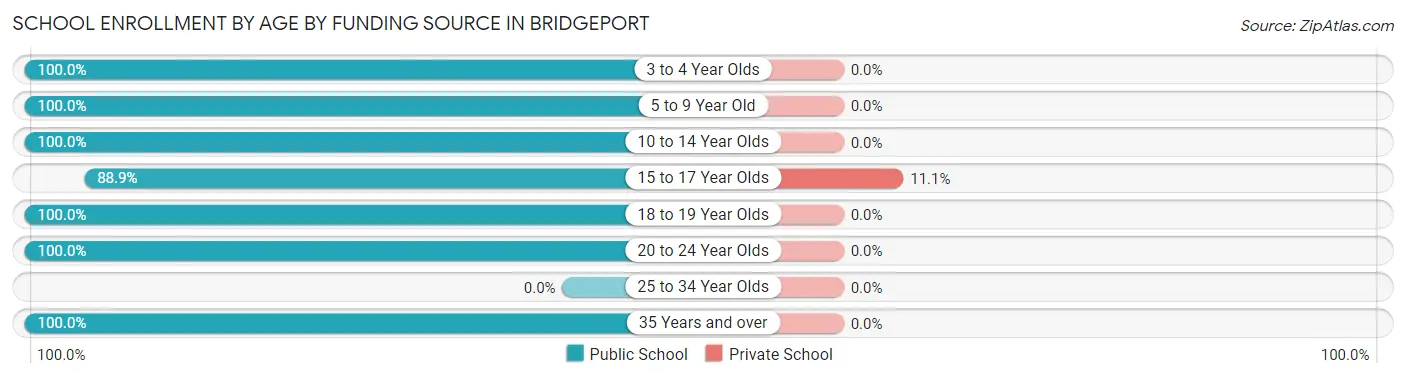
| Age Bracket | Public School | Private School |
| 3 to 4 Year Olds | 7 (100.0%) | 0 (0.0%) |
| 5 to 9 Year Old | 54 (100.0%) | 0 (0.0%) |
| 10 to 14 Year Olds | 81 (100.0%) | 0 (0.0%) |
| 15 to 17 Year Olds | 48 (88.9%) | 6 (11.1%) |
| 18 to 19 Year Olds | 12 (100.0%) | 0 (0.0%) |
| 20 to 24 Year Olds | 41 (100.0%) | 0 (0.0%) |
| 25 to 34 Year Olds | 0 (0.0%) | 0 (0.0%) |
| 35 Years and over | 12 (100.0%) | 0 (0.0%) |
| Total | 255 (97.7%) | 6 (2.3%) |
Educational Attainment by Field of Study in Bridgeport
Science & technology (46 | 27.5%), business (24 | 14.4%), physical & health sciences (20 | 12.0%), arts & humanities (19 | 11.4%), and education (18 | 10.8%) are the most common fields of study among 167 individuals in Bridgeport who have obtained a bachelor's degree or higher.
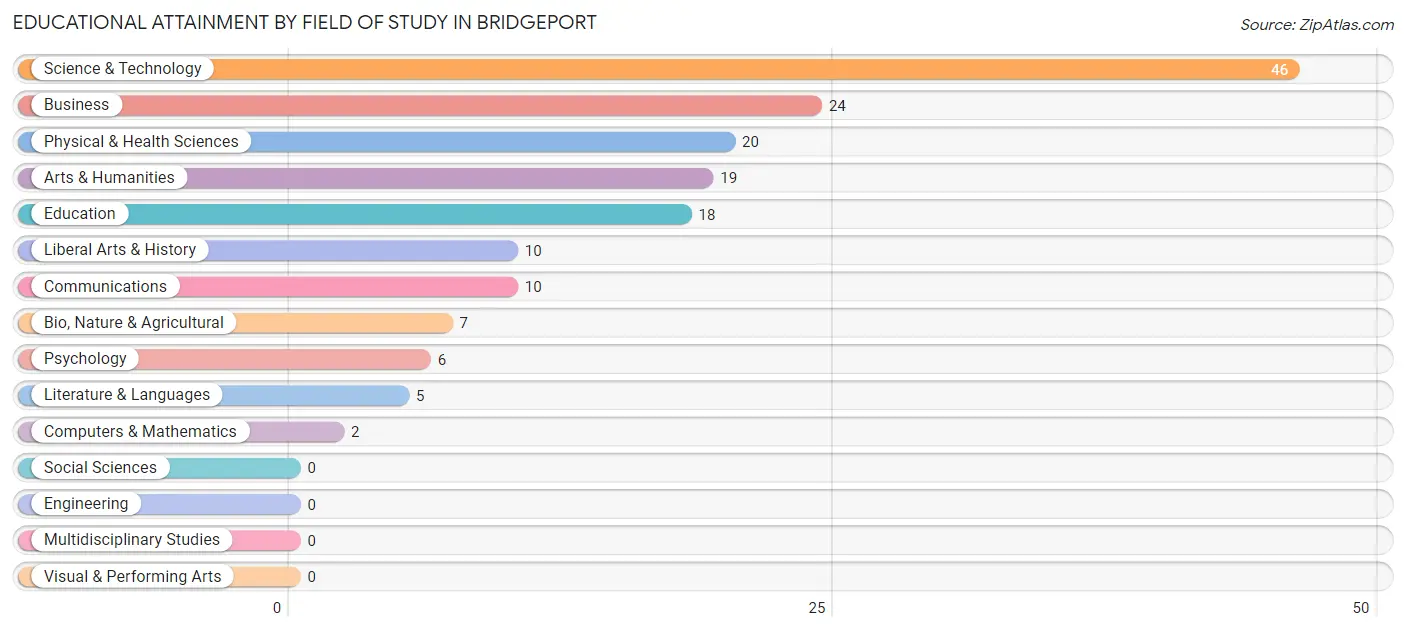
| Field of Study | # Graduates | % Graduates |
| Computers & Mathematics | 2 | 1.2% |
| Bio, Nature & Agricultural | 7 | 4.2% |
| Physical & Health Sciences | 20 | 12.0% |
| Psychology | 6 | 3.6% |
| Social Sciences | 0 | 0.0% |
| Engineering | 0 | 0.0% |
| Multidisciplinary Studies | 0 | 0.0% |
| Science & Technology | 46 | 27.5% |
| Business | 24 | 14.4% |
| Education | 18 | 10.8% |
| Literature & Languages | 5 | 3.0% |
| Liberal Arts & History | 10 | 6.0% |
| Visual & Performing Arts | 0 | 0.0% |
| Communications | 10 | 6.0% |
| Arts & Humanities | 19 | 11.4% |
| Total | 167 | 100.0% |
Transportation & Commute in Bridgeport
Vehicle Availability by Sex in Bridgeport
The most prevalent vehicle ownership categories in Bridgeport are males with 2 vehicles (203, accounting for 60.1%) and females with 2 vehicles (100, making up 64.0%).
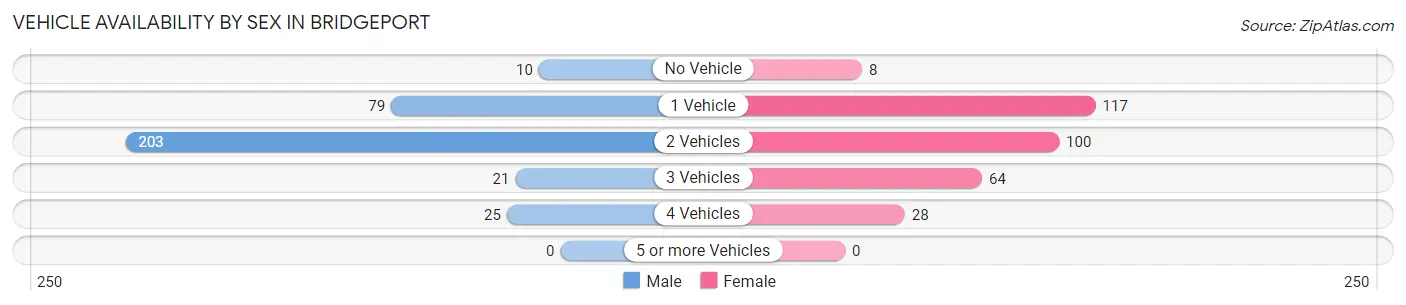
| Vehicles Available | Male | Female |
| No Vehicle | 10 (3.0%) | 8 (2.5%) |
| 1 Vehicle | 79 (23.4%) | 117 (36.9%) |
| 2 Vehicles | 203 (60.1%) | 100 (31.6%) |
| 3 Vehicles | 21 (6.2%) | 64 (20.2%) |
| 4 Vehicles | 25 (7.4%) | 28 (8.8%) |
| 5 or more Vehicles | 0 (0.0%) | 0 (0.0%) |
| Total | 338 (100.0%) | 317 (100.0%) |
Commute Time in Bridgeport
The most frequently occuring commute durations in Bridgeport are 5 to 9 minutes (140 commuters, 22.4%), 10 to 14 minutes (91 commuters, 14.5%), and 15 to 19 minutes (82 commuters, 13.1%).
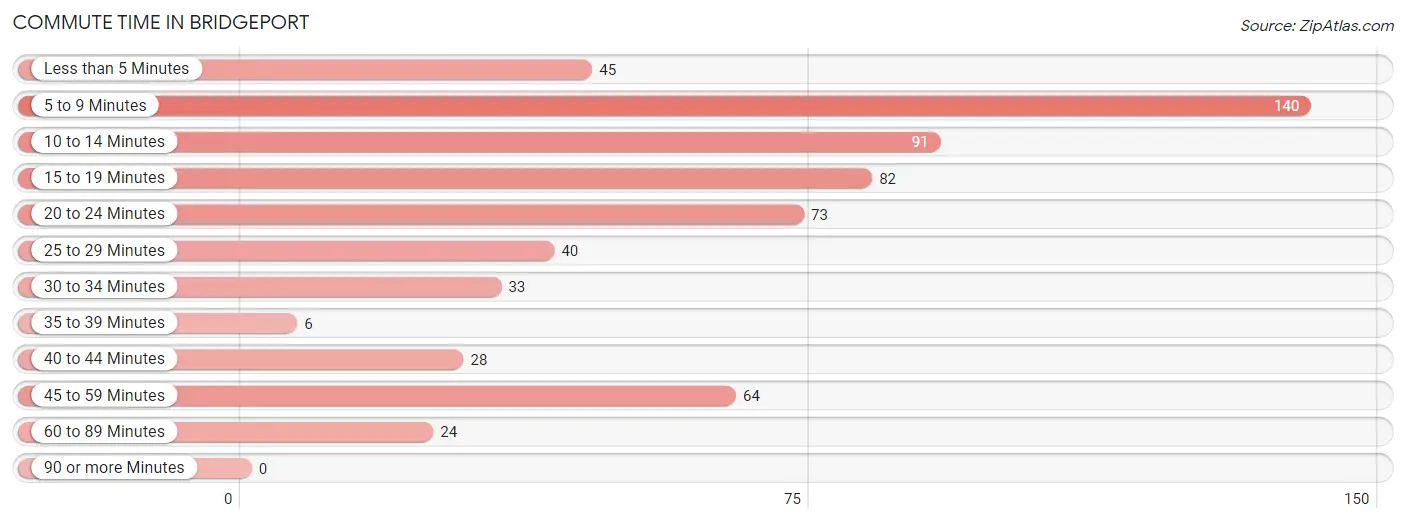
| Commute Time | # Commuters | % Commuters |
| Less than 5 Minutes | 45 | 7.2% |
| 5 to 9 Minutes | 140 | 22.4% |
| 10 to 14 Minutes | 91 | 14.5% |
| 15 to 19 Minutes | 82 | 13.1% |
| 20 to 24 Minutes | 73 | 11.7% |
| 25 to 29 Minutes | 40 | 6.4% |
| 30 to 34 Minutes | 33 | 5.3% |
| 35 to 39 Minutes | 6 | 1.0% |
| 40 to 44 Minutes | 28 | 4.5% |
| 45 to 59 Minutes | 64 | 10.2% |
| 60 to 89 Minutes | 24 | 3.8% |
| 90 or more Minutes | 0 | 0.0% |
Commute Time by Sex in Bridgeport
The most common commute times in Bridgeport are 45 to 59 minutes (64 commuters, 19.5%) for males and 5 to 9 minutes (85 commuters, 28.6%) for females.
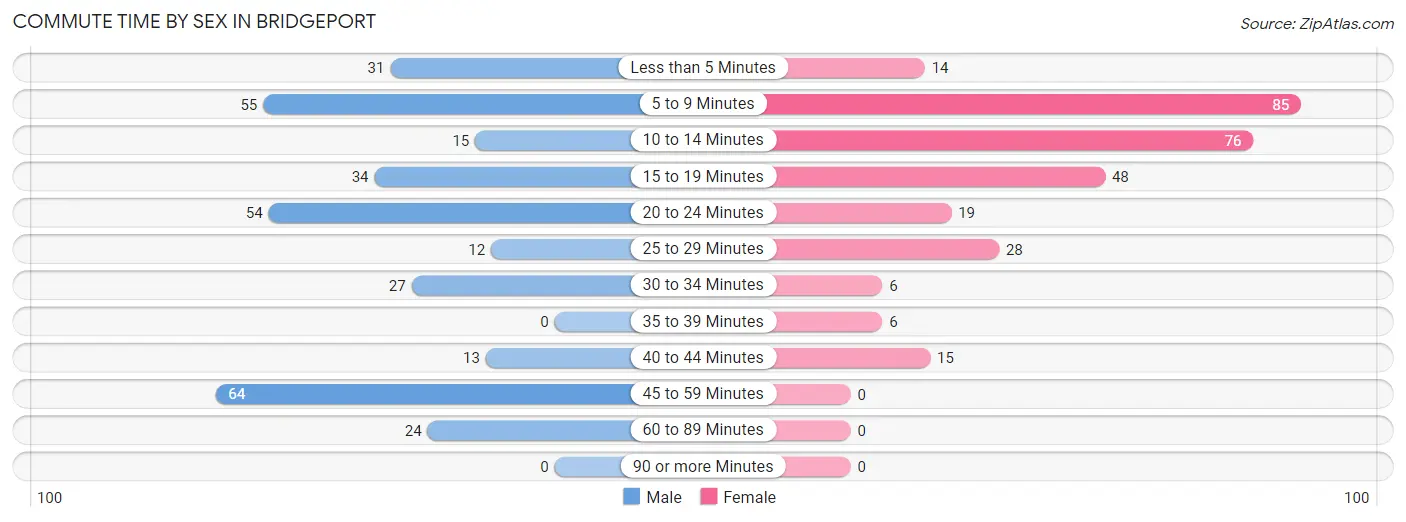
| Commute Time | Male | Female |
| Less than 5 Minutes | 31 (9.4%) | 14 (4.7%) |
| 5 to 9 Minutes | 55 (16.7%) | 85 (28.6%) |
| 10 to 14 Minutes | 15 (4.6%) | 76 (25.6%) |
| 15 to 19 Minutes | 34 (10.3%) | 48 (16.2%) |
| 20 to 24 Minutes | 54 (16.4%) | 19 (6.4%) |
| 25 to 29 Minutes | 12 (3.6%) | 28 (9.4%) |
| 30 to 34 Minutes | 27 (8.2%) | 6 (2.0%) |
| 35 to 39 Minutes | 0 (0.0%) | 6 (2.0%) |
| 40 to 44 Minutes | 13 (4.0%) | 15 (5.1%) |
| 45 to 59 Minutes | 64 (19.5%) | 0 (0.0%) |
| 60 to 89 Minutes | 24 (7.3%) | 0 (0.0%) |
| 90 or more Minutes | 0 (0.0%) | 0 (0.0%) |
Time of Departure to Work by Sex in Bridgeport
The most frequent times of departure to work in Bridgeport are 6:00 AM to 6:29 AM (63, 19.2%) for males and 7:30 AM to 7:59 AM (77, 25.9%) for females.
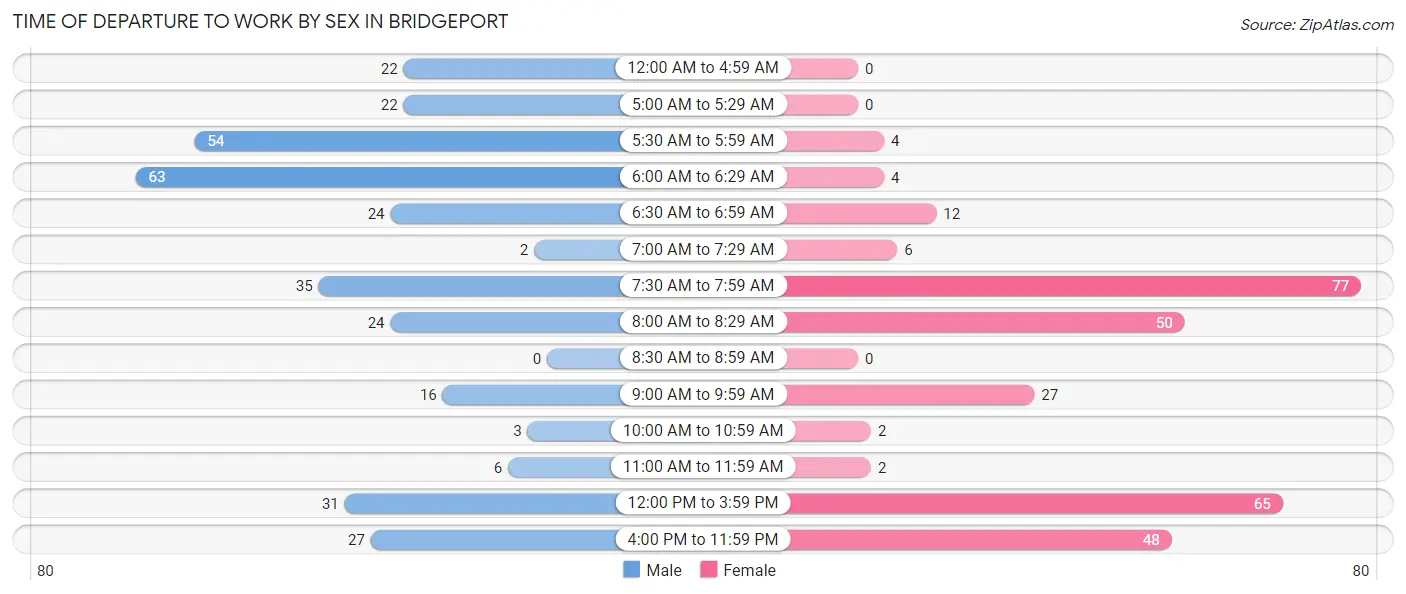
| Time of Departure | Male | Female |
| 12:00 AM to 4:59 AM | 22 (6.7%) | 0 (0.0%) |
| 5:00 AM to 5:29 AM | 22 (6.7%) | 0 (0.0%) |
| 5:30 AM to 5:59 AM | 54 (16.4%) | 4 (1.3%) |
| 6:00 AM to 6:29 AM | 63 (19.2%) | 4 (1.3%) |
| 6:30 AM to 6:59 AM | 24 (7.3%) | 12 (4.0%) |
| 7:00 AM to 7:29 AM | 2 (0.6%) | 6 (2.0%) |
| 7:30 AM to 7:59 AM | 35 (10.6%) | 77 (25.9%) |
| 8:00 AM to 8:29 AM | 24 (7.3%) | 50 (16.8%) |
| 8:30 AM to 8:59 AM | 0 (0.0%) | 0 (0.0%) |
| 9:00 AM to 9:59 AM | 16 (4.9%) | 27 (9.1%) |
| 10:00 AM to 10:59 AM | 3 (0.9%) | 2 (0.7%) |
| 11:00 AM to 11:59 AM | 6 (1.8%) | 2 (0.7%) |
| 12:00 PM to 3:59 PM | 31 (9.4%) | 65 (21.9%) |
| 4:00 PM to 11:59 PM | 27 (8.2%) | 48 (16.2%) |
| Total | 329 (100.0%) | 297 (100.0%) |
Housing Occupancy in Bridgeport
Occupancy by Ownership in Bridgeport
Of the total 602 dwellings in Bridgeport, owner-occupied units account for 445 (73.9%), while renter-occupied units make up 157 (26.1%).
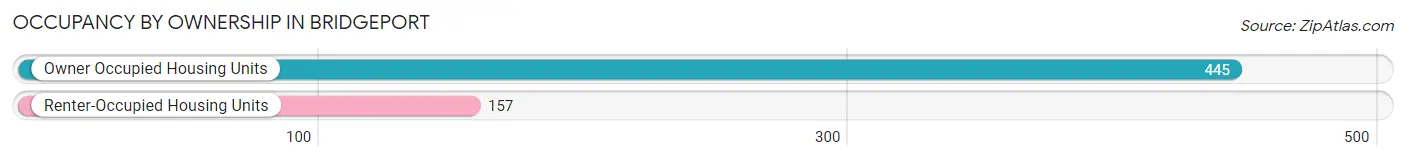
| Occupancy | # Housing Units | % Housing Units |
| Owner Occupied Housing Units | 445 | 73.9% |
| Renter-Occupied Housing Units | 157 | 26.1% |
| Total Occupied Housing Units | 602 | 100.0% |
Occupancy by Household Size in Bridgeport
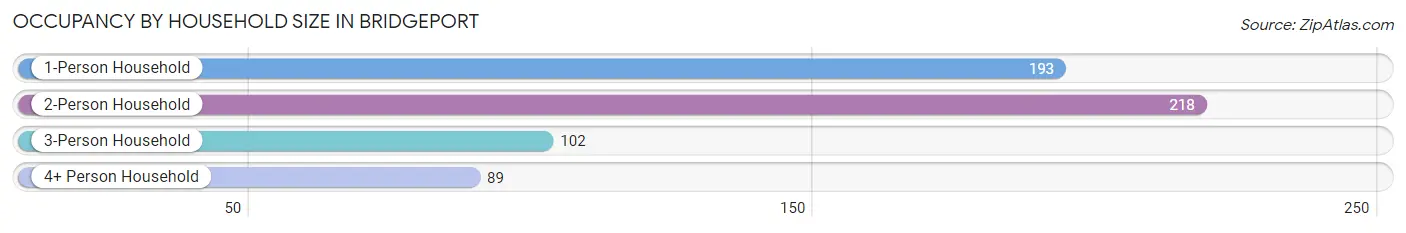
| Household Size | # Housing Units | % Housing Units |
| 1-Person Household | 193 | 32.1% |
| 2-Person Household | 218 | 36.2% |
| 3-Person Household | 102 | 16.9% |
| 4+ Person Household | 89 | 14.8% |
| Total Housing Units | 602 | 100.0% |
Occupancy by Ownership by Household Size in Bridgeport
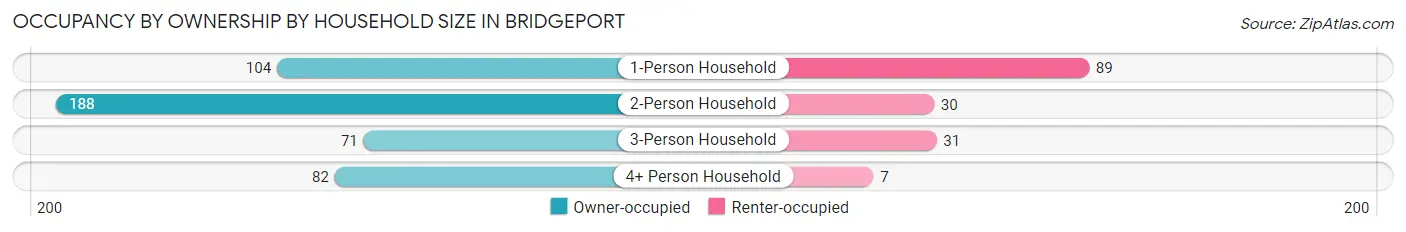
| Household Size | Owner-occupied | Renter-occupied |
| 1-Person Household | 104 (53.9%) | 89 (46.1%) |
| 2-Person Household | 188 (86.2%) | 30 (13.8%) |
| 3-Person Household | 71 (69.6%) | 31 (30.4%) |
| 4+ Person Household | 82 (92.1%) | 7 (7.9%) |
| Total Housing Units | 445 (73.9%) | 157 (26.1%) |
Occupancy by Educational Attainment in Bridgeport
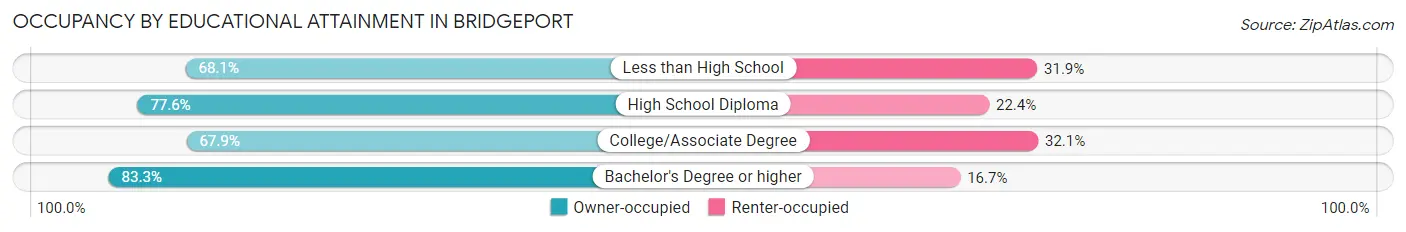
| Household Size | Owner-occupied | Renter-occupied |
| Less than High School | 32 (68.1%) | 15 (31.9%) |
| High School Diploma | 163 (77.6%) | 47 (22.4%) |
| College/Associate Degree | 165 (67.9%) | 78 (32.1%) |
| Bachelor's Degree or higher | 85 (83.3%) | 17 (16.7%) |
Occupancy by Age of Householder in Bridgeport
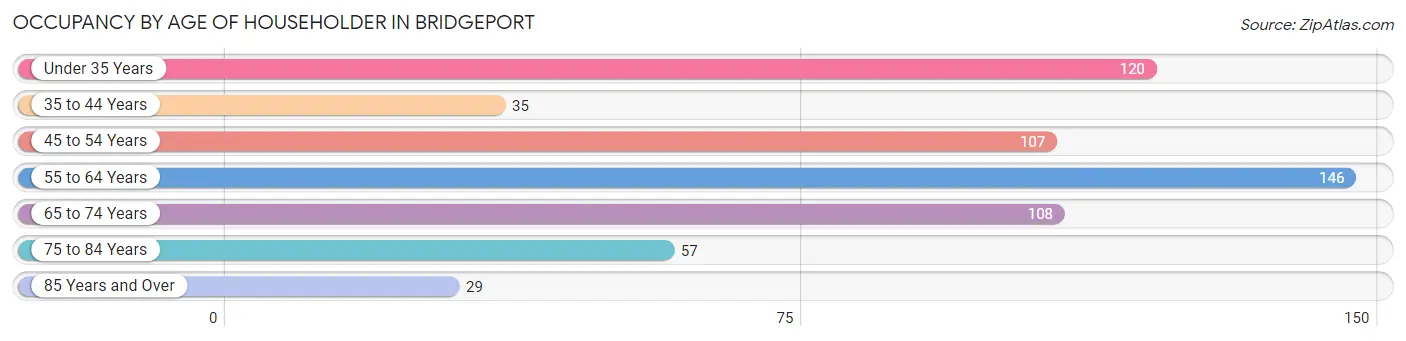
| Age Bracket | # Households | % Households |
| Under 35 Years | 120 | 19.9% |
| 35 to 44 Years | 35 | 5.8% |
| 45 to 54 Years | 107 | 17.8% |
| 55 to 64 Years | 146 | 24.2% |
| 65 to 74 Years | 108 | 17.9% |
| 75 to 84 Years | 57 | 9.5% |
| 85 Years and Over | 29 | 4.8% |
| Total | 602 | 100.0% |
Housing Finances in Bridgeport
Median Income by Occupancy in Bridgeport
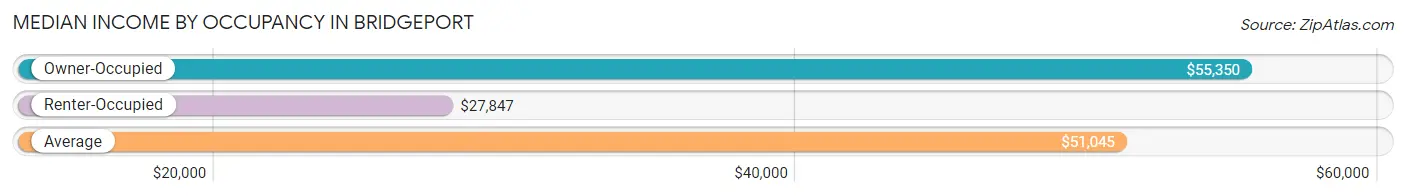
| Occupancy Type | # Households | Median Income |
| Owner-Occupied | 445 (73.9%) | $55,350 |
| Renter-Occupied | 157 (26.1%) | $27,847 |
| Average | 602 (100.0%) | $51,045 |
Occupancy by Householder Income Bracket in Bridgeport
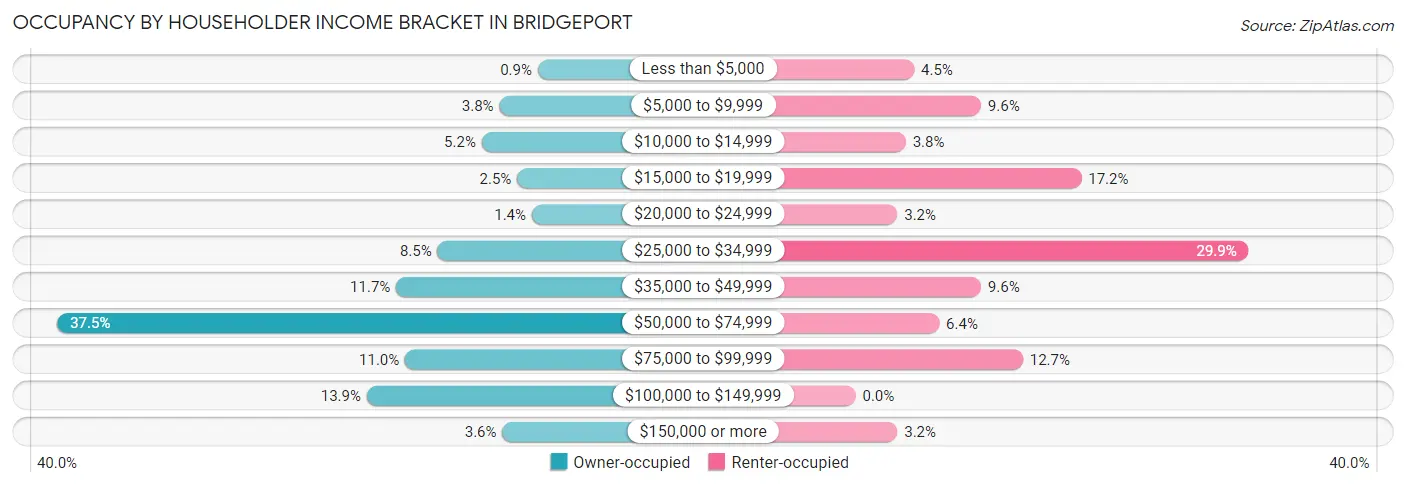
| Income Bracket | Owner-occupied | Renter-occupied |
| Less than $5,000 | 4 (0.9%) | 7 (4.5%) |
| $5,000 to $9,999 | 17 (3.8%) | 15 (9.6%) |
| $10,000 to $14,999 | 23 (5.2%) | 6 (3.8%) |
| $15,000 to $19,999 | 11 (2.5%) | 27 (17.2%) |
| $20,000 to $24,999 | 6 (1.3%) | 5 (3.2%) |
| $25,000 to $34,999 | 38 (8.5%) | 47 (29.9%) |
| $35,000 to $49,999 | 52 (11.7%) | 15 (9.6%) |
| $50,000 to $74,999 | 167 (37.5%) | 10 (6.4%) |
| $75,000 to $99,999 | 49 (11.0%) | 20 (12.7%) |
| $100,000 to $149,999 | 62 (13.9%) | 0 (0.0%) |
| $150,000 or more | 16 (3.6%) | 5 (3.2%) |
| Total | 445 (100.0%) | 157 (100.0%) |
Monthly Housing Cost Tiers in Bridgeport
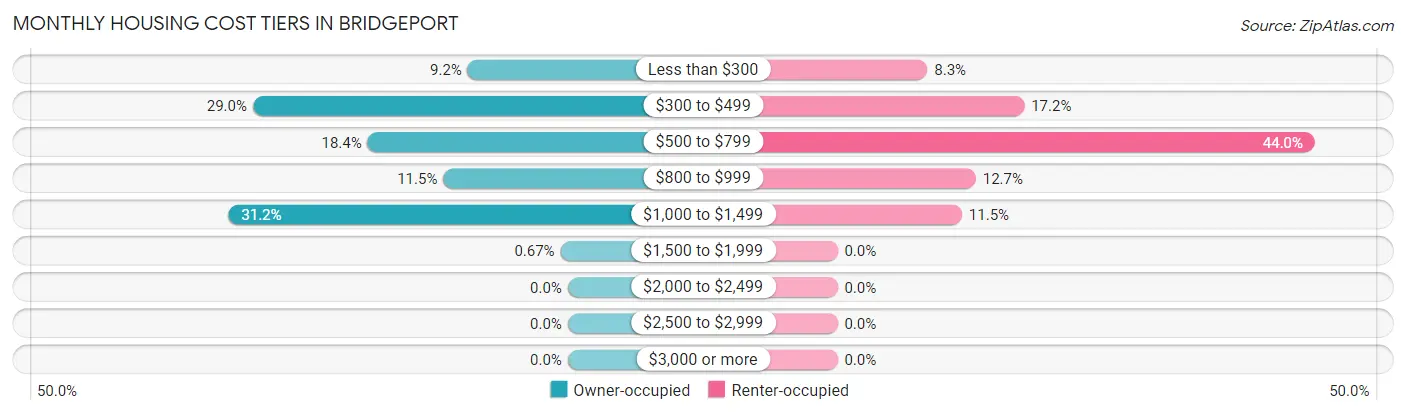
| Monthly Cost | Owner-occupied | Renter-occupied |
| Less than $300 | 41 (9.2%) | 13 (8.3%) |
| $300 to $499 | 129 (29.0%) | 27 (17.2%) |
| $500 to $799 | 82 (18.4%) | 69 (44.0%) |
| $800 to $999 | 51 (11.5%) | 20 (12.7%) |
| $1,000 to $1,499 | 139 (31.2%) | 18 (11.5%) |
| $1,500 to $1,999 | 3 (0.7%) | 0 (0.0%) |
| $2,000 to $2,499 | 0 (0.0%) | 0 (0.0%) |
| $2,500 to $2,999 | 0 (0.0%) | 0 (0.0%) |
| $3,000 or more | 0 (0.0%) | 0 (0.0%) |
| Total | 445 (100.0%) | 157 (100.0%) |
Physical Housing Characteristics in Bridgeport
Housing Structures in Bridgeport
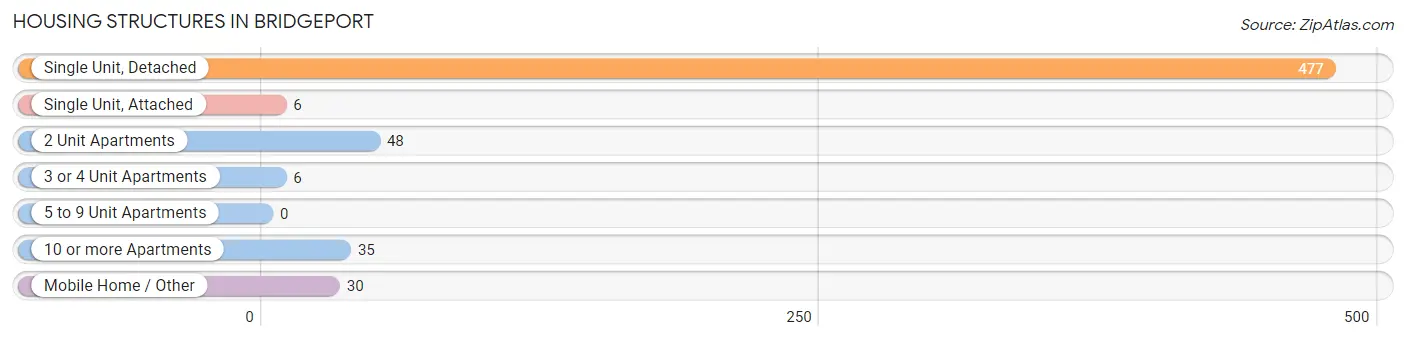
| Structure Type | # Housing Units | % Housing Units |
| Single Unit, Detached | 477 | 79.2% |
| Single Unit, Attached | 6 | 1.0% |
| 2 Unit Apartments | 48 | 8.0% |
| 3 or 4 Unit Apartments | 6 | 1.0% |
| 5 to 9 Unit Apartments | 0 | 0.0% |
| 10 or more Apartments | 35 | 5.8% |
| Mobile Home / Other | 30 | 5.0% |
| Total | 602 | 100.0% |
Housing Structures by Occupancy in Bridgeport
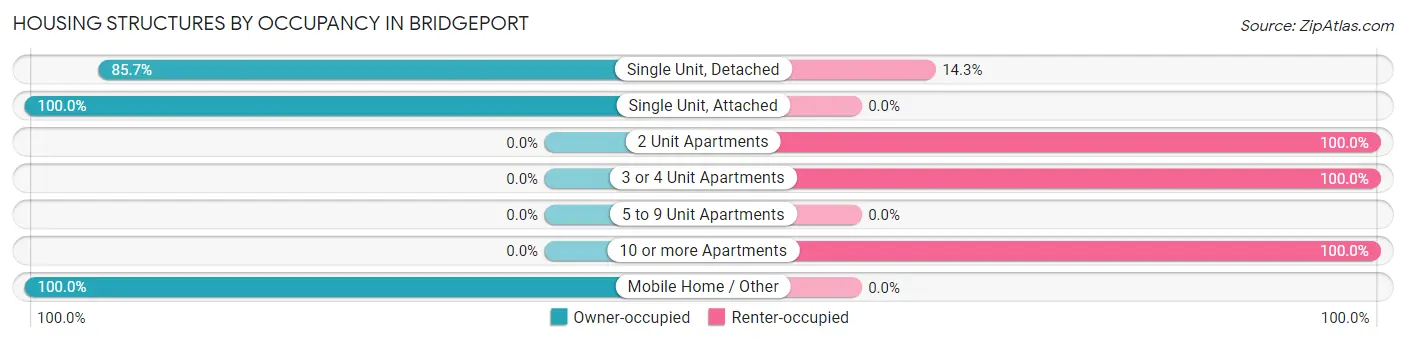
| Structure Type | Owner-occupied | Renter-occupied |
| Single Unit, Detached | 409 (85.7%) | 68 (14.3%) |
| Single Unit, Attached | 6 (100.0%) | 0 (0.0%) |
| 2 Unit Apartments | 0 (0.0%) | 48 (100.0%) |
| 3 or 4 Unit Apartments | 0 (0.0%) | 6 (100.0%) |
| 5 to 9 Unit Apartments | 0 (0.0%) | 0 (0.0%) |
| 10 or more Apartments | 0 (0.0%) | 35 (100.0%) |
| Mobile Home / Other | 30 (100.0%) | 0 (0.0%) |
| Total | 445 (73.9%) | 157 (26.1%) |
Housing Structures by Number of Rooms in Bridgeport
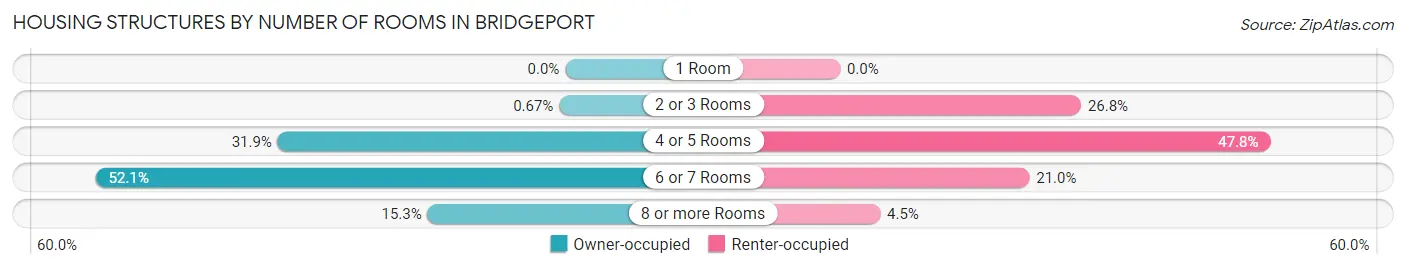
| Number of Rooms | Owner-occupied | Renter-occupied |
| 1 Room | 0 (0.0%) | 0 (0.0%) |
| 2 or 3 Rooms | 3 (0.7%) | 42 (26.8%) |
| 4 or 5 Rooms | 142 (31.9%) | 75 (47.8%) |
| 6 or 7 Rooms | 232 (52.1%) | 33 (21.0%) |
| 8 or more Rooms | 68 (15.3%) | 7 (4.5%) |
| Total | 445 (100.0%) | 157 (100.0%) |
Housing Structure by Heating Type in Bridgeport
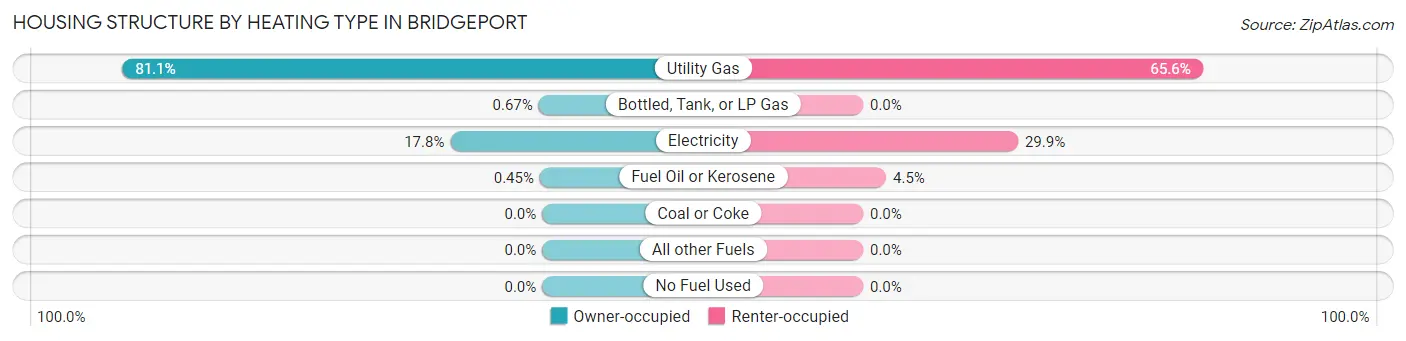
| Heating Type | Owner-occupied | Renter-occupied |
| Utility Gas | 361 (81.1%) | 103 (65.6%) |
| Bottled, Tank, or LP Gas | 3 (0.7%) | 0 (0.0%) |
| Electricity | 79 (17.7%) | 47 (29.9%) |
| Fuel Oil or Kerosene | 2 (0.4%) | 7 (4.5%) |
| Coal or Coke | 0 (0.0%) | 0 (0.0%) |
| All other Fuels | 0 (0.0%) | 0 (0.0%) |
| No Fuel Used | 0 (0.0%) | 0 (0.0%) |
| Total | 445 (100.0%) | 157 (100.0%) |
Household Vehicle Usage in Bridgeport
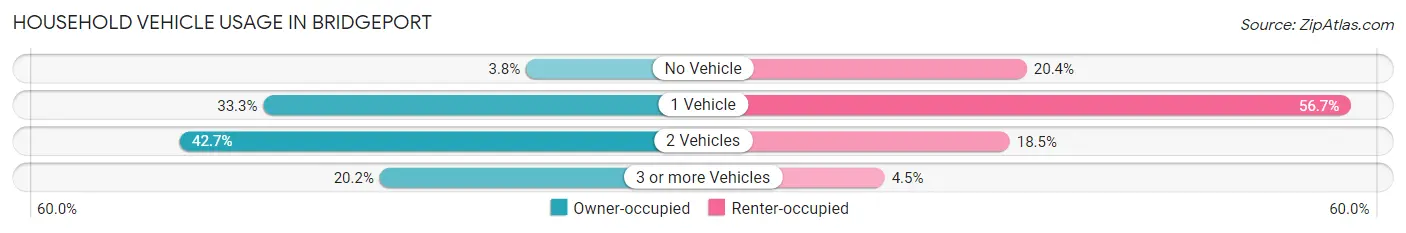
| Vehicles per Household | Owner-occupied | Renter-occupied |
| No Vehicle | 17 (3.8%) | 32 (20.4%) |
| 1 Vehicle | 148 (33.3%) | 89 (56.7%) |
| 2 Vehicles | 190 (42.7%) | 29 (18.5%) |
| 3 or more Vehicles | 90 (20.2%) | 7 (4.5%) |
| Total | 445 (100.0%) | 157 (100.0%) |
Real Estate & Mortgages in Bridgeport
Real Estate and Mortgage Overview in Bridgeport
| Characteristic | Without Mortgage | With Mortgage |
| Housing Units | 230 | 215 |
| Median Property Value | $90,800 | $78,300 |
| Median Household Income | $50,658 | $3 |
| Monthly Housing Costs | $415 | $0 |
| Real Estate Taxes | $724 | $4 |
Property Value by Mortgage Status in Bridgeport
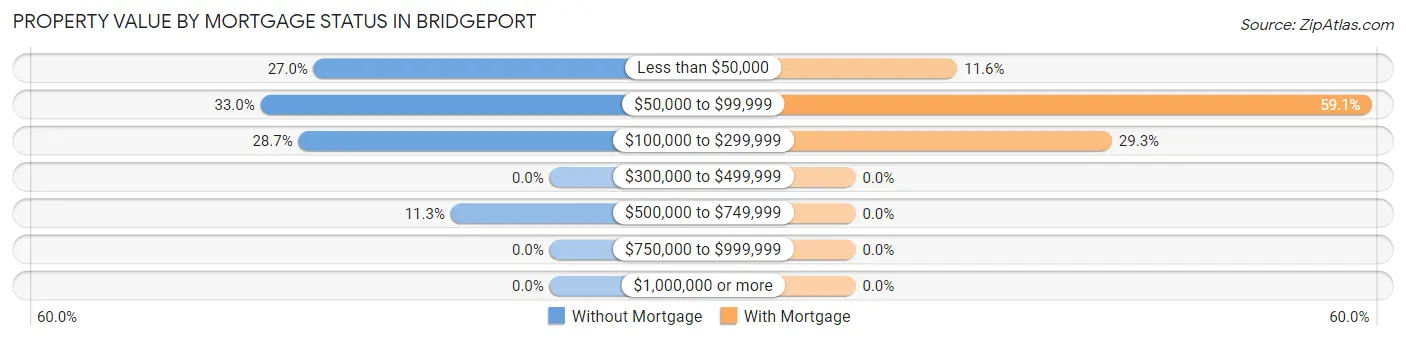
| Property Value | Without Mortgage | With Mortgage |
| Less than $50,000 | 62 (27.0%) | 25 (11.6%) |
| $50,000 to $99,999 | 76 (33.0%) | 127 (59.1%) |
| $100,000 to $299,999 | 66 (28.7%) | 63 (29.3%) |
| $300,000 to $499,999 | 0 (0.0%) | 0 (0.0%) |
| $500,000 to $749,999 | 26 (11.3%) | 0 (0.0%) |
| $750,000 to $999,999 | 0 (0.0%) | 0 (0.0%) |
| $1,000,000 or more | 0 (0.0%) | 0 (0.0%) |
| Total | 230 (100.0%) | 215 (100.0%) |
Household Income by Mortgage Status in Bridgeport
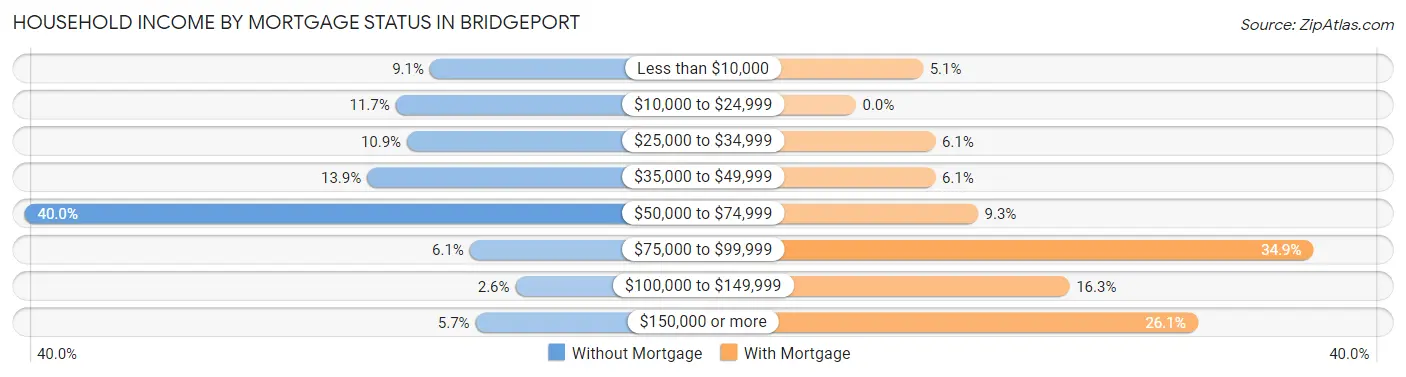
| Household Income | Without Mortgage | With Mortgage |
| Less than $10,000 | 21 (9.1%) | 11 (5.1%) |
| $10,000 to $24,999 | 27 (11.7%) | 0 (0.0%) |
| $25,000 to $34,999 | 25 (10.9%) | 13 (6.0%) |
| $35,000 to $49,999 | 32 (13.9%) | 13 (6.0%) |
| $50,000 to $74,999 | 92 (40.0%) | 20 (9.3%) |
| $75,000 to $99,999 | 14 (6.1%) | 75 (34.9%) |
| $100,000 to $149,999 | 6 (2.6%) | 35 (16.3%) |
| $150,000 or more | 13 (5.7%) | 56 (26.1%) |
| Total | 230 (100.0%) | 215 (100.0%) |
Property Value to Household Income Ratio in Bridgeport
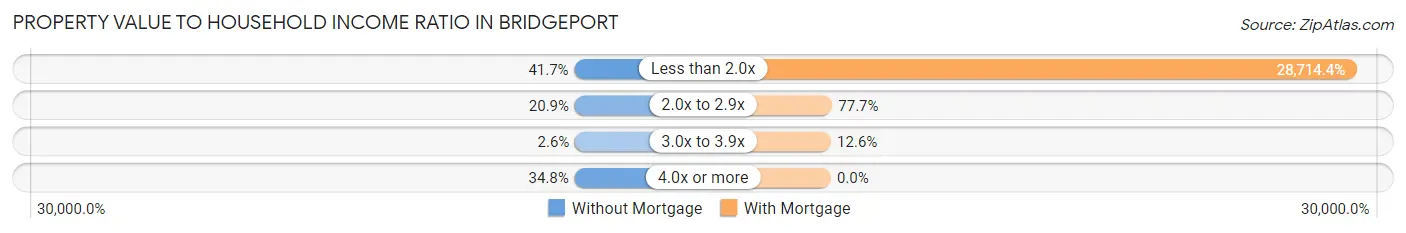
| Value-to-Income Ratio | Without Mortgage | With Mortgage |
| Less than 2.0x | 96 (41.7%) | 61,736 (28,714.4%) |
| 2.0x to 2.9x | 48 (20.9%) | 167 (77.7%) |
| 3.0x to 3.9x | 6 (2.6%) | 27 (12.6%) |
| 4.0x or more | 80 (34.8%) | 0 (0.0%) |
| Total | 230 (100.0%) | 215 (100.0%) |
Real Estate Taxes by Mortgage Status in Bridgeport
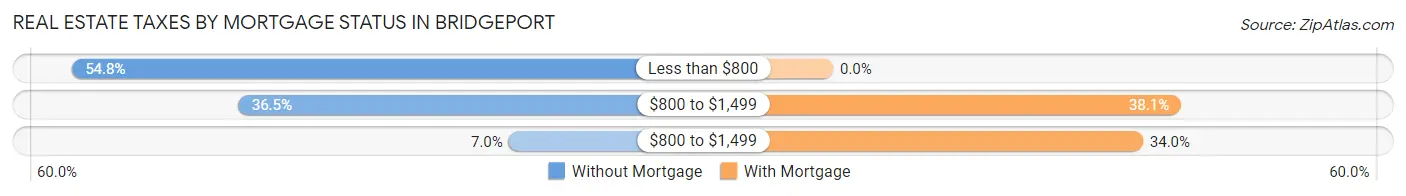
| Property Taxes | Without Mortgage | With Mortgage |
| Less than $800 | 126 (54.8%) | 0 (0.0%) |
| $800 to $1,499 | 84 (36.5%) | 82 (38.1%) |
| $800 to $1,499 | 16 (7.0%) | 73 (34.0%) |
| Total | 230 (100.0%) | 215 (100.0%) |
Health & Disability in Bridgeport
Health Insurance Coverage by Age in Bridgeport
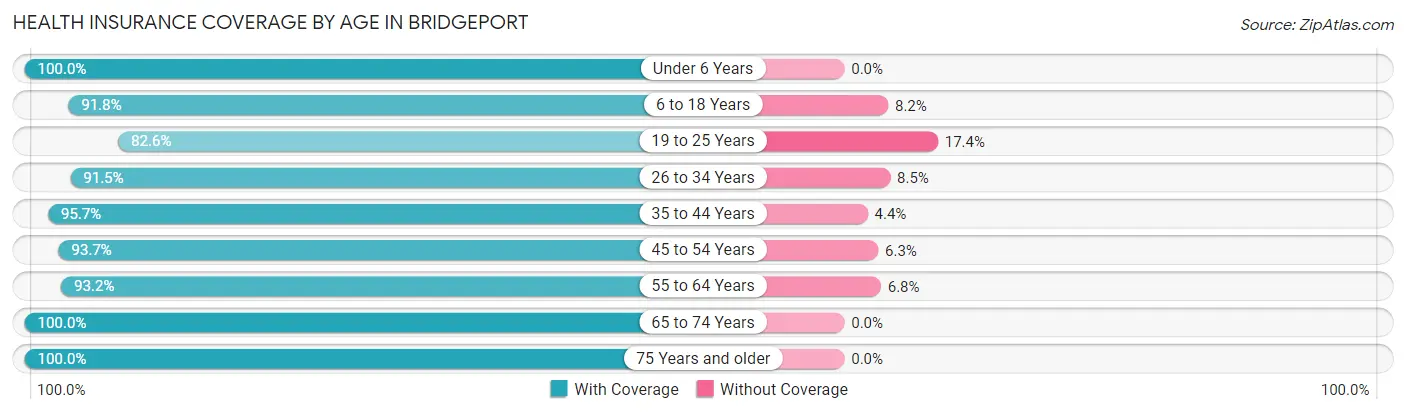
| Age Bracket | With Coverage | Without Coverage |
| Under 6 Years | 107 (100.0%) | 0 (0.0%) |
| 6 to 18 Years | 180 (91.8%) | 16 (8.2%) |
| 19 to 25 Years | 90 (82.6%) | 19 (17.4%) |
| 26 to 34 Years | 225 (91.5%) | 21 (8.5%) |
| 35 to 44 Years | 66 (95.7%) | 3 (4.3%) |
| 45 to 54 Years | 208 (93.7%) | 14 (6.3%) |
| 55 to 64 Years | 219 (93.2%) | 16 (6.8%) |
| 65 to 74 Years | 154 (100.0%) | 0 (0.0%) |
| 75 Years and older | 111 (100.0%) | 0 (0.0%) |
| Total | 1,360 (93.9%) | 89 (6.1%) |
Health Insurance Coverage by Citizenship Status in Bridgeport
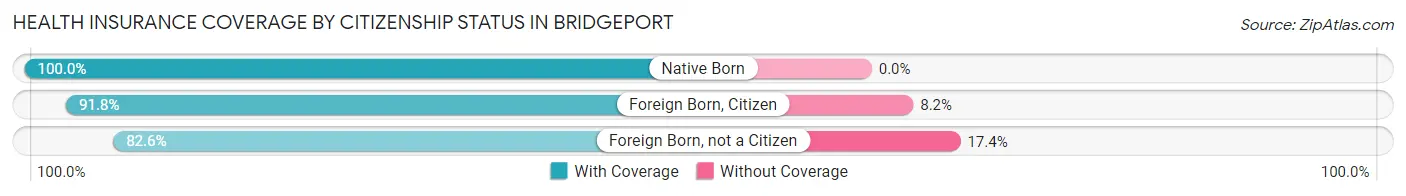
| Citizenship Status | With Coverage | Without Coverage |
| Native Born | 107 (100.0%) | 0 (0.0%) |
| Foreign Born, Citizen | 180 (91.8%) | 16 (8.2%) |
| Foreign Born, not a Citizen | 90 (82.6%) | 19 (17.4%) |
Health Insurance Coverage by Household Income in Bridgeport
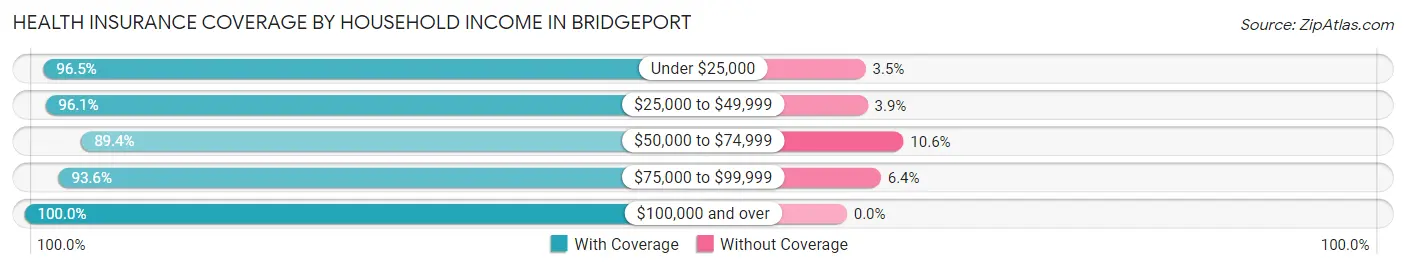
| Household Income | With Coverage | Without Coverage |
| Under $25,000 | 164 (96.5%) | 6 (3.5%) |
| $25,000 to $49,999 | 321 (96.1%) | 13 (3.9%) |
| $50,000 to $74,999 | 480 (89.4%) | 57 (10.6%) |
| $75,000 to $99,999 | 191 (93.6%) | 13 (6.4%) |
| $100,000 and over | 204 (100.0%) | 0 (0.0%) |
Public vs Private Health Insurance Coverage by Age in Bridgeport
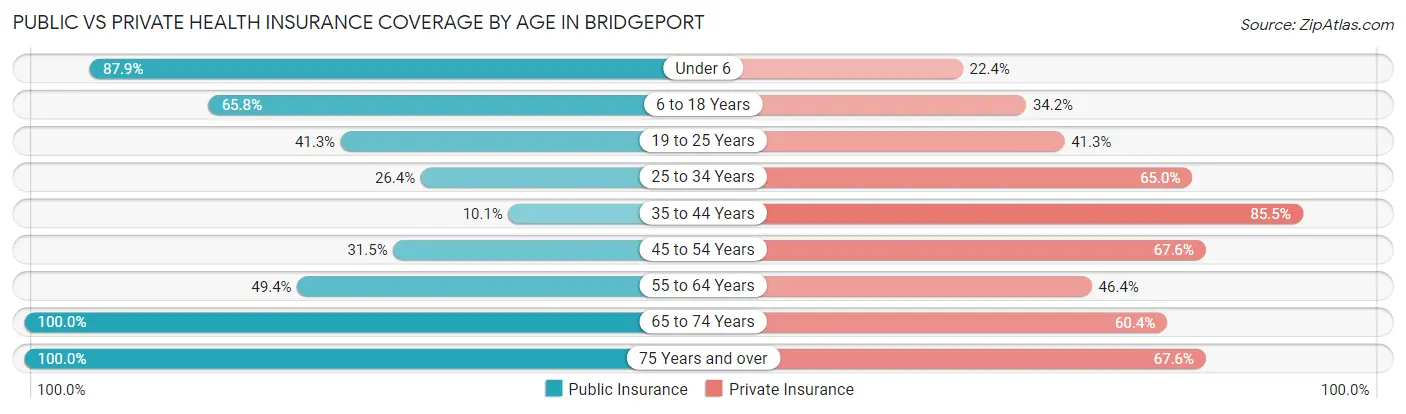
| Age Bracket | Public Insurance | Private Insurance |
| Under 6 | 94 (87.8%) | 24 (22.4%) |
| 6 to 18 Years | 129 (65.8%) | 67 (34.2%) |
| 19 to 25 Years | 45 (41.3%) | 45 (41.3%) |
| 25 to 34 Years | 65 (26.4%) | 160 (65.0%) |
| 35 to 44 Years | 7 (10.1%) | 59 (85.5%) |
| 45 to 54 Years | 70 (31.5%) | 150 (67.6%) |
| 55 to 64 Years | 116 (49.4%) | 109 (46.4%) |
| 65 to 74 Years | 154 (100.0%) | 93 (60.4%) |
| 75 Years and over | 111 (100.0%) | 75 (67.6%) |
| Total | 791 (54.6%) | 782 (54.0%) |
Disability Status by Sex by Age in Bridgeport
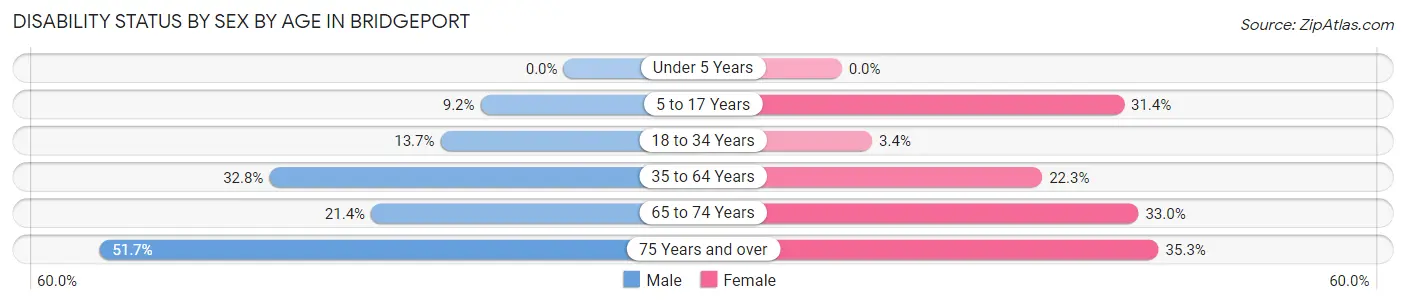
| Age Bracket | Male | Female |
| Under 5 Years | 0 (0.0%) | 0 (0.0%) |
| 5 to 17 Years | 11 (9.2%) | 22 (31.4%) |
| 18 to 34 Years | 30 (13.7%) | 5 (3.4%) |
| 35 to 64 Years | 96 (32.8%) | 52 (22.3%) |
| 65 to 74 Years | 9 (21.4%) | 37 (33.0%) |
| 75 Years and over | 31 (51.7%) | 18 (35.3%) |
Disability Class by Sex by Age in Bridgeport
Disability Class: Hearing Difficulty
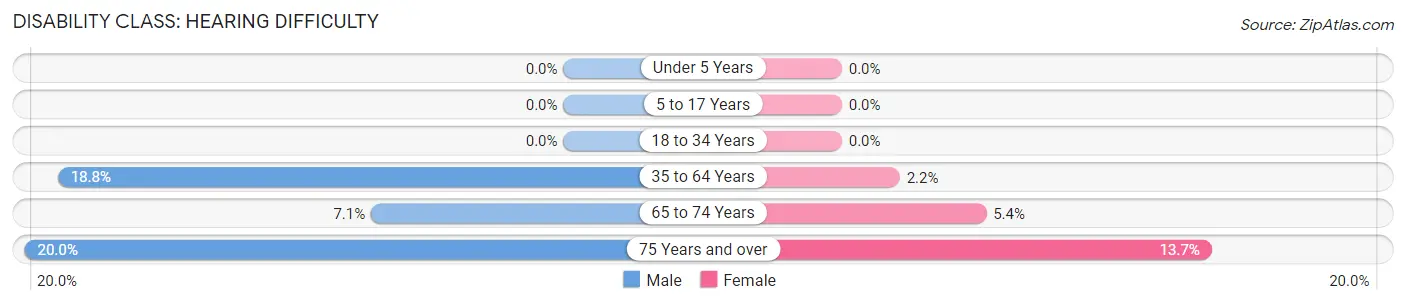
| Age Bracket | Male | Female |
| Under 5 Years | 0 (0.0%) | 0 (0.0%) |
| 5 to 17 Years | 0 (0.0%) | 0 (0.0%) |
| 18 to 34 Years | 0 (0.0%) | 0 (0.0%) |
| 35 to 64 Years | 55 (18.8%) | 5 (2.1%) |
| 65 to 74 Years | 3 (7.1%) | 6 (5.4%) |
| 75 Years and over | 12 (20.0%) | 7 (13.7%) |
Disability Class: Vision Difficulty
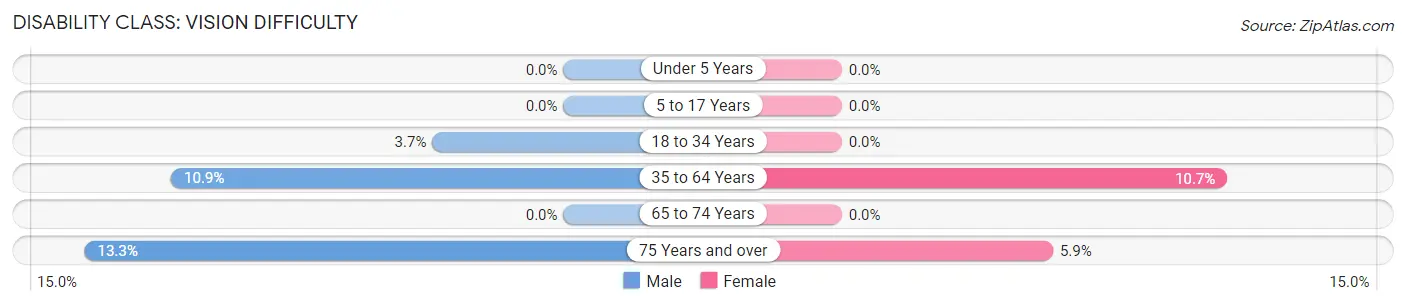
| Age Bracket | Male | Female |
| Under 5 Years | 0 (0.0%) | 0 (0.0%) |
| 5 to 17 Years | 0 (0.0%) | 0 (0.0%) |
| 18 to 34 Years | 8 (3.6%) | 0 (0.0%) |
| 35 to 64 Years | 32 (10.9%) | 25 (10.7%) |
| 65 to 74 Years | 0 (0.0%) | 0 (0.0%) |
| 75 Years and over | 8 (13.3%) | 3 (5.9%) |
Disability Class: Cognitive Difficulty
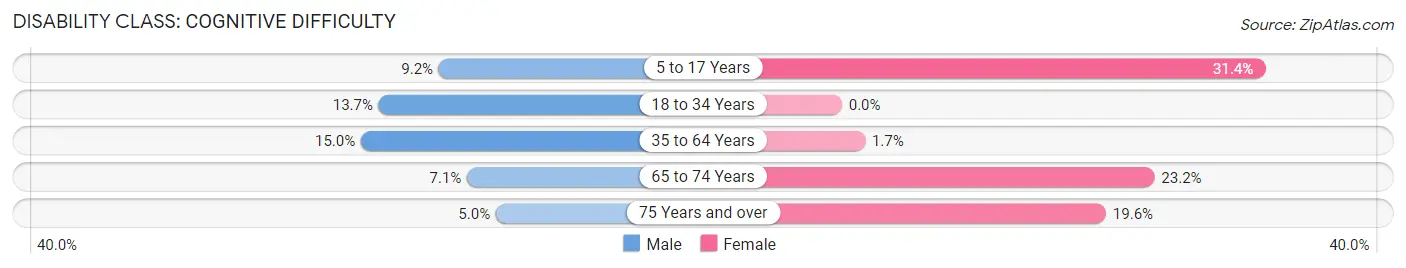
| Age Bracket | Male | Female |
| 5 to 17 Years | 11 (9.2%) | 22 (31.4%) |
| 18 to 34 Years | 30 (13.7%) | 0 (0.0%) |
| 35 to 64 Years | 44 (15.0%) | 4 (1.7%) |
| 65 to 74 Years | 3 (7.1%) | 26 (23.2%) |
| 75 Years and over | 3 (5.0%) | 10 (19.6%) |
Disability Class: Ambulatory Difficulty
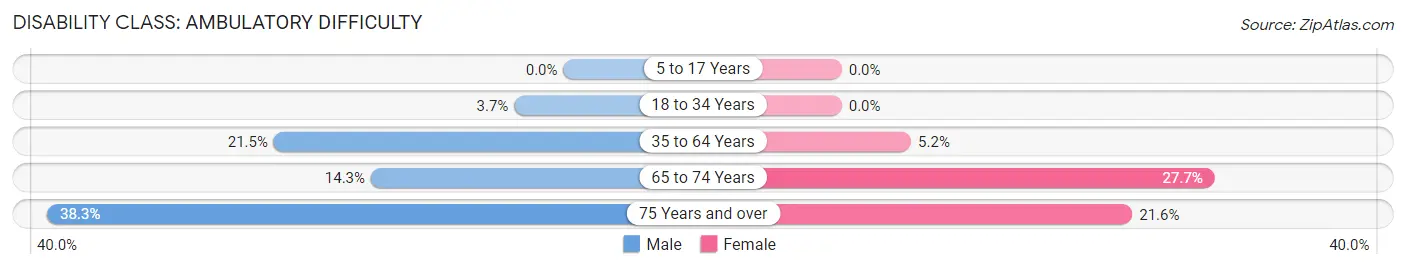
| Age Bracket | Male | Female |
| 5 to 17 Years | 0 (0.0%) | 0 (0.0%) |
| 18 to 34 Years | 8 (3.6%) | 0 (0.0%) |
| 35 to 64 Years | 63 (21.5%) | 12 (5.1%) |
| 65 to 74 Years | 6 (14.3%) | 31 (27.7%) |
| 75 Years and over | 23 (38.3%) | 11 (21.6%) |
Disability Class: Self-Care Difficulty
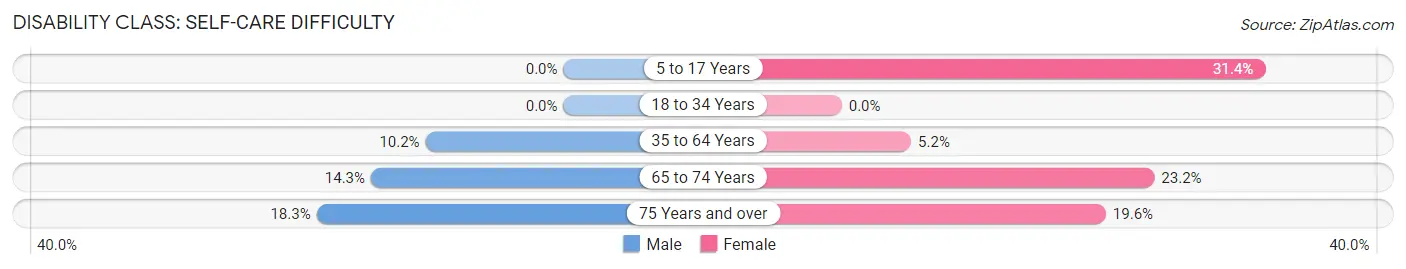
| Age Bracket | Male | Female |
| 5 to 17 Years | 0 (0.0%) | 22 (31.4%) |
| 18 to 34 Years | 0 (0.0%) | 0 (0.0%) |
| 35 to 64 Years | 30 (10.2%) | 12 (5.1%) |
| 65 to 74 Years | 6 (14.3%) | 26 (23.2%) |
| 75 Years and over | 11 (18.3%) | 10 (19.6%) |
Technology Access in Bridgeport
Computing Device Access in Bridgeport
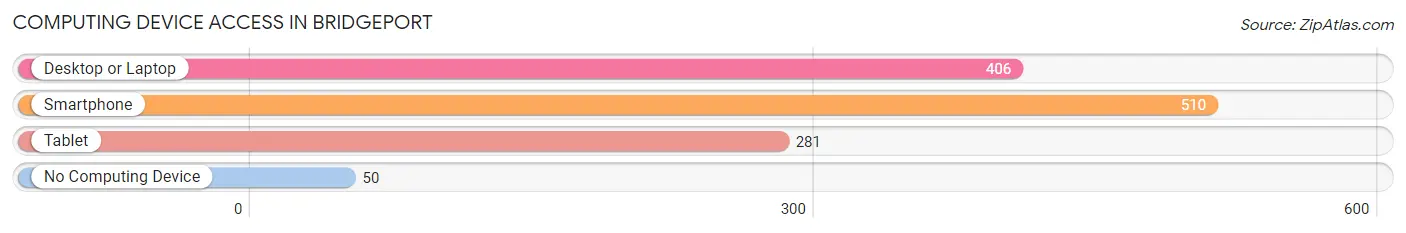
| Device Type | # Households | % Households |
| Desktop or Laptop | 406 | 67.4% |
| Smartphone | 510 | 84.7% |
| Tablet | 281 | 46.7% |
| No Computing Device | 50 | 8.3% |
| Total | 602 | 100.0% |
Internet Access in Bridgeport
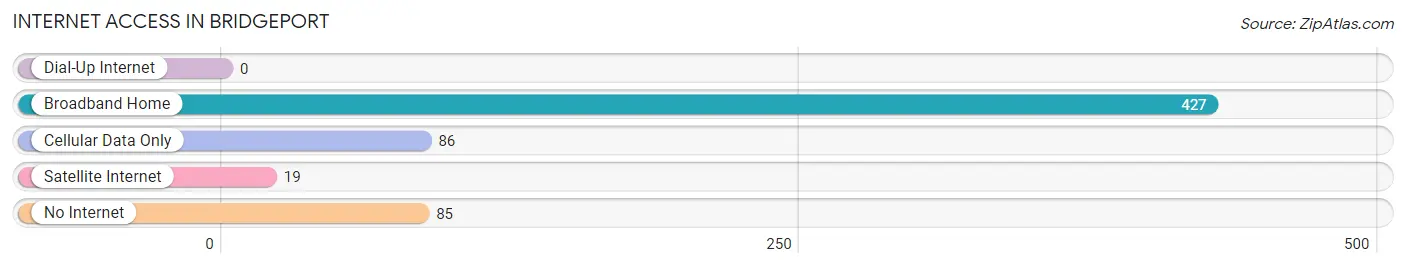
| Internet Type | # Households | % Households |
| Dial-Up Internet | 0 | 0.0% |
| Broadband Home | 427 | 70.9% |
| Cellular Data Only | 86 | 14.3% |
| Satellite Internet | 19 | 3.2% |
| No Internet | 85 | 14.1% |
| Total | 602 | 100.0% |
Bridgeport Summary
Bridgeport, Ohio is a small village located in Belmont County, Ohio. It is situated on the Ohio River, just south of Wheeling, West Virginia. The village has a population of 1,845 as of the 2010 census.
History
The area that is now Bridgeport was first settled in 1798 by a group of settlers from Pennsylvania. The village was originally known as “Bridgeport Station” and was a stop on the National Road, which was the first federally funded highway in the United States. The village was officially incorporated in 1831 and was named after the bridge that crossed the Ohio River at the time.
The village was an important stop on the Underground Railroad, with many of the local residents helping to hide and transport escaped slaves. During the Civil War, the village was the site of a major battle between Union and Confederate forces. The Union forces were victorious and the village was spared from destruction.
Geography
Bridgeport is located in Belmont County, Ohio, at the confluence of the Ohio and Little Muskingum Rivers. The village is situated on the Ohio River, just south of Wheeling, West Virginia. The village has a total area of 1.2 square miles, all of which is land.
The village is located in the Appalachian Plateau region of Ohio, which is characterized by rolling hills and valleys. The climate is humid continental, with hot summers and cold winters. The average annual temperature is around 50 degrees Fahrenheit.
Economy
The economy of Bridgeport is largely based on agriculture and manufacturing. The village is home to several small businesses, including a grocery store, a hardware store, and a few restaurants. The village also has a few small industrial plants, including a steel mill and a paper mill.
The village is also home to a few tourist attractions, including the Bridgeport Covered Bridge, which is the oldest covered bridge in Ohio. The village also has a few parks and recreational areas, including the Bridgeport Riverfront Park.
Demographics
As of the 2010 census, the village had a population of 1,845. The population is largely white (97.2%), with a small percentage of African Americans (1.2%) and Hispanics (1.2%). The median household income is $37,917, and the median age is 41.
The village is served by the Bridgeport-Harrison Local School District. The village is also home to a branch of the Belmont County Library System.
Conclusion
Bridgeport, Ohio is a small village located in Belmont County, Ohio. It is situated on the Ohio River, just south of Wheeling, West Virginia. The village has a population of 1,845 as of the 2010 census. The economy of Bridgeport is largely based on agriculture and manufacturing, and the village is home to several small businesses, tourist attractions, and recreational areas. The population is largely white, with a small percentage of African Americans and Hispanics. The village is served by the Bridgeport-Harrison Local School District and is home to a branch of the Belmont County Library System.
Common Questions
What is Per Capita Income in Bridgeport?
Per Capita income in Bridgeport is $29,362.
What is the Median Family Income in Bridgeport?
Median Family Income in Bridgeport is $52,193.
What is the Median Household income in Bridgeport?
Median Household Income in Bridgeport is $51,045.
What is Income or Wage Gap in Bridgeport?
Income or Wage Gap in Bridgeport is 6.9%.
Women in Bridgeport earn 93.1 cents for every dollar earned by a man.
What is Inequality or Gini Index in Bridgeport?
Inequality or Gini Index in Bridgeport is 0.45.
What is the Total Population of Bridgeport?
Total Population of Bridgeport is 1,449.
What is the Total Male Population of Bridgeport?
Total Male Population of Bridgeport is 805.
What is the Total Female Population of Bridgeport?
Total Female Population of Bridgeport is 644.
What is the Ratio of Males per 100 Females in Bridgeport?
There are 125.00 Males per 100 Females in Bridgeport.
What is the Ratio of Females per 100 Males in Bridgeport?
There are 80.00 Females per 100 Males in Bridgeport.
What is the Median Population Age in Bridgeport?
Median Population Age in Bridgeport is 42.9 Years.
What is the Average Family Size in Bridgeport
Average Family Size in Bridgeport is 3.0 People.
What is the Average Household Size in Bridgeport
Average Household Size in Bridgeport is 2.4 People.
How Large is the Labor Force in Bridgeport?
There are 721 People in the Labor Forcein in Bridgeport.
What is the Percentage of People in the Labor Force in Bridgeport?
60.0% of People are in the Labor Force in Bridgeport.
What is the Unemployment Rate in Bridgeport?
Unemployment Rate in Bridgeport is 8.3%.