Bloomdale, OH Map & Demographics
Bloomdale Map
Bloomdale Overview
$27,187
PER CAPITA INCOME
$64,583
AVG FAMILY INCOME
$57,679
AVG HOUSEHOLD INCOME
13.1%
WAGE / INCOME GAP [ % ]
86.9¢/ $1
WAGE / INCOME GAP [ $ ]
0.34
INEQUALITY / GINI INDEX
626
TOTAL POPULATION
293
MALE POPULATION
333
FEMALE POPULATION
87.99
MALES / 100 FEMALES
113.65
FEMALES / 100 MALES
43.3
MEDIAN AGE
2.8
AVG FAMILY SIZE
2.3
AVG HOUSEHOLD SIZE
307
LABOR FORCE [ PEOPLE ]
60.1%
PERCENT IN LABOR FORCE
2.0%
UNEMPLOYMENT RATE
Bloomdale Zip Codes
Bloomdale Area Codes
Income in Bloomdale
Income Overview in Bloomdale
Per Capita Income in Bloomdale is $27,187, while median incomes of families and households are $64,583 and $57,679 respectively.
| Characteristic | Number | Measure |
| Per Capita Income | 626 | $27,187 |
| Median Family Income | 175 | $64,583 |
| Mean Family Income | 175 | $72,409 |
| Median Household Income | 272 | $57,679 |
| Mean Household Income | 272 | $63,340 |
| Income Deficit | 175 | $0 |
| Wage / Income Gap (%) | 626 | 13.11% |
| Wage / Income Gap ($) | 626 | 86.89¢ per $1 |
| Gini / Inequality Index | 626 | 0.34 |
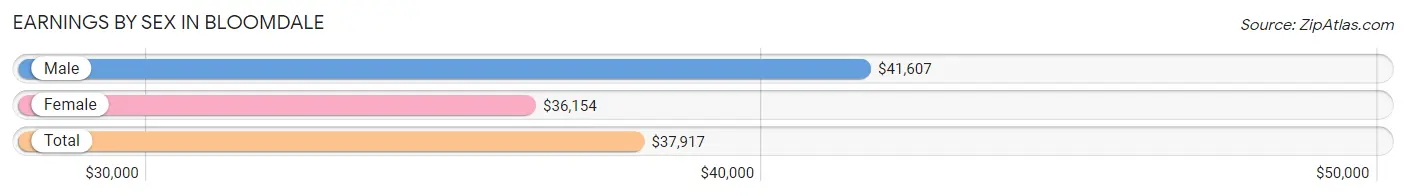
Earnings by Sex in Bloomdale
Average Earnings in Bloomdale are $37,917, $41,607 for men and $36,154 for women, a difference of 13.1%.
| Sex | Number | Average Earnings |
| Male | 171 (49.6%) | $41,607 |
| Female | 174 (50.4%) | $36,154 |
| Total | 345 (100.0%) | $37,917 |
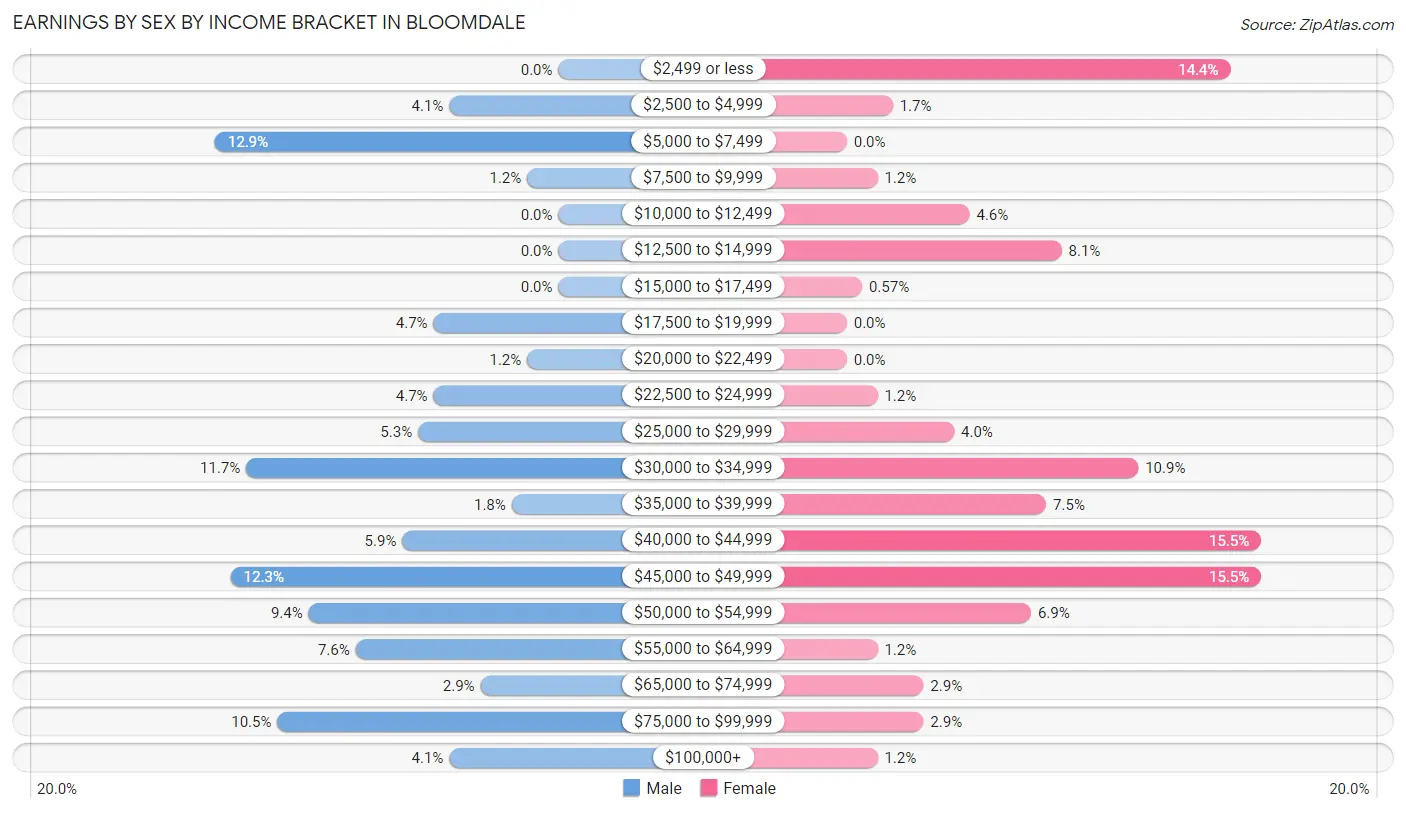
Earnings by Sex by Income Bracket in Bloomdale
The most common earnings brackets in Bloomdale are $5,000 to $7,499 for men (22 | 12.9%) and $40,000 to $44,999 for women (27 | 15.5%).
| Income | Male | Female |
| $2,499 or less | 0 (0.0%) | 25 (14.4%) |
| $2,500 to $4,999 | 7 (4.1%) | 3 (1.7%) |
| $5,000 to $7,499 | 22 (12.9%) | 0 (0.0%) |
| $7,500 to $9,999 | 2 (1.2%) | 2 (1.1%) |
| $10,000 to $12,499 | 0 (0.0%) | 8 (4.6%) |
| $12,500 to $14,999 | 0 (0.0%) | 14 (8.1%) |
| $15,000 to $17,499 | 0 (0.0%) | 1 (0.6%) |
| $17,500 to $19,999 | 8 (4.7%) | 0 (0.0%) |
| $20,000 to $22,499 | 2 (1.2%) | 0 (0.0%) |
| $22,500 to $24,999 | 8 (4.7%) | 2 (1.1%) |
| $25,000 to $29,999 | 9 (5.3%) | 7 (4.0%) |
| $30,000 to $34,999 | 20 (11.7%) | 19 (10.9%) |
| $35,000 to $39,999 | 3 (1.8%) | 13 (7.5%) |
| $40,000 to $44,999 | 10 (5.9%) | 27 (15.5%) |
| $45,000 to $49,999 | 21 (12.3%) | 27 (15.5%) |
| $50,000 to $54,999 | 16 (9.4%) | 12 (6.9%) |
| $55,000 to $64,999 | 13 (7.6%) | 2 (1.1%) |
| $65,000 to $74,999 | 5 (2.9%) | 5 (2.9%) |
| $75,000 to $99,999 | 18 (10.5%) | 5 (2.9%) |
| $100,000+ | 7 (4.1%) | 2 (1.1%) |
| Total | 171 (100.0%) | 174 (100.0%) |
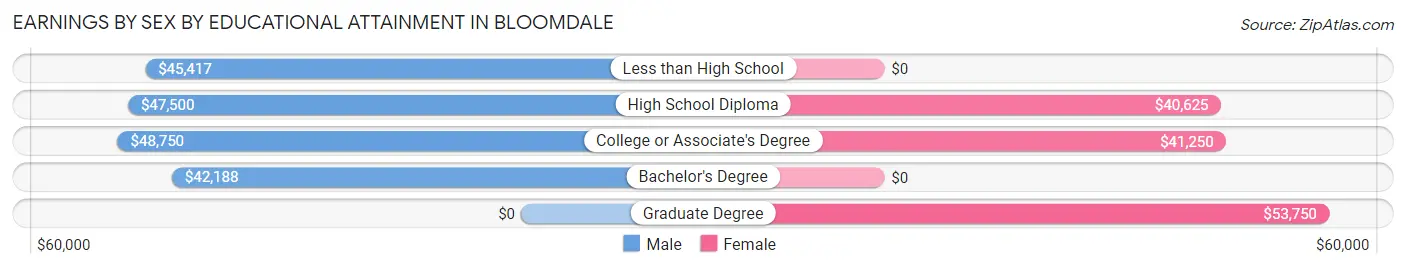
Earnings by Sex by Educational Attainment in Bloomdale
Average earnings in Bloomdale are $46,146 for men and $40,769 for women, a difference of 11.7%. Men with an educational attainment of college or associate's degree enjoy the highest average annual earnings of $48,750, while those with bachelor's degree education earn the least with $42,188. Women with an educational attainment of graduate degree earn the most with the average annual earnings of $53,750, while those with high school diploma education have the smallest earnings of $40,625.
| Educational Attainment | Male Income | Female Income |
| Less than High School | $45,417 | $0 |
| High School Diploma | $47,500 | $40,625 |
| College or Associate's Degree | $48,750 | $41,250 |
| Bachelor's Degree | $42,188 | $0 |
| Graduate Degree | - | - |
| Total | $46,146 | $40,769 |
Family Income in Bloomdale
Family Income Brackets in Bloomdale
According to the Bloomdale family income data, there are 54 families falling into the $50,000 to $74,999 income range, which is the most common income bracket and makes up 30.9% of all families.
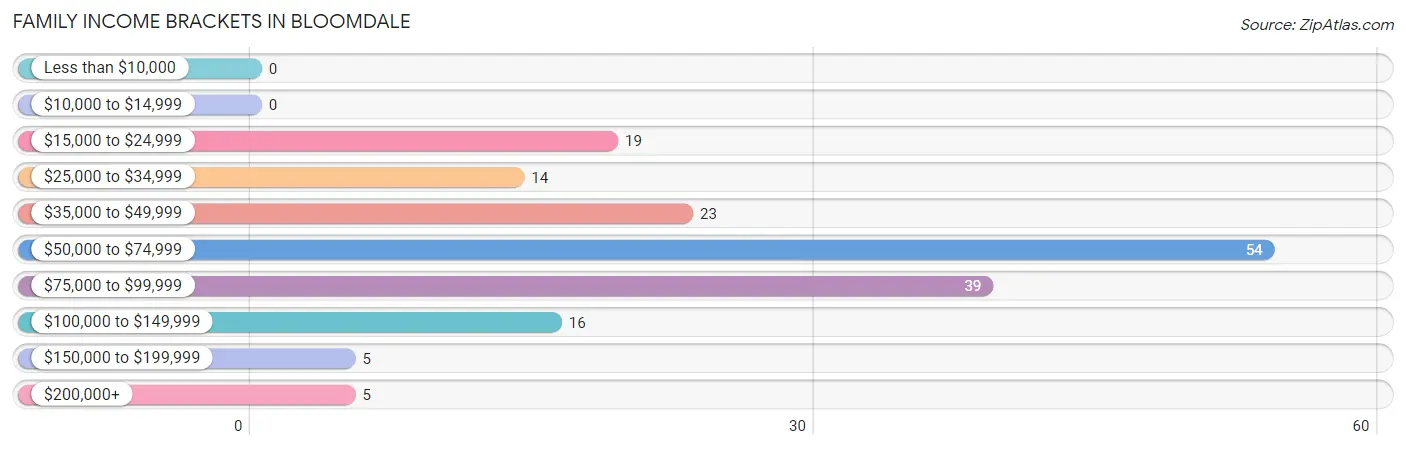
| Income Bracket | # Families | % Families |
| Less than $10,000 | 0 | 0.0% |
| $10,000 to $14,999 | 0 | 0.0% |
| $15,000 to $24,999 | 19 | 10.9% |
| $25,000 to $34,999 | 14 | 8.0% |
| $35,000 to $49,999 | 23 | 13.1% |
| $50,000 to $74,999 | 54 | 30.9% |
| $75,000 to $99,999 | 39 | 22.3% |
| $100,000 to $149,999 | 16 | 9.1% |
| $150,000 to $199,999 | 5 | 2.9% |
| $200,000+ | 5 | 2.9% |
Family Income by Famaliy Size in Bloomdale
3-person families (38 | 21.7%) account for the highest median family income in Bloomdale with $71,250 per family, while 2-person families (101 | 57.7%) have the highest median income of $29,548 per family member.
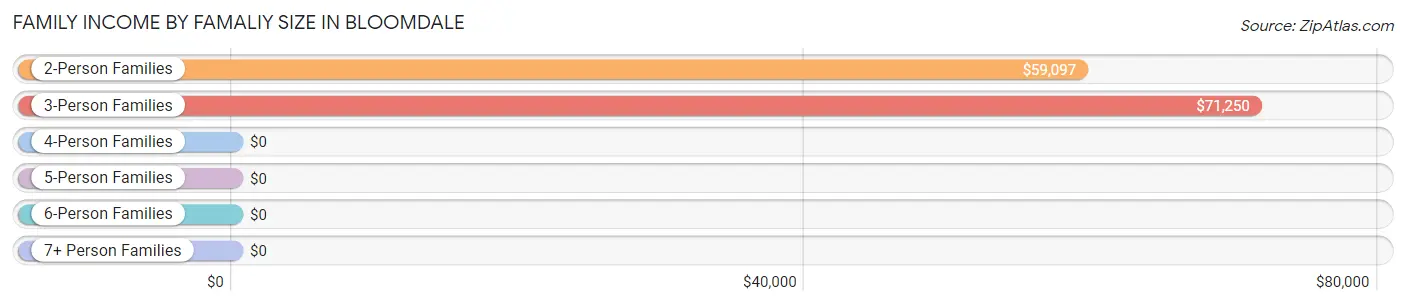
| Income Bracket | # Families | Median Income |
| 2-Person Families | 101 (57.7%) | $59,097 |
| 3-Person Families | 38 (21.7%) | $71,250 |
| 4-Person Families | 15 (8.6%) | $0 |
| 5-Person Families | 19 (10.9%) | $0 |
| 6-Person Families | 0 (0.0%) | $0 |
| 7+ Person Families | 2 (1.1%) | $0 |
| Total | 175 (100.0%) | $64,583 |
Family Income by Number of Earners in Bloomdale
The median family income in Bloomdale is $64,583, with families comprising 3+ earners (13) having the highest median family income of $130,536, while families with 1 earner (84) have the lowest median family income of $57,800, accounting for 7.4% and 48.0% of families, respectively.
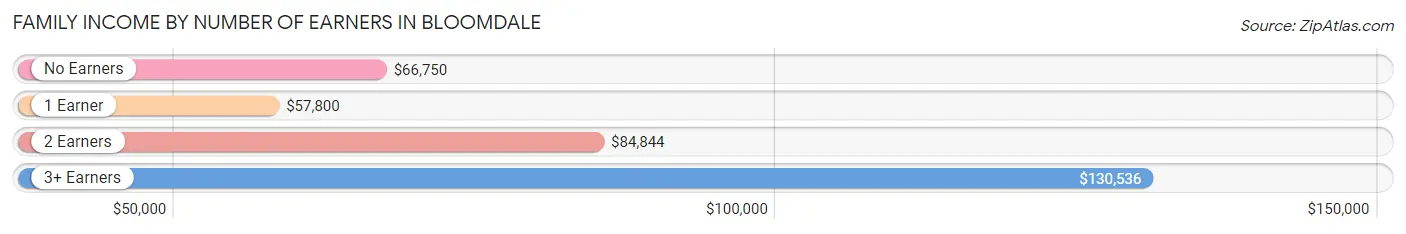
| Number of Earners | # Families | Median Income |
| No Earners | 15 (8.6%) | $66,750 |
| 1 Earner | 84 (48.0%) | $57,800 |
| 2 Earners | 63 (36.0%) | $84,844 |
| 3+ Earners | 13 (7.4%) | $130,536 |
| Total | 175 (100.0%) | $64,583 |
Household Income in Bloomdale
Household Income Brackets in Bloomdale
With 65 households falling in the category, the $50,000 to $74,999 income range is the most frequent in Bloomdale, accounting for 23.9% of all households. In contrast, only 4 households (1.5%) fall into the $10,000 to $14,999 income bracket, making it the least populous group.
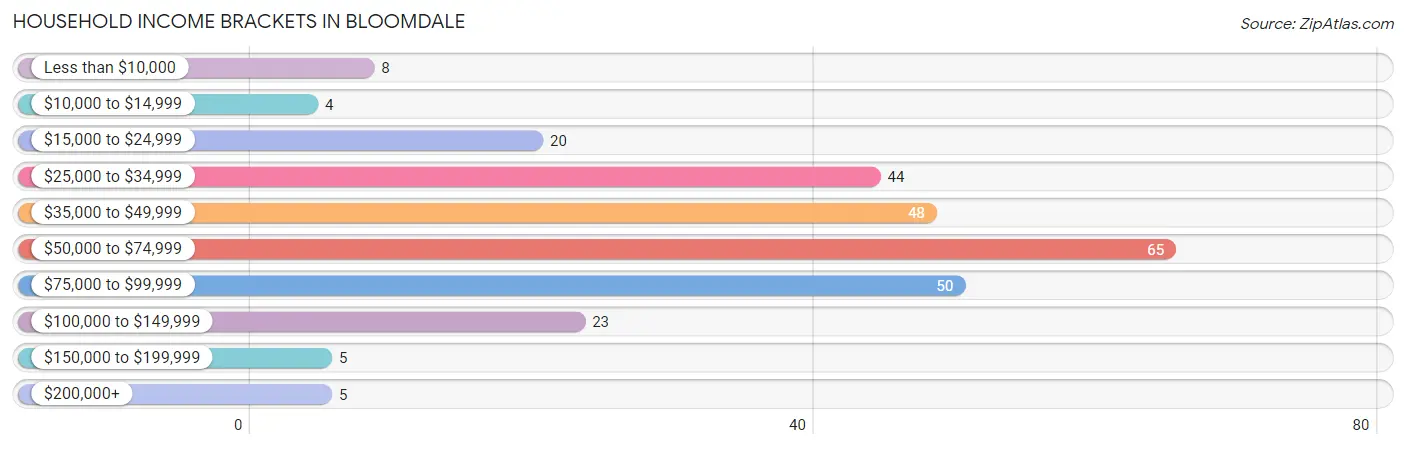
| Income Bracket | # Households | % Households |
| Less than $10,000 | 8 | 2.9% |
| $10,000 to $14,999 | 4 | 1.5% |
| $15,000 to $24,999 | 20 | 7.4% |
| $25,000 to $34,999 | 44 | 16.2% |
| $35,000 to $49,999 | 48 | 17.6% |
| $50,000 to $74,999 | 65 | 23.9% |
| $75,000 to $99,999 | 50 | 18.4% |
| $100,000 to $149,999 | 23 | 8.5% |
| $150,000 to $199,999 | 5 | 1.8% |
| $200,000+ | 5 | 1.8% |
Household Income by Householder Age in Bloomdale
The median household income in Bloomdale is $57,679, with the highest median household income of $74,583 found in the 25 to 44 years age bracket for the primary householder. A total of 65 households (23.9%) fall into this category. Meanwhile, the 15 to 24 years age bracket for the primary householder has the lowest median household income of $0, with 9 households (3.3%) in this group.
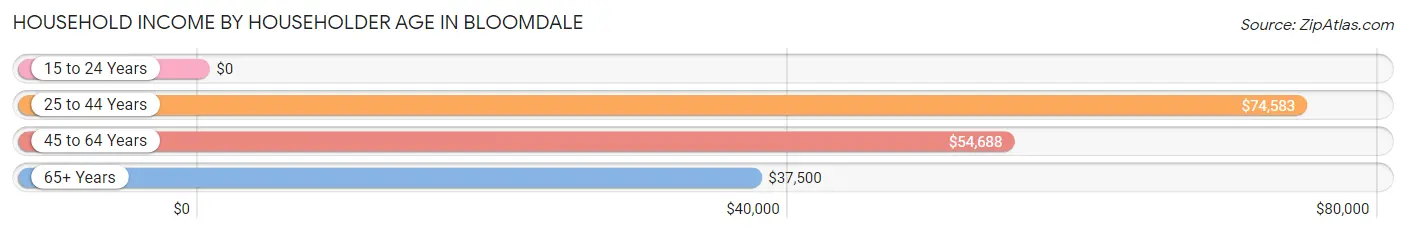
| Income Bracket | # Households | Median Income |
| 15 to 24 Years | 9 (3.3%) | $0 |
| 25 to 44 Years | 65 (23.9%) | $74,583 |
| 45 to 64 Years | 140 (51.5%) | $54,688 |
| 65+ Years | 58 (21.3%) | $37,500 |
| Total | 272 (100.0%) | $57,679 |
Poverty in Bloomdale
Income Below Poverty by Sex and Age in Bloomdale
With 8.4% poverty level for males and 18.3% for females among the residents of Bloomdale, under 5 year old males and under 5 year old females are the most vulnerable to poverty, with 7 males (100.0%) and 22 females (51.2%) in their respective age groups living below the poverty level.
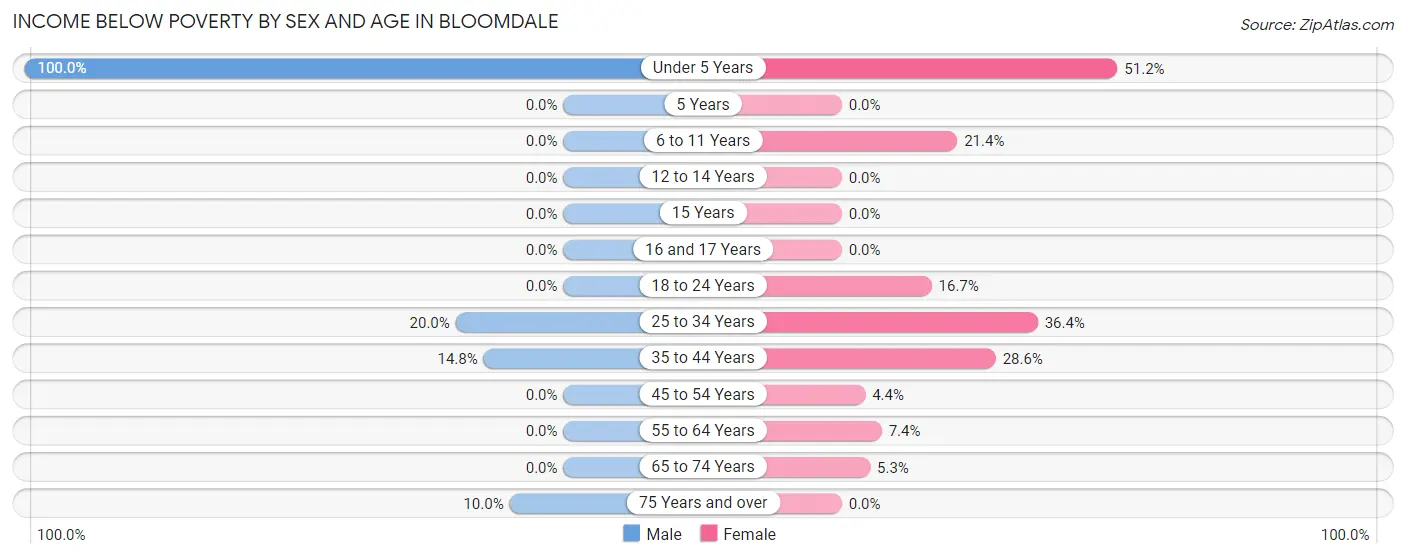
| Age Bracket | Male | Female |
| Under 5 Years | 7 (100.0%) | 22 (51.2%) |
| 5 Years | 0 (0.0%) | 0 (0.0%) |
| 6 to 11 Years | 0 (0.0%) | 3 (21.4%) |
| 12 to 14 Years | 0 (0.0%) | 0 (0.0%) |
| 15 Years | 0 (0.0%) | 0 (0.0%) |
| 16 and 17 Years | 0 (0.0%) | 0 (0.0%) |
| 18 to 24 Years | 0 (0.0%) | 5 (16.7%) |
| 25 to 34 Years | 7 (20.0%) | 16 (36.4%) |
| 35 to 44 Years | 8 (14.8%) | 8 (28.6%) |
| 45 to 54 Years | 0 (0.0%) | 3 (4.3%) |
| 55 to 64 Years | 0 (0.0%) | 2 (7.4%) |
| 65 to 74 Years | 0 (0.0%) | 1 (5.3%) |
| 75 Years and over | 2 (10.0%) | 0 (0.0%) |
| Total | 24 (8.4%) | 60 (18.3%) |
Income Above Poverty by Sex and Age in Bloomdale
According to the poverty statistics in Bloomdale, males aged 6 to 11 years and females aged 5 years are the age groups that are most secure financially, with 100.0% of males and 100.0% of females in these age groups living above the poverty line.
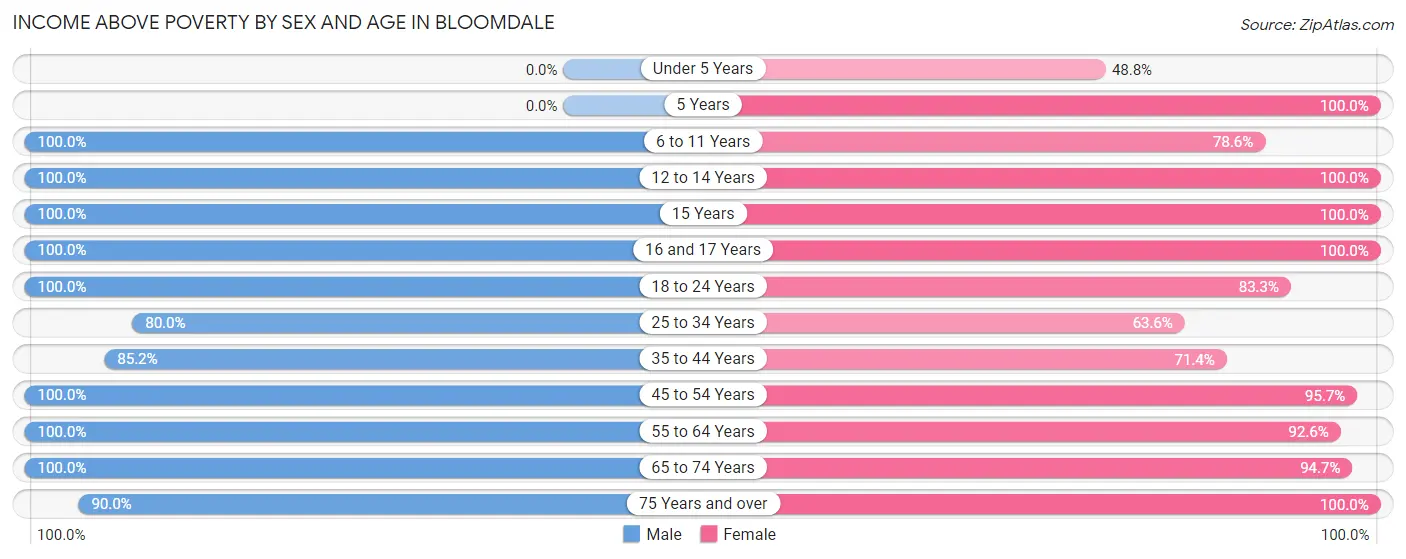
| Age Bracket | Male | Female |
| Under 5 Years | 0 (0.0%) | 21 (48.8%) |
| 5 Years | 0 (0.0%) | 2 (100.0%) |
| 6 to 11 Years | 3 (100.0%) | 11 (78.6%) |
| 12 to 14 Years | 19 (100.0%) | 7 (100.0%) |
| 15 Years | 5 (100.0%) | 4 (100.0%) |
| 16 and 17 Years | 1 (100.0%) | 5 (100.0%) |
| 18 to 24 Years | 23 (100.0%) | 25 (83.3%) |
| 25 to 34 Years | 28 (80.0%) | 28 (63.6%) |
| 35 to 44 Years | 46 (85.2%) | 20 (71.4%) |
| 45 to 54 Years | 32 (100.0%) | 66 (95.7%) |
| 55 to 64 Years | 73 (100.0%) | 25 (92.6%) |
| 65 to 74 Years | 15 (100.0%) | 18 (94.7%) |
| 75 Years and over | 18 (90.0%) | 36 (100.0%) |
| Total | 263 (91.6%) | 268 (81.7%) |
Income Below Poverty Among Married-Couple Families in Bloomdale
The poverty statistics for married-couple families in Bloomdale show that 3.1% or 4 of the total 129 families live below the poverty line. Families with 3 or 4 children have the highest poverty rate of 33.3%, comprising of 4 families. On the other hand, families with no children have the lowest poverty rate of 0.0%, which includes 0 families.
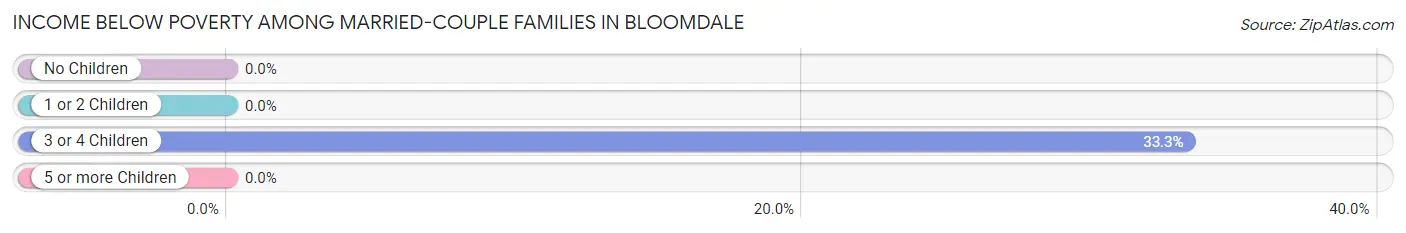
| Children | Above Poverty | Below Poverty |
| No Children | 83 (100.0%) | 0 (0.0%) |
| 1 or 2 Children | 32 (100.0%) | 0 (0.0%) |
| 3 or 4 Children | 8 (66.7%) | 4 (33.3%) |
| 5 or more Children | 2 (100.0%) | 0 (0.0%) |
| Total | 125 (96.9%) | 4 (3.1%) |
Income Below Poverty Among Single-Parent Households in Bloomdale
According to the poverty data in Bloomdale, 20.0% or 2 single-father households and 22.2% or 8 single-mother households are living below the poverty line. Among single-father households, those with no children have the highest poverty rate, with 2 households (25.0%) experiencing poverty. Likewise, among single-mother households, those with 3 or 4 children have the highest poverty rate, with 8 households (100.0%) falling below the poverty line.
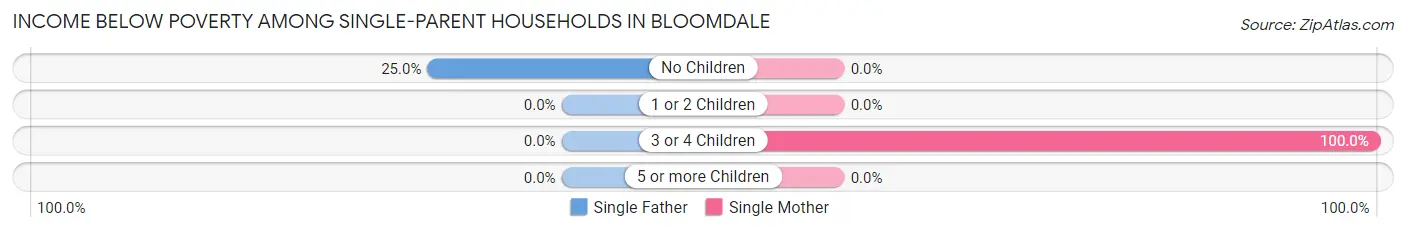
| Children | Single Father | Single Mother |
| No Children | 2 (25.0%) | 0 (0.0%) |
| 1 or 2 Children | 0 (0.0%) | 0 (0.0%) |
| 3 or 4 Children | 0 (0.0%) | 8 (100.0%) |
| 5 or more Children | 0 (0.0%) | 0 (0.0%) |
| Total | 2 (20.0%) | 8 (22.2%) |
Income Below Poverty Among Married-Couple vs Single-Parent Households in Bloomdale
The poverty data for Bloomdale shows that 4 of the married-couple family households (3.1%) and 10 of the single-parent households (21.7%) are living below the poverty level. Within the married-couple family households, those with 3 or 4 children have the highest poverty rate, with 4 households (33.3%) falling below the poverty line. Among the single-parent households, those with 3 or 4 children have the highest poverty rate, with 8 household (100.0%) living below poverty.
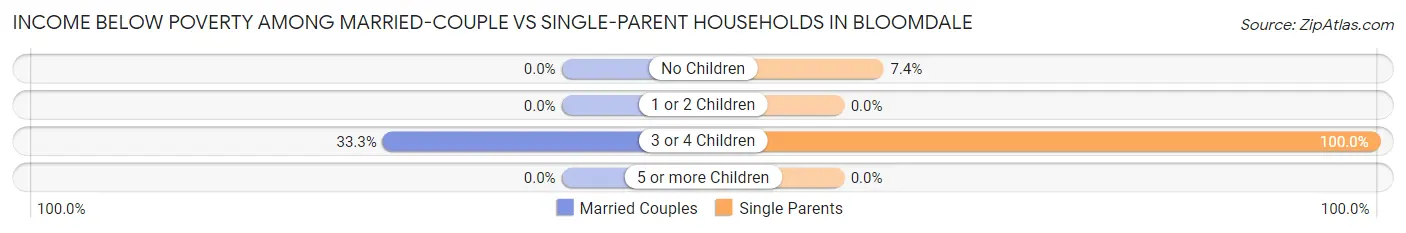
| Children | Married-Couple Families | Single-Parent Households |
| No Children | 0 (0.0%) | 2 (7.4%) |
| 1 or 2 Children | 0 (0.0%) | 0 (0.0%) |
| 3 or 4 Children | 4 (33.3%) | 8 (100.0%) |
| 5 or more Children | 0 (0.0%) | 0 (0.0%) |
| Total | 4 (3.1%) | 10 (21.7%) |
Race in Bloomdale
The most populous races in Bloomdale are White / Caucasian (600 | 95.9%), Two or more Races (24 | 3.8%), and Hispanic or Latino (16 | 2.6%).
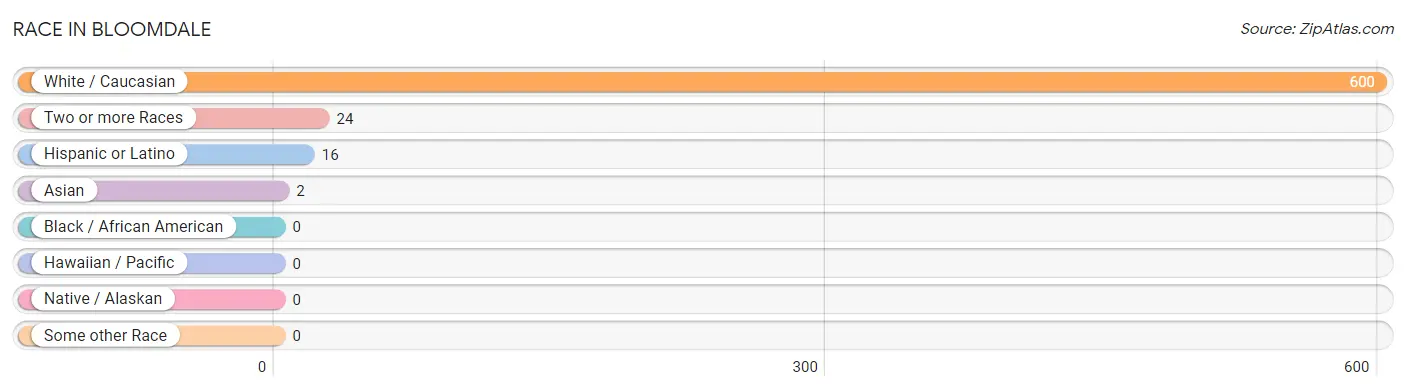
| Race | # Population | % Population |
| Asian | 2 | 0.3% |
| Black / African American | 0 | 0.0% |
| Hawaiian / Pacific | 0 | 0.0% |
| Hispanic or Latino | 16 | 2.6% |
| Native / Alaskan | 0 | 0.0% |
| White / Caucasian | 600 | 95.9% |
| Two or more Races | 24 | 3.8% |
| Some other Race | 0 | 0.0% |
| Total | 626 | 100.0% |
Ancestry in Bloomdale
The most populous ancestries reported in Bloomdale are German (186 | 29.7%), Irish (70 | 11.2%), American (51 | 8.2%), Polish (35 | 5.6%), and Dutch (23 | 3.7%), together accounting for 58.3% of all Bloomdale residents.
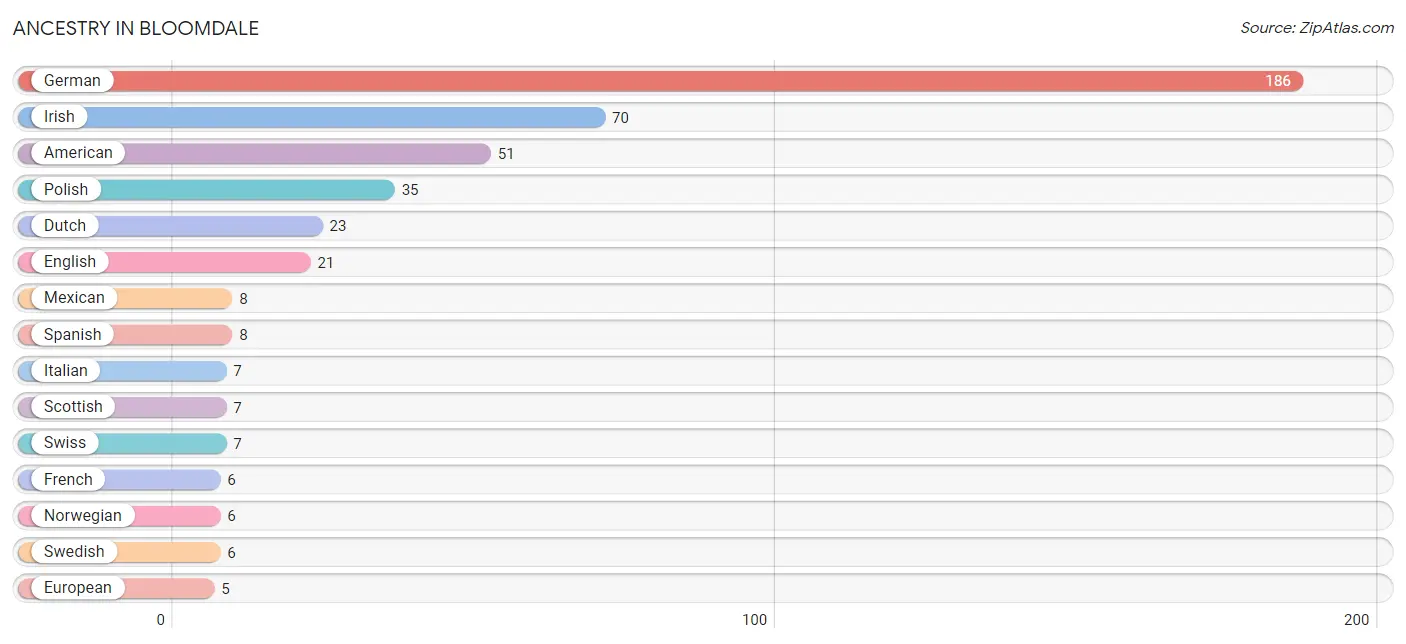
| Ancestry | # Population | % Population |
| American | 51 | 8.2% |
| Bhutanese | 2 | 0.3% |
| Dutch | 23 | 3.7% |
| English | 21 | 3.4% |
| European | 5 | 0.8% |
| French | 6 | 1.0% |
| German | 186 | 29.7% |
| Hungarian | 1 | 0.2% |
| Irish | 70 | 11.2% |
| Italian | 7 | 1.1% |
| Mexican | 8 | 1.3% |
| Norwegian | 6 | 1.0% |
| Polish | 35 | 5.6% |
| Romanian | 1 | 0.2% |
| Scotch-Irish | 4 | 0.6% |
| Scottish | 7 | 1.1% |
| Slovak | 3 | 0.5% |
| Slovene | 2 | 0.3% |
| Spanish | 8 | 1.3% |
| Swedish | 6 | 1.0% |
| Swiss | 7 | 1.1% |
| Welsh | 4 | 0.6% | View All 22 Rows |
Immigrants in Bloomdale
The most numerous immigrant groups reported in Bloomdale came from Europe (2 | 0.3%), Eastern Europe (1 | 0.2%), England (1 | 0.2%), Northern Europe (1 | 0.2%), and Romania (1 | 0.2%), together accounting for 1.0% of all Bloomdale residents.
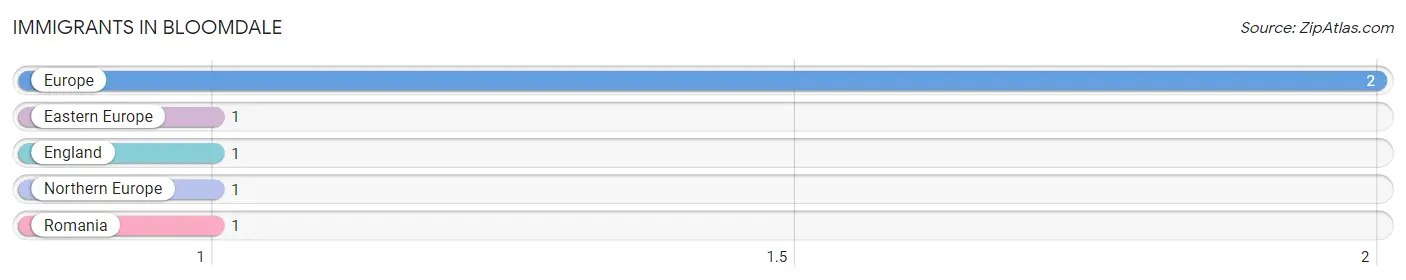
| Immigration Origin | # Population | % Population |
| Eastern Europe | 1 | 0.2% |
| England | 1 | 0.2% |
| Europe | 2 | 0.3% |
| Northern Europe | 1 | 0.2% |
| Romania | 1 | 0.2% | View All 5 Rows |
Sex and Age in Bloomdale
Sex and Age in Bloomdale
The most populous age groups in Bloomdale are 55 to 59 Years (49 | 16.7%) for men and 50 to 54 Years (55 | 16.5%) for women.
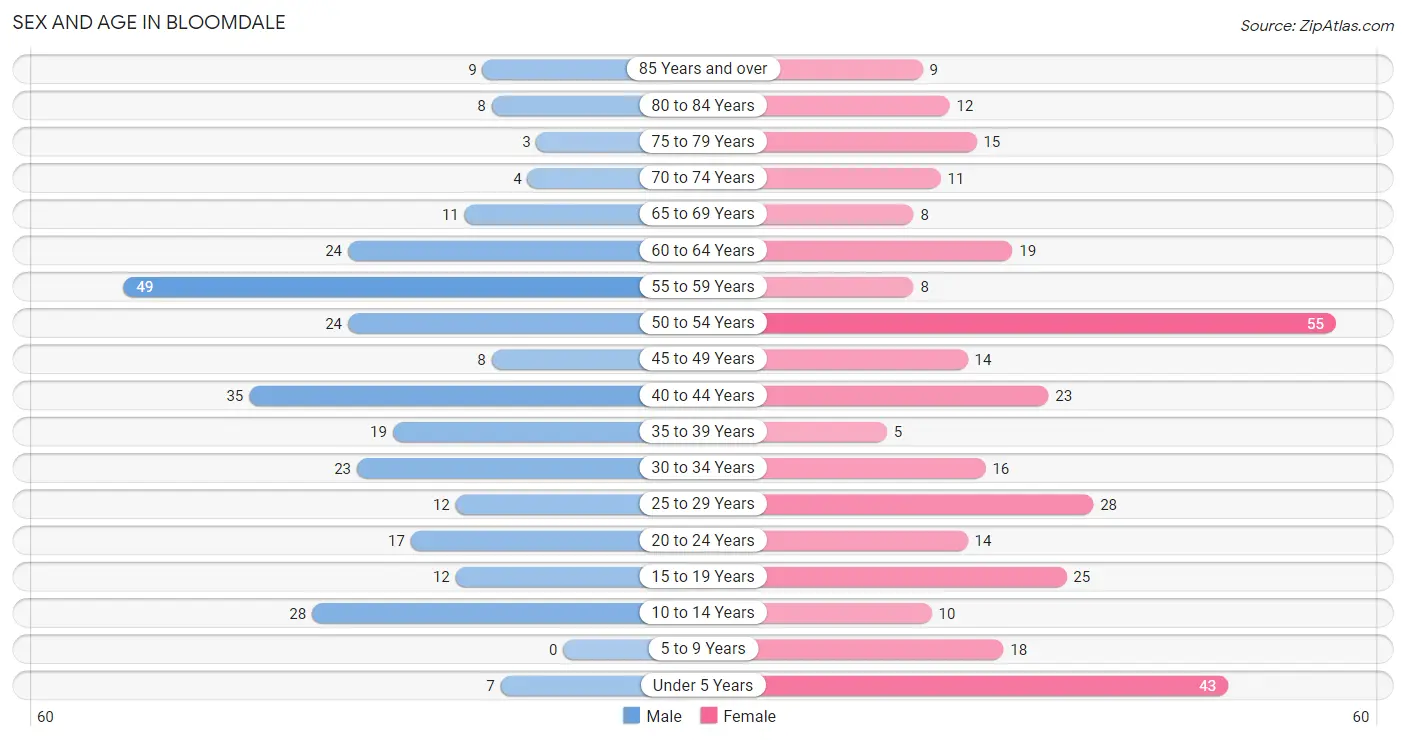
| Age Bracket | Male | Female |
| Under 5 Years | 7 (2.4%) | 43 (12.9%) |
| 5 to 9 Years | 0 (0.0%) | 18 (5.4%) |
| 10 to 14 Years | 28 (9.6%) | 10 (3.0%) |
| 15 to 19 Years | 12 (4.1%) | 25 (7.5%) |
| 20 to 24 Years | 17 (5.8%) | 14 (4.2%) |
| 25 to 29 Years | 12 (4.1%) | 28 (8.4%) |
| 30 to 34 Years | 23 (7.9%) | 16 (4.8%) |
| 35 to 39 Years | 19 (6.5%) | 5 (1.5%) |
| 40 to 44 Years | 35 (11.9%) | 23 (6.9%) |
| 45 to 49 Years | 8 (2.7%) | 14 (4.2%) |
| 50 to 54 Years | 24 (8.2%) | 55 (16.5%) |
| 55 to 59 Years | 49 (16.7%) | 8 (2.4%) |
| 60 to 64 Years | 24 (8.2%) | 19 (5.7%) |
| 65 to 69 Years | 11 (3.7%) | 8 (2.4%) |
| 70 to 74 Years | 4 (1.4%) | 11 (3.3%) |
| 75 to 79 Years | 3 (1.0%) | 15 (4.5%) |
| 80 to 84 Years | 8 (2.7%) | 12 (3.6%) |
| 85 Years and over | 9 (3.1%) | 9 (2.7%) |
| Total | 293 (100.0%) | 333 (100.0%) |
Families and Households in Bloomdale
Median Family Size in Bloomdale
The median family size in Bloomdale is 2.75 persons per family, with married-couple families (129 | 73.7%) accounting for the largest median family size of 2.83 persons per family. On the other hand, single female/mother families (36 | 20.6%) represent the smallest median family size with 2.50 persons per family.
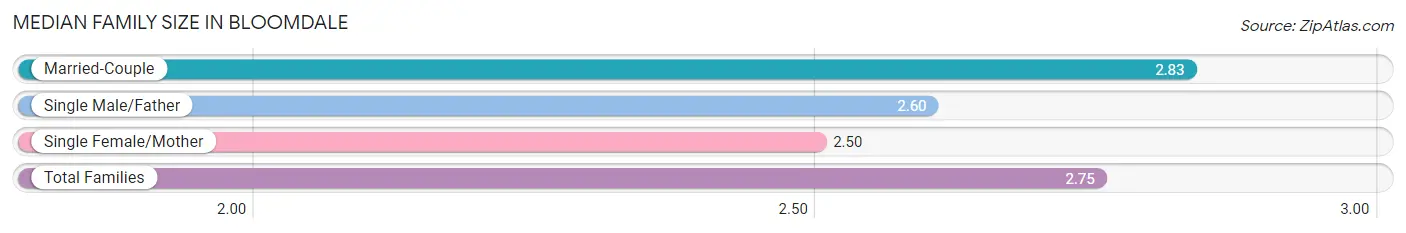
| Family Type | # Families | Family Size |
| Married-Couple | 129 (73.7%) | 2.83 |
| Single Male/Father | 10 (5.7%) | 2.60 |
| Single Female/Mother | 36 (20.6%) | 2.50 |
| Total Families | 175 (100.0%) | 2.75 |
Median Household Size in Bloomdale
The median household size in Bloomdale is 2.30 persons per household, with single female/mother households (36 | 13.2%) accounting for the largest median household size of 3.31 persons per household. non-family households (97 | 35.7%) represent the smallest median household size with 1.14 persons per household.
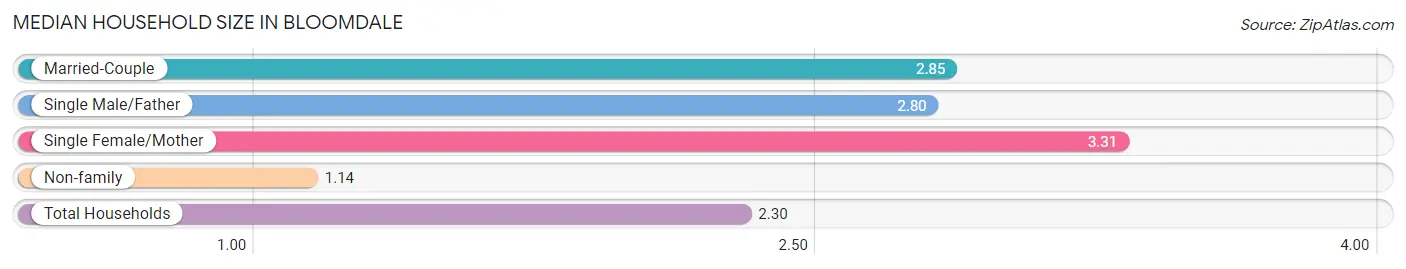
| Household Type | # Households | Household Size |
| Married-Couple | 129 (47.4%) | 2.85 |
| Single Male/Father | 10 (3.7%) | 2.80 |
| Single Female/Mother | 36 (13.2%) | 3.31 |
| Non-family | 97 (35.7%) | 1.14 |
| Total Households | 272 (100.0%) | 2.30 |
Household Size by Marriage Status in Bloomdale
Out of a total of 272 households in Bloomdale, 175 (64.3%) are family households, while 97 (35.7%) are nonfamily households. The most numerous type of family households are 2-person households, comprising 93, and the most common type of nonfamily households are 1-person households, comprising 81.
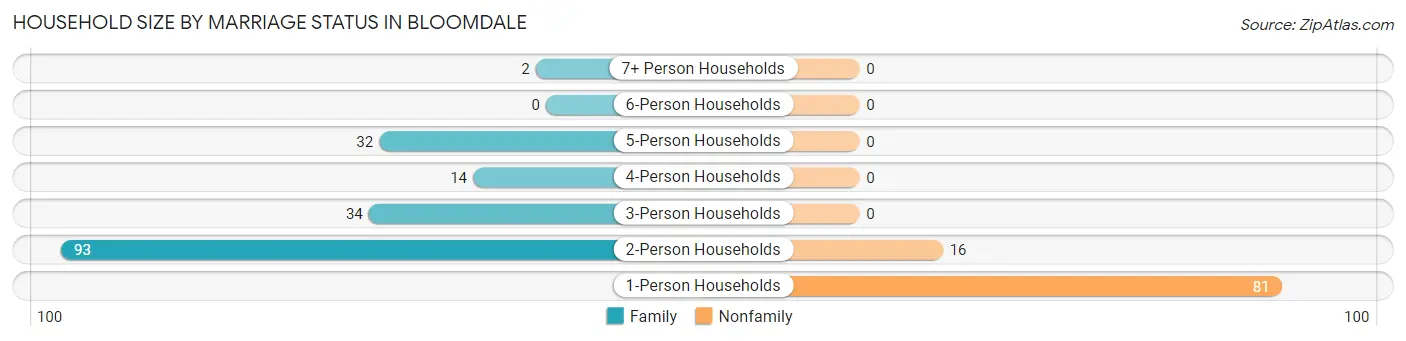
| Household Size | Family Households | Nonfamily Households |
| 1-Person Households | - | 81 (29.8%) |
| 2-Person Households | 93 (34.2%) | 16 (5.9%) |
| 3-Person Households | 34 (12.5%) | 0 (0.0%) |
| 4-Person Households | 14 (5.1%) | 0 (0.0%) |
| 5-Person Households | 32 (11.8%) | 0 (0.0%) |
| 6-Person Households | 0 (0.0%) | 0 (0.0%) |
| 7+ Person Households | 2 (0.7%) | 0 (0.0%) |
| Total | 175 (64.3%) | 97 (35.7%) |
Female Fertility in Bloomdale
Fertility by Age in Bloomdale
Average fertility rate in Bloomdale is 144.0 births per 1,000 women. Women in the age bracket of 35 to 50 years have the highest fertility rate with 238.0 births per 1,000 women. Women in the age bracket of 35 to 50 years acount for 55.6% of all women with births.
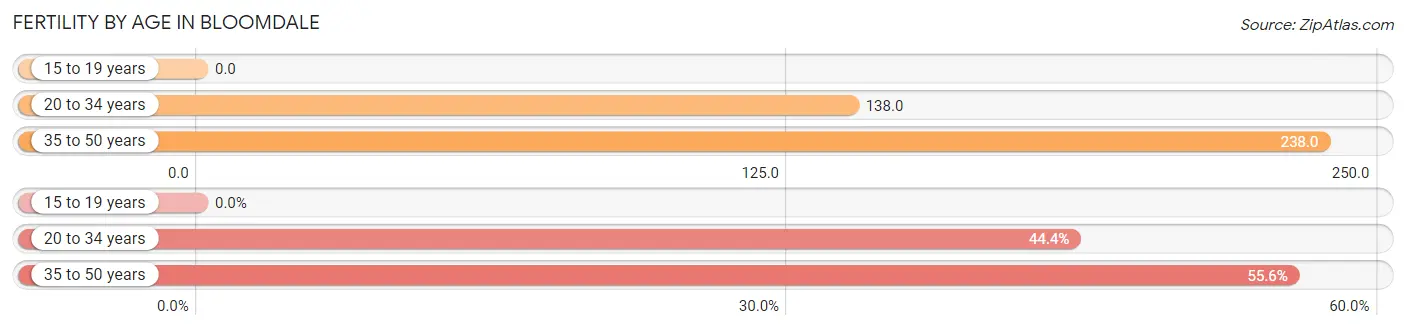
| Age Bracket | Women with Births | Births / 1,000 Women |
| 15 to 19 years | 0 (0.0%) | 0.0 |
| 20 to 34 years | 8 (44.4%) | 138.0 |
| 35 to 50 years | 10 (55.6%) | 238.0 |
| Total | 18 (100.0%) | 144.0 |
Fertility by Age by Marriage Status in Bloomdale
11.1% of women with births (18) in Bloomdale are married. The highest percentage of unmarried women with births falls into 20 to 34 years age bracket with 100.0% of them unmarried at the time of birth, while the lowest percentage of unmarried women with births belong to 35 to 50 years age bracket with 80.0% of them unmarried.
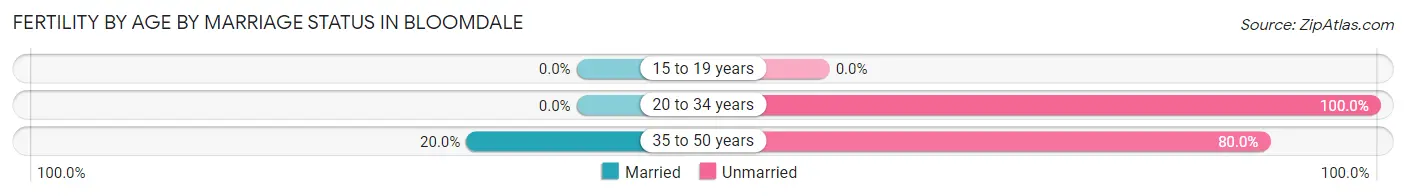
| Age Bracket | Married | Unmarried |
| 15 to 19 years | 0 (0.0%) | 0 (0.0%) |
| 20 to 34 years | 0 (0.0%) | 8 (100.0%) |
| 35 to 50 years | 2 (20.0%) | 8 (80.0%) |
| Total | 2 (11.1%) | 16 (88.9%) |
Fertility by Education in Bloomdale
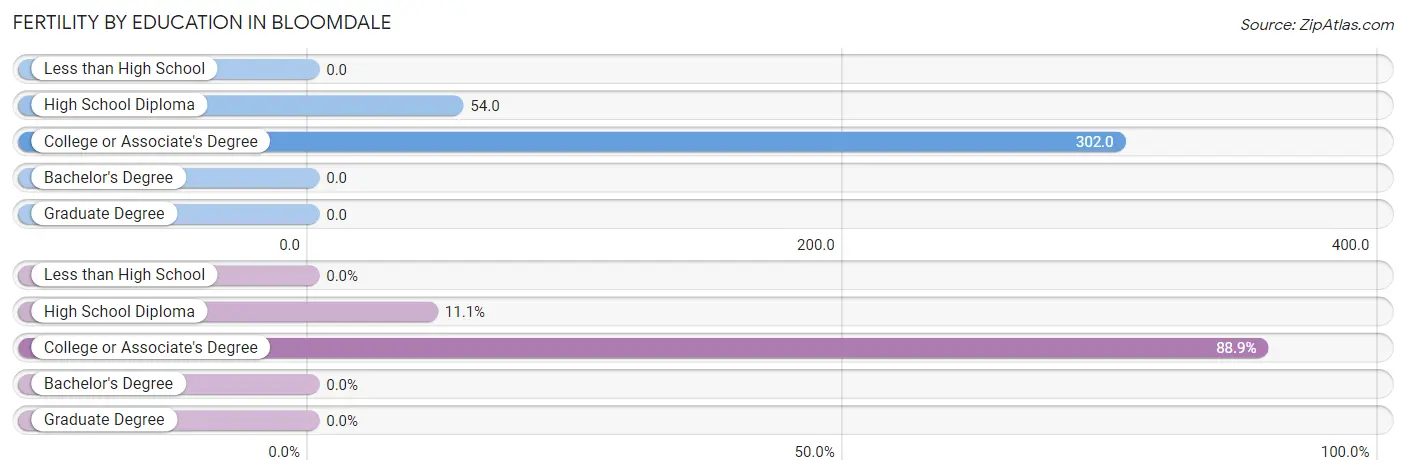
| Educational Attainment | Women with Births | Births / 1,000 Women |
| Less than High School | 0 (0.0%) | 0.0 |
| High School Diploma | 2 (11.1%) | 54.0 |
| College or Associate's Degree | 16 (88.9%) | 302.0 |
| Bachelor's Degree | 0 (0.0%) | 0.0 |
| Graduate Degree | 0 (0.0%) | 0.0 |
| Total | 18 (100.0%) | 144.0 |
Fertility by Education by Marriage Status in Bloomdale
88.9% of women with births in Bloomdale are unmarried. Women with the educational attainment of high school diploma are most likely to be married with 100.0% of them married at childbirth, while women with the educational attainment of college or associate's degree are least likely to be married with 100.0% of them unmarried at childbirth.
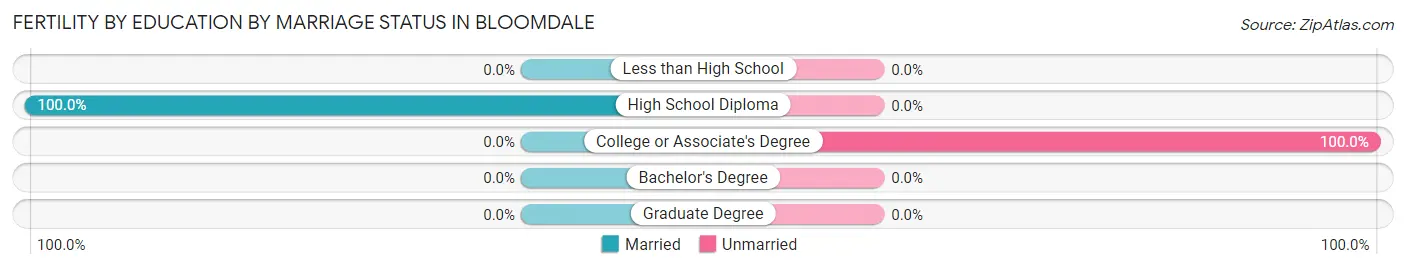
| Educational Attainment | Married | Unmarried |
| Less than High School | 0 (0.0%) | 0 (0.0%) |
| High School Diploma | 2 (100.0%) | 0 (0.0%) |
| College or Associate's Degree | 0 (0.0%) | 16 (100.0%) |
| Bachelor's Degree | 0 (0.0%) | 0 (0.0%) |
| Graduate Degree | 0 (0.0%) | 0 (0.0%) |
| Total | 2 (11.1%) | 16 (88.9%) |
Employment Characteristics in Bloomdale
Employment by Class of Employer in Bloomdale
Among the 295 employed individuals in Bloomdale, private company employees (231 | 78.3%), not-for-profit organizations (23 | 7.8%), and local government employees (23 | 7.8%) make up the most common classes of employment.
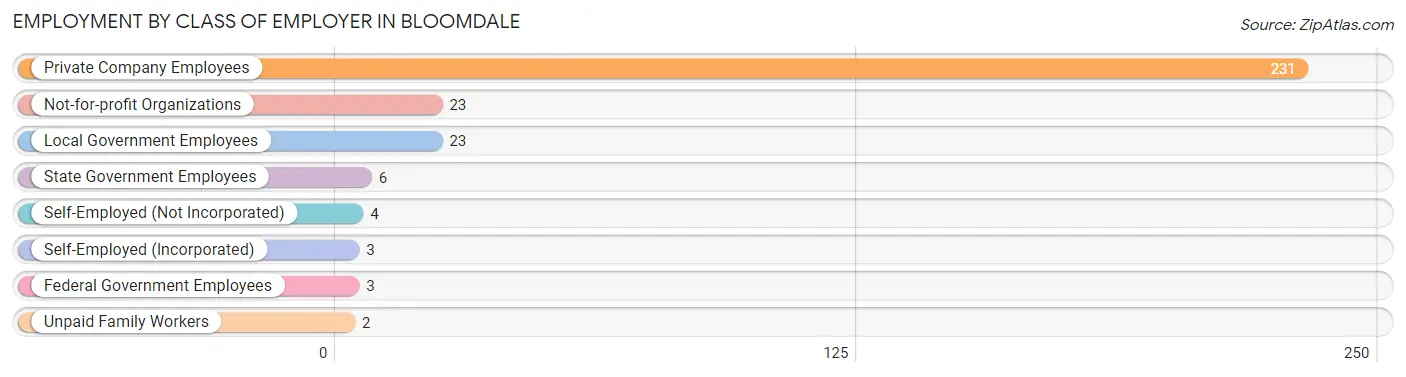
| Employer Class | # Employees | % Employees |
| Private Company Employees | 231 | 78.3% |
| Self-Employed (Incorporated) | 3 | 1.0% |
| Self-Employed (Not Incorporated) | 4 | 1.4% |
| Not-for-profit Organizations | 23 | 7.8% |
| Local Government Employees | 23 | 7.8% |
| State Government Employees | 6 | 2.0% |
| Federal Government Employees | 3 | 1.0% |
| Unpaid Family Workers | 2 | 0.7% |
| Total | 295 | 100.0% |
Employment Status by Age in Bloomdale
According to the labor force statistics for Bloomdale, out of the total population over 16 years of age (511), 60.1% or 307 individuals are in the labor force, with 2.0% or 6 of them unemployed. The age group with the highest labor force participation rate is 30 to 34 years, with 97.4% or 38 individuals in the labor force. Within the labor force, the 30 to 34 years age range has the highest percentage of unemployed individuals, with 10.5% or 4 of them being unemployed.
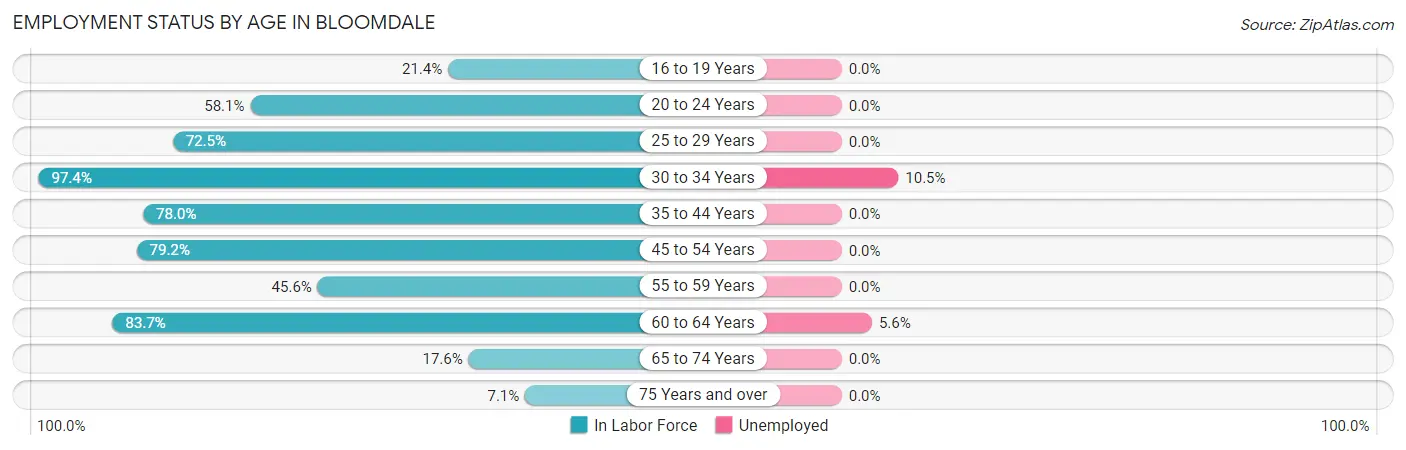
| Age Bracket | In Labor Force | Unemployed |
| 16 to 19 Years | 6 (21.4%) | 0 (0.0%) |
| 20 to 24 Years | 18 (58.1%) | 0 (0.0%) |
| 25 to 29 Years | 29 (72.5%) | 0 (0.0%) |
| 30 to 34 Years | 38 (97.4%) | 4 (10.5%) |
| 35 to 44 Years | 64 (78.0%) | 0 (0.0%) |
| 45 to 54 Years | 80 (79.2%) | 0 (0.0%) |
| 55 to 59 Years | 26 (45.6%) | 0 (0.0%) |
| 60 to 64 Years | 36 (83.7%) | 2 (5.6%) |
| 65 to 74 Years | 6 (17.6%) | 0 (0.0%) |
| 75 Years and over | 4 (7.1%) | 0 (0.0%) |
| Total | 307 (60.1%) | 6 (2.0%) |
Employment Status by Educational Attainment in Bloomdale
According to labor force statistics for Bloomdale, 75.4% of individuals (273) out of the total population between 25 and 64 years of age (362) are in the labor force, with 2.2% or 6 of them being unemployed. The group with the highest labor force participation rate are those with the educational attainment of bachelor's degree or higher, with 85.7% or 24 individuals in the labor force. Within the labor force, individuals with college / associate degree education have the highest percentage of unemployment, with 5.1% or 6 of them being unemployed.
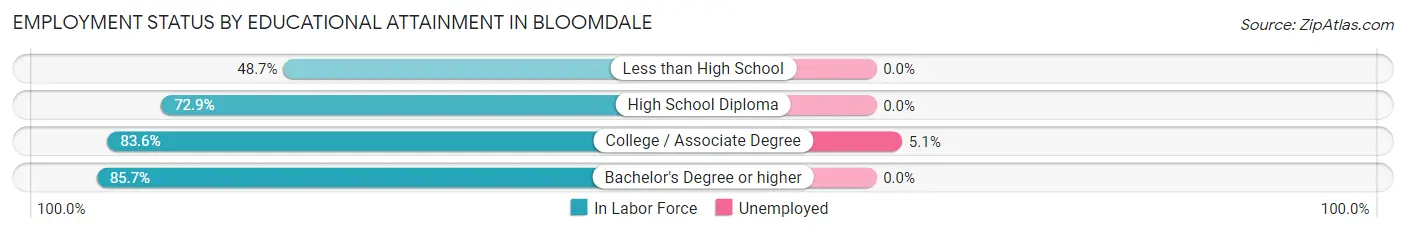
| Educational Attainment | In Labor Force | Unemployed |
| Less than High School | 19 (48.7%) | 0 (0.0%) |
| High School Diploma | 113 (72.9%) | 0 (0.0%) |
| College / Associate Degree | 117 (83.6%) | 7 (5.1%) |
| Bachelor's Degree or higher | 24 (85.7%) | 0 (0.0%) |
| Total | 273 (75.4%) | 8 (2.2%) |
Employment Occupations by Sex in Bloomdale
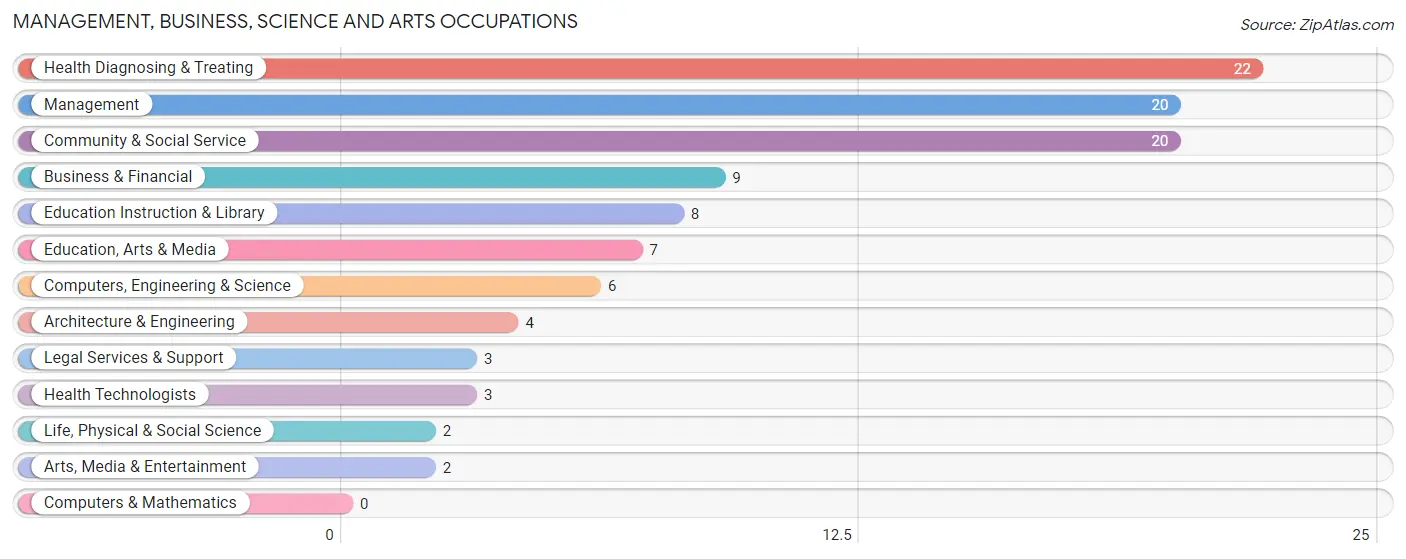
Management, Business, Science and Arts Occupations
The most common Management, Business, Science and Arts occupations in Bloomdale are Health Diagnosing & Treating (22 | 7.3%), Management (20 | 6.6%), Community & Social Service (20 | 6.6%), Business & Financial (9 | 3.0%), and Education Instruction & Library (8 | 2.7%).
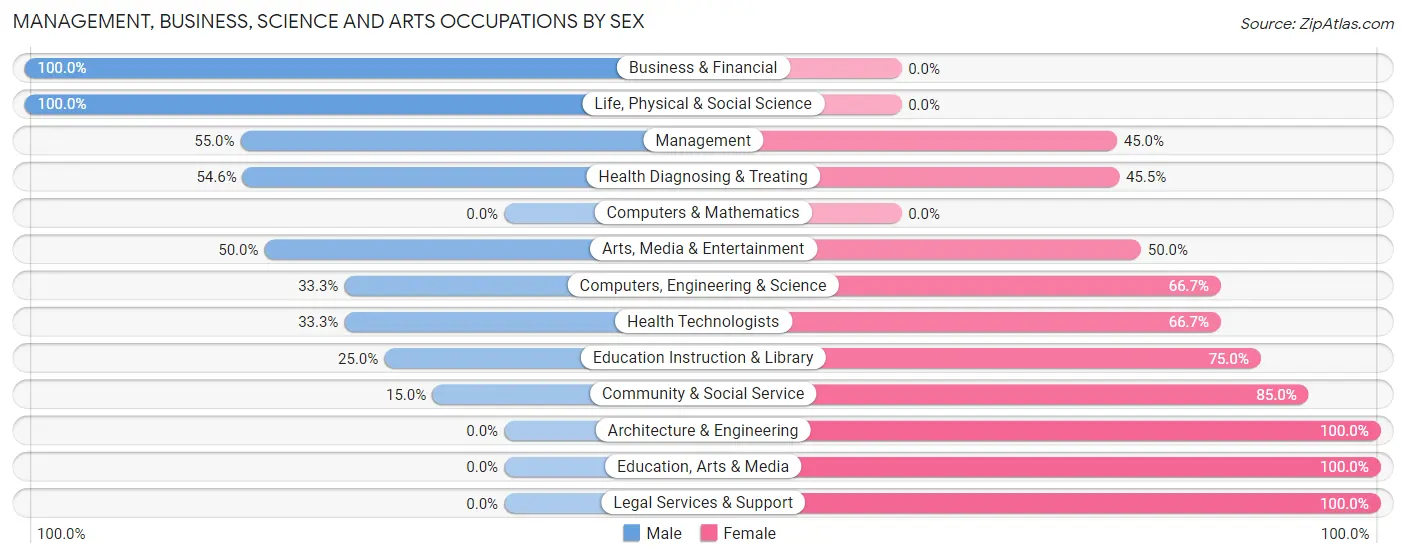
Management, Business, Science and Arts Occupations by Sex
Within the Management, Business, Science and Arts occupations in Bloomdale, the most male-oriented occupations are Business & Financial (100.0%), Life, Physical & Social Science (100.0%), and Management (55.0%), while the most female-oriented occupations are Architecture & Engineering (100.0%), Education, Arts & Media (100.0%), and Legal Services & Support (100.0%).
| Occupation | Male | Female |
| Management | 11 (55.0%) | 9 (45.0%) |
| Business & Financial | 9 (100.0%) | 0 (0.0%) |
| Computers, Engineering & Science | 2 (33.3%) | 4 (66.7%) |
| Computers & Mathematics | 0 (0.0%) | 0 (0.0%) |
| Architecture & Engineering | 0 (0.0%) | 4 (100.0%) |
| Life, Physical & Social Science | 2 (100.0%) | 0 (0.0%) |
| Community & Social Service | 3 (15.0%) | 17 (85.0%) |
| Education, Arts & Media | 0 (0.0%) | 7 (100.0%) |
| Legal Services & Support | 0 (0.0%) | 3 (100.0%) |
| Education Instruction & Library | 2 (25.0%) | 6 (75.0%) |
| Arts, Media & Entertainment | 1 (50.0%) | 1 (50.0%) |
| Health Diagnosing & Treating | 12 (54.5%) | 10 (45.5%) |
| Health Technologists | 1 (33.3%) | 2 (66.7%) |
| Total (Category) | 37 (48.0%) | 40 (51.9%) |
| Total (Overall) | 157 (52.2%) | 144 (47.8%) |
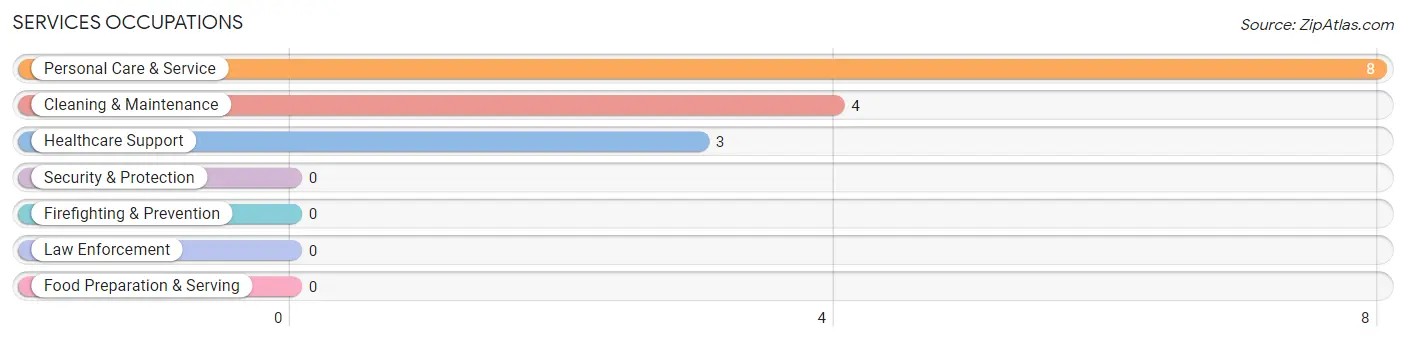
Services Occupations
The most common Services occupations in Bloomdale are Personal Care & Service (8 | 2.7%), Cleaning & Maintenance (4 | 1.3%), and Healthcare Support (3 | 1.0%).
Services Occupations by Sex
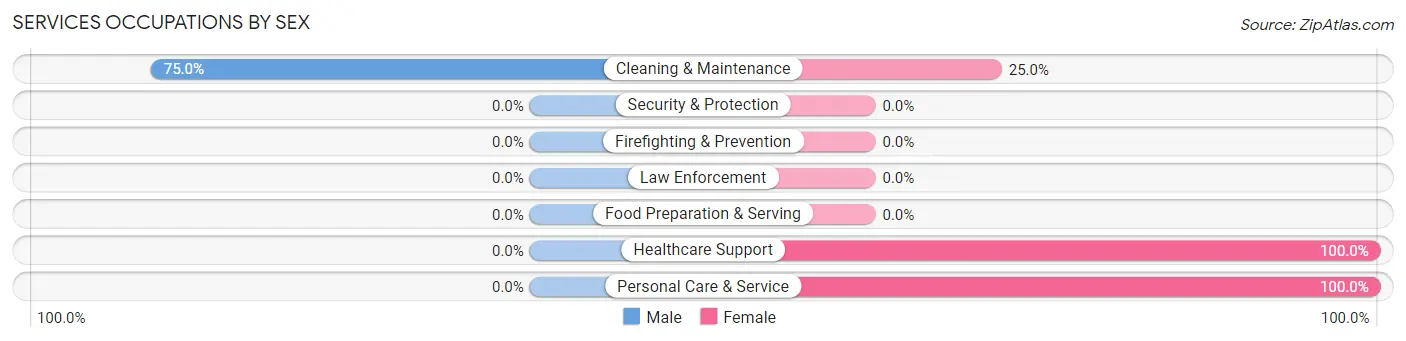
| Occupation | Male | Female |
| Healthcare Support | 0 (0.0%) | 3 (100.0%) |
| Security & Protection | 0 (0.0%) | 0 (0.0%) |
| Firefighting & Prevention | 0 (0.0%) | 0 (0.0%) |
| Law Enforcement | 0 (0.0%) | 0 (0.0%) |
| Food Preparation & Serving | 0 (0.0%) | 0 (0.0%) |
| Cleaning & Maintenance | 3 (75.0%) | 1 (25.0%) |
| Personal Care & Service | 0 (0.0%) | 8 (100.0%) |
| Total (Category) | 3 (20.0%) | 12 (80.0%) |
| Total (Overall) | 157 (52.2%) | 144 (47.8%) |
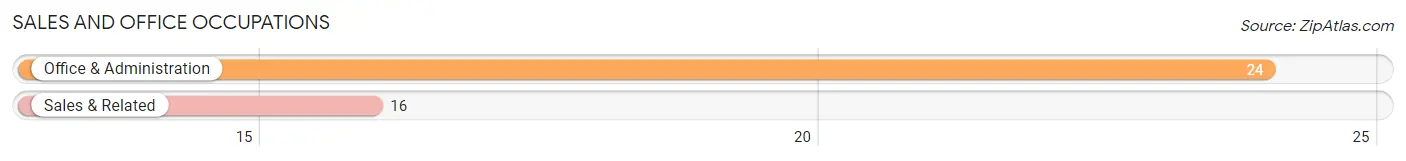
Sales and Office Occupations
The most common Sales and Office occupations in Bloomdale are Office & Administration (24 | 8.0%), and Sales & Related (16 | 5.3%).
Sales and Office Occupations by Sex
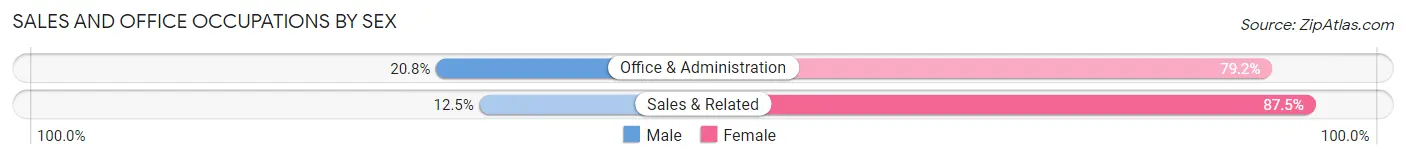
| Occupation | Male | Female |
| Sales & Related | 2 (12.5%) | 14 (87.5%) |
| Office & Administration | 5 (20.8%) | 19 (79.2%) |
| Total (Category) | 7 (17.5%) | 33 (82.5%) |
| Total (Overall) | 157 (52.2%) | 144 (47.8%) |
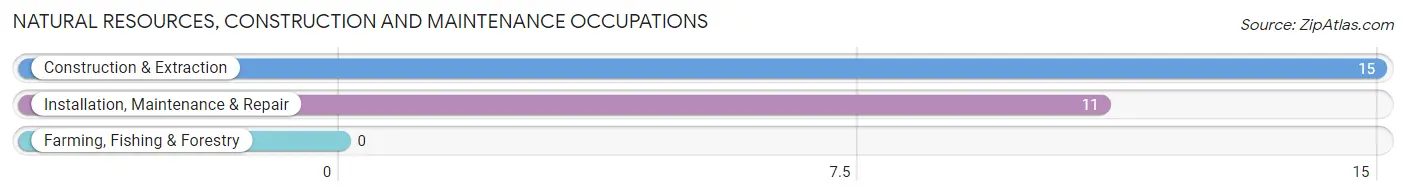
Natural Resources, Construction and Maintenance Occupations
The most common Natural Resources, Construction and Maintenance occupations in Bloomdale are Construction & Extraction (15 | 5.0%), and Installation, Maintenance & Repair (11 | 3.6%).
Natural Resources, Construction and Maintenance Occupations by Sex
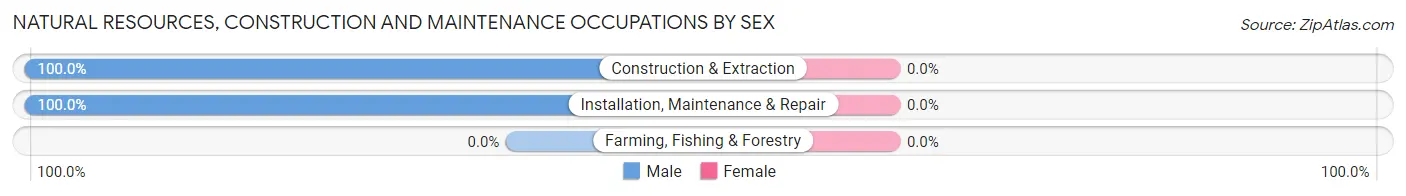
| Occupation | Male | Female |
| Farming, Fishing & Forestry | 0 (0.0%) | 0 (0.0%) |
| Construction & Extraction | 15 (100.0%) | 0 (0.0%) |
| Installation, Maintenance & Repair | 11 (100.0%) | 0 (0.0%) |
| Total (Category) | 26 (100.0%) | 0 (0.0%) |
| Total (Overall) | 157 (52.2%) | 144 (47.8%) |
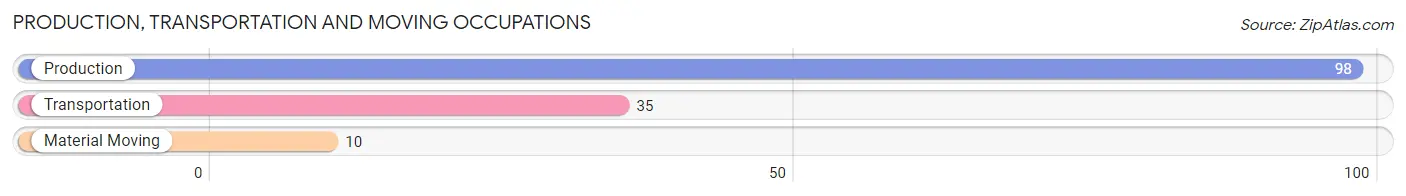
Production, Transportation and Moving Occupations
The most common Production, Transportation and Moving occupations in Bloomdale are Production (98 | 32.6%), Transportation (35 | 11.6%), and Material Moving (10 | 3.3%).
Production, Transportation and Moving Occupations by Sex
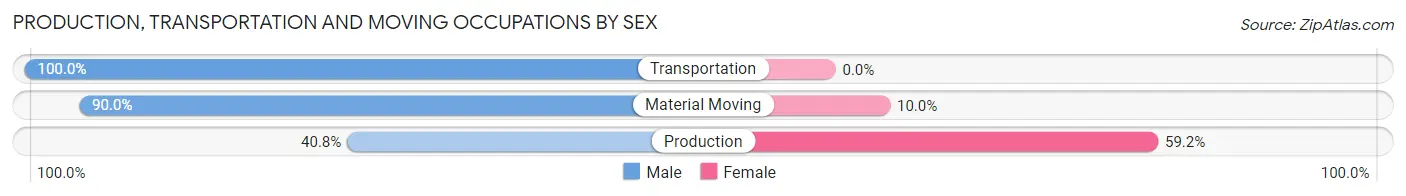
| Occupation | Male | Female |
| Production | 40 (40.8%) | 58 (59.2%) |
| Transportation | 35 (100.0%) | 0 (0.0%) |
| Material Moving | 9 (90.0%) | 1 (10.0%) |
| Total (Category) | 84 (58.7%) | 59 (41.3%) |
| Total (Overall) | 157 (52.2%) | 144 (47.8%) |
Employment Industries by Sex in Bloomdale
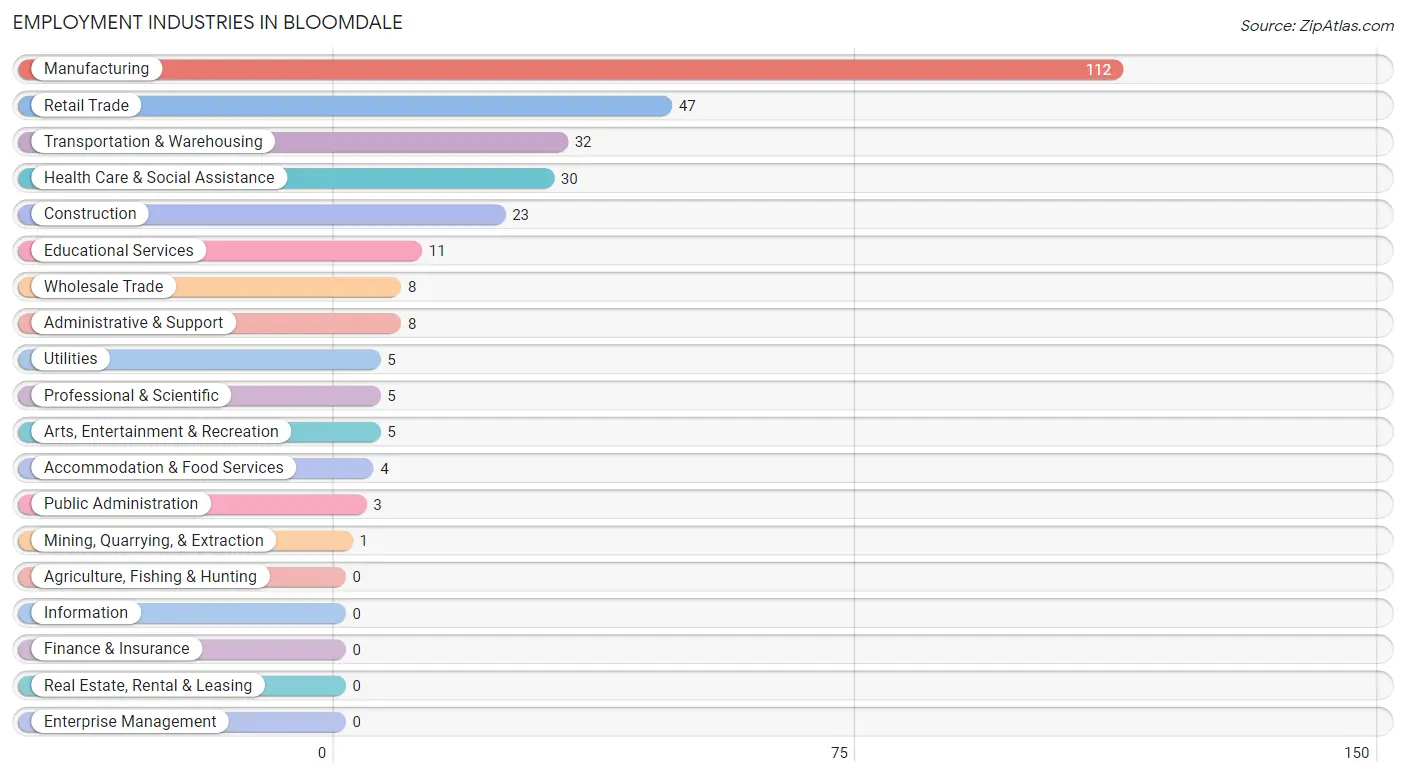
Employment Industries in Bloomdale
The major employment industries in Bloomdale include Manufacturing (112 | 37.2%), Retail Trade (47 | 15.6%), Transportation & Warehousing (32 | 10.6%), Health Care & Social Assistance (30 | 10.0%), and Construction (23 | 7.6%).
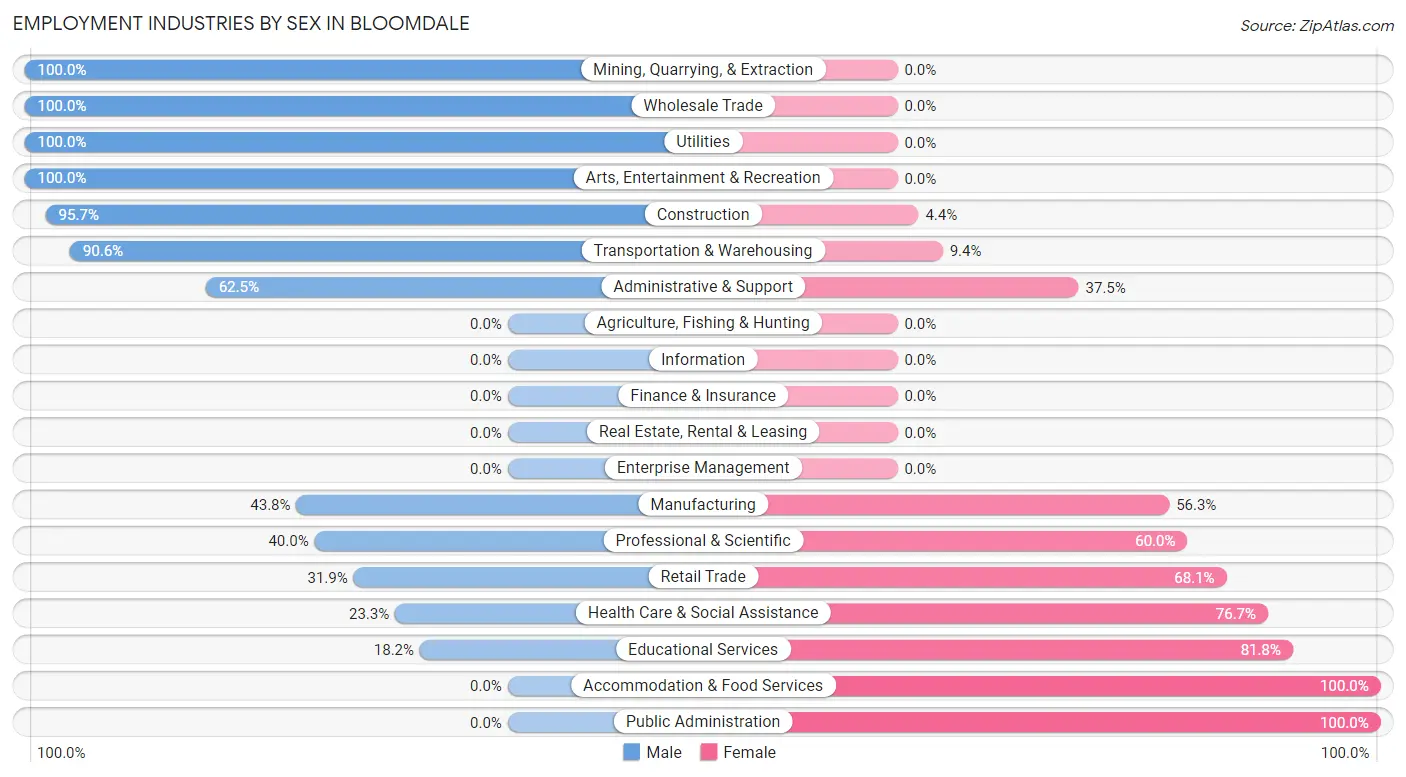
Employment Industries by Sex in Bloomdale
The Bloomdale industries that see more men than women are Mining, Quarrying, & Extraction (100.0%), Wholesale Trade (100.0%), and Utilities (100.0%), whereas the industries that tend to have a higher number of women are Accommodation & Food Services (100.0%), Public Administration (100.0%), and Educational Services (81.8%).
| Industry | Male | Female |
| Agriculture, Fishing & Hunting | 0 (0.0%) | 0 (0.0%) |
| Mining, Quarrying, & Extraction | 1 (100.0%) | 0 (0.0%) |
| Construction | 22 (95.7%) | 1 (4.3%) |
| Manufacturing | 49 (43.8%) | 63 (56.2%) |
| Wholesale Trade | 8 (100.0%) | 0 (0.0%) |
| Retail Trade | 15 (31.9%) | 32 (68.1%) |
| Transportation & Warehousing | 29 (90.6%) | 3 (9.4%) |
| Utilities | 5 (100.0%) | 0 (0.0%) |
| Information | 0 (0.0%) | 0 (0.0%) |
| Finance & Insurance | 0 (0.0%) | 0 (0.0%) |
| Real Estate, Rental & Leasing | 0 (0.0%) | 0 (0.0%) |
| Professional & Scientific | 2 (40.0%) | 3 (60.0%) |
| Enterprise Management | 0 (0.0%) | 0 (0.0%) |
| Administrative & Support | 5 (62.5%) | 3 (37.5%) |
| Educational Services | 2 (18.2%) | 9 (81.8%) |
| Health Care & Social Assistance | 7 (23.3%) | 23 (76.7%) |
| Arts, Entertainment & Recreation | 5 (100.0%) | 0 (0.0%) |
| Accommodation & Food Services | 0 (0.0%) | 4 (100.0%) |
| Public Administration | 0 (0.0%) | 3 (100.0%) |
| Total | 157 (52.2%) | 144 (47.8%) |
Education in Bloomdale
School Enrollment in Bloomdale
The most common levels of schooling among the 124 students in Bloomdale are middle school (35 | 28.2%), high school (33 | 26.6%), and college / undergraduate (25 | 20.2%).
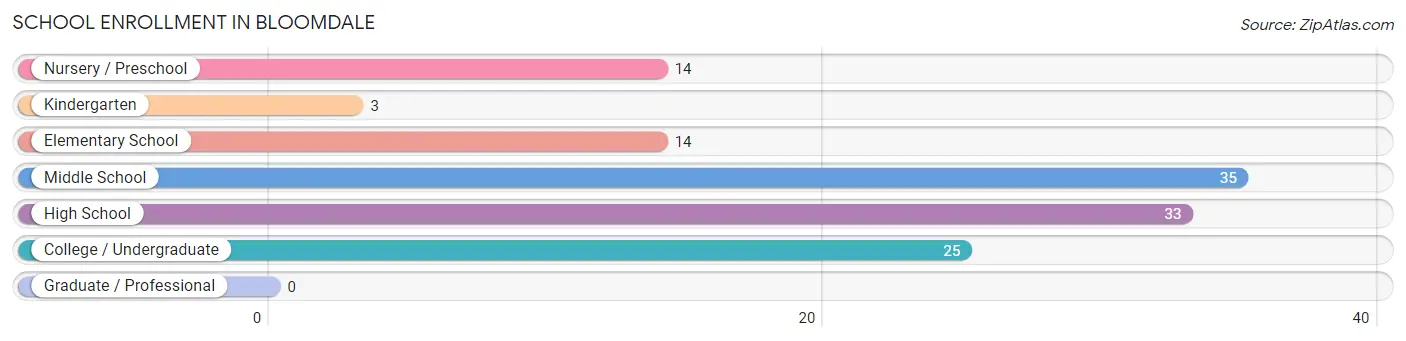
| School Level | # Students | % Students |
| Nursery / Preschool | 14 | 11.3% |
| Kindergarten | 3 | 2.4% |
| Elementary School | 14 | 11.3% |
| Middle School | 35 | 28.2% |
| High School | 33 | 26.6% |
| College / Undergraduate | 25 | 20.2% |
| Graduate / Professional | 0 | 0.0% |
| Total | 124 | 100.0% |
School Enrollment by Age by Funding Source in Bloomdale
Out of a total of 124 students who are enrolled in schools in Bloomdale, 22 (17.7%) attend a private institution, while the remaining 102 (82.3%) are enrolled in public schools. The age group of 20 to 24 year olds has the highest likelihood of being enrolled in private schools, with 9 (100.0% in the age bracket) enrolled. Conversely, the age group of 3 to 4 year olds has the lowest likelihood of being enrolled in a private school, with 12 (100.0% in the age bracket) attending a public institution.
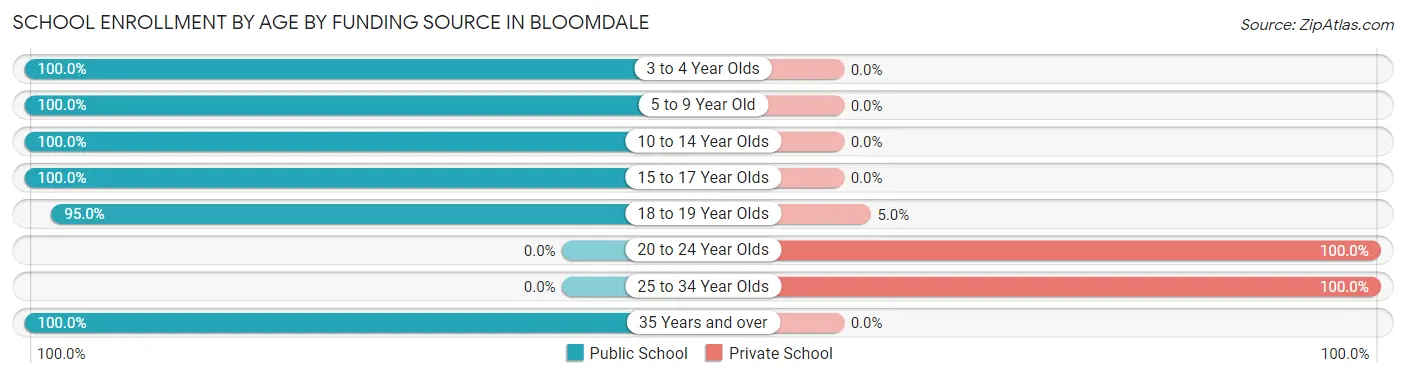
| Age Bracket | Public School | Private School |
| 3 to 4 Year Olds | 12 (100.0%) | 0 (0.0%) |
| 5 to 9 Year Old | 18 (100.0%) | 0 (0.0%) |
| 10 to 14 Year Olds | 36 (100.0%) | 0 (0.0%) |
| 15 to 17 Year Olds | 15 (100.0%) | 0 (0.0%) |
| 18 to 19 Year Olds | 19 (95.0%) | 1 (5.0%) |
| 20 to 24 Year Olds | 0 (0.0%) | 9 (100.0%) |
| 25 to 34 Year Olds | 0 (0.0%) | 12 (100.0%) |
| 35 Years and over | 2 (100.0%) | 0 (0.0%) |
| Total | 102 (82.3%) | 22 (17.7%) |
Educational Attainment by Field of Study in Bloomdale
Education (17 | 38.6%), physical & health sciences (5 | 11.4%), science & technology (4 | 9.1%), business (4 | 9.1%), and visual & performing arts (4 | 9.1%) are the most common fields of study among 44 individuals in Bloomdale who have obtained a bachelor's degree or higher.
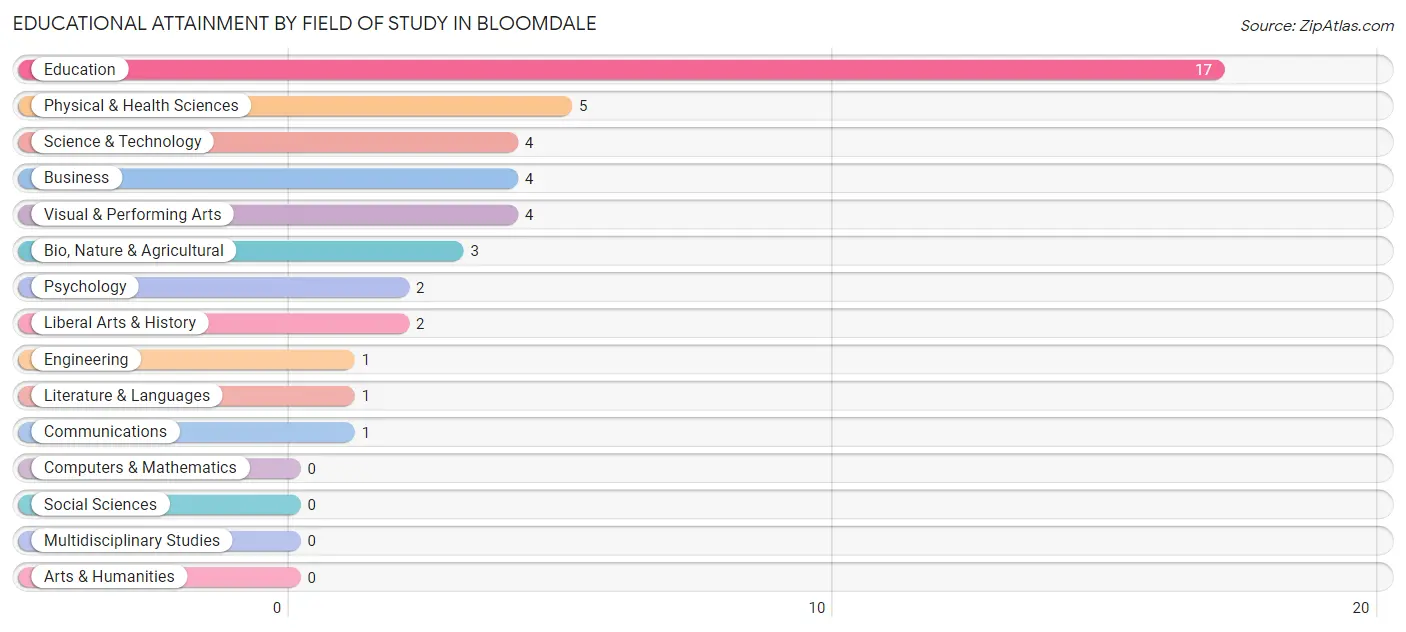
| Field of Study | # Graduates | % Graduates |
| Computers & Mathematics | 0 | 0.0% |
| Bio, Nature & Agricultural | 3 | 6.8% |
| Physical & Health Sciences | 5 | 11.4% |
| Psychology | 2 | 4.5% |
| Social Sciences | 0 | 0.0% |
| Engineering | 1 | 2.3% |
| Multidisciplinary Studies | 0 | 0.0% |
| Science & Technology | 4 | 9.1% |
| Business | 4 | 9.1% |
| Education | 17 | 38.6% |
| Literature & Languages | 1 | 2.3% |
| Liberal Arts & History | 2 | 4.5% |
| Visual & Performing Arts | 4 | 9.1% |
| Communications | 1 | 2.3% |
| Arts & Humanities | 0 | 0.0% |
| Total | 44 | 100.0% |
Transportation & Commute in Bloomdale
Vehicle Availability by Sex in Bloomdale
The most prevalent vehicle ownership categories in Bloomdale are males with 2 vehicles (70, accounting for 44.6%) and females with 2 vehicles (45, making up 50.7%).
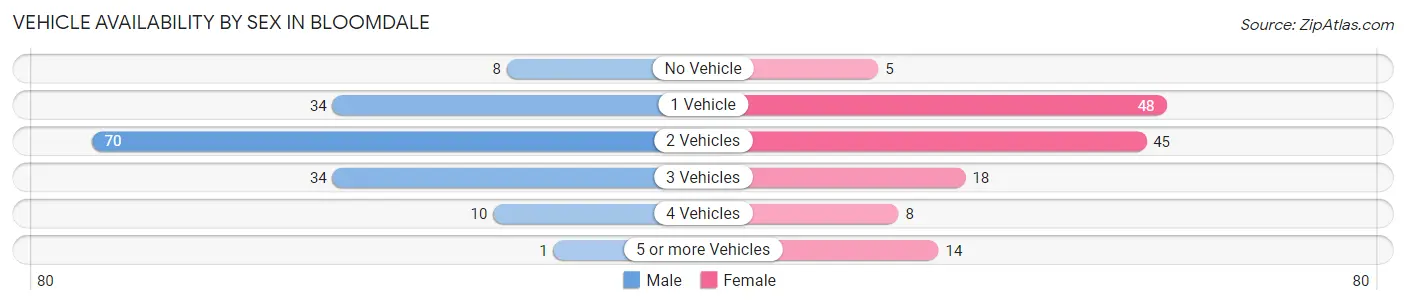
| Vehicles Available | Male | Female |
| No Vehicle | 8 (5.1%) | 5 (3.6%) |
| 1 Vehicle | 34 (21.7%) | 48 (34.8%) |
| 2 Vehicles | 70 (44.6%) | 45 (32.6%) |
| 3 Vehicles | 34 (21.7%) | 18 (13.0%) |
| 4 Vehicles | 10 (6.4%) | 8 (5.8%) |
| 5 or more Vehicles | 1 (0.6%) | 14 (10.1%) |
| Total | 157 (100.0%) | 138 (100.0%) |
Commute Time in Bloomdale
The most frequently occuring commute durations in Bloomdale are 15 to 19 minutes (75 commuters, 25.4%), 20 to 24 minutes (56 commuters, 19.0%), and 10 to 14 minutes (55 commuters, 18.6%).
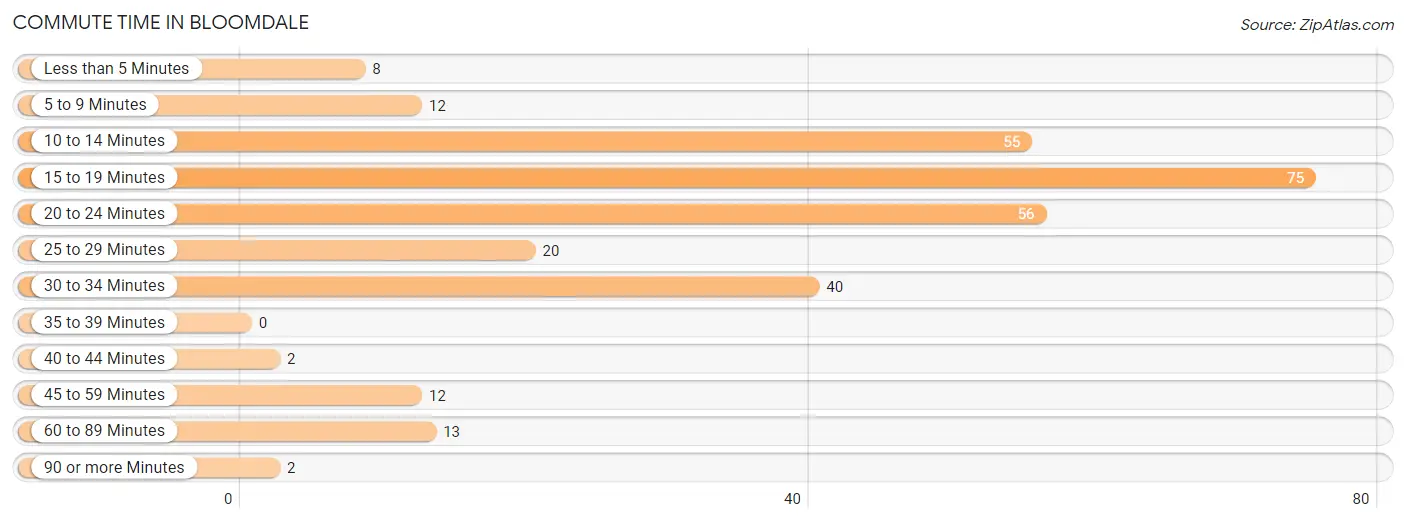
| Commute Time | # Commuters | % Commuters |
| Less than 5 Minutes | 8 | 2.7% |
| 5 to 9 Minutes | 12 | 4.1% |
| 10 to 14 Minutes | 55 | 18.6% |
| 15 to 19 Minutes | 75 | 25.4% |
| 20 to 24 Minutes | 56 | 19.0% |
| 25 to 29 Minutes | 20 | 6.8% |
| 30 to 34 Minutes | 40 | 13.6% |
| 35 to 39 Minutes | 0 | 0.0% |
| 40 to 44 Minutes | 2 | 0.7% |
| 45 to 59 Minutes | 12 | 4.1% |
| 60 to 89 Minutes | 13 | 4.4% |
| 90 or more Minutes | 2 | 0.7% |
Commute Time by Sex in Bloomdale
The most common commute times in Bloomdale are 15 to 19 minutes (33 commuters, 21.0%) for males and 15 to 19 minutes (42 commuters, 30.4%) for females.
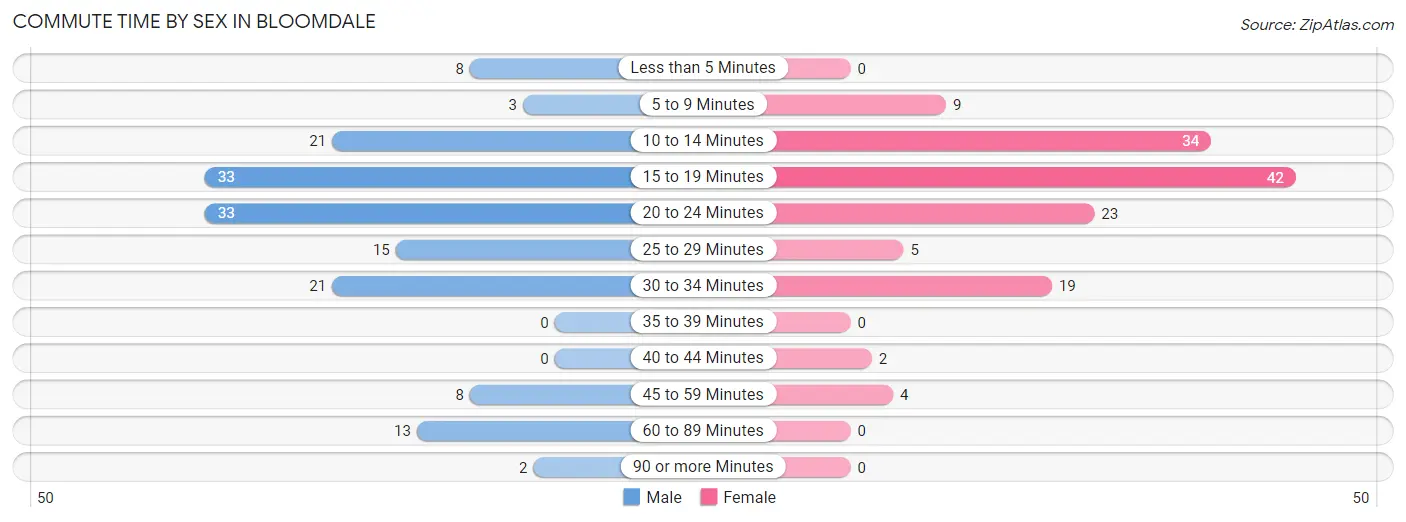
| Commute Time | Male | Female |
| Less than 5 Minutes | 8 (5.1%) | 0 (0.0%) |
| 5 to 9 Minutes | 3 (1.9%) | 9 (6.5%) |
| 10 to 14 Minutes | 21 (13.4%) | 34 (24.6%) |
| 15 to 19 Minutes | 33 (21.0%) | 42 (30.4%) |
| 20 to 24 Minutes | 33 (21.0%) | 23 (16.7%) |
| 25 to 29 Minutes | 15 (9.6%) | 5 (3.6%) |
| 30 to 34 Minutes | 21 (13.4%) | 19 (13.8%) |
| 35 to 39 Minutes | 0 (0.0%) | 0 (0.0%) |
| 40 to 44 Minutes | 0 (0.0%) | 2 (1.5%) |
| 45 to 59 Minutes | 8 (5.1%) | 4 (2.9%) |
| 60 to 89 Minutes | 13 (8.3%) | 0 (0.0%) |
| 90 or more Minutes | 2 (1.3%) | 0 (0.0%) |
Time of Departure to Work by Sex in Bloomdale
The most frequent times of departure to work in Bloomdale are 5:00 AM to 5:29 AM (36, 22.9%) for males and 5:00 AM to 5:29 AM (33, 23.9%) for females.
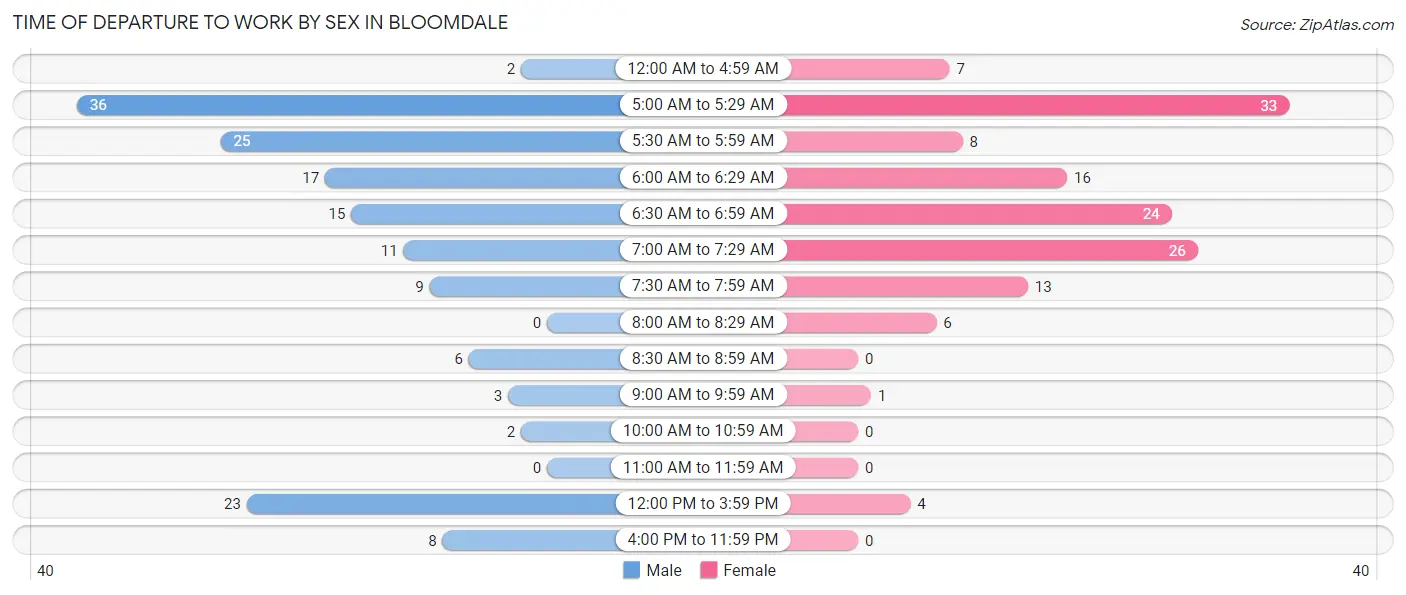
| Time of Departure | Male | Female |
| 12:00 AM to 4:59 AM | 2 (1.3%) | 7 (5.1%) |
| 5:00 AM to 5:29 AM | 36 (22.9%) | 33 (23.9%) |
| 5:30 AM to 5:59 AM | 25 (15.9%) | 8 (5.8%) |
| 6:00 AM to 6:29 AM | 17 (10.8%) | 16 (11.6%) |
| 6:30 AM to 6:59 AM | 15 (9.6%) | 24 (17.4%) |
| 7:00 AM to 7:29 AM | 11 (7.0%) | 26 (18.8%) |
| 7:30 AM to 7:59 AM | 9 (5.7%) | 13 (9.4%) |
| 8:00 AM to 8:29 AM | 0 (0.0%) | 6 (4.3%) |
| 8:30 AM to 8:59 AM | 6 (3.8%) | 0 (0.0%) |
| 9:00 AM to 9:59 AM | 3 (1.9%) | 1 (0.7%) |
| 10:00 AM to 10:59 AM | 2 (1.3%) | 0 (0.0%) |
| 11:00 AM to 11:59 AM | 0 (0.0%) | 0 (0.0%) |
| 12:00 PM to 3:59 PM | 23 (14.6%) | 4 (2.9%) |
| 4:00 PM to 11:59 PM | 8 (5.1%) | 0 (0.0%) |
| Total | 157 (100.0%) | 138 (100.0%) |
Housing Occupancy in Bloomdale
Occupancy by Ownership in Bloomdale
Of the total 272 dwellings in Bloomdale, owner-occupied units account for 201 (73.9%), while renter-occupied units make up 71 (26.1%).
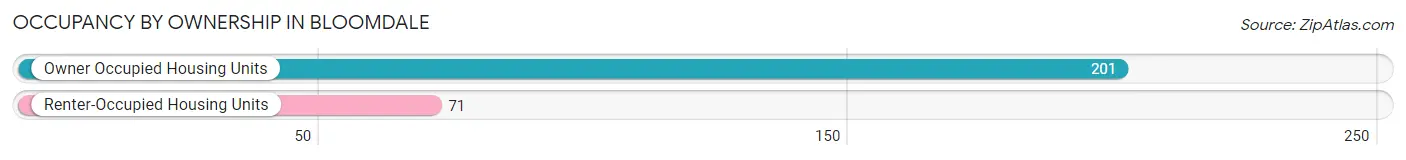
| Occupancy | # Housing Units | % Housing Units |
| Owner Occupied Housing Units | 201 | 73.9% |
| Renter-Occupied Housing Units | 71 | 26.1% |
| Total Occupied Housing Units | 272 | 100.0% |
Occupancy by Household Size in Bloomdale
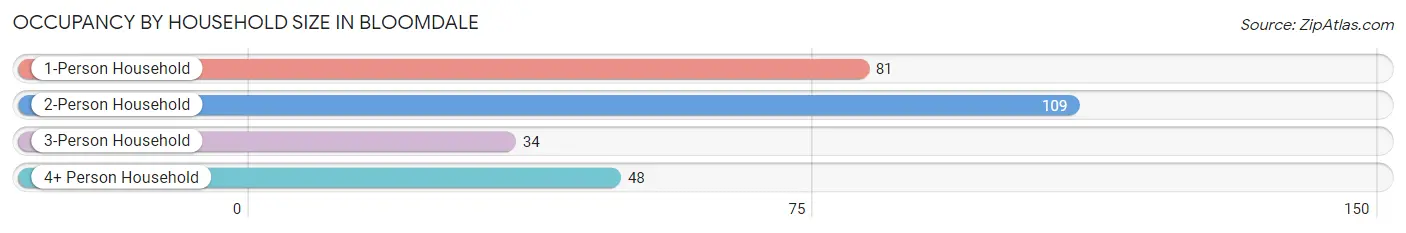
| Household Size | # Housing Units | % Housing Units |
| 1-Person Household | 81 | 29.8% |
| 2-Person Household | 109 | 40.1% |
| 3-Person Household | 34 | 12.5% |
| 4+ Person Household | 48 | 17.6% |
| Total Housing Units | 272 | 100.0% |
Occupancy by Ownership by Household Size in Bloomdale
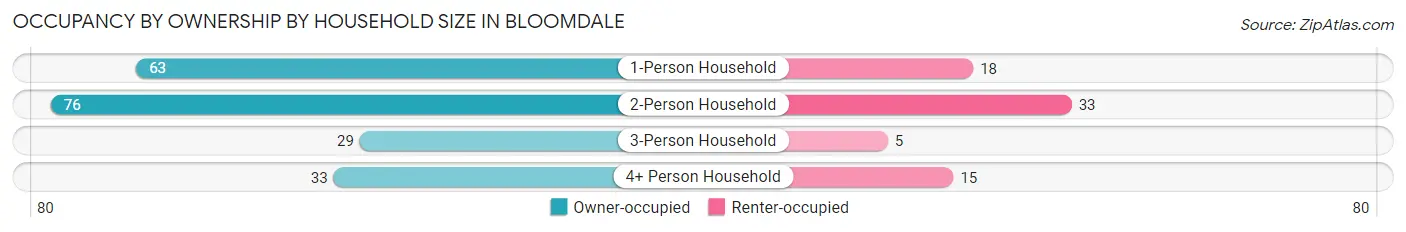
| Household Size | Owner-occupied | Renter-occupied |
| 1-Person Household | 63 (77.8%) | 18 (22.2%) |
| 2-Person Household | 76 (69.7%) | 33 (30.3%) |
| 3-Person Household | 29 (85.3%) | 5 (14.7%) |
| 4+ Person Household | 33 (68.8%) | 15 (31.2%) |
| Total Housing Units | 201 (73.9%) | 71 (26.1%) |
Occupancy by Educational Attainment in Bloomdale
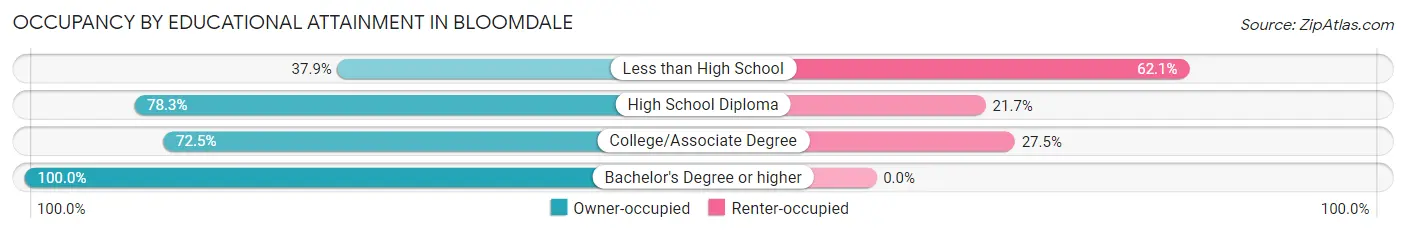
| Household Size | Owner-occupied | Renter-occupied |
| Less than High School | 11 (37.9%) | 18 (62.1%) |
| High School Diploma | 101 (78.3%) | 28 (21.7%) |
| College/Associate Degree | 66 (72.5%) | 25 (27.5%) |
| Bachelor's Degree or higher | 23 (100.0%) | 0 (0.0%) |
Occupancy by Age of Householder in Bloomdale
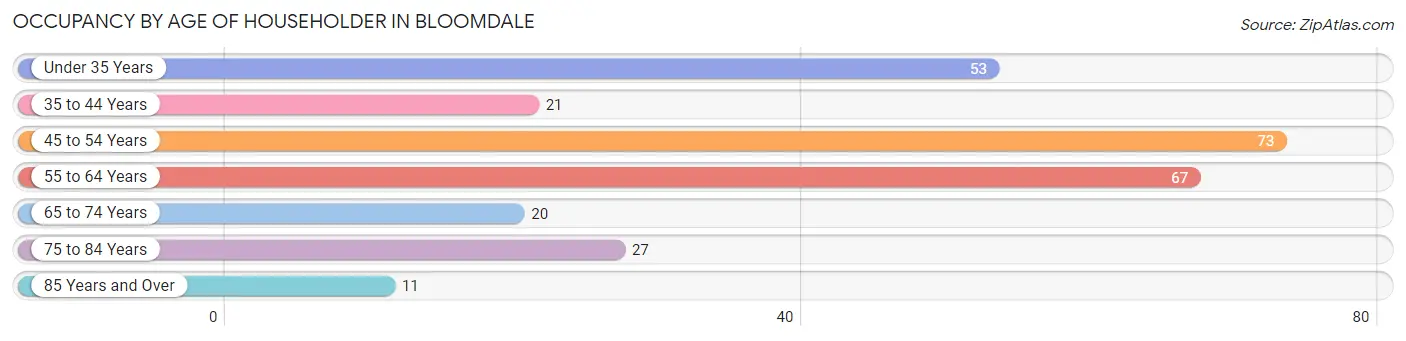
| Age Bracket | # Households | % Households |
| Under 35 Years | 53 | 19.5% |
| 35 to 44 Years | 21 | 7.7% |
| 45 to 54 Years | 73 | 26.8% |
| 55 to 64 Years | 67 | 24.6% |
| 65 to 74 Years | 20 | 7.3% |
| 75 to 84 Years | 27 | 9.9% |
| 85 Years and Over | 11 | 4.0% |
| Total | 272 | 100.0% |
Housing Finances in Bloomdale
Median Income by Occupancy in Bloomdale
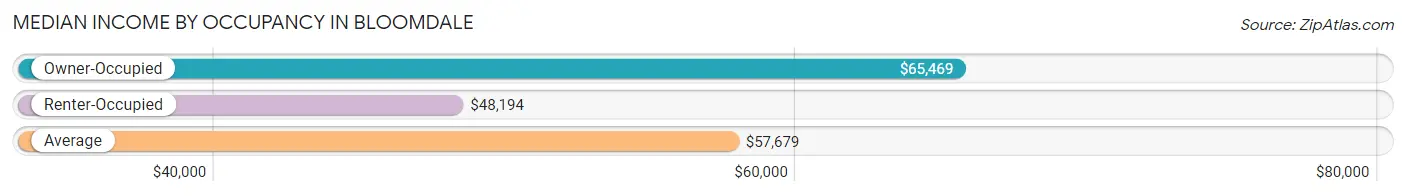
| Occupancy Type | # Households | Median Income |
| Owner-Occupied | 201 (73.9%) | $65,469 |
| Renter-Occupied | 71 (26.1%) | $48,194 |
| Average | 272 (100.0%) | $57,679 |
Occupancy by Householder Income Bracket in Bloomdale
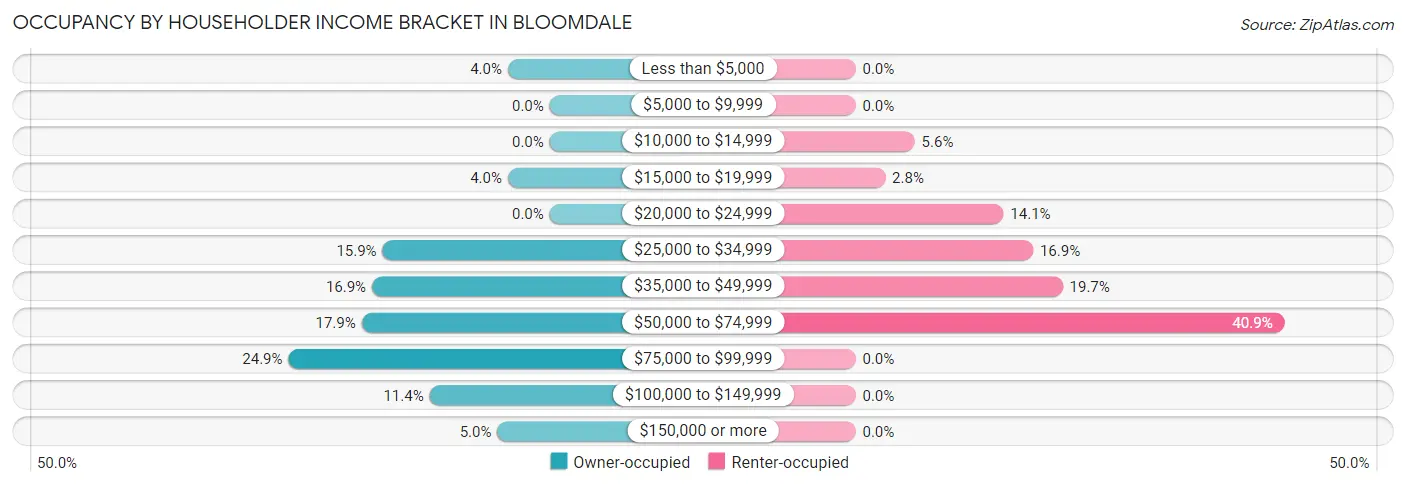
| Income Bracket | Owner-occupied | Renter-occupied |
| Less than $5,000 | 8 (4.0%) | 0 (0.0%) |
| $5,000 to $9,999 | 0 (0.0%) | 0 (0.0%) |
| $10,000 to $14,999 | 0 (0.0%) | 4 (5.6%) |
| $15,000 to $19,999 | 8 (4.0%) | 2 (2.8%) |
| $20,000 to $24,999 | 0 (0.0%) | 10 (14.1%) |
| $25,000 to $34,999 | 32 (15.9%) | 12 (16.9%) |
| $35,000 to $49,999 | 34 (16.9%) | 14 (19.7%) |
| $50,000 to $74,999 | 36 (17.9%) | 29 (40.8%) |
| $75,000 to $99,999 | 50 (24.9%) | 0 (0.0%) |
| $100,000 to $149,999 | 23 (11.4%) | 0 (0.0%) |
| $150,000 or more | 10 (5.0%) | 0 (0.0%) |
| Total | 201 (100.0%) | 71 (100.0%) |
Monthly Housing Cost Tiers in Bloomdale
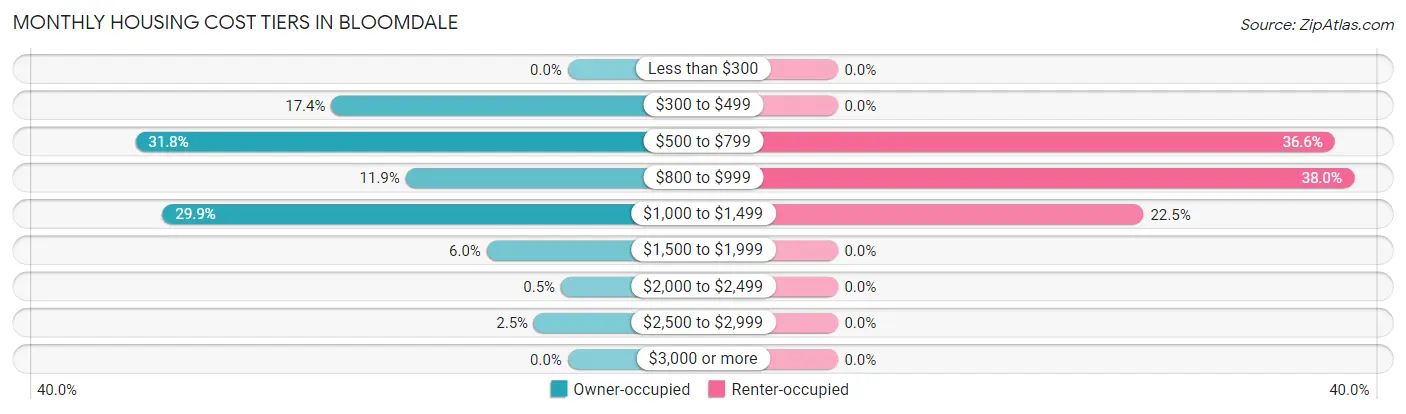
| Monthly Cost | Owner-occupied | Renter-occupied |
| Less than $300 | 0 (0.0%) | 0 (0.0%) |
| $300 to $499 | 35 (17.4%) | 0 (0.0%) |
| $500 to $799 | 64 (31.8%) | 26 (36.6%) |
| $800 to $999 | 24 (11.9%) | 27 (38.0%) |
| $1,000 to $1,499 | 60 (29.8%) | 16 (22.5%) |
| $1,500 to $1,999 | 12 (6.0%) | 0 (0.0%) |
| $2,000 to $2,499 | 1 (0.5%) | 0 (0.0%) |
| $2,500 to $2,999 | 5 (2.5%) | 0 (0.0%) |
| $3,000 or more | 0 (0.0%) | 0 (0.0%) |
| Total | 201 (100.0%) | 71 (100.0%) |
Physical Housing Characteristics in Bloomdale
Housing Structures in Bloomdale
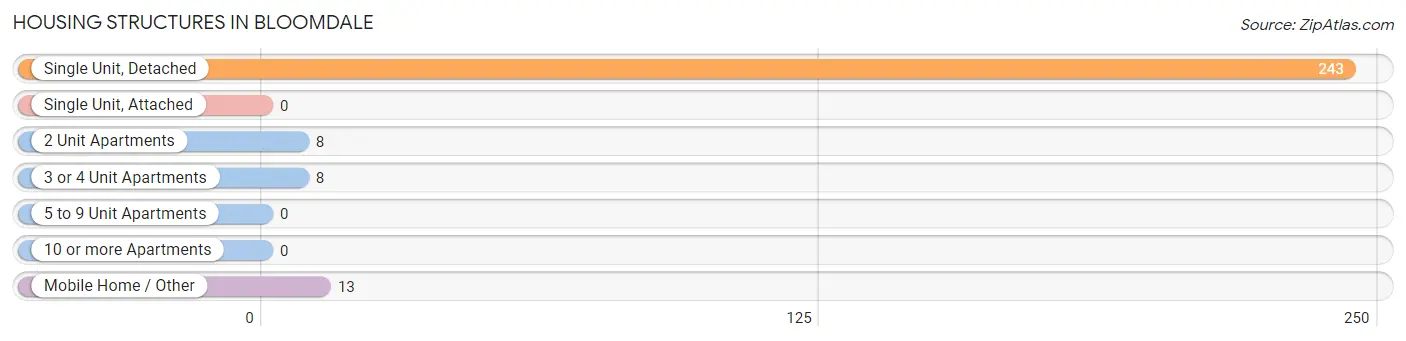
| Structure Type | # Housing Units | % Housing Units |
| Single Unit, Detached | 243 | 89.3% |
| Single Unit, Attached | 0 | 0.0% |
| 2 Unit Apartments | 8 | 2.9% |
| 3 or 4 Unit Apartments | 8 | 2.9% |
| 5 to 9 Unit Apartments | 0 | 0.0% |
| 10 or more Apartments | 0 | 0.0% |
| Mobile Home / Other | 13 | 4.8% |
| Total | 272 | 100.0% |
Housing Structures by Occupancy in Bloomdale
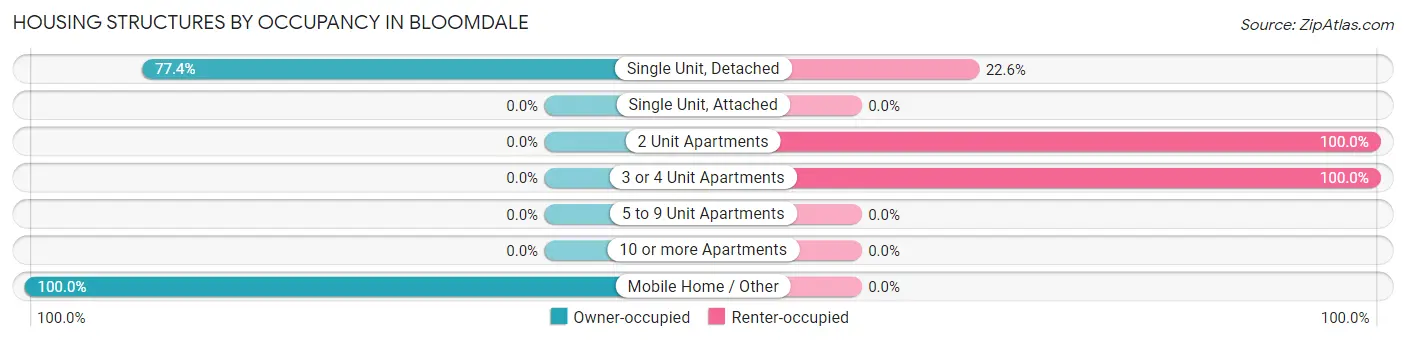
| Structure Type | Owner-occupied | Renter-occupied |
| Single Unit, Detached | 188 (77.4%) | 55 (22.6%) |
| Single Unit, Attached | 0 (0.0%) | 0 (0.0%) |
| 2 Unit Apartments | 0 (0.0%) | 8 (100.0%) |
| 3 or 4 Unit Apartments | 0 (0.0%) | 8 (100.0%) |
| 5 to 9 Unit Apartments | 0 (0.0%) | 0 (0.0%) |
| 10 or more Apartments | 0 (0.0%) | 0 (0.0%) |
| Mobile Home / Other | 13 (100.0%) | 0 (0.0%) |
| Total | 201 (73.9%) | 71 (26.1%) |
Housing Structures by Number of Rooms in Bloomdale
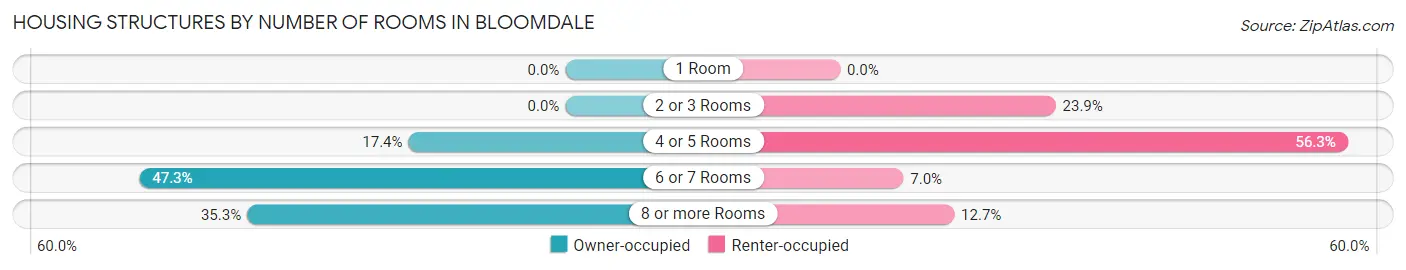
| Number of Rooms | Owner-occupied | Renter-occupied |
| 1 Room | 0 (0.0%) | 0 (0.0%) |
| 2 or 3 Rooms | 0 (0.0%) | 17 (23.9%) |
| 4 or 5 Rooms | 35 (17.4%) | 40 (56.3%) |
| 6 or 7 Rooms | 95 (47.3%) | 5 (7.0%) |
| 8 or more Rooms | 71 (35.3%) | 9 (12.7%) |
| Total | 201 (100.0%) | 71 (100.0%) |
Housing Structure by Heating Type in Bloomdale
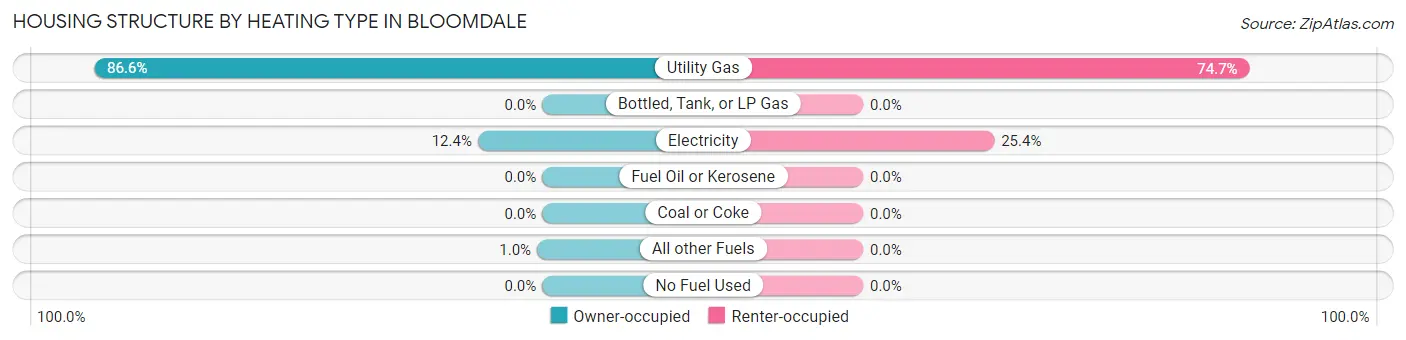
| Heating Type | Owner-occupied | Renter-occupied |
| Utility Gas | 174 (86.6%) | 53 (74.7%) |
| Bottled, Tank, or LP Gas | 0 (0.0%) | 0 (0.0%) |
| Electricity | 25 (12.4%) | 18 (25.4%) |
| Fuel Oil or Kerosene | 0 (0.0%) | 0 (0.0%) |
| Coal or Coke | 0 (0.0%) | 0 (0.0%) |
| All other Fuels | 2 (1.0%) | 0 (0.0%) |
| No Fuel Used | 0 (0.0%) | 0 (0.0%) |
| Total | 201 (100.0%) | 71 (100.0%) |
Household Vehicle Usage in Bloomdale
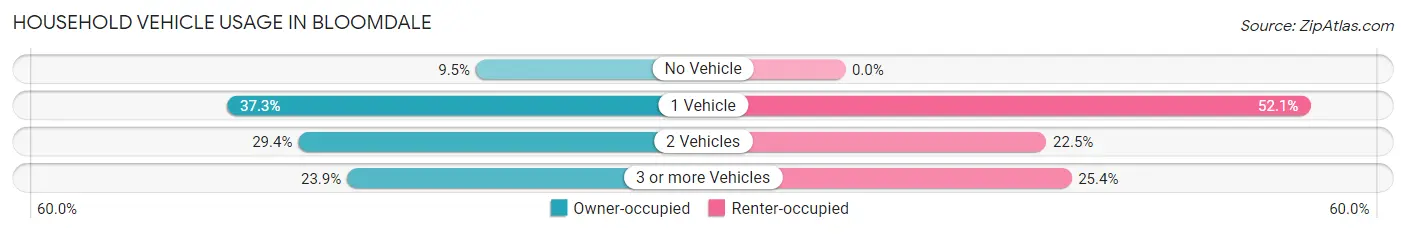
| Vehicles per Household | Owner-occupied | Renter-occupied |
| No Vehicle | 19 (9.5%) | 0 (0.0%) |
| 1 Vehicle | 75 (37.3%) | 37 (52.1%) |
| 2 Vehicles | 59 (29.3%) | 16 (22.5%) |
| 3 or more Vehicles | 48 (23.9%) | 18 (25.4%) |
| Total | 201 (100.0%) | 71 (100.0%) |
Real Estate & Mortgages in Bloomdale
Real Estate and Mortgage Overview in Bloomdale
| Characteristic | Without Mortgage | With Mortgage |
| Housing Units | 62 | 139 |
| Median Property Value | $112,500 | $108,100 |
| Median Household Income | $57,500 | $8 |
| Monthly Housing Costs | $491 | $0 |
| Real Estate Taxes | $1,161 | $0 |
Property Value by Mortgage Status in Bloomdale
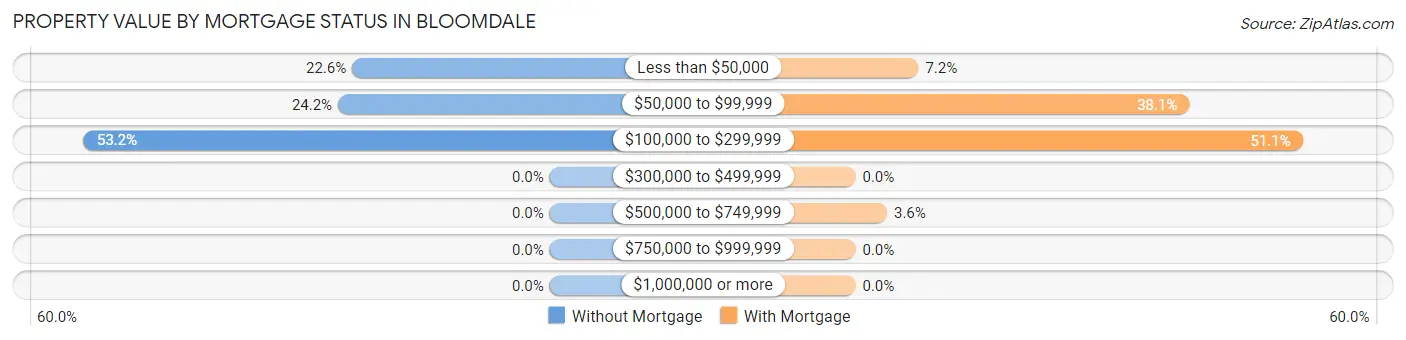
| Property Value | Without Mortgage | With Mortgage |
| Less than $50,000 | 14 (22.6%) | 10 (7.2%) |
| $50,000 to $99,999 | 15 (24.2%) | 53 (38.1%) |
| $100,000 to $299,999 | 33 (53.2%) | 71 (51.1%) |
| $300,000 to $499,999 | 0 (0.0%) | 0 (0.0%) |
| $500,000 to $749,999 | 0 (0.0%) | 5 (3.6%) |
| $750,000 to $999,999 | 0 (0.0%) | 0 (0.0%) |
| $1,000,000 or more | 0 (0.0%) | 0 (0.0%) |
| Total | 62 (100.0%) | 139 (100.0%) |
Household Income by Mortgage Status in Bloomdale
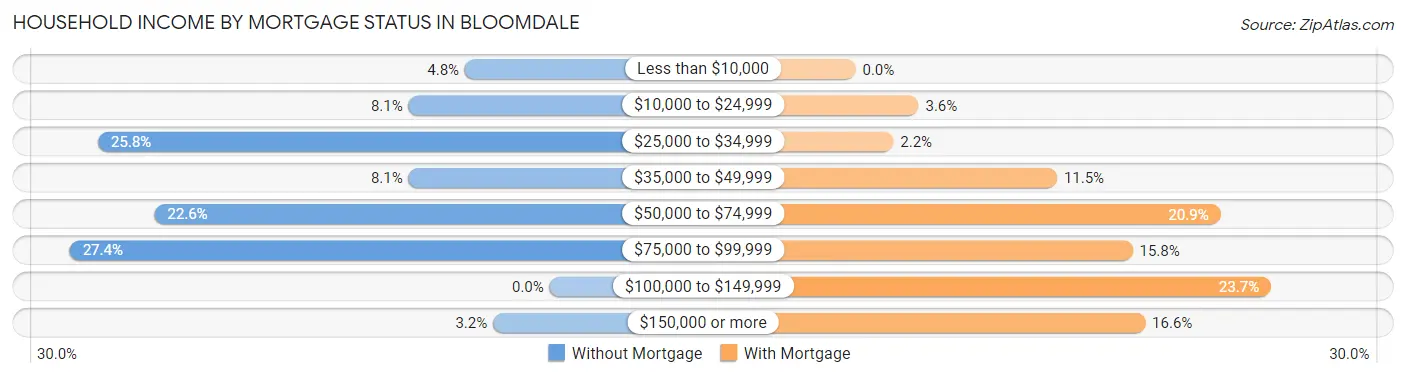
| Household Income | Without Mortgage | With Mortgage |
| Less than $10,000 | 3 (4.8%) | 0 (0.0%) |
| $10,000 to $24,999 | 5 (8.1%) | 5 (3.6%) |
| $25,000 to $34,999 | 16 (25.8%) | 3 (2.2%) |
| $35,000 to $49,999 | 5 (8.1%) | 16 (11.5%) |
| $50,000 to $74,999 | 14 (22.6%) | 29 (20.9%) |
| $75,000 to $99,999 | 17 (27.4%) | 22 (15.8%) |
| $100,000 to $149,999 | 0 (0.0%) | 33 (23.7%) |
| $150,000 or more | 2 (3.2%) | 23 (16.6%) |
| Total | 62 (100.0%) | 139 (100.0%) |
Property Value to Household Income Ratio in Bloomdale
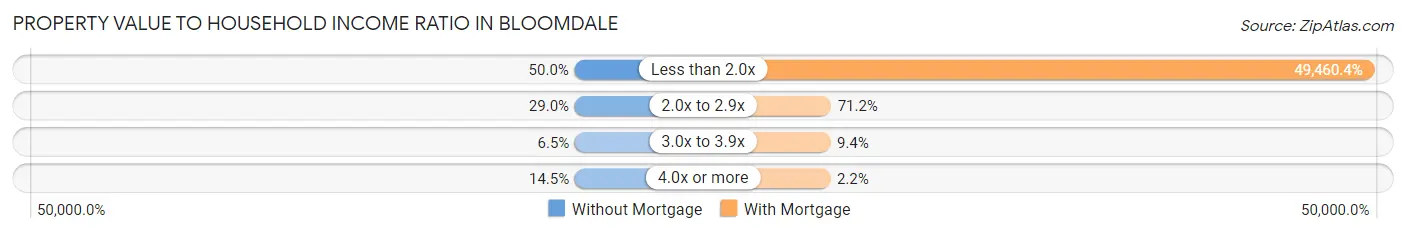
| Value-to-Income Ratio | Without Mortgage | With Mortgage |
| Less than 2.0x | 31 (50.0%) | 68,750 (49,460.4%) |
| 2.0x to 2.9x | 18 (29.0%) | 99 (71.2%) |
| 3.0x to 3.9x | 4 (6.5%) | 13 (9.3%) |
| 4.0x or more | 9 (14.5%) | 3 (2.2%) |
| Total | 62 (100.0%) | 139 (100.0%) |
Real Estate Taxes by Mortgage Status in Bloomdale
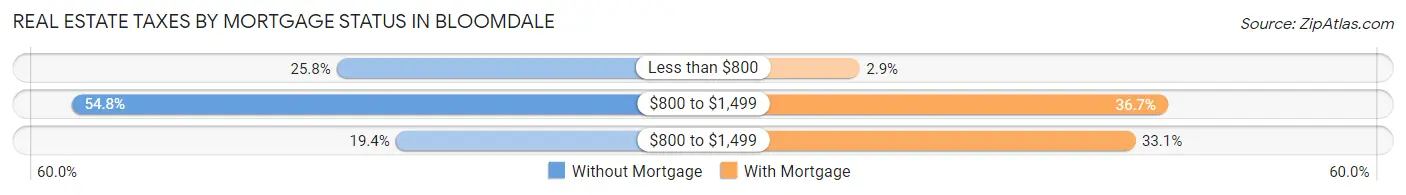
| Property Taxes | Without Mortgage | With Mortgage |
| Less than $800 | 16 (25.8%) | 4 (2.9%) |
| $800 to $1,499 | 34 (54.8%) | 51 (36.7%) |
| $800 to $1,499 | 12 (19.4%) | 46 (33.1%) |
| Total | 62 (100.0%) | 139 (100.0%) |
Health & Disability in Bloomdale
Health Insurance Coverage by Age in Bloomdale
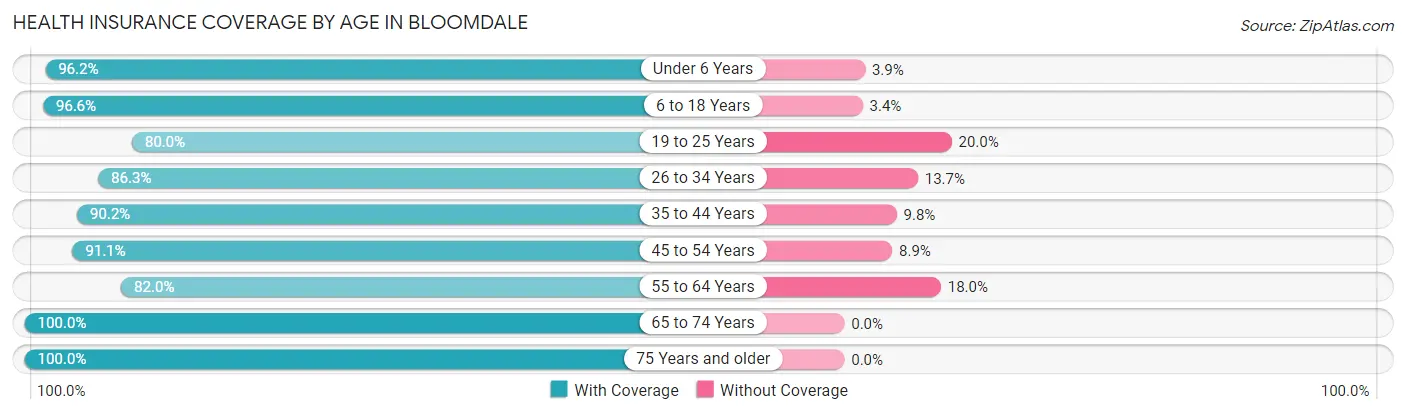
| Age Bracket | With Coverage | Without Coverage |
| Under 6 Years | 50 (96.2%) | 2 (3.8%) |
| 6 to 18 Years | 85 (96.6%) | 3 (3.4%) |
| 19 to 25 Years | 32 (80.0%) | 8 (20.0%) |
| 26 to 34 Years | 63 (86.3%) | 10 (13.7%) |
| 35 to 44 Years | 74 (90.2%) | 8 (9.8%) |
| 45 to 54 Years | 92 (91.1%) | 9 (8.9%) |
| 55 to 64 Years | 82 (82.0%) | 18 (18.0%) |
| 65 to 74 Years | 34 (100.0%) | 0 (0.0%) |
| 75 Years and older | 56 (100.0%) | 0 (0.0%) |
| Total | 568 (90.7%) | 58 (9.3%) |
Health Insurance Coverage by Citizenship Status in Bloomdale
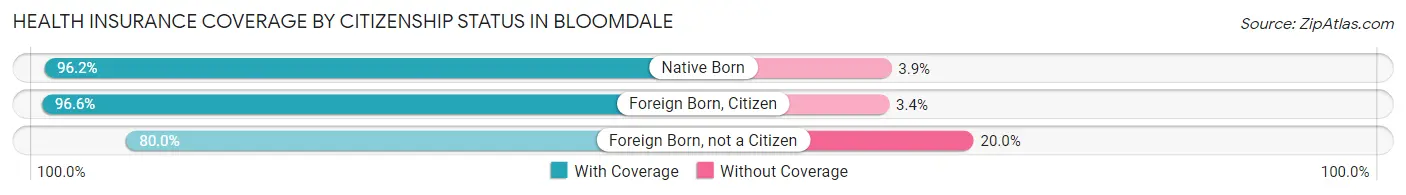
| Citizenship Status | With Coverage | Without Coverage |
| Native Born | 50 (96.2%) | 2 (3.8%) |
| Foreign Born, Citizen | 85 (96.6%) | 3 (3.4%) |
| Foreign Born, not a Citizen | 32 (80.0%) | 8 (20.0%) |
Health Insurance Coverage by Household Income in Bloomdale
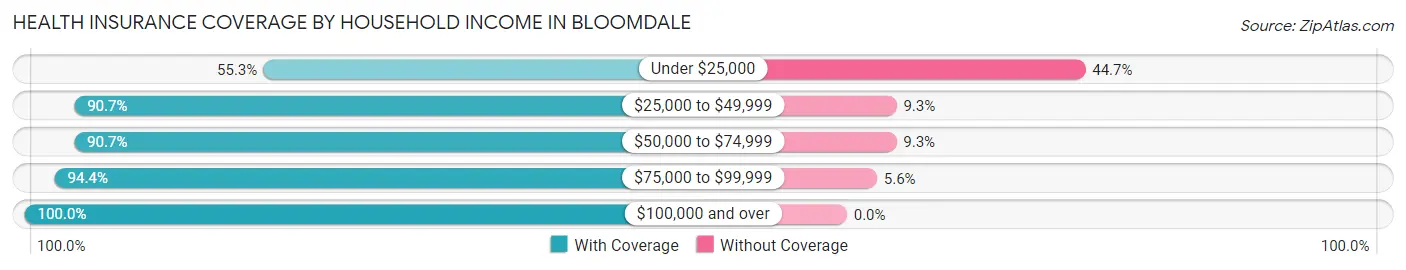
| Household Income | With Coverage | Without Coverage |
| Under $25,000 | 26 (55.3%) | 21 (44.7%) |
| $25,000 to $49,999 | 156 (90.7%) | 16 (9.3%) |
| $50,000 to $74,999 | 127 (90.7%) | 13 (9.3%) |
| $75,000 to $99,999 | 134 (94.4%) | 8 (5.6%) |
| $100,000 and over | 125 (100.0%) | 0 (0.0%) |
Public vs Private Health Insurance Coverage by Age in Bloomdale
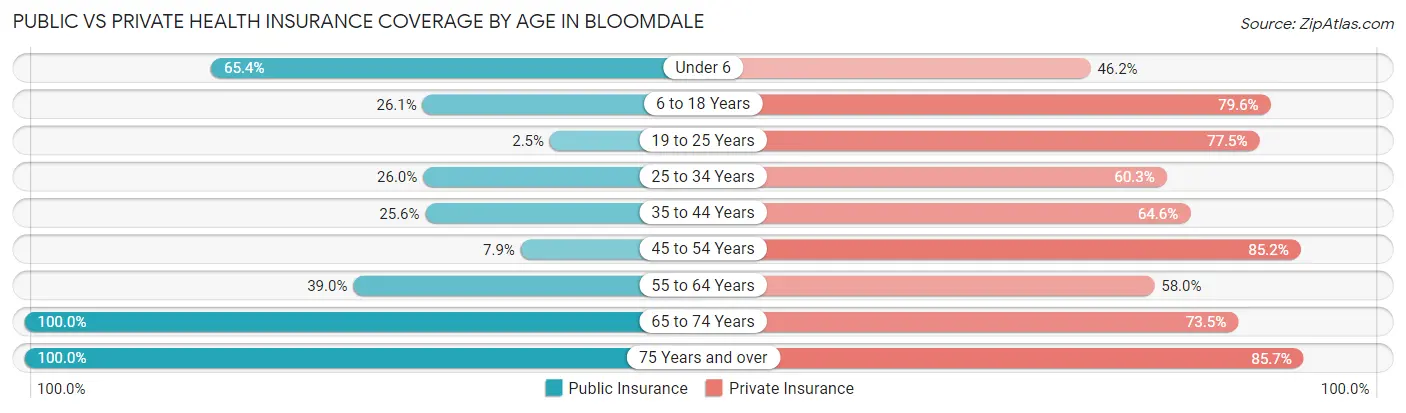
| Age Bracket | Public Insurance | Private Insurance |
| Under 6 | 34 (65.4%) | 24 (46.2%) |
| 6 to 18 Years | 23 (26.1%) | 70 (79.5%) |
| 19 to 25 Years | 1 (2.5%) | 31 (77.5%) |
| 25 to 34 Years | 19 (26.0%) | 44 (60.3%) |
| 35 to 44 Years | 21 (25.6%) | 53 (64.6%) |
| 45 to 54 Years | 8 (7.9%) | 86 (85.2%) |
| 55 to 64 Years | 39 (39.0%) | 58 (58.0%) |
| 65 to 74 Years | 34 (100.0%) | 25 (73.5%) |
| 75 Years and over | 56 (100.0%) | 48 (85.7%) |
| Total | 235 (37.5%) | 439 (70.1%) |
Disability Status by Sex by Age in Bloomdale
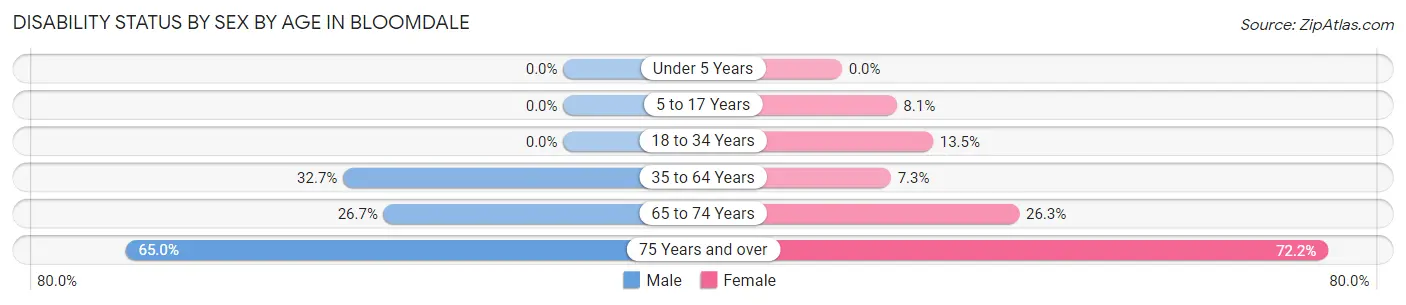
| Age Bracket | Male | Female |
| Under 5 Years | 0 (0.0%) | 0 (0.0%) |
| 5 to 17 Years | 0 (0.0%) | 3 (8.1%) |
| 18 to 34 Years | 0 (0.0%) | 10 (13.5%) |
| 35 to 64 Years | 52 (32.7%) | 9 (7.3%) |
| 65 to 74 Years | 4 (26.7%) | 5 (26.3%) |
| 75 Years and over | 13 (65.0%) | 26 (72.2%) |
Disability Class by Sex by Age in Bloomdale
Disability Class: Hearing Difficulty
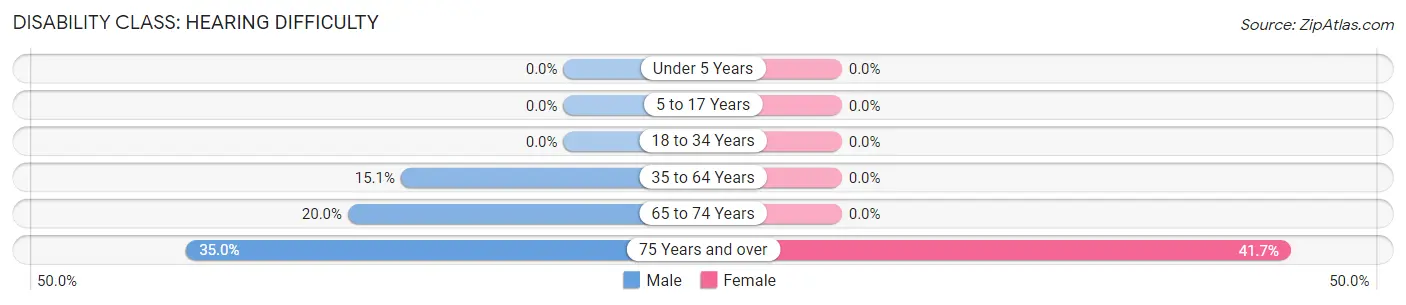
| Age Bracket | Male | Female |
| Under 5 Years | 0 (0.0%) | 0 (0.0%) |
| 5 to 17 Years | 0 (0.0%) | 0 (0.0%) |
| 18 to 34 Years | 0 (0.0%) | 0 (0.0%) |
| 35 to 64 Years | 24 (15.1%) | 0 (0.0%) |
| 65 to 74 Years | 3 (20.0%) | 0 (0.0%) |
| 75 Years and over | 7 (35.0%) | 15 (41.7%) |
Disability Class: Vision Difficulty
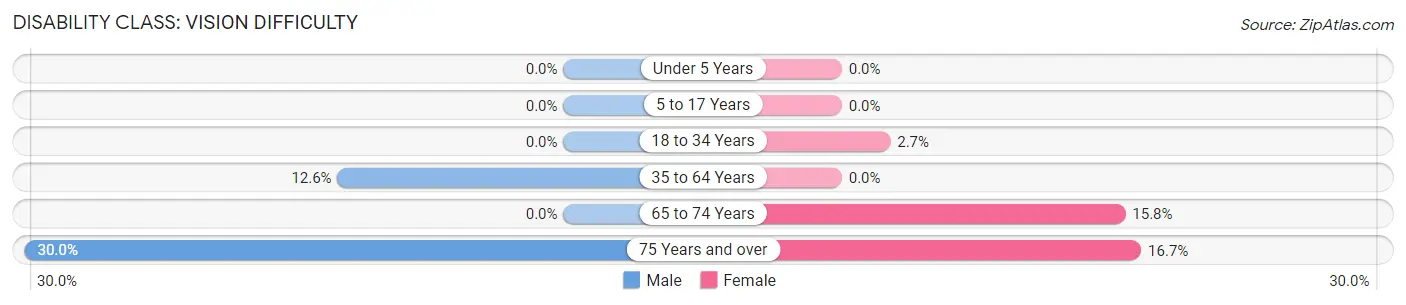
| Age Bracket | Male | Female |
| Under 5 Years | 0 (0.0%) | 0 (0.0%) |
| 5 to 17 Years | 0 (0.0%) | 0 (0.0%) |
| 18 to 34 Years | 0 (0.0%) | 2 (2.7%) |
| 35 to 64 Years | 20 (12.6%) | 0 (0.0%) |
| 65 to 74 Years | 0 (0.0%) | 3 (15.8%) |
| 75 Years and over | 6 (30.0%) | 6 (16.7%) |
Disability Class: Cognitive Difficulty
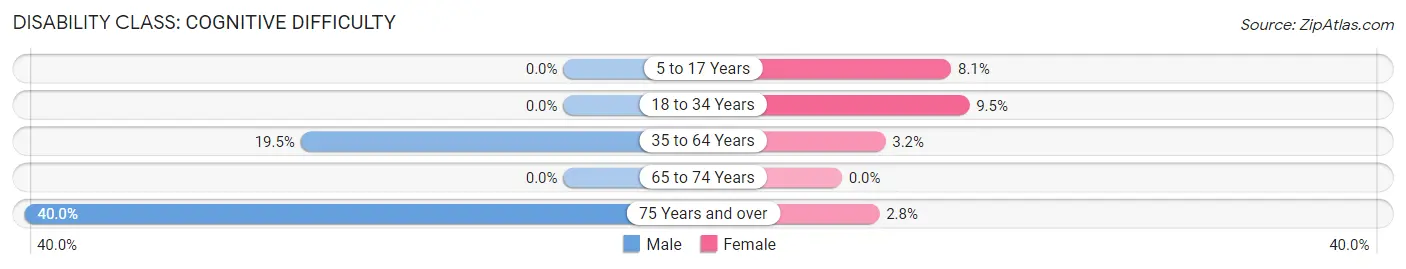
| Age Bracket | Male | Female |
| 5 to 17 Years | 0 (0.0%) | 3 (8.1%) |
| 18 to 34 Years | 0 (0.0%) | 7 (9.5%) |
| 35 to 64 Years | 31 (19.5%) | 4 (3.2%) |
| 65 to 74 Years | 0 (0.0%) | 0 (0.0%) |
| 75 Years and over | 8 (40.0%) | 1 (2.8%) |
Disability Class: Ambulatory Difficulty
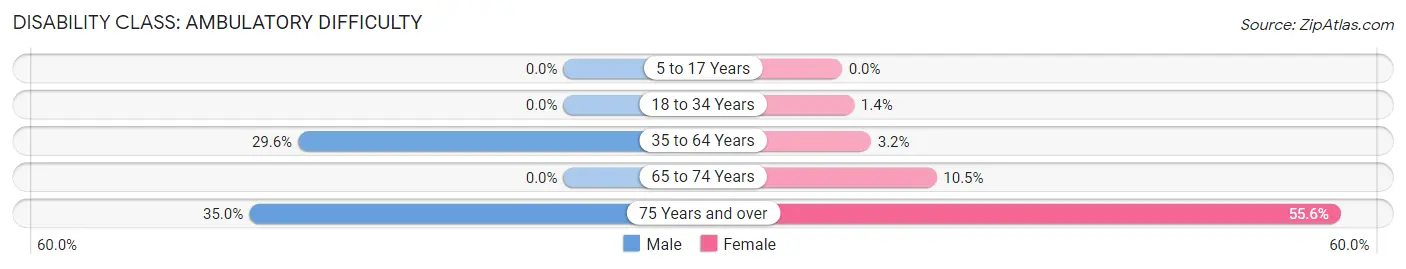
| Age Bracket | Male | Female |
| 5 to 17 Years | 0 (0.0%) | 0 (0.0%) |
| 18 to 34 Years | 0 (0.0%) | 1 (1.3%) |
| 35 to 64 Years | 47 (29.6%) | 4 (3.2%) |
| 65 to 74 Years | 0 (0.0%) | 2 (10.5%) |
| 75 Years and over | 7 (35.0%) | 20 (55.6%) |
Disability Class: Self-Care Difficulty
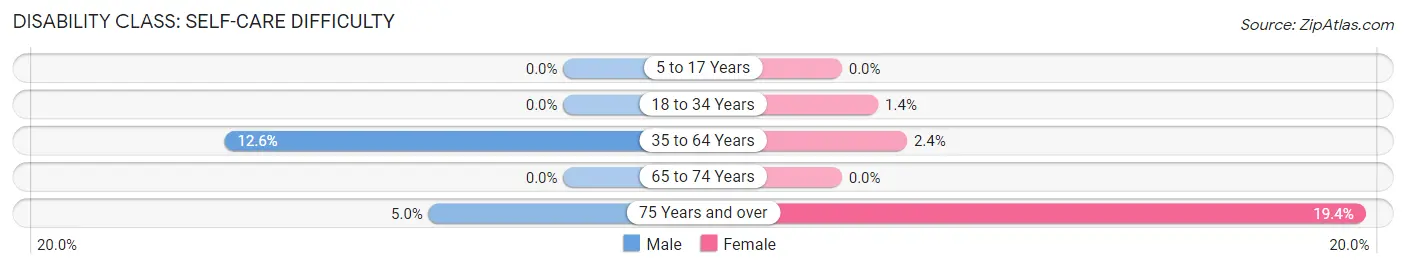
| Age Bracket | Male | Female |
| 5 to 17 Years | 0 (0.0%) | 0 (0.0%) |
| 18 to 34 Years | 0 (0.0%) | 1 (1.3%) |
| 35 to 64 Years | 20 (12.6%) | 3 (2.4%) |
| 65 to 74 Years | 0 (0.0%) | 0 (0.0%) |
| 75 Years and over | 1 (5.0%) | 7 (19.4%) |
Technology Access in Bloomdale
Computing Device Access in Bloomdale
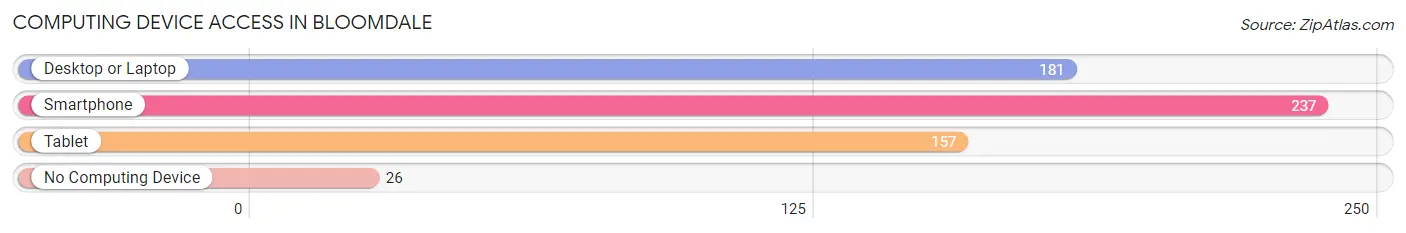
| Device Type | # Households | % Households |
| Desktop or Laptop | 181 | 66.5% |
| Smartphone | 237 | 87.1% |
| Tablet | 157 | 57.7% |
| No Computing Device | 26 | 9.6% |
| Total | 272 | 100.0% |
Internet Access in Bloomdale
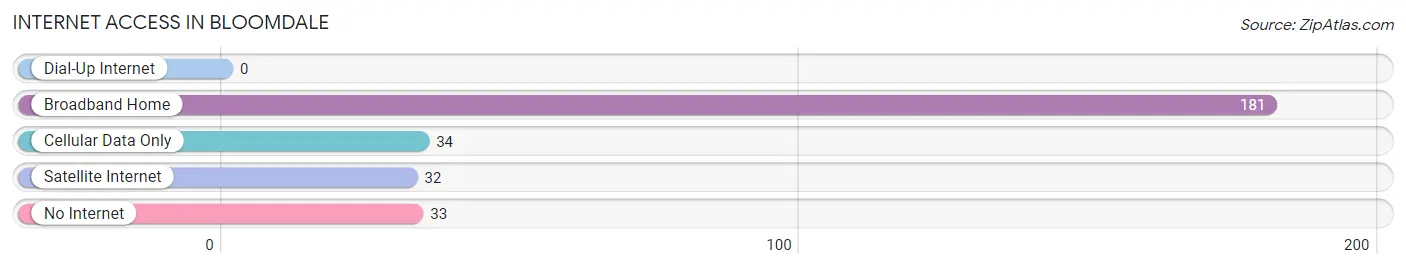
| Internet Type | # Households | % Households |
| Dial-Up Internet | 0 | 0.0% |
| Broadband Home | 181 | 66.5% |
| Cellular Data Only | 34 | 12.5% |
| Satellite Internet | 32 | 11.8% |
| No Internet | 33 | 12.1% |
| Total | 272 | 100.0% |
Bloomdale Summary
Bloomdale, Ohio is a small village located in Wood County, Ohio. It is situated in the northwest corner of the state, approximately 20 miles east of Toledo. The village has a population of approximately 1,000 people and covers an area of 0.6 square miles.
History
The area that is now Bloomdale was first settled in 1835 by a group of German immigrants. The village was originally known as “New Germany” and was later renamed Bloomdale in 1854. The name was chosen to honor the first settler, John Bloom, who had purchased the land from the government.
The village was incorporated in 1867 and the first mayor was elected in 1868. The village grew slowly over the years and by the early 1900s, it had a population of around 500 people.
The village was primarily an agricultural community until the 1950s when the economy began to shift towards manufacturing. The village was home to several factories, including a furniture factory, a canning factory, and a paper mill. These factories provided employment for many of the residents and helped to spur the growth of the village.
Geography
Bloomdale is located in the northwest corner of Wood County, Ohio. It is situated approximately 20 miles east of Toledo and is bordered by the villages of Weston, Rudolph, and Grand Rapids. The village is situated on the banks of the Portage River, which flows through the center of the village.
The village is located in a flat, open area of the state and is surrounded by farmland. The climate is generally mild, with hot summers and cold winters. The average annual temperature is around 50 degrees Fahrenheit.
Economy
The economy of Bloomdale is primarily based on agriculture and manufacturing. The village is home to several factories, including a furniture factory, a canning factory, and a paper mill. These factories provide employment for many of the residents and help to spur the growth of the village.
In addition to these factories, the village is also home to several small businesses, including restaurants, shops, and other services. The village also has a small airport, which serves as a hub for private and commercial flights.
Demographics
As of the 2010 census, the population of Bloomdale was 1,000 people. The racial makeup of the village was 97.2% White, 0.7% African American, 0.3% Native American, 0.2% Asian, and 1.6% from other races. The median household income was $41,250 and the median family income was $50,000.
The village is served by the Wood County School District, which includes two elementary schools, one middle school, and one high school. The village also has a public library and a post office.
Conclusion
Bloomdale, Ohio is a small village located in Wood County, Ohio. It is situated in the northwest corner of the state, approximately 20 miles east of Toledo. The village has a population of approximately 1,000 people and covers an area of 0.6 square miles. The economy of Bloomdale is primarily based on agriculture and manufacturing, and the village is served by the Wood County School District. Bloomdale is a small, rural village with a rich history and a bright future.
Common Questions
What is Per Capita Income in Bloomdale?
Per Capita income in Bloomdale is $27,187.
What is the Median Family Income in Bloomdale?
Median Family Income in Bloomdale is $64,583.
What is the Median Household income in Bloomdale?
Median Household Income in Bloomdale is $57,679.
What is Income or Wage Gap in Bloomdale?
Income or Wage Gap in Bloomdale is 13.1%.
Women in Bloomdale earn 86.9 cents for every dollar earned by a man.
What is Inequality or Gini Index in Bloomdale?
Inequality or Gini Index in Bloomdale is 0.34.
What is the Total Population of Bloomdale?
Total Population of Bloomdale is 626.
What is the Total Male Population of Bloomdale?
Total Male Population of Bloomdale is 293.
What is the Total Female Population of Bloomdale?
Total Female Population of Bloomdale is 333.
What is the Ratio of Males per 100 Females in Bloomdale?
There are 87.99 Males per 100 Females in Bloomdale.
What is the Ratio of Females per 100 Males in Bloomdale?
There are 113.65 Females per 100 Males in Bloomdale.
What is the Median Population Age in Bloomdale?
Median Population Age in Bloomdale is 43.3 Years.
What is the Average Family Size in Bloomdale
Average Family Size in Bloomdale is 2.8 People.
What is the Average Household Size in Bloomdale
Average Household Size in Bloomdale is 2.3 People.
How Large is the Labor Force in Bloomdale?
There are 307 People in the Labor Forcein in Bloomdale.
What is the Percentage of People in the Labor Force in Bloomdale?
60.1% of People are in the Labor Force in Bloomdale.
What is the Unemployment Rate in Bloomdale?
Unemployment Rate in Bloomdale is 2.0%.