Bellville, OH Map & Demographics
Bellville Map
Bellville Overview
$29,014
PER CAPITA INCOME
$74,583
AVG FAMILY INCOME
$54,259
AVG HOUSEHOLD INCOME
43.3%
WAGE / INCOME GAP [ % ]
56.7¢/ $1
WAGE / INCOME GAP [ $ ]
0.43
INEQUALITY / GINI INDEX
1,995
TOTAL POPULATION
958
MALE POPULATION
1,037
FEMALE POPULATION
92.38
MALES / 100 FEMALES
108.25
FEMALES / 100 MALES
38.3
MEDIAN AGE
3.0
AVG FAMILY SIZE
2.5
AVG HOUSEHOLD SIZE
971
LABOR FORCE [ PEOPLE ]
63.2%
PERCENT IN LABOR FORCE
2.0%
UNEMPLOYMENT RATE
Bellville Zip Codes
Income in Bellville
Income Overview in Bellville
Per Capita Income in Bellville is $29,014, while median incomes of families and households are $74,583 and $54,259 respectively.
| Characteristic | Number | Measure |
| Per Capita Income | 1,995 | $29,014 |
| Median Family Income | 546 | $74,583 |
| Mean Family Income | 546 | $86,782 |
| Median Household Income | 794 | $54,259 |
| Mean Household Income | 794 | $71,454 |
| Income Deficit | 546 | $0 |
| Wage / Income Gap (%) | 1,995 | 43.32% |
| Wage / Income Gap ($) | 1,995 | 56.68¢ per $1 |
| Gini / Inequality Index | 1,995 | 0.43 |
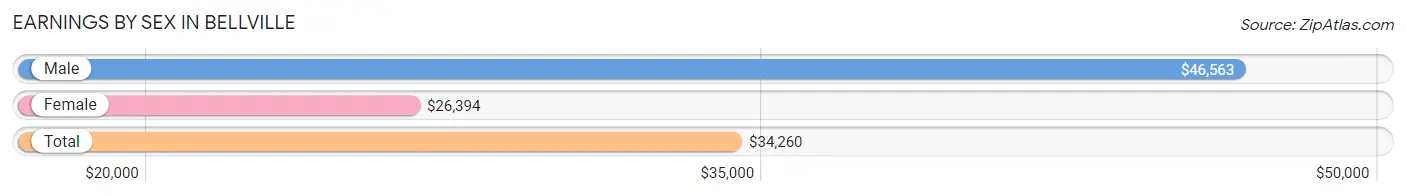
Earnings by Sex in Bellville
Average Earnings in Bellville are $34,260, $46,563 for men and $26,394 for women, a difference of 43.3%.
| Sex | Number | Average Earnings |
| Male | 519 (50.6%) | $46,563 |
| Female | 507 (49.4%) | $26,394 |
| Total | 1,026 (100.0%) | $34,260 |
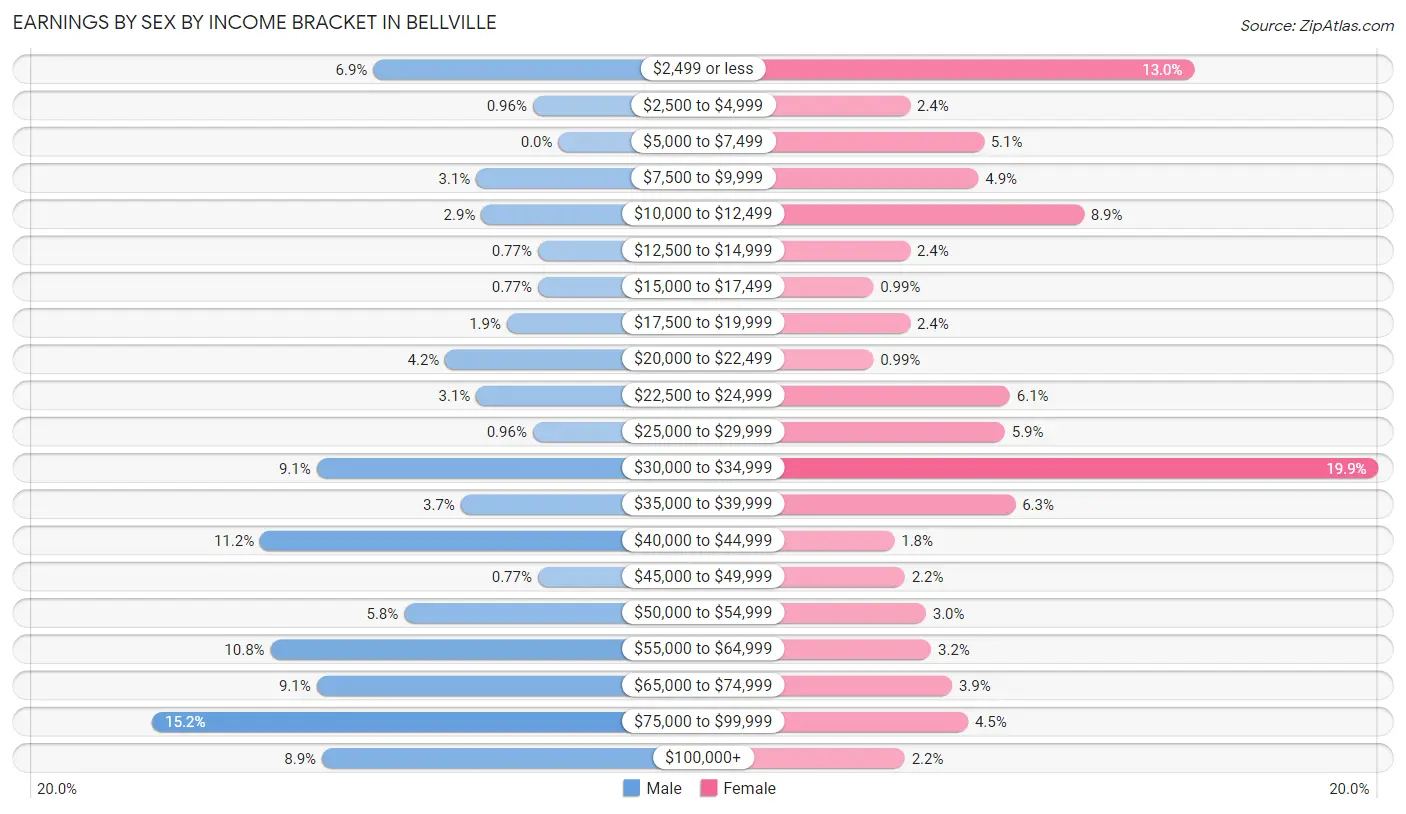
Earnings by Sex by Income Bracket in Bellville
The most common earnings brackets in Bellville are $75,000 to $99,999 for men (79 | 15.2%) and $30,000 to $34,999 for women (101 | 19.9%).
| Income | Male | Female |
| $2,499 or less | 36 (6.9%) | 66 (13.0%) |
| $2,500 to $4,999 | 5 (1.0%) | 12 (2.4%) |
| $5,000 to $7,499 | 0 (0.0%) | 26 (5.1%) |
| $7,500 to $9,999 | 16 (3.1%) | 25 (4.9%) |
| $10,000 to $12,499 | 15 (2.9%) | 45 (8.9%) |
| $12,500 to $14,999 | 4 (0.8%) | 12 (2.4%) |
| $15,000 to $17,499 | 4 (0.8%) | 5 (1.0%) |
| $17,500 to $19,999 | 10 (1.9%) | 12 (2.4%) |
| $20,000 to $22,499 | 22 (4.2%) | 5 (1.0%) |
| $22,500 to $24,999 | 16 (3.1%) | 31 (6.1%) |
| $25,000 to $29,999 | 5 (1.0%) | 30 (5.9%) |
| $30,000 to $34,999 | 47 (9.1%) | 101 (19.9%) |
| $35,000 to $39,999 | 19 (3.7%) | 32 (6.3%) |
| $40,000 to $44,999 | 58 (11.2%) | 9 (1.8%) |
| $45,000 to $49,999 | 4 (0.8%) | 11 (2.2%) |
| $50,000 to $54,999 | 30 (5.8%) | 15 (3.0%) |
| $55,000 to $64,999 | 56 (10.8%) | 16 (3.2%) |
| $65,000 to $74,999 | 47 (9.1%) | 20 (3.9%) |
| $75,000 to $99,999 | 79 (15.2%) | 23 (4.5%) |
| $100,000+ | 46 (8.9%) | 11 (2.2%) |
| Total | 519 (100.0%) | 507 (100.0%) |
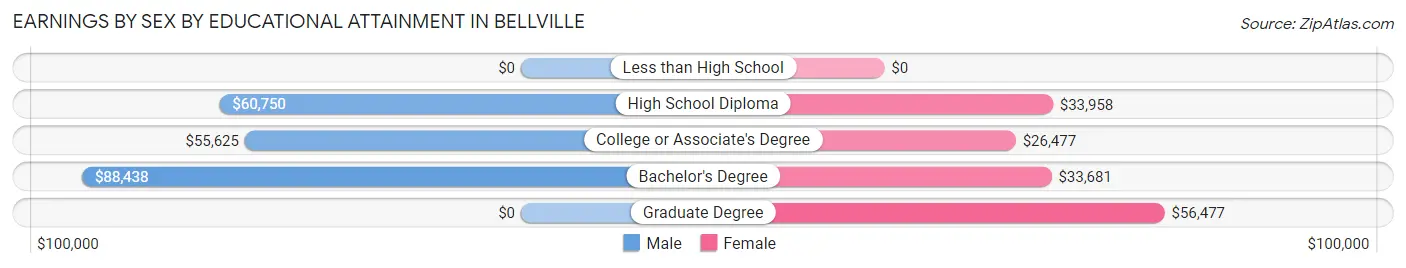
Earnings by Sex by Educational Attainment in Bellville
Average earnings in Bellville are $59,000 for men and $32,337 for women, a difference of 45.2%. Men with an educational attainment of bachelor's degree enjoy the highest average annual earnings of $88,438, while those with college or associate's degree education earn the least with $55,625. Women with an educational attainment of graduate degree earn the most with the average annual earnings of $56,477, while those with college or associate's degree education have the smallest earnings of $26,477.
| Educational Attainment | Male Income | Female Income |
| Less than High School | - | - |
| High School Diploma | $60,750 | $33,958 |
| College or Associate's Degree | $55,625 | $26,477 |
| Bachelor's Degree | $88,438 | $33,681 |
| Graduate Degree | - | - |
| Total | $59,000 | $32,337 |
Family Income in Bellville
Family Income Brackets in Bellville
According to the Bellville family income data, there are 113 families falling into the $50,000 to $74,999 income range, which is the most common income bracket and makes up 20.7% of all families. Conversely, the less than $10,000 income bracket is the least frequent group with only 5 families (0.9%) belonging to this category.
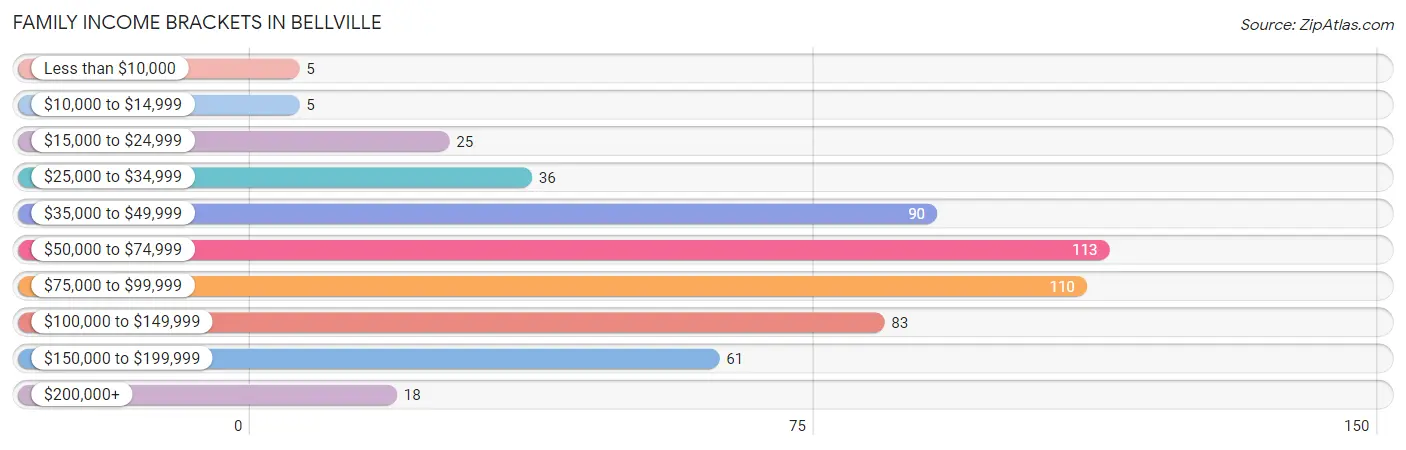
| Income Bracket | # Families | % Families |
| Less than $10,000 | 5 | 0.9% |
| $10,000 to $14,999 | 5 | 0.9% |
| $15,000 to $24,999 | 25 | 4.6% |
| $25,000 to $34,999 | 36 | 6.6% |
| $35,000 to $49,999 | 90 | 16.5% |
| $50,000 to $74,999 | 113 | 20.7% |
| $75,000 to $99,999 | 110 | 20.1% |
| $100,000 to $149,999 | 83 | 15.2% |
| $150,000 to $199,999 | 61 | 11.2% |
| $200,000+ | 18 | 3.3% |
Family Income by Famaliy Size in Bellville
5-person families (46 | 8.4%) account for the highest median family income in Bellville with $140,357 per family, while 2-person families (286 | 52.4%) have the highest median income of $30,625 per family member.
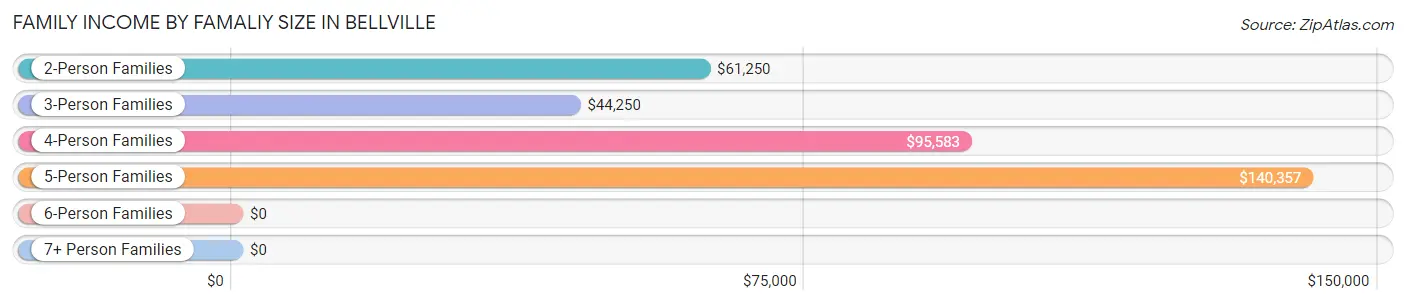
| Income Bracket | # Families | Median Income |
| 2-Person Families | 286 (52.4%) | $61,250 |
| 3-Person Families | 71 (13.0%) | $44,250 |
| 4-Person Families | 139 (25.5%) | $95,583 |
| 5-Person Families | 46 (8.4%) | $140,357 |
| 6-Person Families | 4 (0.7%) | $0 |
| 7+ Person Families | 0 (0.0%) | $0 |
| Total | 546 (100.0%) | $74,583 |
Family Income by Number of Earners in Bellville
The median family income in Bellville is $74,583, with families comprising 3+ earners (60) having the highest median family income of $185,500, while families with no earners (115) have the lowest median family income of $45,536, accounting for 11.0% and 21.1% of families, respectively.
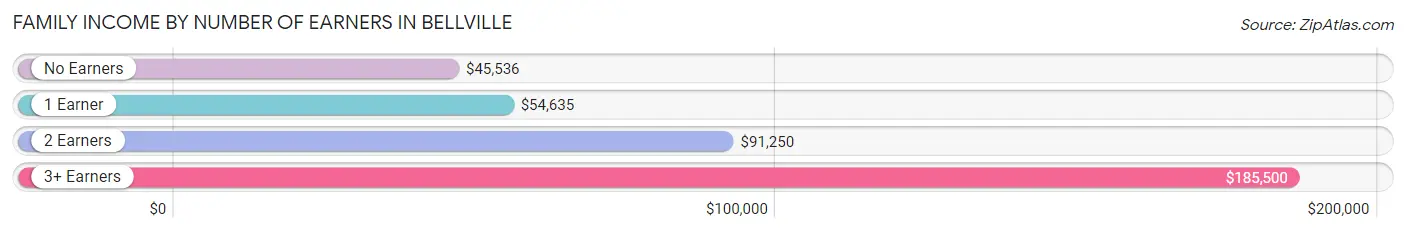
| Number of Earners | # Families | Median Income |
| No Earners | 115 (21.1%) | $45,536 |
| 1 Earner | 149 (27.3%) | $54,635 |
| 2 Earners | 222 (40.7%) | $91,250 |
| 3+ Earners | 60 (11.0%) | $185,500 |
| Total | 546 (100.0%) | $74,583 |
Household Income in Bellville
Household Income Brackets in Bellville
With 148 households falling in the category, the $35,000 to $49,999 income range is the most frequent in Bellville, accounting for 18.6% of all households. In contrast, only 28 households (3.5%) fall into the $200,000+ income bracket, making it the least populous group.
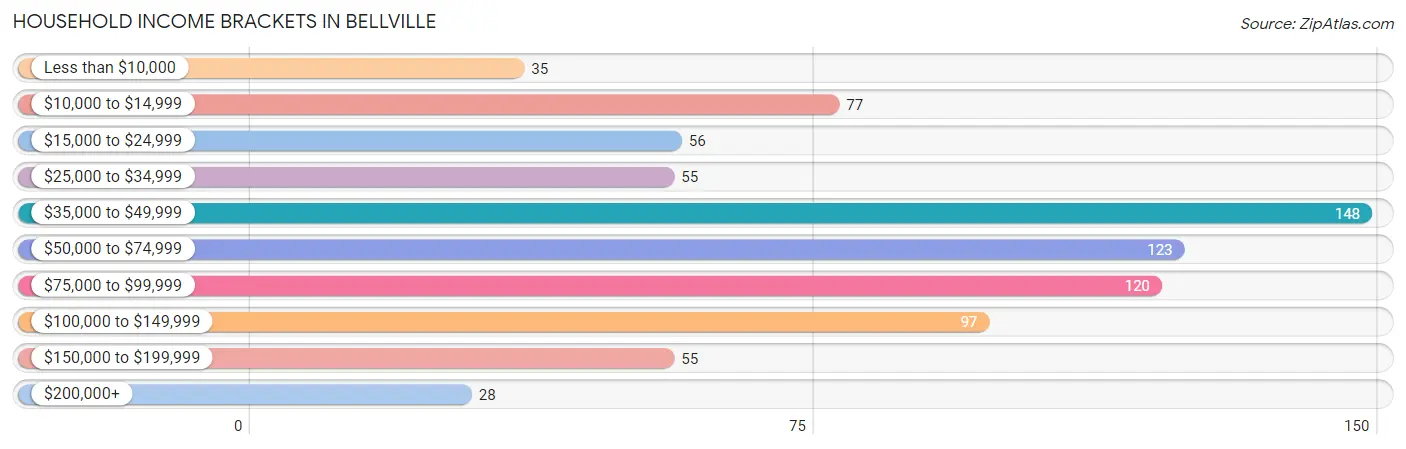
| Income Bracket | # Households | % Households |
| Less than $10,000 | 35 | 4.4% |
| $10,000 to $14,999 | 77 | 9.7% |
| $15,000 to $24,999 | 56 | 7.1% |
| $25,000 to $34,999 | 55 | 6.9% |
| $35,000 to $49,999 | 148 | 18.6% |
| $50,000 to $74,999 | 123 | 15.5% |
| $75,000 to $99,999 | 120 | 15.1% |
| $100,000 to $149,999 | 97 | 12.2% |
| $150,000 to $199,999 | 55 | 6.9% |
| $200,000+ | 28 | 3.5% |
Household Income by Householder Age in Bellville
The median household income in Bellville is $54,259, with the highest median household income of $69,891 found in the 25 to 44 years age bracket for the primary householder. A total of 224 households (28.2%) fall into this category. Meanwhile, the 45 to 64 years age bracket for the primary householder has the lowest median household income of $0, with 267 households (33.6%) in this group.
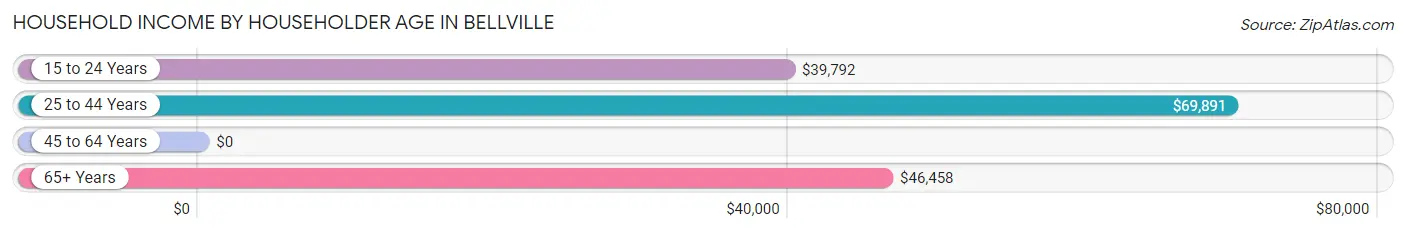
| Income Bracket | # Households | Median Income |
| 15 to 24 Years | 46 (5.8%) | $39,792 |
| 25 to 44 Years | 224 (28.2%) | $69,891 |
| 45 to 64 Years | 267 (33.6%) | $0 |
| 65+ Years | 257 (32.4%) | $46,458 |
| Total | 794 (100.0%) | $54,259 |
Poverty in Bellville
Income Below Poverty by Sex and Age in Bellville
With 4.1% poverty level for males and 17.7% for females among the residents of Bellville, 18 to 24 year old males and under 5 year old females are the most vulnerable to poverty, with 12 males (16.0%) and 25 females (69.4%) in their respective age groups living below the poverty level.
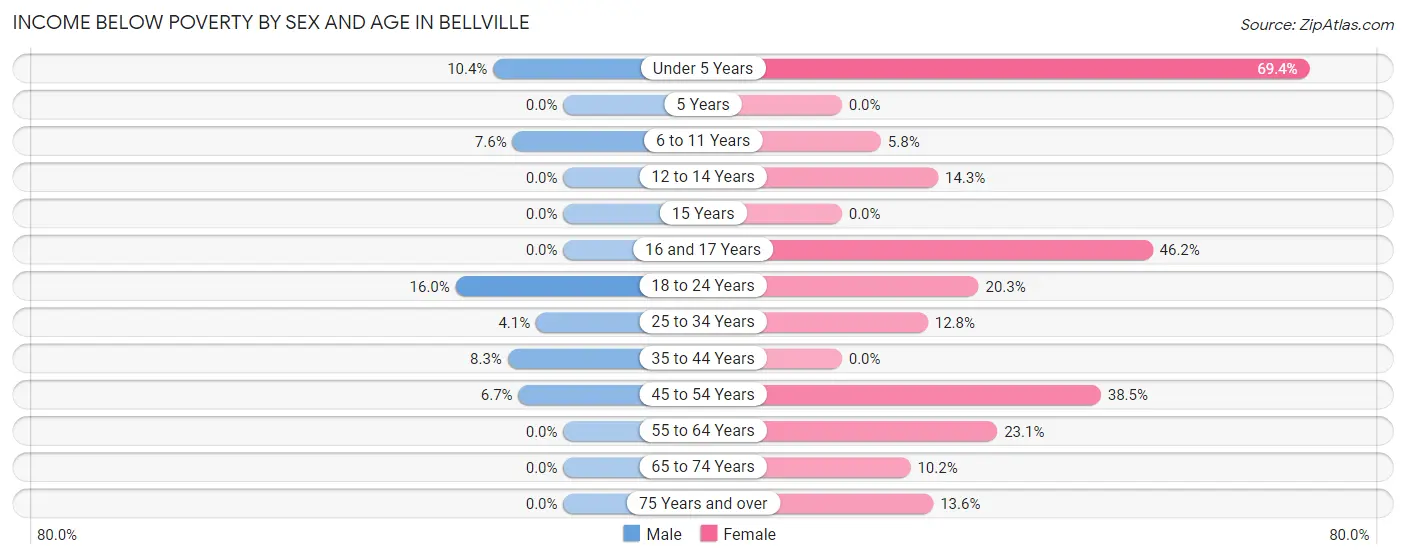
| Age Bracket | Male | Female |
| Under 5 Years | 5 (10.4%) | 25 (69.4%) |
| 5 Years | 0 (0.0%) | 0 (0.0%) |
| 6 to 11 Years | 4 (7.5%) | 5 (5.8%) |
| 12 to 14 Years | 0 (0.0%) | 5 (14.3%) |
| 15 Years | 0 (0.0%) | 0 (0.0%) |
| 16 and 17 Years | 0 (0.0%) | 18 (46.2%) |
| 18 to 24 Years | 12 (16.0%) | 13 (20.3%) |
| 25 to 34 Years | 3 (4.1%) | 12 (12.8%) |
| 35 to 44 Years | 9 (8.3%) | 0 (0.0%) |
| 45 to 54 Years | 6 (6.7%) | 50 (38.5%) |
| 55 to 64 Years | 0 (0.0%) | 24 (23.1%) |
| 65 to 74 Years | 0 (0.0%) | 10 (10.2%) |
| 75 Years and over | 0 (0.0%) | 22 (13.6%) |
| Total | 39 (4.1%) | 184 (17.7%) |
Income Above Poverty by Sex and Age in Bellville
According to the poverty statistics in Bellville, males aged 5 years and females aged 5 years are the age groups that are most secure financially, with 100.0% of males and 100.0% of females in these age groups living above the poverty line.
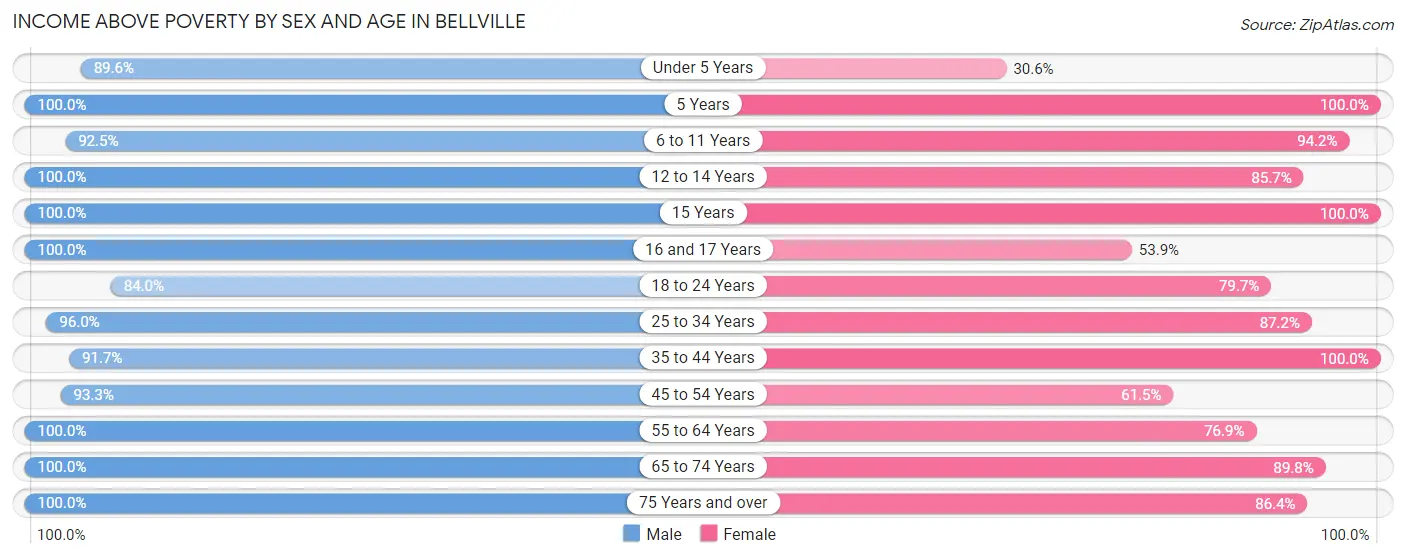
| Age Bracket | Male | Female |
| Under 5 Years | 43 (89.6%) | 11 (30.6%) |
| 5 Years | 33 (100.0%) | 11 (100.0%) |
| 6 to 11 Years | 49 (92.4%) | 81 (94.2%) |
| 12 to 14 Years | 86 (100.0%) | 30 (85.7%) |
| 15 Years | 33 (100.0%) | 38 (100.0%) |
| 16 and 17 Years | 58 (100.0%) | 21 (53.8%) |
| 18 to 24 Years | 63 (84.0%) | 51 (79.7%) |
| 25 to 34 Years | 71 (96.0%) | 82 (87.2%) |
| 35 to 44 Years | 100 (91.7%) | 140 (100.0%) |
| 45 to 54 Years | 84 (93.3%) | 80 (61.5%) |
| 55 to 64 Years | 124 (100.0%) | 80 (76.9%) |
| 65 to 74 Years | 89 (100.0%) | 88 (89.8%) |
| 75 Years and over | 86 (100.0%) | 140 (86.4%) |
| Total | 919 (95.9%) | 853 (82.3%) |
Income Below Poverty Among Married-Couple Families in Bellville
The poverty statistics for married-couple families in Bellville show that 3.0% or 13 of the total 432 families live below the poverty line. Families with 3 or 4 children have the highest poverty rate of 19.4%, comprising of 7 families. On the other hand, families with no children have the lowest poverty rate of 0.0%, which includes 0 families.
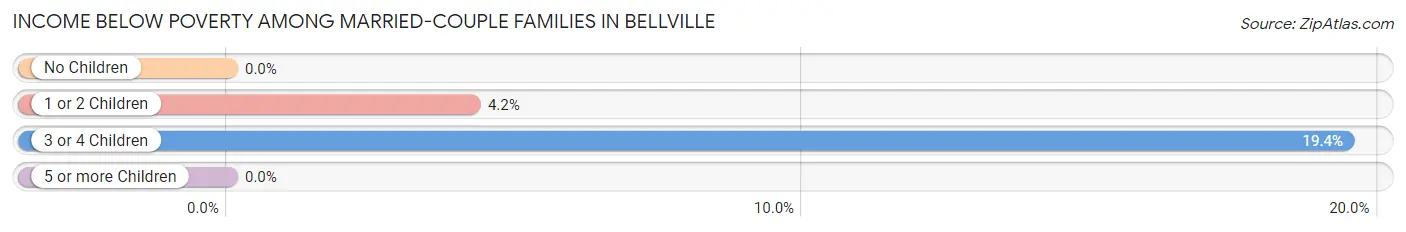
| Children | Above Poverty | Below Poverty |
| No Children | 254 (100.0%) | 0 (0.0%) |
| 1 or 2 Children | 136 (95.8%) | 6 (4.2%) |
| 3 or 4 Children | 29 (80.6%) | 7 (19.4%) |
| 5 or more Children | 0 (0.0%) | 0 (0.0%) |
| Total | 419 (97.0%) | 13 (3.0%) |
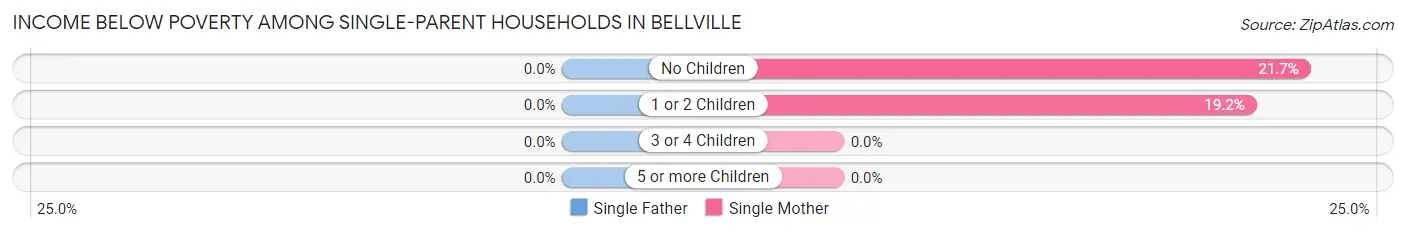
Income Below Poverty Among Single-Parent Households in Bellville
| Children | Single Father | Single Mother |
| No Children | 0 (0.0%) | 5 (21.7%) |
| 1 or 2 Children | 0 (0.0%) | 10 (19.2%) |
| 3 or 4 Children | 0 (0.0%) | 0 (0.0%) |
| 5 or more Children | 0 (0.0%) | 0 (0.0%) |
| Total | 0 (0.0%) | 15 (20.0%) |
Income Below Poverty Among Married-Couple vs Single-Parent Households in Bellville
The poverty data for Bellville shows that 13 of the married-couple family households (3.0%) and 15 of the single-parent households (13.2%) are living below the poverty level. Within the married-couple family households, those with 3 or 4 children have the highest poverty rate, with 7 households (19.4%) falling below the poverty line. Among the single-parent households, those with 1 or 2 children have the highest poverty rate, with 10 household (13.9%) living below poverty.
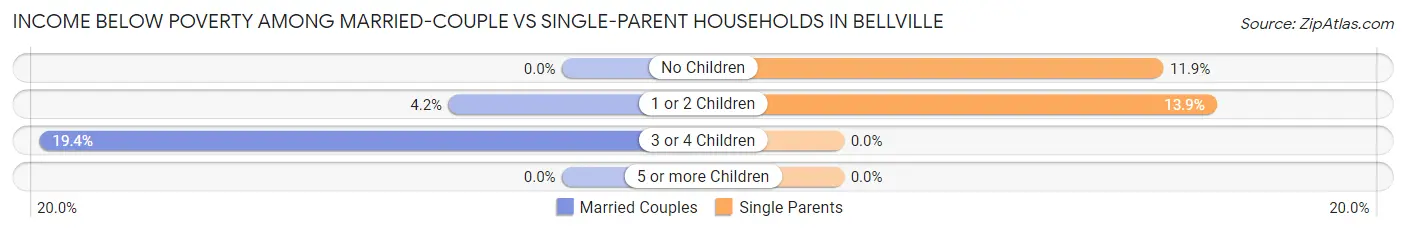
| Children | Married-Couple Families | Single-Parent Households |
| No Children | 0 (0.0%) | 5 (11.9%) |
| 1 or 2 Children | 6 (4.2%) | 10 (13.9%) |
| 3 or 4 Children | 7 (19.4%) | 0 (0.0%) |
| 5 or more Children | 0 (0.0%) | 0 (0.0%) |
| Total | 13 (3.0%) | 15 (13.2%) |
Race in Bellville
The most populous races in Bellville are White / Caucasian (1,920 | 96.2%), Black / African American (36 | 1.8%), and Two or more Races (18 | 0.9%).
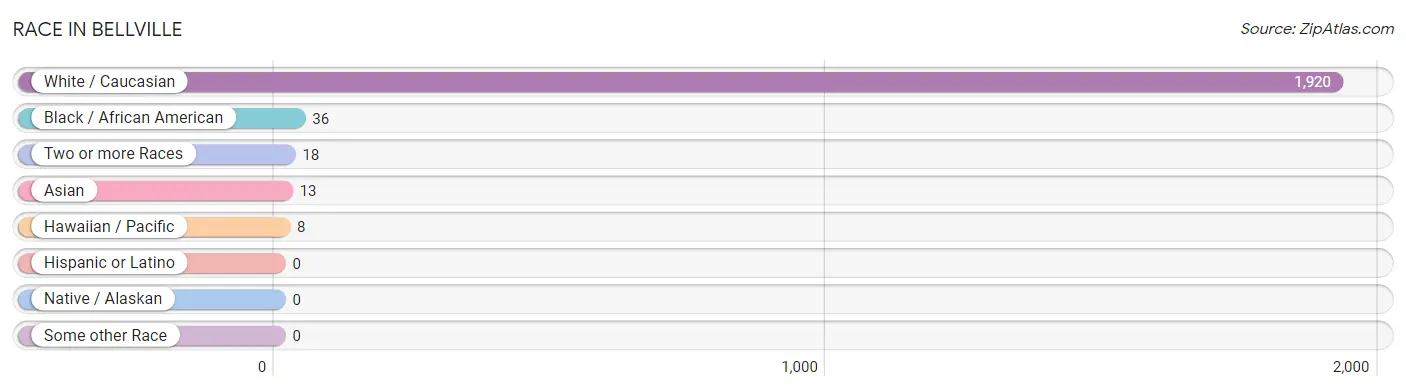
| Race | # Population | % Population |
| Asian | 13 | 0.6% |
| Black / African American | 36 | 1.8% |
| Hawaiian / Pacific | 8 | 0.4% |
| Hispanic or Latino | 0 | 0.0% |
| Native / Alaskan | 0 | 0.0% |
| White / Caucasian | 1,920 | 96.2% |
| Two or more Races | 18 | 0.9% |
| Some other Race | 0 | 0.0% |
| Total | 1,995 | 100.0% |
Ancestry in Bellville
The most populous ancestries reported in Bellville are German (654 | 32.8%), English (309 | 15.5%), Irish (228 | 11.4%), American (184 | 9.2%), and Italian (108 | 5.4%), together accounting for 74.3% of all Bellville residents.
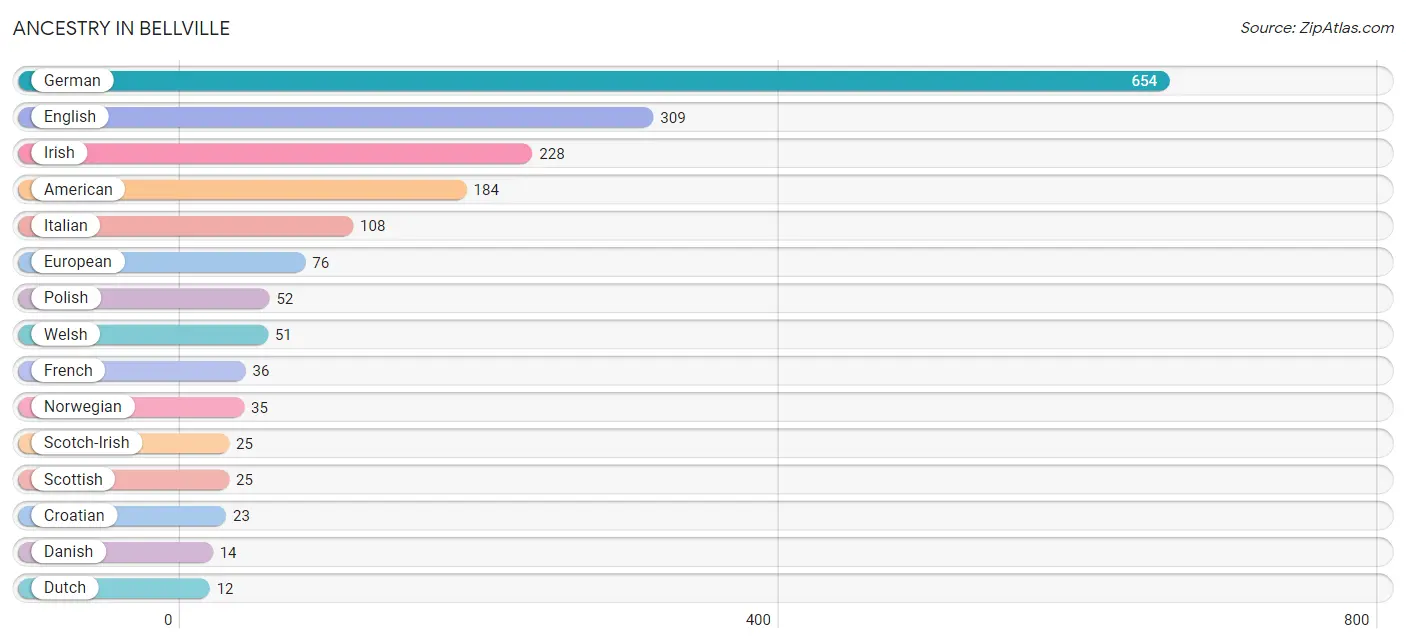
| Ancestry | # Population | % Population |
| American | 184 | 9.2% |
| Belgian | 4 | 0.2% |
| Burmese | 5 | 0.3% |
| Croatian | 23 | 1.1% |
| Czech | 3 | 0.2% |
| Danish | 14 | 0.7% |
| Dutch | 12 | 0.6% |
| English | 309 | 15.5% |
| European | 76 | 3.8% |
| French | 36 | 1.8% |
| French Canadian | 4 | 0.2% |
| German | 654 | 32.8% |
| Hungarian | 10 | 0.5% |
| Indian (Asian) | 8 | 0.4% |
| Irish | 228 | 11.4% |
| Italian | 108 | 5.4% |
| Native Hawaiian | 8 | 0.4% |
| Norwegian | 35 | 1.8% |
| Polish | 52 | 2.6% |
| Romanian | 8 | 0.4% |
| Russian | 6 | 0.3% |
| Samoan | 5 | 0.3% |
| Scotch-Irish | 25 | 1.3% |
| Scottish | 25 | 1.3% |
| Swedish | 5 | 0.3% |
| Swiss | 9 | 0.4% |
| Welsh | 51 | 2.6% | View All 27 Rows |
Immigrants in Bellville
The most numerous immigrant groups reported in Bellville came from Asia (13 | 0.6%), China (8 | 0.4%), Eastern Asia (8 | 0.4%), Indonesia (5 | 0.3%), and South Eastern Asia (5 | 0.3%), together accounting for 1.9% of all Bellville residents.
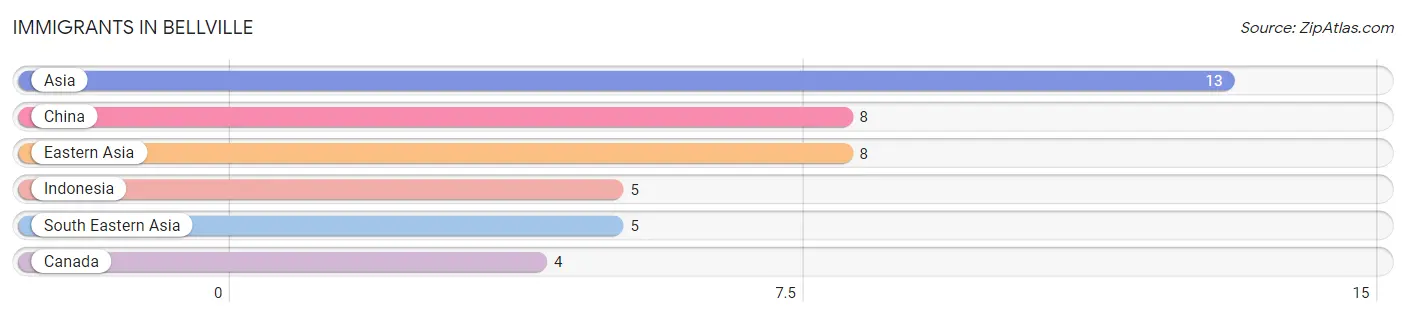
| Immigration Origin | # Population | % Population |
| Asia | 13 | 0.6% |
| Canada | 4 | 0.2% |
| China | 8 | 0.4% |
| Eastern Asia | 8 | 0.4% |
| Indonesia | 5 | 0.3% |
| South Eastern Asia | 5 | 0.3% | View All 6 Rows |
Sex and Age in Bellville
Sex and Age in Bellville
The most populous age groups in Bellville are 10 to 14 Years (115 | 12.0%) for men and 35 to 39 Years (102 | 9.8%) for women.
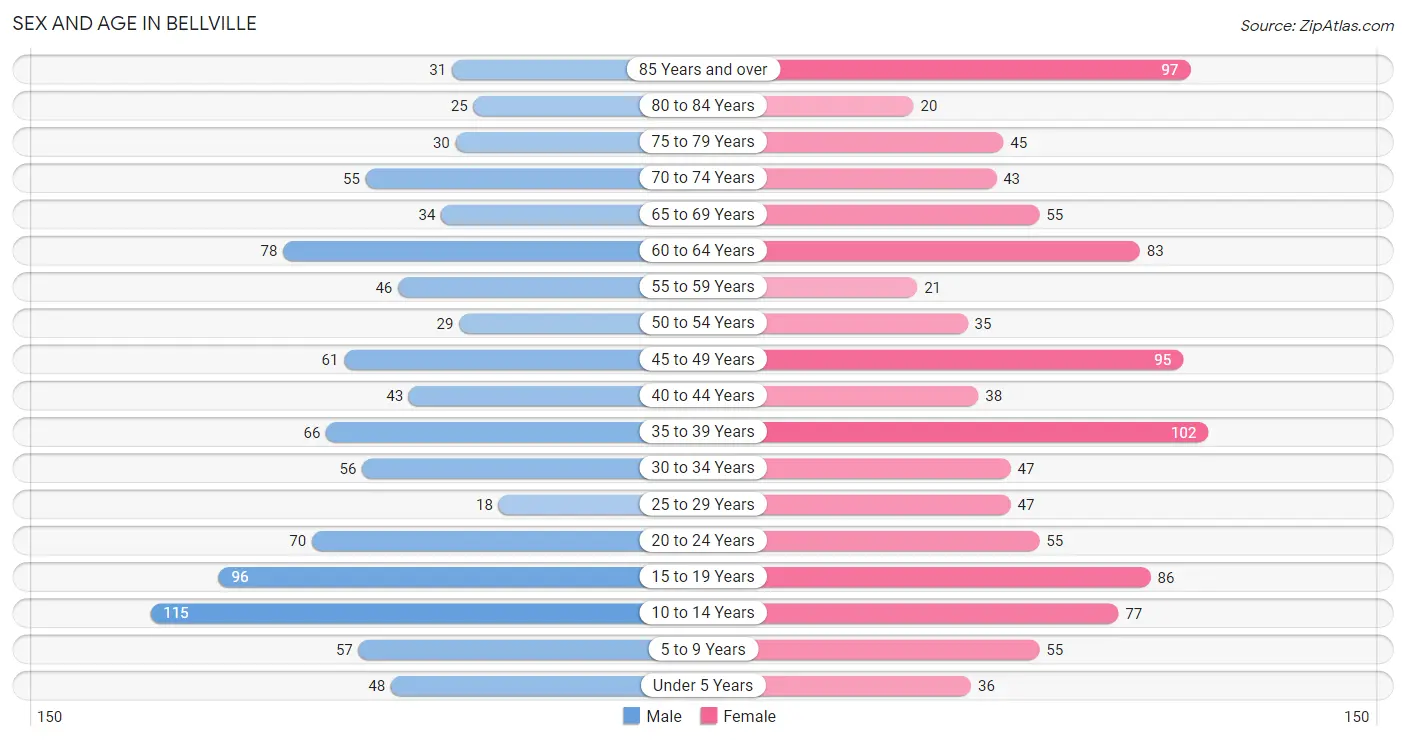
| Age Bracket | Male | Female |
| Under 5 Years | 48 (5.0%) | 36 (3.5%) |
| 5 to 9 Years | 57 (5.9%) | 55 (5.3%) |
| 10 to 14 Years | 115 (12.0%) | 77 (7.4%) |
| 15 to 19 Years | 96 (10.0%) | 86 (8.3%) |
| 20 to 24 Years | 70 (7.3%) | 55 (5.3%) |
| 25 to 29 Years | 18 (1.9%) | 47 (4.5%) |
| 30 to 34 Years | 56 (5.9%) | 47 (4.5%) |
| 35 to 39 Years | 66 (6.9%) | 102 (9.8%) |
| 40 to 44 Years | 43 (4.5%) | 38 (3.7%) |
| 45 to 49 Years | 61 (6.4%) | 95 (9.2%) |
| 50 to 54 Years | 29 (3.0%) | 35 (3.4%) |
| 55 to 59 Years | 46 (4.8%) | 21 (2.0%) |
| 60 to 64 Years | 78 (8.1%) | 83 (8.0%) |
| 65 to 69 Years | 34 (3.5%) | 55 (5.3%) |
| 70 to 74 Years | 55 (5.7%) | 43 (4.2%) |
| 75 to 79 Years | 30 (3.1%) | 45 (4.3%) |
| 80 to 84 Years | 25 (2.6%) | 20 (1.9%) |
| 85 Years and over | 31 (3.2%) | 97 (9.3%) |
| Total | 958 (100.0%) | 1,037 (100.0%) |
Families and Households in Bellville
Median Family Size in Bellville
The median family size in Bellville is 3.05 persons per family, with married-couple families (432 | 79.1%) accounting for the largest median family size of 3.14 persons per family. On the other hand, single male/father families (39 | 7.1%) represent the smallest median family size with 2.26 persons per family.
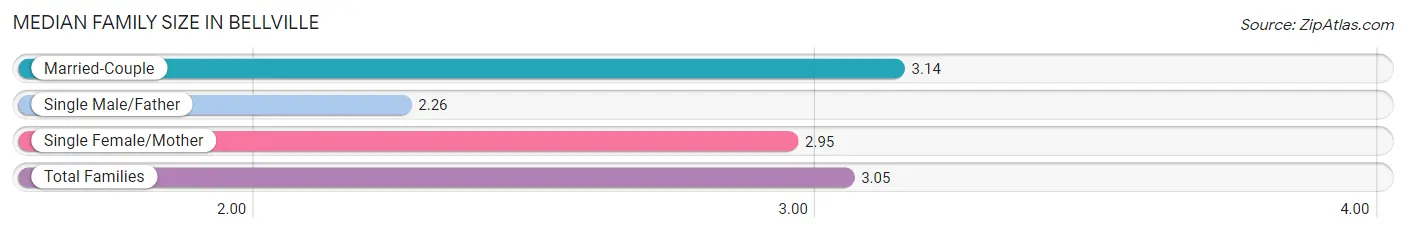
| Family Type | # Families | Family Size |
| Married-Couple | 432 (79.1%) | 3.14 |
| Single Male/Father | 39 (7.1%) | 2.26 |
| Single Female/Mother | 75 (13.7%) | 2.95 |
| Total Families | 546 (100.0%) | 3.05 |
Median Household Size in Bellville
The median household size in Bellville is 2.51 persons per household, with single male/father households (39 | 4.9%) accounting for the largest median household size of 3.64 persons per household. non-family households (248 | 31.2%) represent the smallest median household size with 1.04 persons per household.
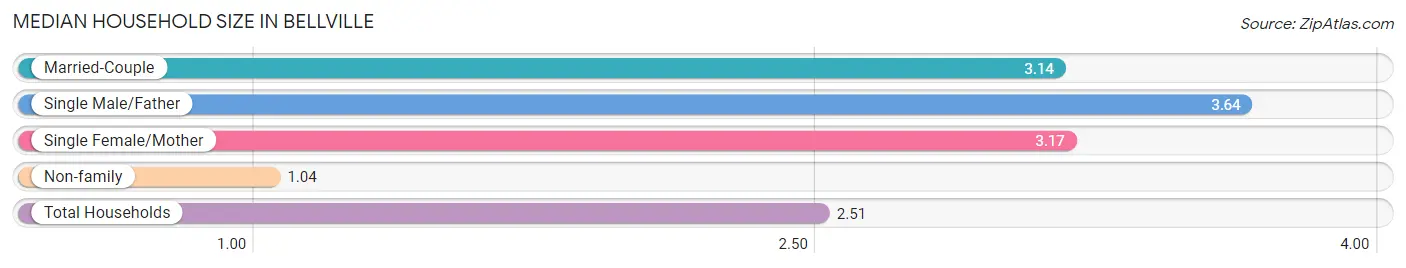
| Household Type | # Households | Household Size |
| Married-Couple | 432 (54.4%) | 3.14 |
| Single Male/Father | 39 (4.9%) | 3.64 |
| Single Female/Mother | 75 (9.5%) | 3.17 |
| Non-family | 248 (31.2%) | 1.04 |
| Total Households | 794 (100.0%) | 2.51 |
Household Size by Marriage Status in Bellville
Out of a total of 794 households in Bellville, 546 (68.8%) are family households, while 248 (31.2%) are nonfamily households. The most numerous type of family households are 2-person households, comprising 265, and the most common type of nonfamily households are 1-person households, comprising 238.
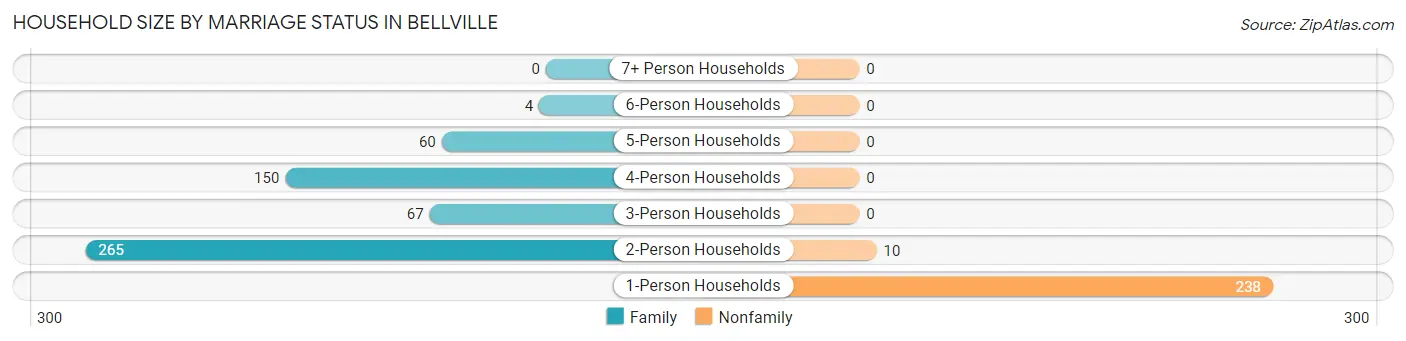
| Household Size | Family Households | Nonfamily Households |
| 1-Person Households | - | 238 (30.0%) |
| 2-Person Households | 265 (33.4%) | 10 (1.3%) |
| 3-Person Households | 67 (8.4%) | 0 (0.0%) |
| 4-Person Households | 150 (18.9%) | 0 (0.0%) |
| 5-Person Households | 60 (7.6%) | 0 (0.0%) |
| 6-Person Households | 4 (0.5%) | 0 (0.0%) |
| 7+ Person Households | 0 (0.0%) | 0 (0.0%) |
| Total | 546 (68.8%) | 248 (31.2%) |
Female Fertility in Bellville
Fertility by Age in Bellville
Average fertility rate in Bellville is 25.0 births per 1,000 women. Women in the age bracket of 20 to 34 years have the highest fertility rate with 81.0 births per 1,000 women. Women in the age bracket of 20 to 34 years acount for 100.0% of all women with births.
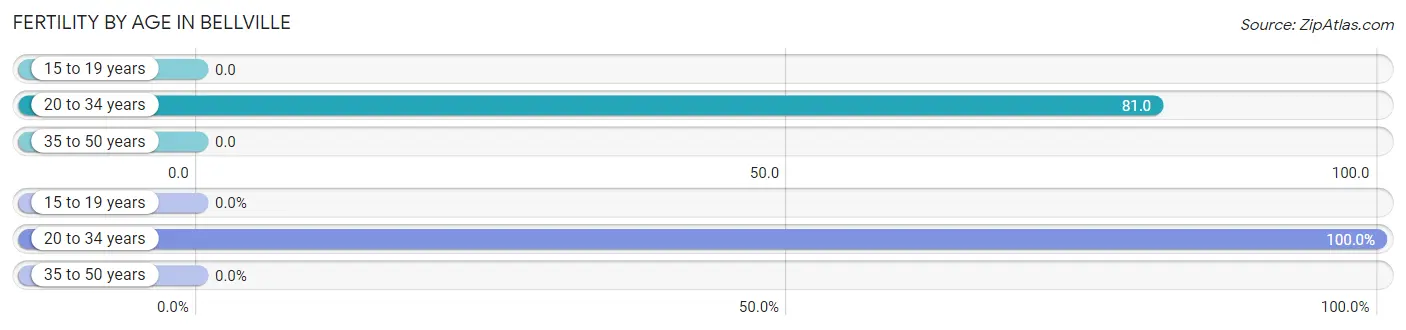
| Age Bracket | Women with Births | Births / 1,000 Women |
| 15 to 19 years | 0 (0.0%) | 0.0 |
| 20 to 34 years | 12 (100.0%) | 81.0 |
| 35 to 50 years | 0 (0.0%) | 0.0 |
| Total | 12 (100.0%) | 25.0 |
Fertility by Age by Marriage Status in Bellville
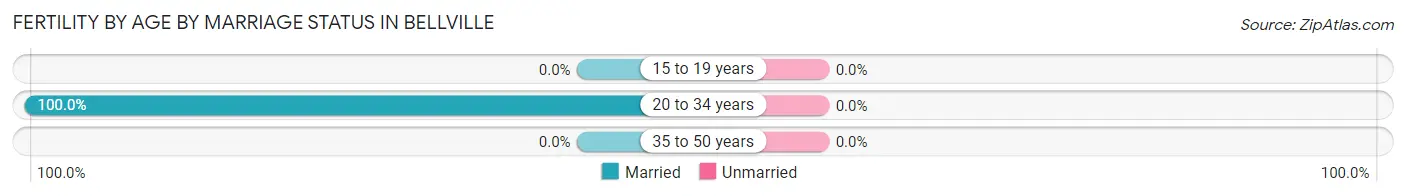
| Age Bracket | Married | Unmarried |
| 15 to 19 years | 0 (0.0%) | 0 (0.0%) |
| 20 to 34 years | 12 (100.0%) | 0 (0.0%) |
| 35 to 50 years | 0 (0.0%) | 0 (0.0%) |
| Total | 12 (100.0%) | 0 (0.0%) |
Fertility by Education in Bellville
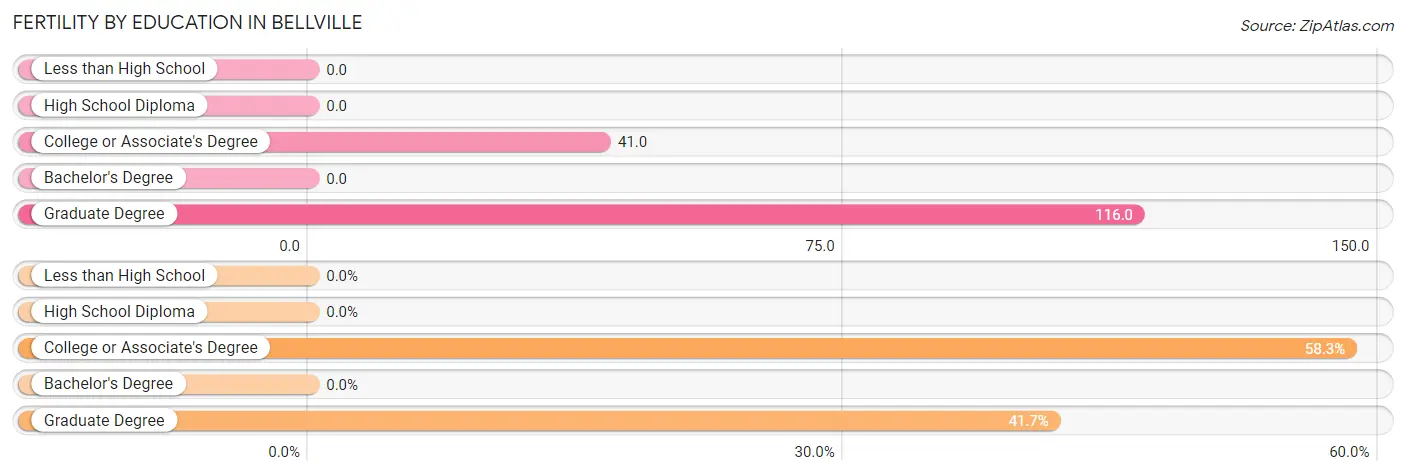
| Educational Attainment | Women with Births | Births / 1,000 Women |
| Less than High School | 0 (0.0%) | 0.0 |
| High School Diploma | 0 (0.0%) | 0.0 |
| College or Associate's Degree | 7 (58.3%) | 41.0 |
| Bachelor's Degree | 0 (0.0%) | 0.0 |
| Graduate Degree | 5 (41.7%) | 116.0 |
| Total | 12 (100.0%) | 25.0 |
Fertility by Education by Marriage Status in Bellville
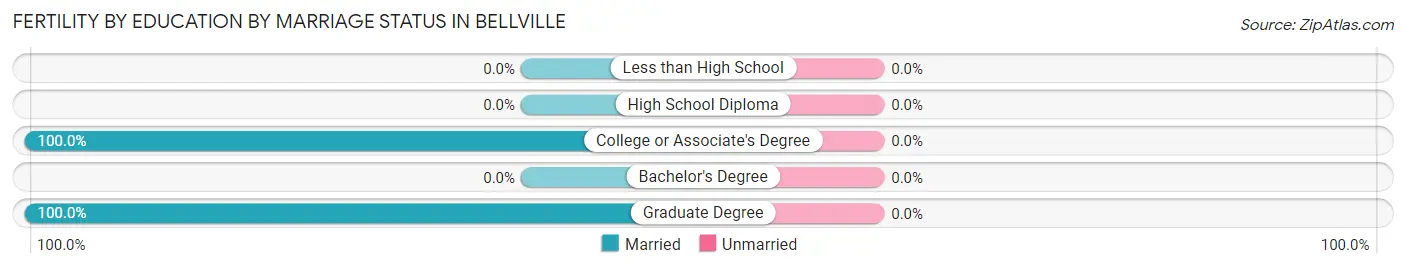
| Educational Attainment | Married | Unmarried |
| Less than High School | 0 (0.0%) | 0 (0.0%) |
| High School Diploma | 0 (0.0%) | 0 (0.0%) |
| College or Associate's Degree | 7 (100.0%) | 0 (0.0%) |
| Bachelor's Degree | 0 (0.0%) | 0 (0.0%) |
| Graduate Degree | 5 (100.0%) | 0 (0.0%) |
| Total | 12 (100.0%) | 0 (0.0%) |
Employment Characteristics in Bellville
Employment by Class of Employer in Bellville
Among the 945 employed individuals in Bellville, private company employees (568 | 60.1%), not-for-profit organizations (154 | 16.3%), and self-employed (incorporated) (72 | 7.6%) make up the most common classes of employment.
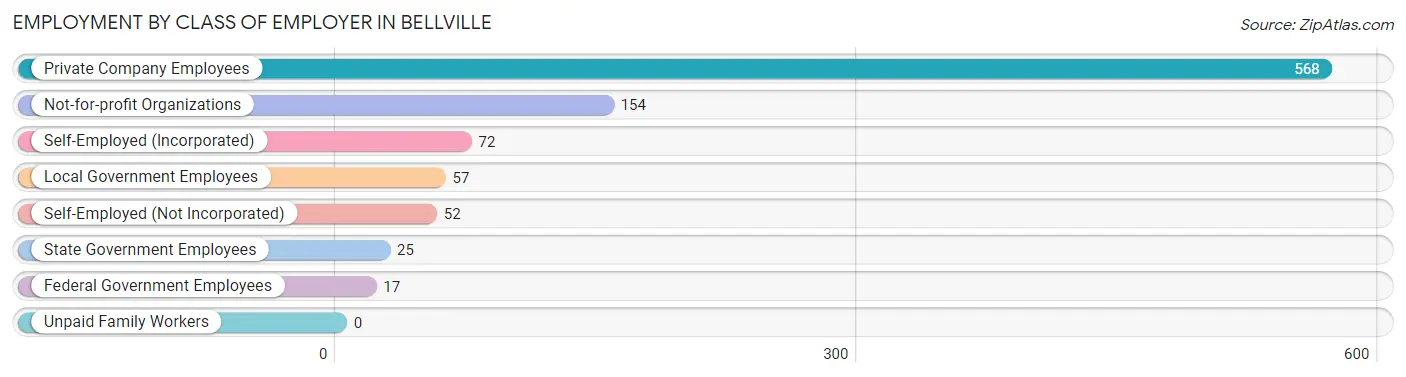
| Employer Class | # Employees | % Employees |
| Private Company Employees | 568 | 60.1% |
| Self-Employed (Incorporated) | 72 | 7.6% |
| Self-Employed (Not Incorporated) | 52 | 5.5% |
| Not-for-profit Organizations | 154 | 16.3% |
| Local Government Employees | 57 | 6.0% |
| State Government Employees | 25 | 2.6% |
| Federal Government Employees | 17 | 1.8% |
| Unpaid Family Workers | 0 | 0.0% |
| Total | 945 | 100.0% |
Employment Status by Age in Bellville
According to the labor force statistics for Bellville, out of the total population over 16 years of age (1,536), 63.2% or 971 individuals are in the labor force, with 2.0% or 19 of them unemployed. The age group with the highest labor force participation rate is 25 to 29 years, with 100.0% or 65 individuals in the labor force. Within the labor force, the 25 to 29 years age range has the highest percentage of unemployed individuals, with 16.9% or 11 of them being unemployed.
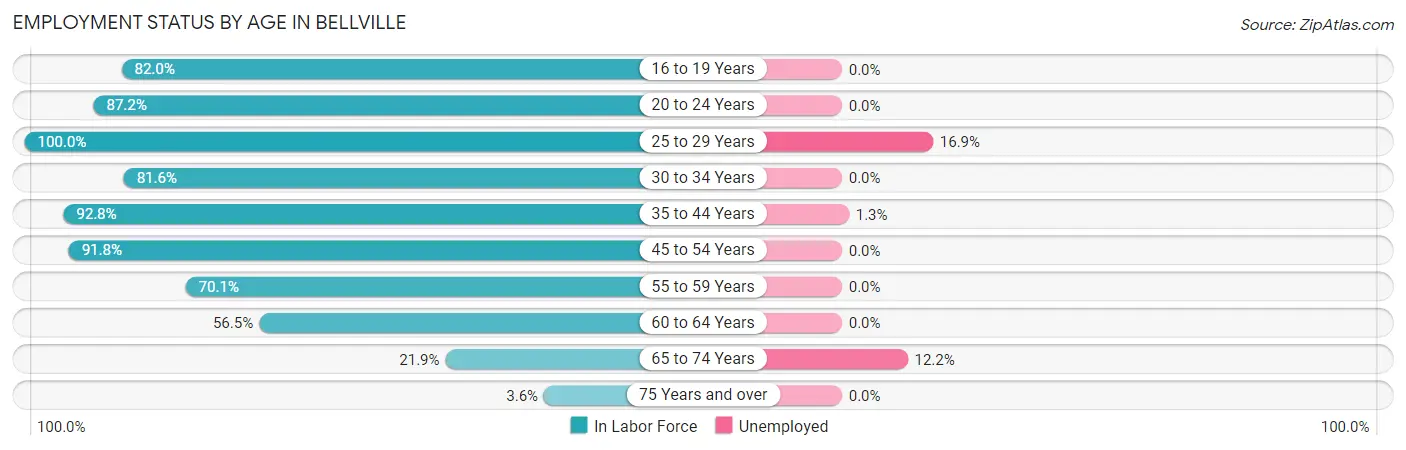
| Age Bracket | In Labor Force | Unemployed |
| 16 to 19 Years | 91 (82.0%) | 0 (0.0%) |
| 20 to 24 Years | 109 (87.2%) | 0 (0.0%) |
| 25 to 29 Years | 65 (100.0%) | 11 (16.9%) |
| 30 to 34 Years | 84 (81.6%) | 0 (0.0%) |
| 35 to 44 Years | 231 (92.8%) | 3 (1.3%) |
| 45 to 54 Years | 202 (91.8%) | 0 (0.0%) |
| 55 to 59 Years | 47 (70.1%) | 0 (0.0%) |
| 60 to 64 Years | 91 (56.5%) | 0 (0.0%) |
| 65 to 74 Years | 41 (21.9%) | 5 (12.2%) |
| 75 Years and over | 9 (3.6%) | 0 (0.0%) |
| Total | 971 (63.2%) | 19 (2.0%) |
Employment Status by Educational Attainment in Bellville
According to labor force statistics for Bellville, 83.2% of individuals (720) out of the total population between 25 and 64 years of age (865) are in the labor force, with 2.0% or 14 of them being unemployed. The group with the highest labor force participation rate are those with the educational attainment of less than high school, with 100.0% or 61 individuals in the labor force. Within the labor force, individuals with bachelor's degree or higher education have the highest percentage of unemployment, with 4.8% or 11 of them being unemployed.
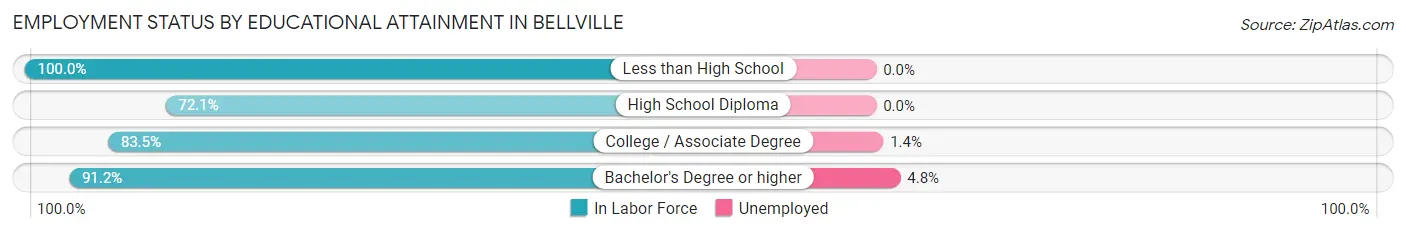
| Educational Attainment | In Labor Force | Unemployed |
| Less than High School | 61 (100.0%) | 0 (0.0%) |
| High School Diploma | 207 (72.1%) | 0 (0.0%) |
| College / Associate Degree | 213 (83.5%) | 4 (1.4%) |
| Bachelor's Degree or higher | 239 (91.2%) | 13 (4.8%) |
| Total | 720 (83.2%) | 17 (2.0%) |
Employment Occupations by Sex in Bellville
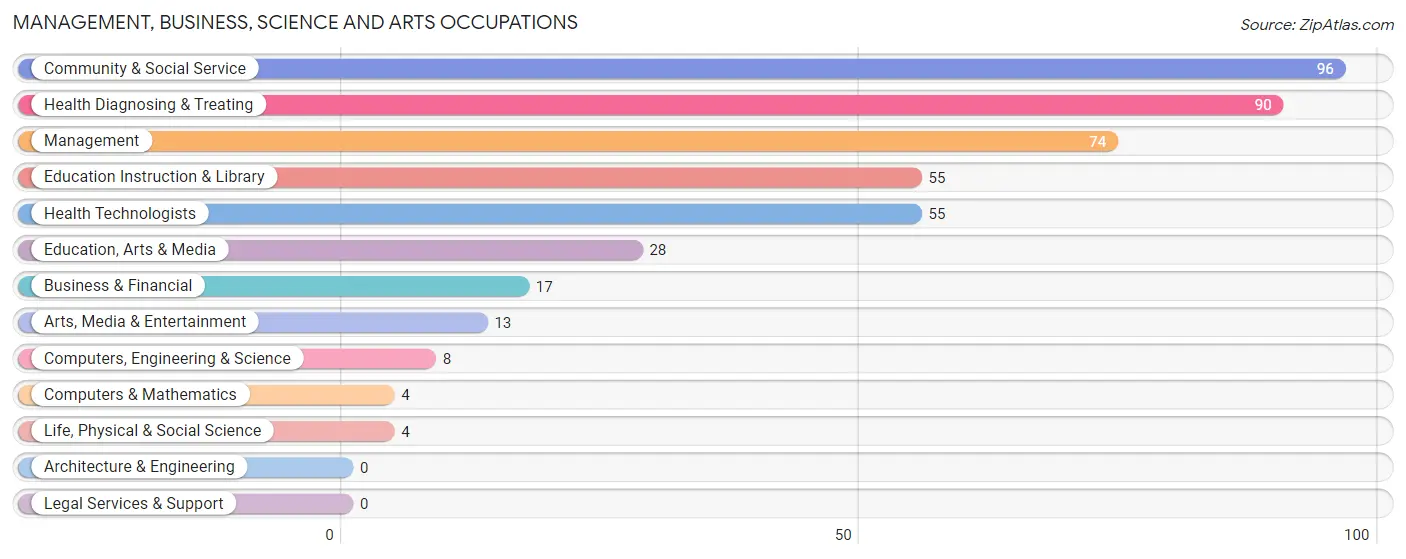
Management, Business, Science and Arts Occupations
The most common Management, Business, Science and Arts occupations in Bellville are Community & Social Service (96 | 10.3%), Health Diagnosing & Treating (90 | 9.6%), Management (74 | 7.9%), Education Instruction & Library (55 | 5.9%), and Health Technologists (55 | 5.9%).
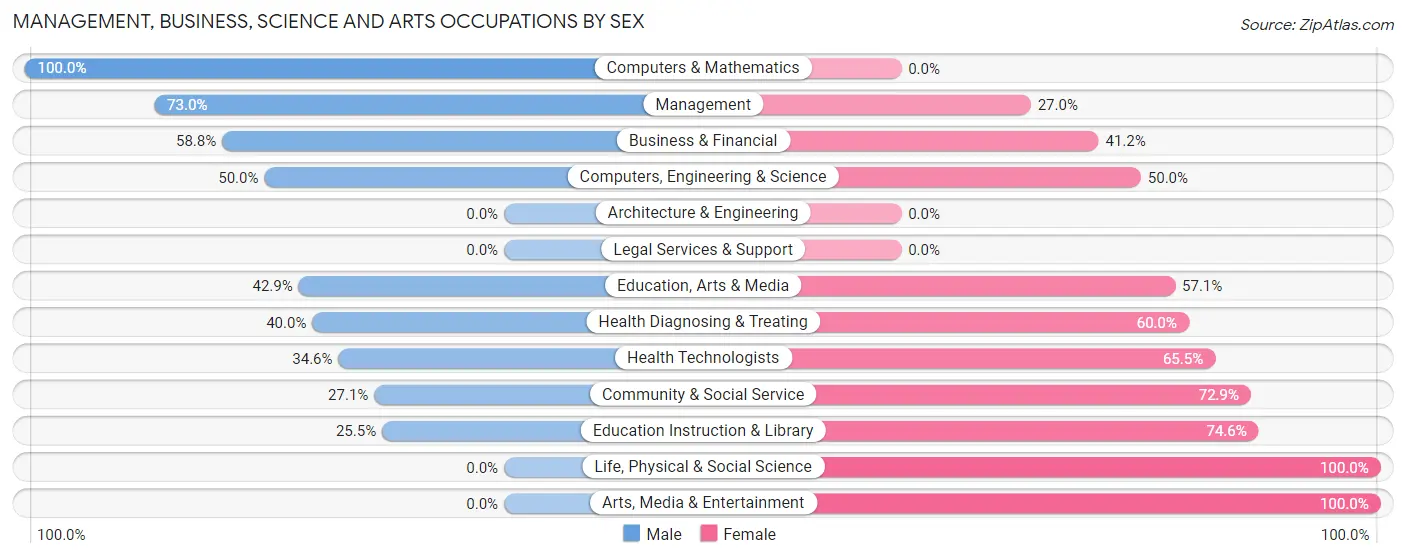
Management, Business, Science and Arts Occupations by Sex
Within the Management, Business, Science and Arts occupations in Bellville, the most male-oriented occupations are Computers & Mathematics (100.0%), Management (73.0%), and Business & Financial (58.8%), while the most female-oriented occupations are Life, Physical & Social Science (100.0%), Arts, Media & Entertainment (100.0%), and Education Instruction & Library (74.6%).
| Occupation | Male | Female |
| Management | 54 (73.0%) | 20 (27.0%) |
| Business & Financial | 10 (58.8%) | 7 (41.2%) |
| Computers, Engineering & Science | 4 (50.0%) | 4 (50.0%) |
| Computers & Mathematics | 4 (100.0%) | 0 (0.0%) |
| Architecture & Engineering | 0 (0.0%) | 0 (0.0%) |
| Life, Physical & Social Science | 0 (0.0%) | 4 (100.0%) |
| Community & Social Service | 26 (27.1%) | 70 (72.9%) |
| Education, Arts & Media | 12 (42.9%) | 16 (57.1%) |
| Legal Services & Support | 0 (0.0%) | 0 (0.0%) |
| Education Instruction & Library | 14 (25.5%) | 41 (74.6%) |
| Arts, Media & Entertainment | 0 (0.0%) | 13 (100.0%) |
| Health Diagnosing & Treating | 36 (40.0%) | 54 (60.0%) |
| Health Technologists | 19 (34.5%) | 36 (65.4%) |
| Total (Category) | 130 (45.6%) | 155 (54.4%) |
| Total (Overall) | 476 (51.0%) | 458 (49.0%) |
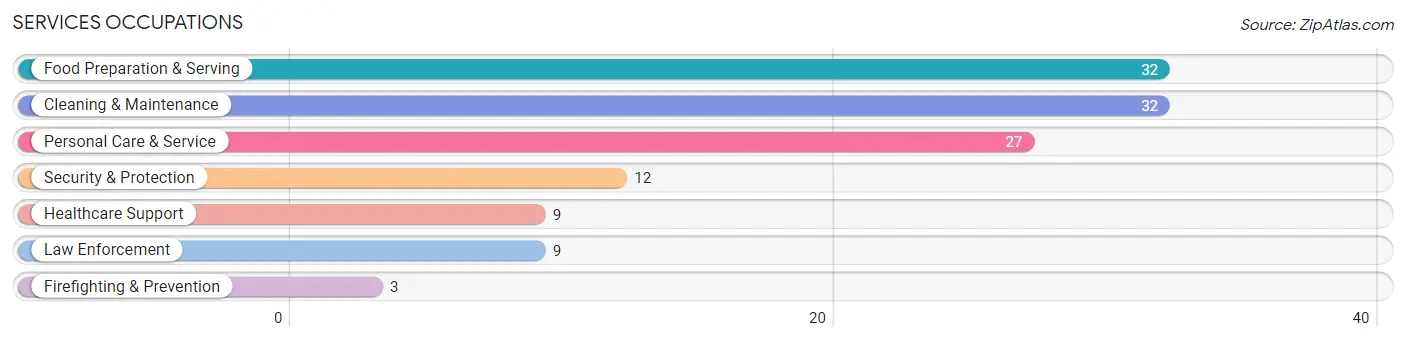
Services Occupations
The most common Services occupations in Bellville are Food Preparation & Serving (32 | 3.4%), Cleaning & Maintenance (32 | 3.4%), Personal Care & Service (27 | 2.9%), Security & Protection (12 | 1.3%), and Healthcare Support (9 | 1.0%).
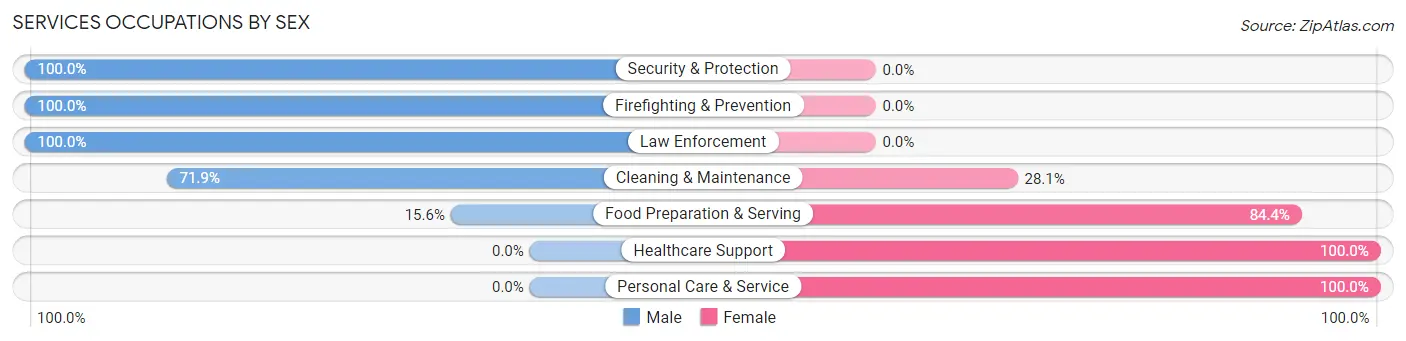
Services Occupations by Sex
Within the Services occupations in Bellville, the most male-oriented occupations are Security & Protection (100.0%), Firefighting & Prevention (100.0%), and Law Enforcement (100.0%), while the most female-oriented occupations are Healthcare Support (100.0%), Personal Care & Service (100.0%), and Food Preparation & Serving (84.4%).
| Occupation | Male | Female |
| Healthcare Support | 0 (0.0%) | 9 (100.0%) |
| Security & Protection | 12 (100.0%) | 0 (0.0%) |
| Firefighting & Prevention | 3 (100.0%) | 0 (0.0%) |
| Law Enforcement | 9 (100.0%) | 0 (0.0%) |
| Food Preparation & Serving | 5 (15.6%) | 27 (84.4%) |
| Cleaning & Maintenance | 23 (71.9%) | 9 (28.1%) |
| Personal Care & Service | 0 (0.0%) | 27 (100.0%) |
| Total (Category) | 40 (35.7%) | 72 (64.3%) |
| Total (Overall) | 476 (51.0%) | 458 (49.0%) |
Sales and Office Occupations
The most common Sales and Office occupations in Bellville are Office & Administration (125 | 13.4%), and Sales & Related (77 | 8.2%).

Sales and Office Occupations by Sex
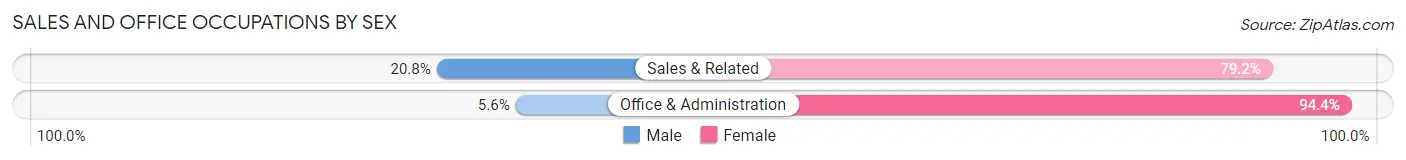
| Occupation | Male | Female |
| Sales & Related | 16 (20.8%) | 61 (79.2%) |
| Office & Administration | 7 (5.6%) | 118 (94.4%) |
| Total (Category) | 23 (11.4%) | 179 (88.6%) |
| Total (Overall) | 476 (51.0%) | 458 (49.0%) |
Natural Resources, Construction and Maintenance Occupations
The most common Natural Resources, Construction and Maintenance occupations in Bellville are Construction & Extraction (42 | 4.5%), Installation, Maintenance & Repair (35 | 3.7%), and Farming, Fishing & Forestry (18 | 1.9%).

Natural Resources, Construction and Maintenance Occupations by Sex

| Occupation | Male | Female |
| Farming, Fishing & Forestry | 18 (100.0%) | 0 (0.0%) |
| Construction & Extraction | 42 (100.0%) | 0 (0.0%) |
| Installation, Maintenance & Repair | 35 (100.0%) | 0 (0.0%) |
| Total (Category) | 95 (100.0%) | 0 (0.0%) |
| Total (Overall) | 476 (51.0%) | 458 (49.0%) |
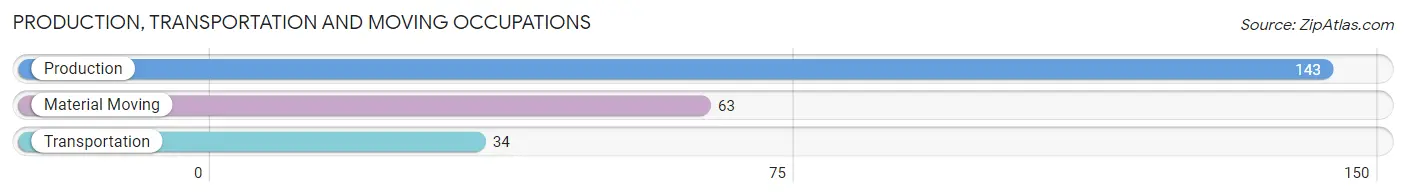
Production, Transportation and Moving Occupations
The most common Production, Transportation and Moving occupations in Bellville are Production (143 | 15.3%), Material Moving (63 | 6.8%), and Transportation (34 | 3.6%).
Production, Transportation and Moving Occupations by Sex
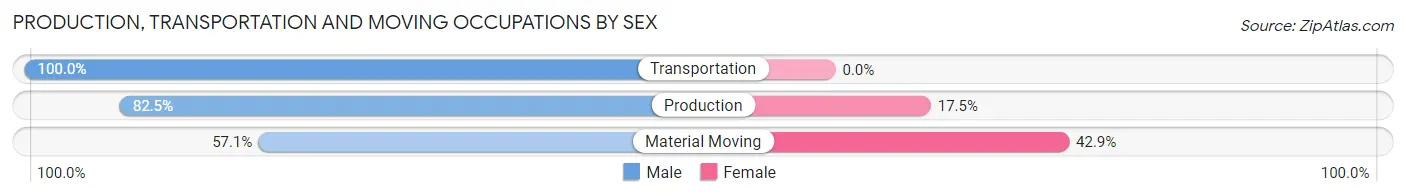
| Occupation | Male | Female |
| Production | 118 (82.5%) | 25 (17.5%) |
| Transportation | 34 (100.0%) | 0 (0.0%) |
| Material Moving | 36 (57.1%) | 27 (42.9%) |
| Total (Category) | 188 (78.3%) | 52 (21.7%) |
| Total (Overall) | 476 (51.0%) | 458 (49.0%) |
Employment Industries by Sex in Bellville
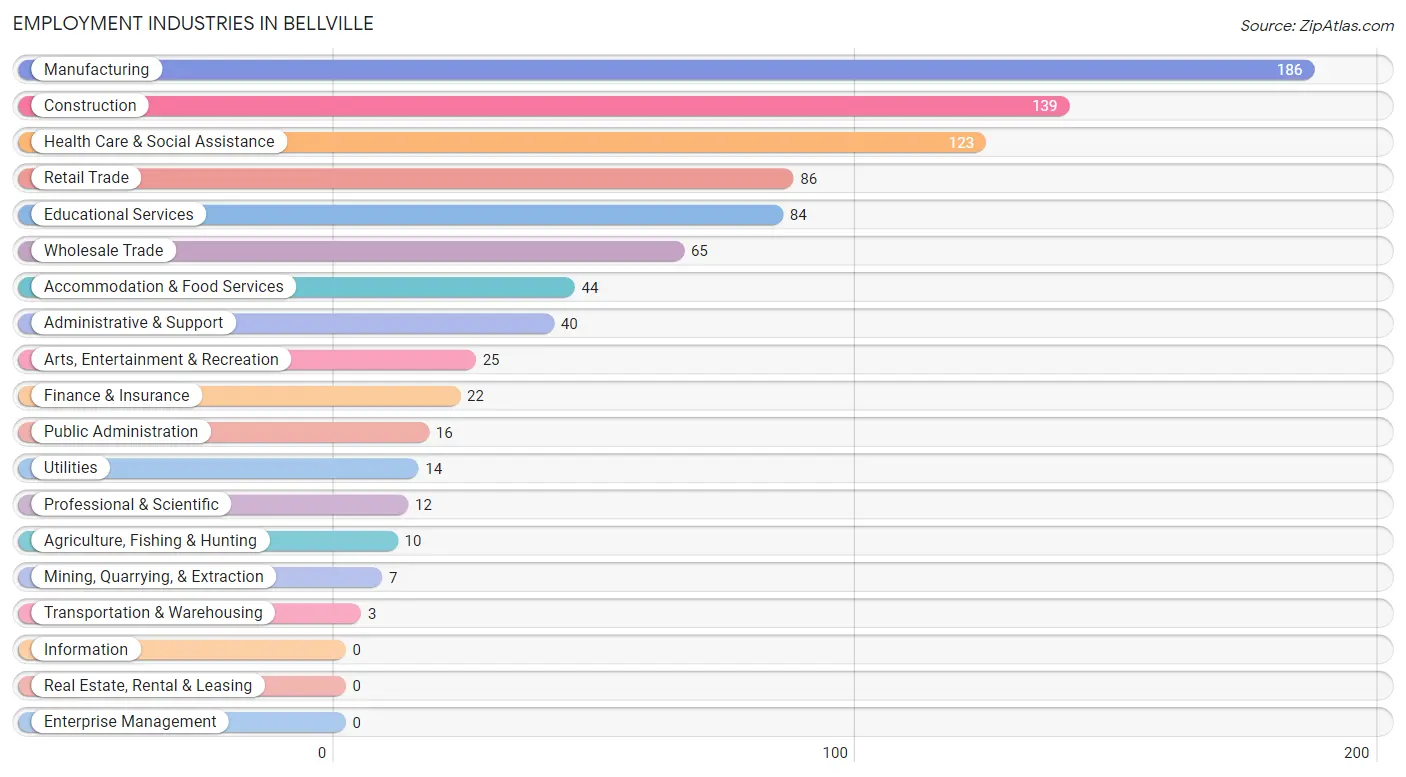
Employment Industries in Bellville
The major employment industries in Bellville include Manufacturing (186 | 19.9%), Construction (139 | 14.9%), Health Care & Social Assistance (123 | 13.2%), Retail Trade (86 | 9.2%), and Educational Services (84 | 9.0%).
Employment Industries by Sex in Bellville
The Bellville industries that see more men than women are Agriculture, Fishing & Hunting (100.0%), Mining, Quarrying, & Extraction (100.0%), and Transportation & Warehousing (100.0%), whereas the industries that tend to have a higher number of women are Finance & Insurance (100.0%), Professional & Scientific (100.0%), and Arts, Entertainment & Recreation (100.0%).
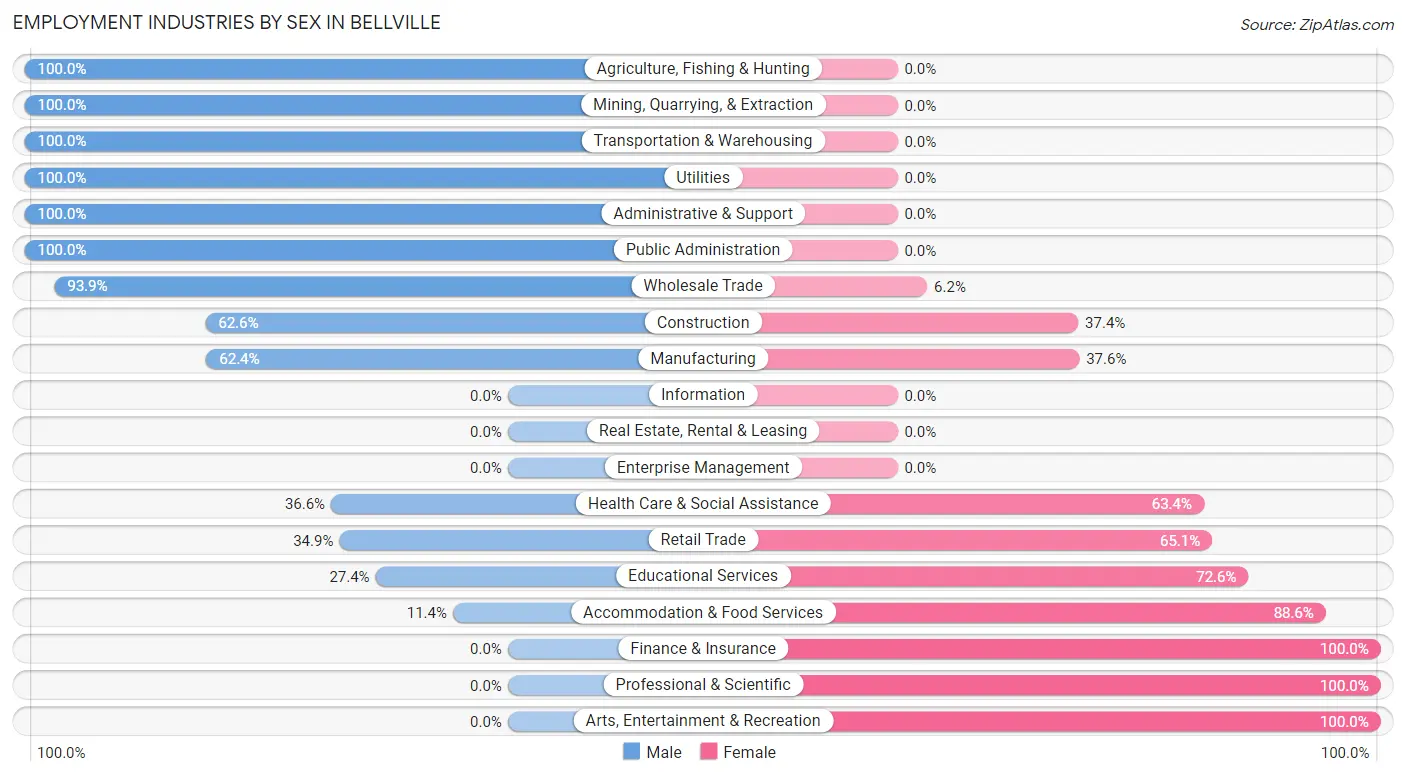
| Industry | Male | Female |
| Agriculture, Fishing & Hunting | 10 (100.0%) | 0 (0.0%) |
| Mining, Quarrying, & Extraction | 7 (100.0%) | 0 (0.0%) |
| Construction | 87 (62.6%) | 52 (37.4%) |
| Manufacturing | 116 (62.4%) | 70 (37.6%) |
| Wholesale Trade | 61 (93.9%) | 4 (6.1%) |
| Retail Trade | 30 (34.9%) | 56 (65.1%) |
| Transportation & Warehousing | 3 (100.0%) | 0 (0.0%) |
| Utilities | 14 (100.0%) | 0 (0.0%) |
| Information | 0 (0.0%) | 0 (0.0%) |
| Finance & Insurance | 0 (0.0%) | 22 (100.0%) |
| Real Estate, Rental & Leasing | 0 (0.0%) | 0 (0.0%) |
| Professional & Scientific | 0 (0.0%) | 12 (100.0%) |
| Enterprise Management | 0 (0.0%) | 0 (0.0%) |
| Administrative & Support | 40 (100.0%) | 0 (0.0%) |
| Educational Services | 23 (27.4%) | 61 (72.6%) |
| Health Care & Social Assistance | 45 (36.6%) | 78 (63.4%) |
| Arts, Entertainment & Recreation | 0 (0.0%) | 25 (100.0%) |
| Accommodation & Food Services | 5 (11.4%) | 39 (88.6%) |
| Public Administration | 16 (100.0%) | 0 (0.0%) |
| Total | 476 (51.0%) | 458 (49.0%) |
Education in Bellville
School Enrollment in Bellville
The most common levels of schooling among the 521 students in Bellville are middle school (161 | 30.9%), high school (141 | 27.1%), and college / undergraduate (86 | 16.5%).
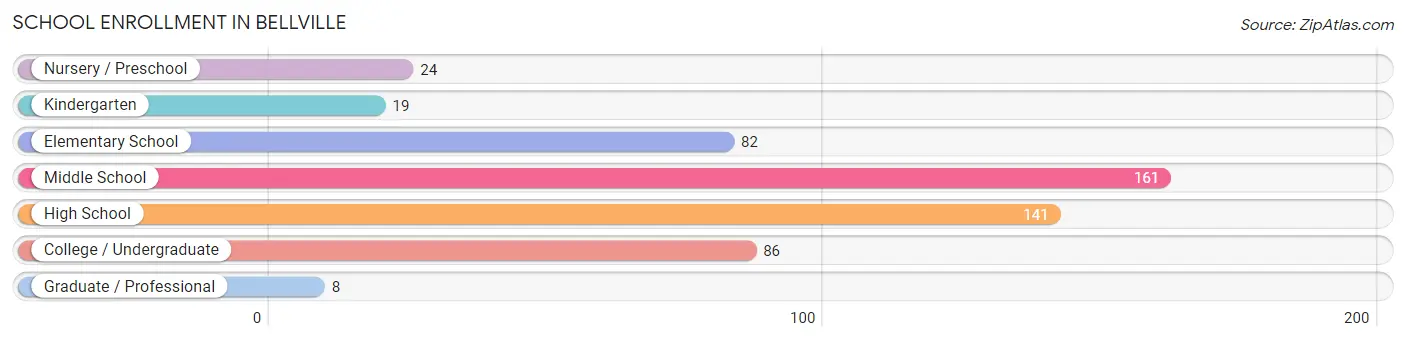
| School Level | # Students | % Students |
| Nursery / Preschool | 24 | 4.6% |
| Kindergarten | 19 | 3.6% |
| Elementary School | 82 | 15.7% |
| Middle School | 161 | 30.9% |
| High School | 141 | 27.1% |
| College / Undergraduate | 86 | 16.5% |
| Graduate / Professional | 8 | 1.5% |
| Total | 521 | 100.0% |
School Enrollment by Age by Funding Source in Bellville
Out of a total of 521 students who are enrolled in schools in Bellville, 27 (5.2%) attend a private institution, while the remaining 494 (94.8%) are enrolled in public schools. The age group of 20 to 24 year olds has the highest likelihood of being enrolled in private schools, with 19 (59.4% in the age bracket) enrolled. Conversely, the age group of 5 to 9 year old has the lowest likelihood of being enrolled in a private school, with 94 (100.0% in the age bracket) attending a public institution.
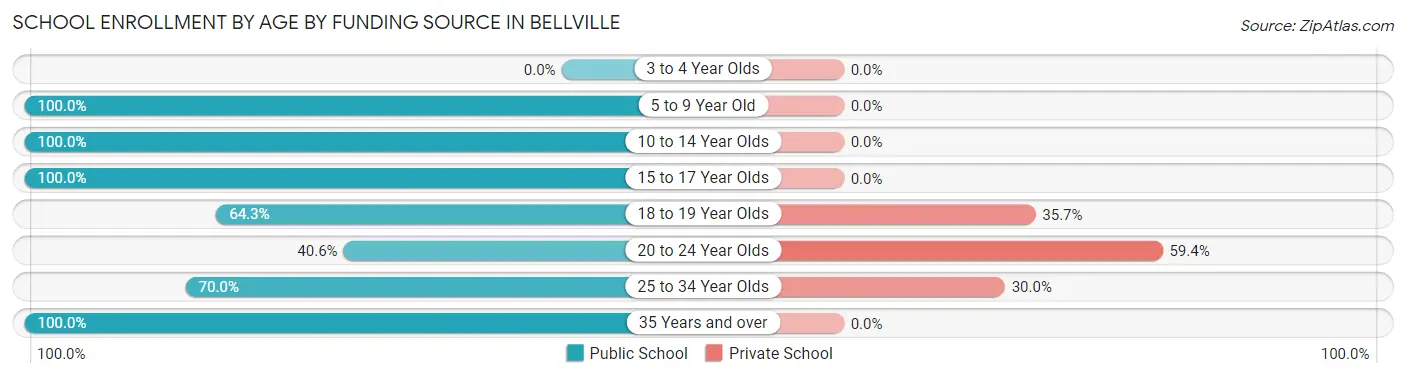
| Age Bracket | Public School | Private School |
| 3 to 4 Year Olds | 0 (0.0%) | 0 (0.0%) |
| 5 to 9 Year Old | 94 (100.0%) | 0 (0.0%) |
| 10 to 14 Year Olds | 192 (100.0%) | 0 (0.0%) |
| 15 to 17 Year Olds | 132 (100.0%) | 0 (0.0%) |
| 18 to 19 Year Olds | 9 (64.3%) | 5 (35.7%) |
| 20 to 24 Year Olds | 13 (40.6%) | 19 (59.4%) |
| 25 to 34 Year Olds | 7 (70.0%) | 3 (30.0%) |
| 35 Years and over | 47 (100.0%) | 0 (0.0%) |
| Total | 494 (94.8%) | 27 (5.2%) |
Educational Attainment by Field of Study in Bellville
Education (77 | 23.0%), science & technology (63 | 18.8%), business (43 | 12.8%), arts & humanities (35 | 10.4%), and psychology (33 | 9.9%) are the most common fields of study among 335 individuals in Bellville who have obtained a bachelor's degree or higher.
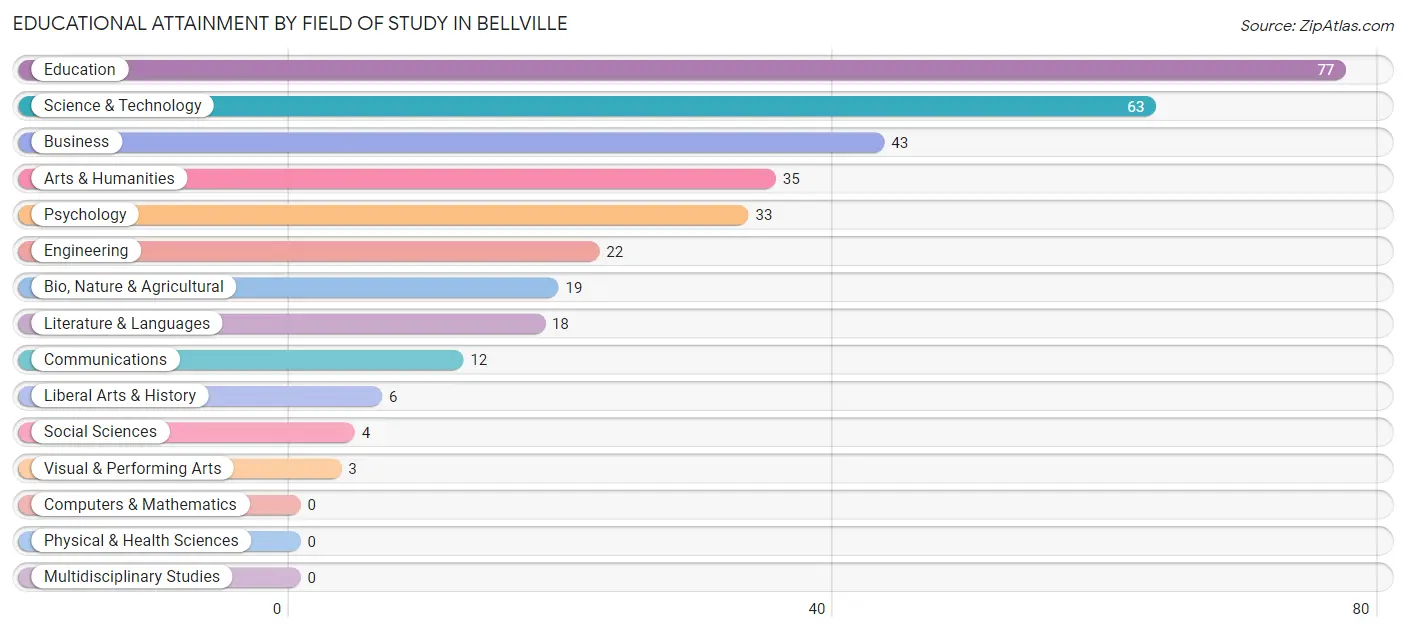
| Field of Study | # Graduates | % Graduates |
| Computers & Mathematics | 0 | 0.0% |
| Bio, Nature & Agricultural | 19 | 5.7% |
| Physical & Health Sciences | 0 | 0.0% |
| Psychology | 33 | 9.9% |
| Social Sciences | 4 | 1.2% |
| Engineering | 22 | 6.6% |
| Multidisciplinary Studies | 0 | 0.0% |
| Science & Technology | 63 | 18.8% |
| Business | 43 | 12.8% |
| Education | 77 | 23.0% |
| Literature & Languages | 18 | 5.4% |
| Liberal Arts & History | 6 | 1.8% |
| Visual & Performing Arts | 3 | 0.9% |
| Communications | 12 | 3.6% |
| Arts & Humanities | 35 | 10.4% |
| Total | 335 | 100.0% |
Transportation & Commute in Bellville
Vehicle Availability by Sex in Bellville
The most prevalent vehicle ownership categories in Bellville are males with 2 vehicles (238, accounting for 49.8%) and females with 2 vehicles (202, making up 51.0%).
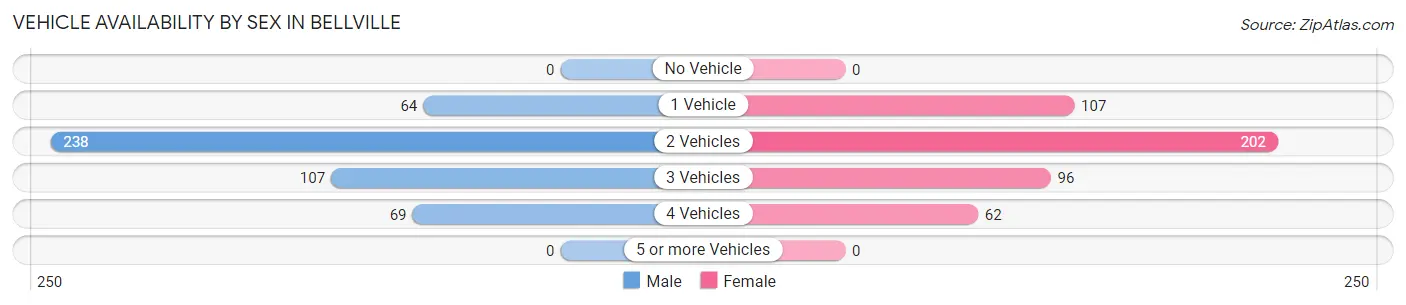
| Vehicles Available | Male | Female |
| No Vehicle | 0 (0.0%) | 0 (0.0%) |
| 1 Vehicle | 64 (13.4%) | 107 (22.9%) |
| 2 Vehicles | 238 (49.8%) | 202 (43.2%) |
| 3 Vehicles | 107 (22.4%) | 96 (20.6%) |
| 4 Vehicles | 69 (14.4%) | 62 (13.3%) |
| 5 or more Vehicles | 0 (0.0%) | 0 (0.0%) |
| Total | 478 (100.0%) | 467 (100.0%) |
Commute Time in Bellville
The most frequently occuring commute durations in Bellville are 25 to 29 minutes (148 commuters, 16.1%), 10 to 14 minutes (123 commuters, 13.4%), and 15 to 19 minutes (115 commuters, 12.5%).
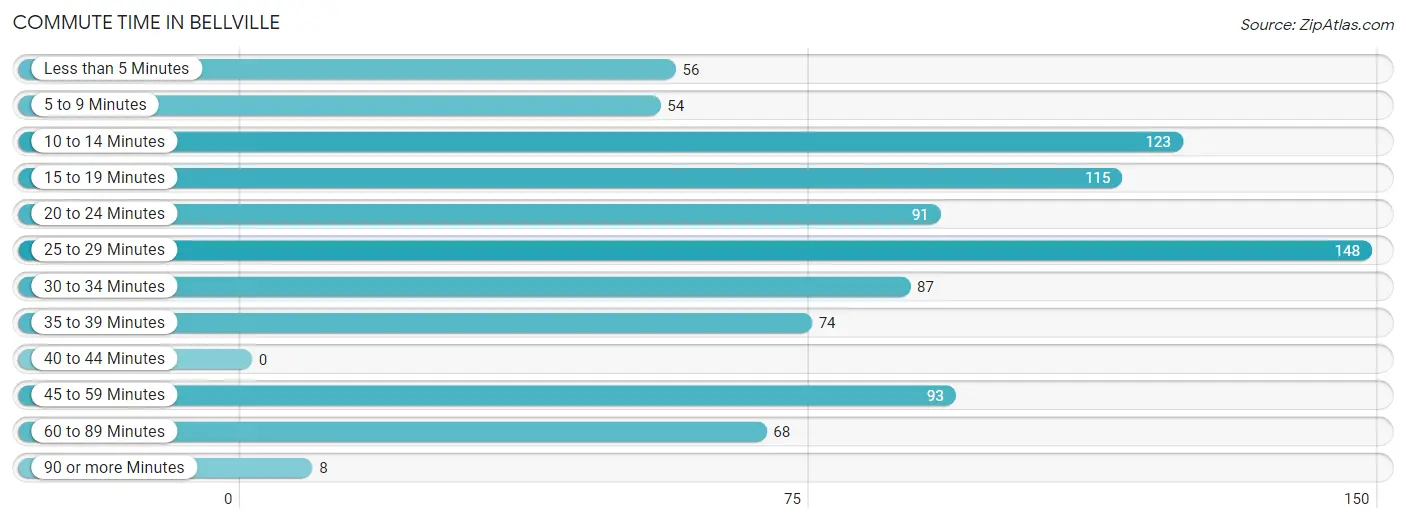
| Commute Time | # Commuters | % Commuters |
| Less than 5 Minutes | 56 | 6.1% |
| 5 to 9 Minutes | 54 | 5.9% |
| 10 to 14 Minutes | 123 | 13.4% |
| 15 to 19 Minutes | 115 | 12.5% |
| 20 to 24 Minutes | 91 | 9.9% |
| 25 to 29 Minutes | 148 | 16.1% |
| 30 to 34 Minutes | 87 | 9.5% |
| 35 to 39 Minutes | 74 | 8.1% |
| 40 to 44 Minutes | 0 | 0.0% |
| 45 to 59 Minutes | 93 | 10.1% |
| 60 to 89 Minutes | 68 | 7.4% |
| 90 or more Minutes | 8 | 0.9% |
Commute Time by Sex in Bellville
The most common commute times in Bellville are 25 to 29 minutes (69 commuters, 14.8%) for males and 10 to 14 minutes (80 commuters, 17.8%) for females.
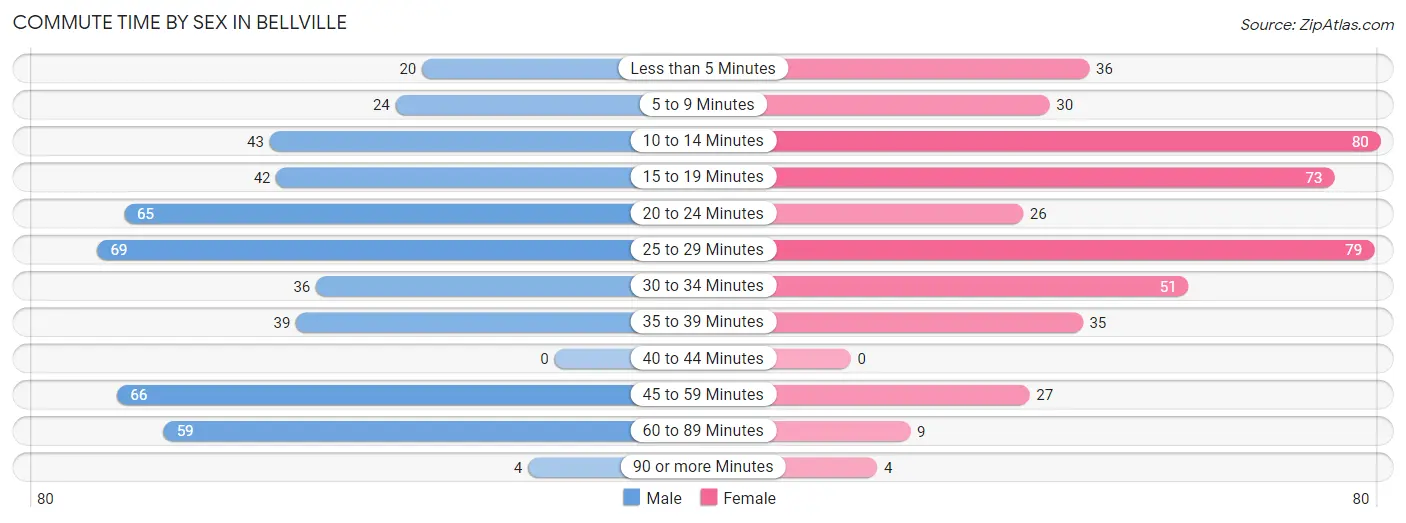
| Commute Time | Male | Female |
| Less than 5 Minutes | 20 (4.3%) | 36 (8.0%) |
| 5 to 9 Minutes | 24 (5.1%) | 30 (6.7%) |
| 10 to 14 Minutes | 43 (9.2%) | 80 (17.8%) |
| 15 to 19 Minutes | 42 (9.0%) | 73 (16.2%) |
| 20 to 24 Minutes | 65 (13.9%) | 26 (5.8%) |
| 25 to 29 Minutes | 69 (14.8%) | 79 (17.6%) |
| 30 to 34 Minutes | 36 (7.7%) | 51 (11.3%) |
| 35 to 39 Minutes | 39 (8.4%) | 35 (7.8%) |
| 40 to 44 Minutes | 0 (0.0%) | 0 (0.0%) |
| 45 to 59 Minutes | 66 (14.1%) | 27 (6.0%) |
| 60 to 89 Minutes | 59 (12.6%) | 9 (2.0%) |
| 90 or more Minutes | 4 (0.9%) | 4 (0.9%) |
Time of Departure to Work by Sex in Bellville
The most frequent times of departure to work in Bellville are 6:30 AM to 6:59 AM (78, 16.7%) for males and 12:00 PM to 3:59 PM (62, 13.8%) for females.
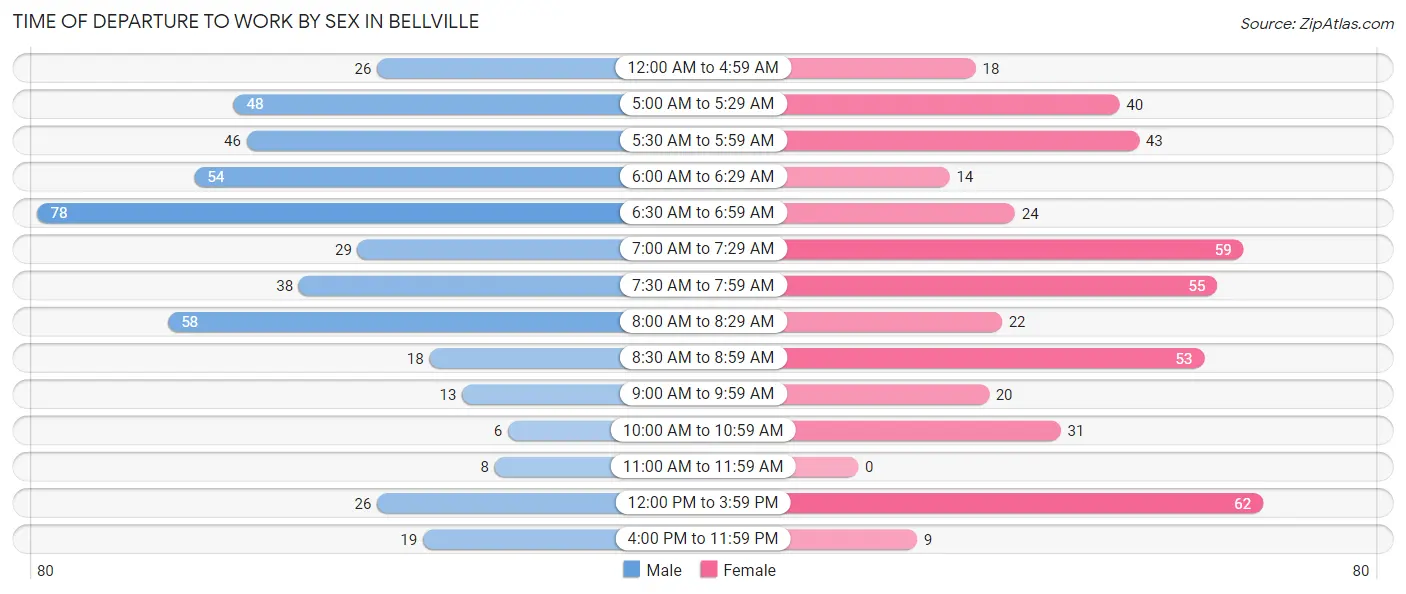
| Time of Departure | Male | Female |
| 12:00 AM to 4:59 AM | 26 (5.6%) | 18 (4.0%) |
| 5:00 AM to 5:29 AM | 48 (10.3%) | 40 (8.9%) |
| 5:30 AM to 5:59 AM | 46 (9.9%) | 43 (9.6%) |
| 6:00 AM to 6:29 AM | 54 (11.6%) | 14 (3.1%) |
| 6:30 AM to 6:59 AM | 78 (16.7%) | 24 (5.3%) |
| 7:00 AM to 7:29 AM | 29 (6.2%) | 59 (13.1%) |
| 7:30 AM to 7:59 AM | 38 (8.1%) | 55 (12.2%) |
| 8:00 AM to 8:29 AM | 58 (12.4%) | 22 (4.9%) |
| 8:30 AM to 8:59 AM | 18 (3.8%) | 53 (11.8%) |
| 9:00 AM to 9:59 AM | 13 (2.8%) | 20 (4.4%) |
| 10:00 AM to 10:59 AM | 6 (1.3%) | 31 (6.9%) |
| 11:00 AM to 11:59 AM | 8 (1.7%) | 0 (0.0%) |
| 12:00 PM to 3:59 PM | 26 (5.6%) | 62 (13.8%) |
| 4:00 PM to 11:59 PM | 19 (4.1%) | 9 (2.0%) |
| Total | 467 (100.0%) | 450 (100.0%) |
Housing Occupancy in Bellville
Occupancy by Ownership in Bellville
Of the total 794 dwellings in Bellville, owner-occupied units account for 526 (66.2%), while renter-occupied units make up 268 (33.8%).
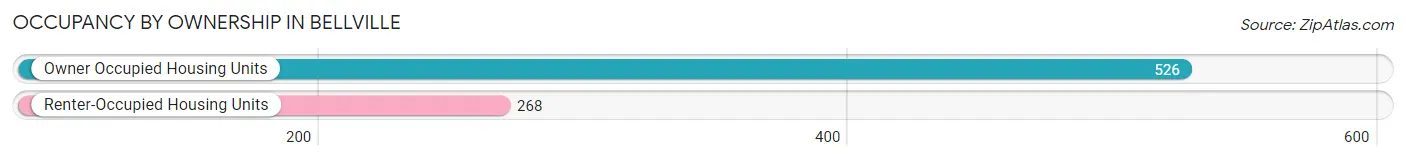
| Occupancy | # Housing Units | % Housing Units |
| Owner Occupied Housing Units | 526 | 66.2% |
| Renter-Occupied Housing Units | 268 | 33.8% |
| Total Occupied Housing Units | 794 | 100.0% |
Occupancy by Household Size in Bellville
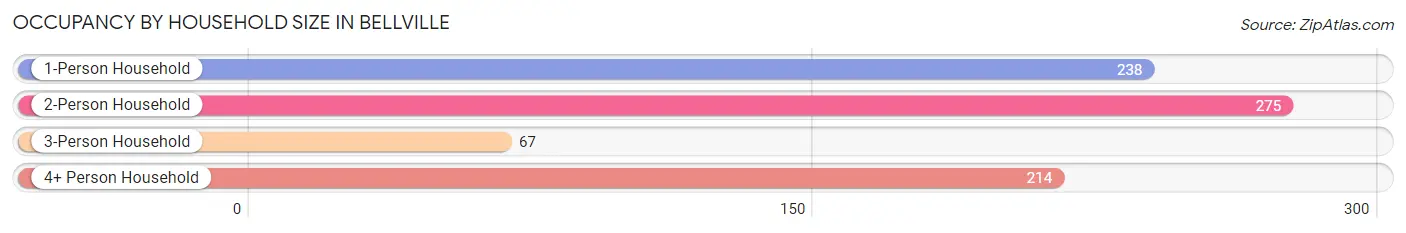
| Household Size | # Housing Units | % Housing Units |
| 1-Person Household | 238 | 30.0% |
| 2-Person Household | 275 | 34.6% |
| 3-Person Household | 67 | 8.4% |
| 4+ Person Household | 214 | 27.0% |
| Total Housing Units | 794 | 100.0% |
Occupancy by Ownership by Household Size in Bellville
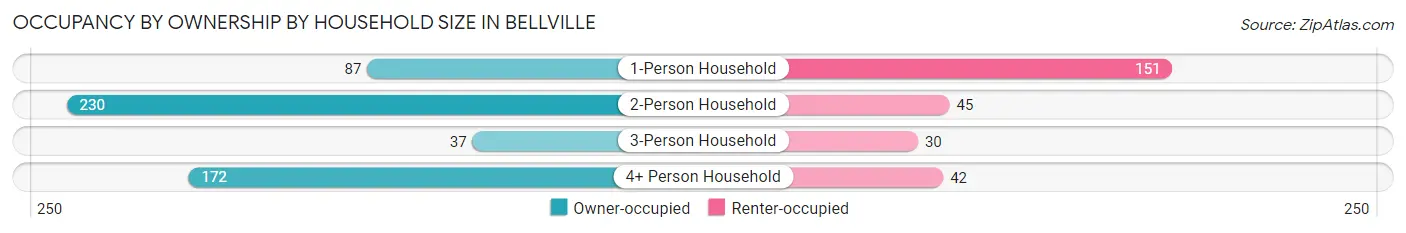
| Household Size | Owner-occupied | Renter-occupied |
| 1-Person Household | 87 (36.5%) | 151 (63.4%) |
| 2-Person Household | 230 (83.6%) | 45 (16.4%) |
| 3-Person Household | 37 (55.2%) | 30 (44.8%) |
| 4+ Person Household | 172 (80.4%) | 42 (19.6%) |
| Total Housing Units | 526 (66.2%) | 268 (33.8%) |
Occupancy by Educational Attainment in Bellville
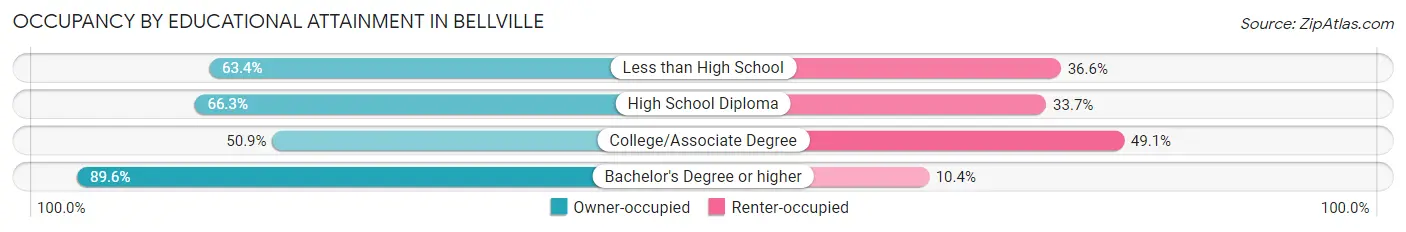
| Household Size | Owner-occupied | Renter-occupied |
| Less than High School | 26 (63.4%) | 15 (36.6%) |
| High School Diploma | 183 (66.3%) | 93 (33.7%) |
| College/Associate Degree | 145 (50.9%) | 140 (49.1%) |
| Bachelor's Degree or higher | 172 (89.6%) | 20 (10.4%) |
Occupancy by Age of Householder in Bellville
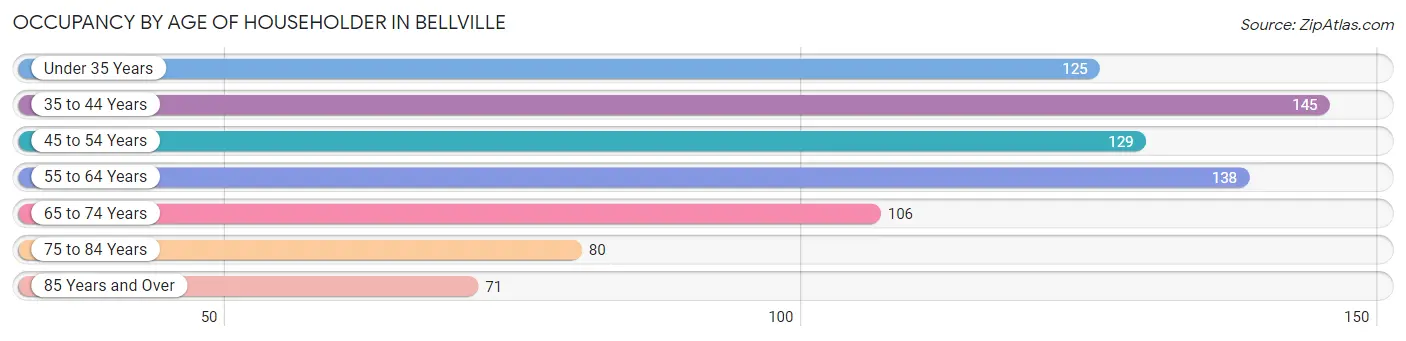
| Age Bracket | # Households | % Households |
| Under 35 Years | 125 | 15.7% |
| 35 to 44 Years | 145 | 18.3% |
| 45 to 54 Years | 129 | 16.3% |
| 55 to 64 Years | 138 | 17.4% |
| 65 to 74 Years | 106 | 13.4% |
| 75 to 84 Years | 80 | 10.1% |
| 85 Years and Over | 71 | 8.9% |
| Total | 794 | 100.0% |
Housing Finances in Bellville
Median Income by Occupancy in Bellville
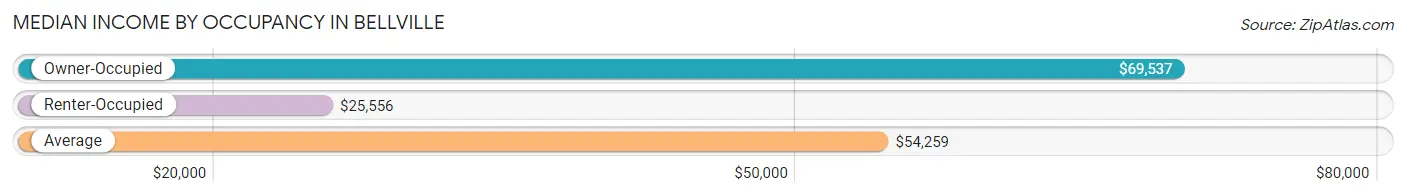
| Occupancy Type | # Households | Median Income |
| Owner-Occupied | 526 (66.2%) | $69,537 |
| Renter-Occupied | 268 (33.8%) | $25,556 |
| Average | 794 (100.0%) | $54,259 |
Occupancy by Householder Income Bracket in Bellville
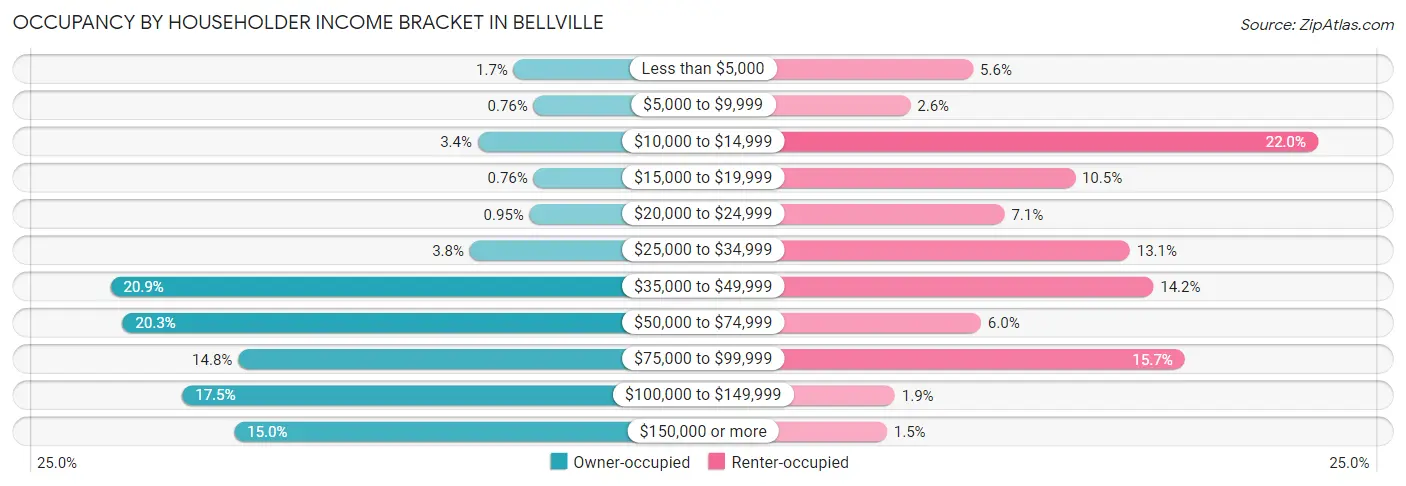
| Income Bracket | Owner-occupied | Renter-occupied |
| Less than $5,000 | 9 (1.7%) | 15 (5.6%) |
| $5,000 to $9,999 | 4 (0.8%) | 7 (2.6%) |
| $10,000 to $14,999 | 18 (3.4%) | 59 (22.0%) |
| $15,000 to $19,999 | 4 (0.8%) | 28 (10.4%) |
| $20,000 to $24,999 | 5 (0.9%) | 19 (7.1%) |
| $25,000 to $34,999 | 20 (3.8%) | 35 (13.1%) |
| $35,000 to $49,999 | 110 (20.9%) | 38 (14.2%) |
| $50,000 to $74,999 | 107 (20.3%) | 16 (6.0%) |
| $75,000 to $99,999 | 78 (14.8%) | 42 (15.7%) |
| $100,000 to $149,999 | 92 (17.5%) | 5 (1.9%) |
| $150,000 or more | 79 (15.0%) | 4 (1.5%) |
| Total | 526 (100.0%) | 268 (100.0%) |
Monthly Housing Cost Tiers in Bellville
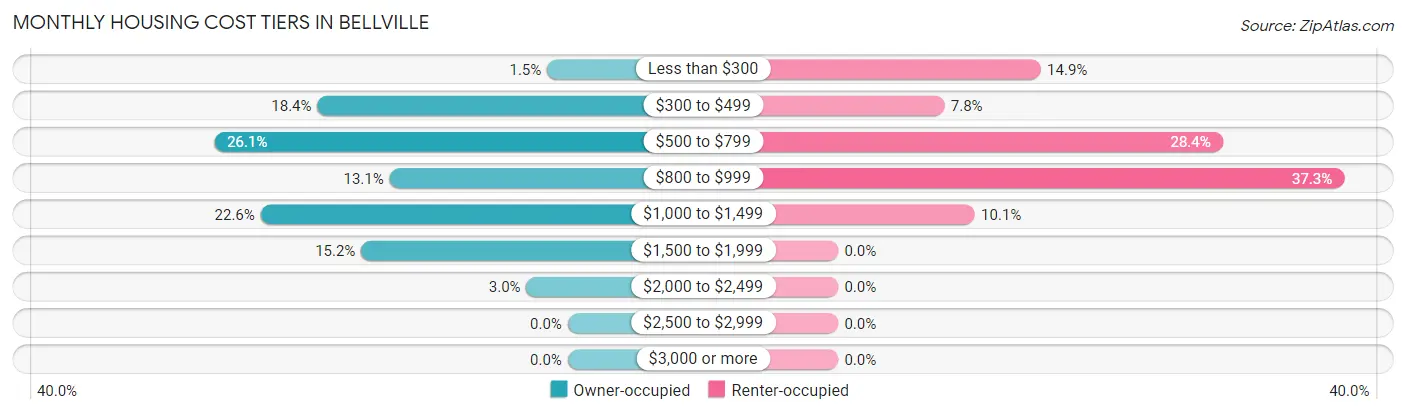
| Monthly Cost | Owner-occupied | Renter-occupied |
| Less than $300 | 8 (1.5%) | 40 (14.9%) |
| $300 to $499 | 97 (18.4%) | 21 (7.8%) |
| $500 to $799 | 137 (26.1%) | 76 (28.4%) |
| $800 to $999 | 69 (13.1%) | 100 (37.3%) |
| $1,000 to $1,499 | 119 (22.6%) | 27 (10.1%) |
| $1,500 to $1,999 | 80 (15.2%) | 0 (0.0%) |
| $2,000 to $2,499 | 16 (3.0%) | 0 (0.0%) |
| $2,500 to $2,999 | 0 (0.0%) | 0 (0.0%) |
| $3,000 or more | 0 (0.0%) | 0 (0.0%) |
| Total | 526 (100.0%) | 268 (100.0%) |
Physical Housing Characteristics in Bellville
Housing Structures in Bellville
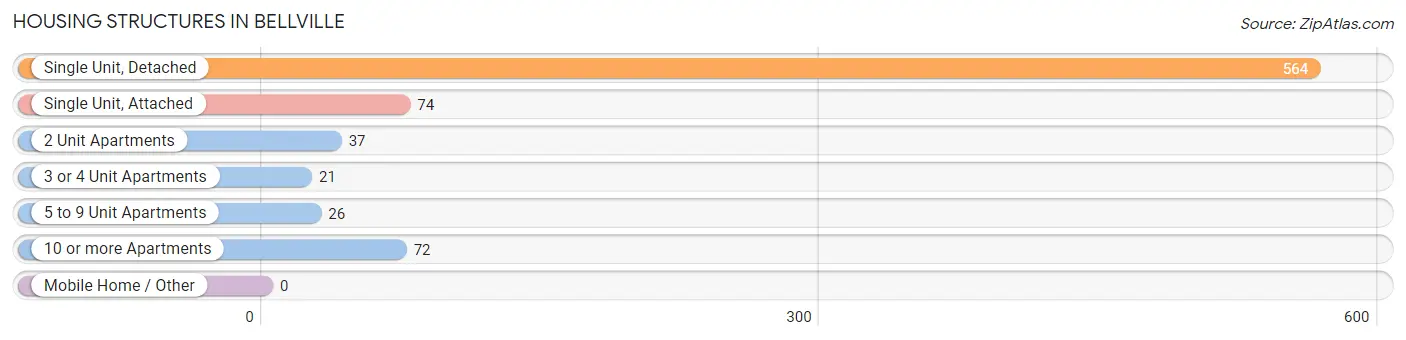
| Structure Type | # Housing Units | % Housing Units |
| Single Unit, Detached | 564 | 71.0% |
| Single Unit, Attached | 74 | 9.3% |
| 2 Unit Apartments | 37 | 4.7% |
| 3 or 4 Unit Apartments | 21 | 2.6% |
| 5 to 9 Unit Apartments | 26 | 3.3% |
| 10 or more Apartments | 72 | 9.1% |
| Mobile Home / Other | 0 | 0.0% |
| Total | 794 | 100.0% |
Housing Structures by Occupancy in Bellville
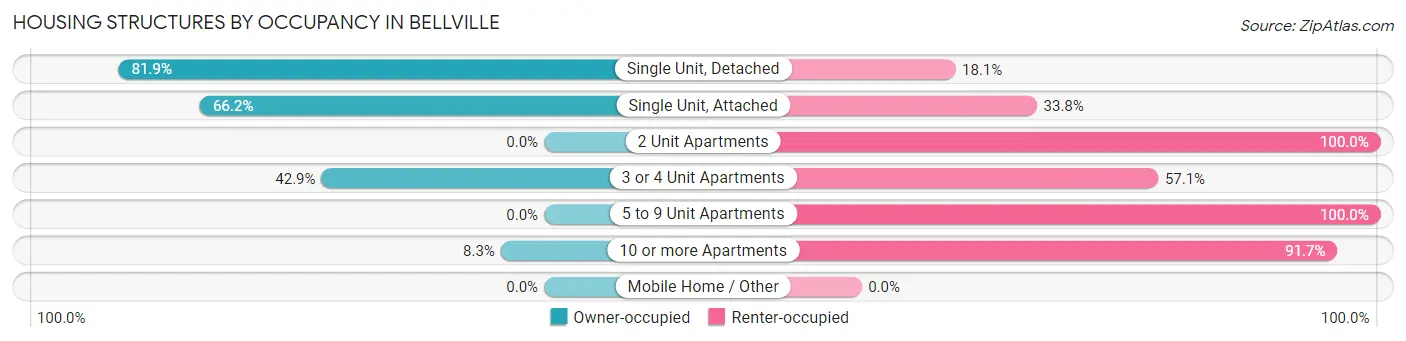
| Structure Type | Owner-occupied | Renter-occupied |
| Single Unit, Detached | 462 (81.9%) | 102 (18.1%) |
| Single Unit, Attached | 49 (66.2%) | 25 (33.8%) |
| 2 Unit Apartments | 0 (0.0%) | 37 (100.0%) |
| 3 or 4 Unit Apartments | 9 (42.9%) | 12 (57.1%) |
| 5 to 9 Unit Apartments | 0 (0.0%) | 26 (100.0%) |
| 10 or more Apartments | 6 (8.3%) | 66 (91.7%) |
| Mobile Home / Other | 0 (0.0%) | 0 (0.0%) |
| Total | 526 (66.2%) | 268 (33.8%) |
Housing Structures by Number of Rooms in Bellville
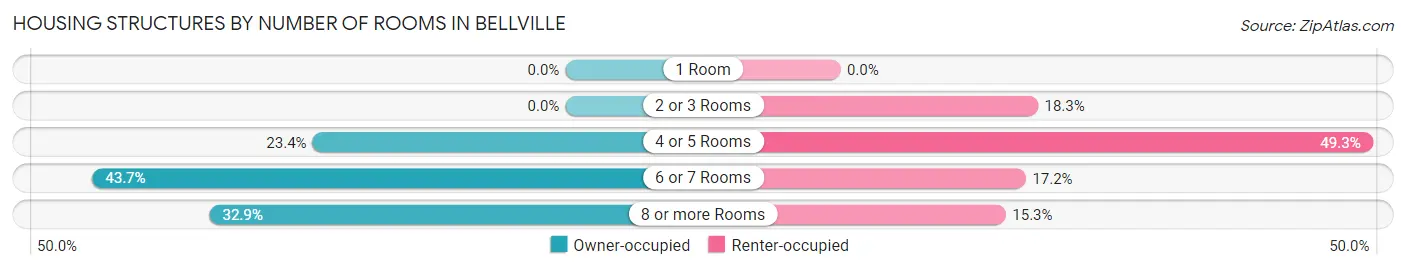
| Number of Rooms | Owner-occupied | Renter-occupied |
| 1 Room | 0 (0.0%) | 0 (0.0%) |
| 2 or 3 Rooms | 0 (0.0%) | 49 (18.3%) |
| 4 or 5 Rooms | 123 (23.4%) | 132 (49.2%) |
| 6 or 7 Rooms | 230 (43.7%) | 46 (17.2%) |
| 8 or more Rooms | 173 (32.9%) | 41 (15.3%) |
| Total | 526 (100.0%) | 268 (100.0%) |
Housing Structure by Heating Type in Bellville
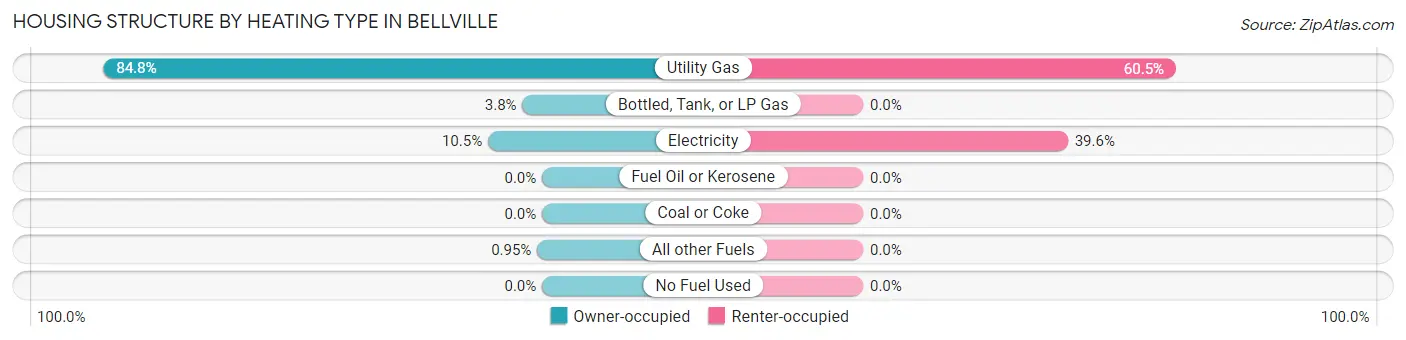
| Heating Type | Owner-occupied | Renter-occupied |
| Utility Gas | 446 (84.8%) | 162 (60.5%) |
| Bottled, Tank, or LP Gas | 20 (3.8%) | 0 (0.0%) |
| Electricity | 55 (10.5%) | 106 (39.6%) |
| Fuel Oil or Kerosene | 0 (0.0%) | 0 (0.0%) |
| Coal or Coke | 0 (0.0%) | 0 (0.0%) |
| All other Fuels | 5 (0.9%) | 0 (0.0%) |
| No Fuel Used | 0 (0.0%) | 0 (0.0%) |
| Total | 526 (100.0%) | 268 (100.0%) |
Household Vehicle Usage in Bellville
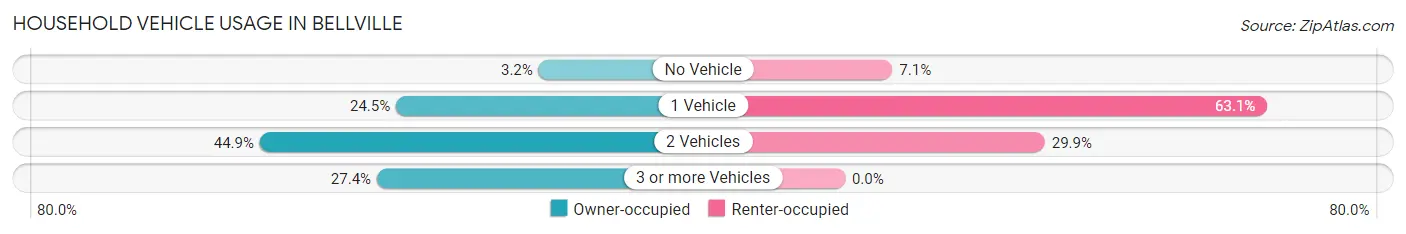
| Vehicles per Household | Owner-occupied | Renter-occupied |
| No Vehicle | 17 (3.2%) | 19 (7.1%) |
| 1 Vehicle | 129 (24.5%) | 169 (63.1%) |
| 2 Vehicles | 236 (44.9%) | 80 (29.8%) |
| 3 or more Vehicles | 144 (27.4%) | 0 (0.0%) |
| Total | 526 (100.0%) | 268 (100.0%) |
Real Estate & Mortgages in Bellville
Real Estate and Mortgage Overview in Bellville
| Characteristic | Without Mortgage | With Mortgage |
| Housing Units | 237 | 289 |
| Median Property Value | $172,800 | $155,500 |
| Median Household Income | $52,596 | $38 |
| Monthly Housing Costs | $540 | $0 |
| Real Estate Taxes | $2,351 | $0 |
Property Value by Mortgage Status in Bellville
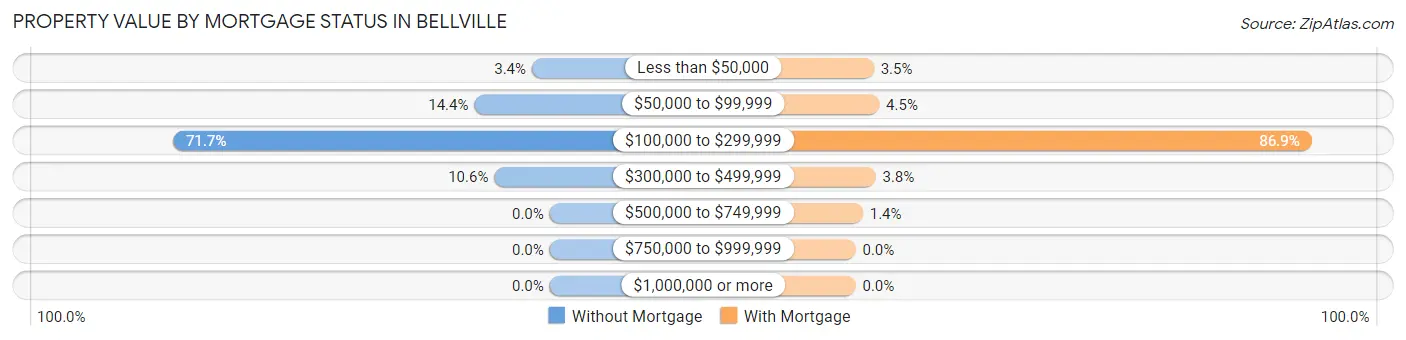
| Property Value | Without Mortgage | With Mortgage |
| Less than $50,000 | 8 (3.4%) | 10 (3.5%) |
| $50,000 to $99,999 | 34 (14.3%) | 13 (4.5%) |
| $100,000 to $299,999 | 170 (71.7%) | 251 (86.9%) |
| $300,000 to $499,999 | 25 (10.5%) | 11 (3.8%) |
| $500,000 to $749,999 | 0 (0.0%) | 4 (1.4%) |
| $750,000 to $999,999 | 0 (0.0%) | 0 (0.0%) |
| $1,000,000 or more | 0 (0.0%) | 0 (0.0%) |
| Total | 237 (100.0%) | 289 (100.0%) |
Household Income by Mortgage Status in Bellville
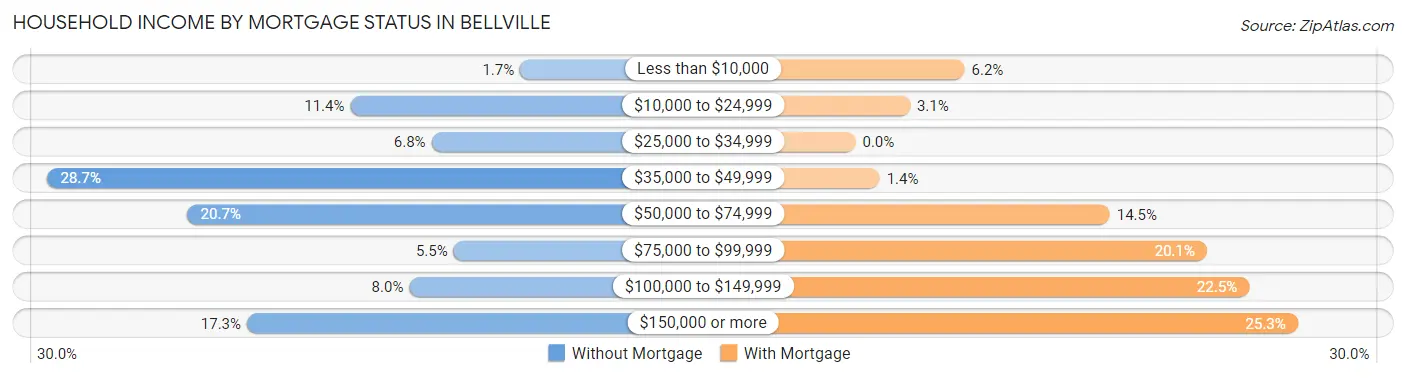
| Household Income | Without Mortgage | With Mortgage |
| Less than $10,000 | 4 (1.7%) | 18 (6.2%) |
| $10,000 to $24,999 | 27 (11.4%) | 9 (3.1%) |
| $25,000 to $34,999 | 16 (6.8%) | 0 (0.0%) |
| $35,000 to $49,999 | 68 (28.7%) | 4 (1.4%) |
| $50,000 to $74,999 | 49 (20.7%) | 42 (14.5%) |
| $75,000 to $99,999 | 13 (5.5%) | 58 (20.1%) |
| $100,000 to $149,999 | 19 (8.0%) | 65 (22.5%) |
| $150,000 or more | 41 (17.3%) | 73 (25.3%) |
| Total | 237 (100.0%) | 289 (100.0%) |
Property Value to Household Income Ratio in Bellville
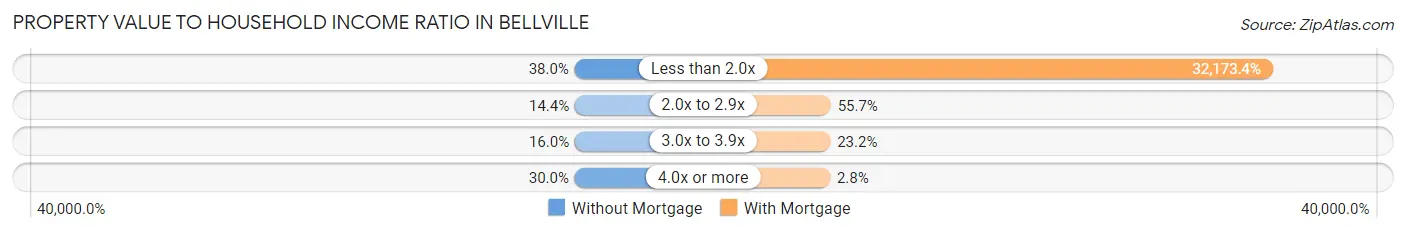
| Value-to-Income Ratio | Without Mortgage | With Mortgage |
| Less than 2.0x | 90 (38.0%) | 92,981 (32,173.4%) |
| 2.0x to 2.9x | 34 (14.3%) | 161 (55.7%) |
| 3.0x to 3.9x | 38 (16.0%) | 67 (23.2%) |
| 4.0x or more | 71 (30.0%) | 8 (2.8%) |
| Total | 237 (100.0%) | 289 (100.0%) |
Real Estate Taxes by Mortgage Status in Bellville
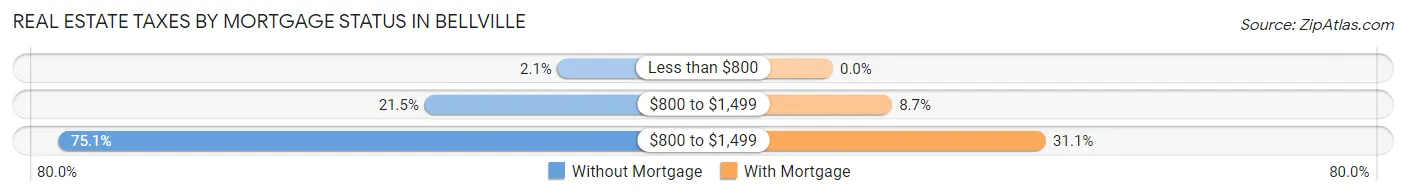
| Property Taxes | Without Mortgage | With Mortgage |
| Less than $800 | 5 (2.1%) | 0 (0.0%) |
| $800 to $1,499 | 51 (21.5%) | 25 (8.6%) |
| $800 to $1,499 | 178 (75.1%) | 90 (31.1%) |
| Total | 237 (100.0%) | 289 (100.0%) |
Health & Disability in Bellville
Health Insurance Coverage by Age in Bellville
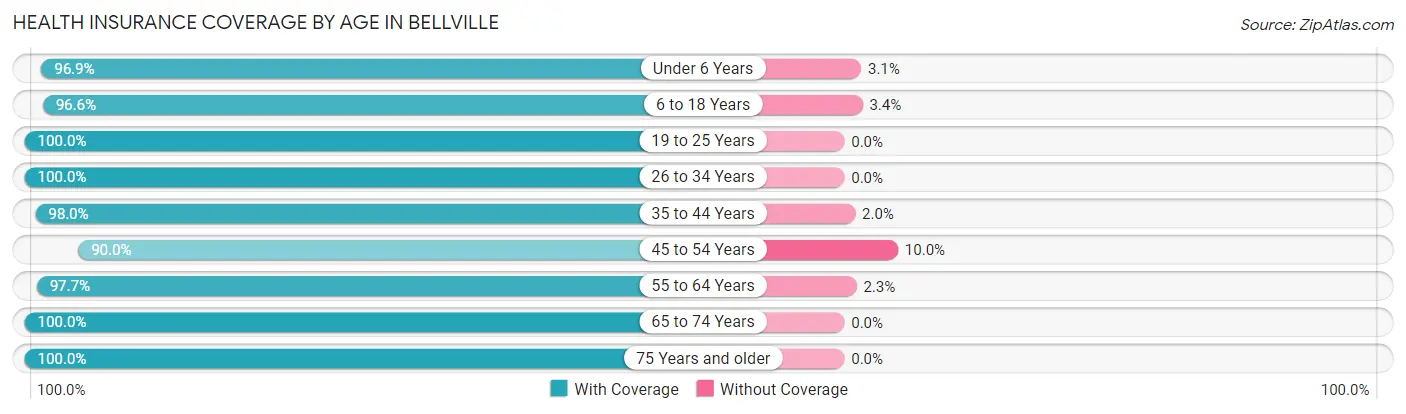
| Age Bracket | With Coverage | Without Coverage |
| Under 6 Years | 124 (96.9%) | 4 (3.1%) |
| 6 to 18 Years | 427 (96.6%) | 15 (3.4%) |
| 19 to 25 Years | 125 (100.0%) | 0 (0.0%) |
| 26 to 34 Years | 159 (100.0%) | 0 (0.0%) |
| 35 to 44 Years | 244 (98.0%) | 5 (2.0%) |
| 45 to 54 Years | 198 (90.0%) | 22 (10.0%) |
| 55 to 64 Years | 215 (97.7%) | 5 (2.3%) |
| 65 to 74 Years | 187 (100.0%) | 0 (0.0%) |
| 75 Years and older | 248 (100.0%) | 0 (0.0%) |
| Total | 1,927 (97.4%) | 51 (2.6%) |
Health Insurance Coverage by Citizenship Status in Bellville
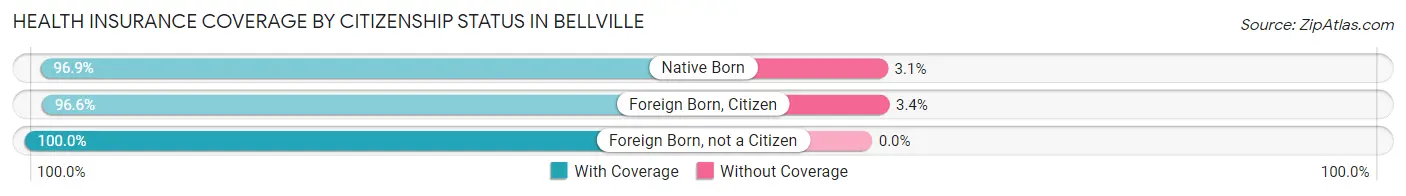
| Citizenship Status | With Coverage | Without Coverage |
| Native Born | 124 (96.9%) | 4 (3.1%) |
| Foreign Born, Citizen | 427 (96.6%) | 15 (3.4%) |
| Foreign Born, not a Citizen | 125 (100.0%) | 0 (0.0%) |
Health Insurance Coverage by Household Income in Bellville
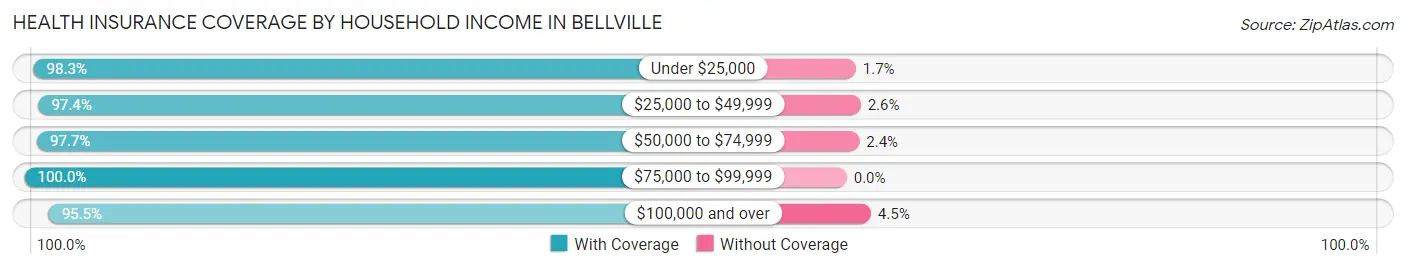
| Household Income | With Coverage | Without Coverage |
| Under $25,000 | 231 (98.3%) | 4 (1.7%) |
| $25,000 to $49,999 | 373 (97.4%) | 10 (2.6%) |
| $50,000 to $74,999 | 332 (97.7%) | 8 (2.4%) |
| $75,000 to $99,999 | 379 (100.0%) | 0 (0.0%) |
| $100,000 and over | 612 (95.5%) | 29 (4.5%) |
Public vs Private Health Insurance Coverage by Age in Bellville
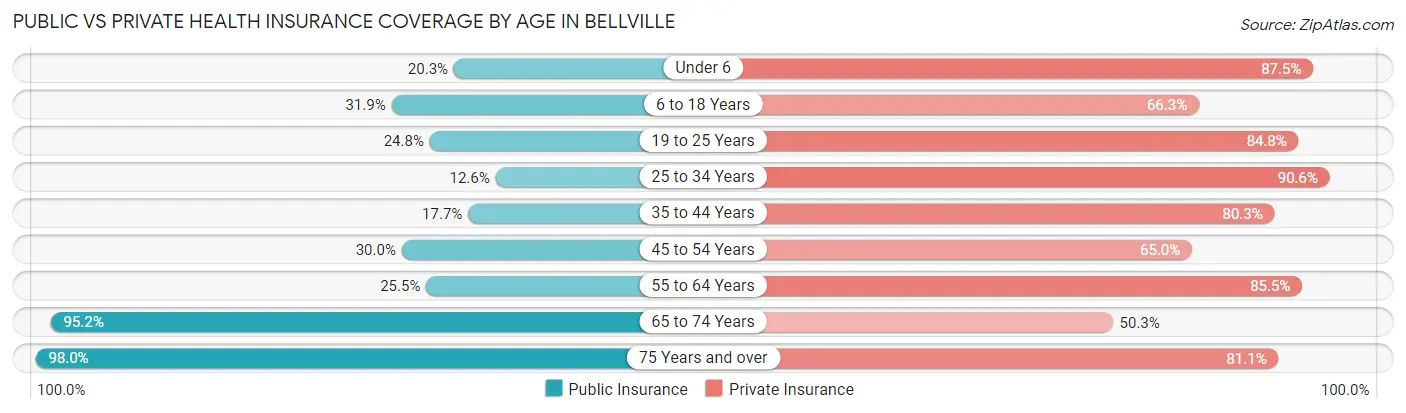
| Age Bracket | Public Insurance | Private Insurance |
| Under 6 | 26 (20.3%) | 112 (87.5%) |
| 6 to 18 Years | 141 (31.9%) | 293 (66.3%) |
| 19 to 25 Years | 31 (24.8%) | 106 (84.8%) |
| 25 to 34 Years | 20 (12.6%) | 144 (90.6%) |
| 35 to 44 Years | 44 (17.7%) | 200 (80.3%) |
| 45 to 54 Years | 66 (30.0%) | 143 (65.0%) |
| 55 to 64 Years | 56 (25.5%) | 188 (85.5%) |
| 65 to 74 Years | 178 (95.2%) | 94 (50.3%) |
| 75 Years and over | 243 (98.0%) | 201 (81.0%) |
| Total | 805 (40.7%) | 1,481 (74.9%) |
Disability Status by Sex by Age in Bellville
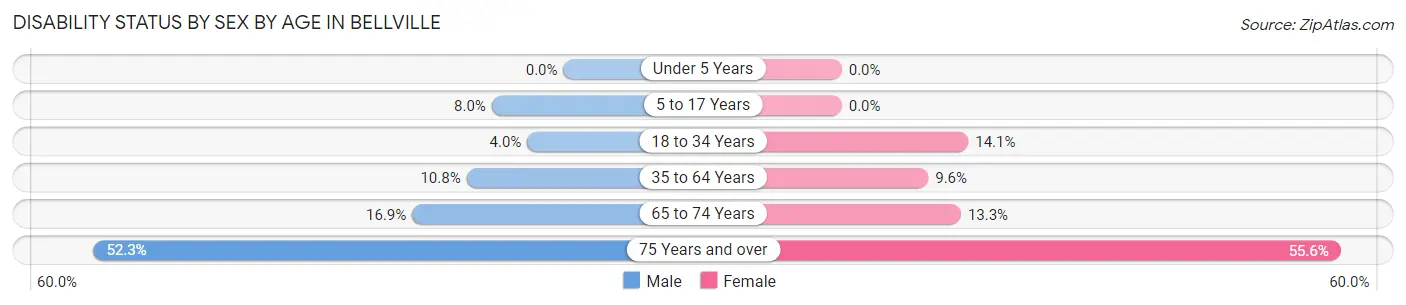
| Age Bracket | Male | Female |
| Under 5 Years | 0 (0.0%) | 0 (0.0%) |
| 5 to 17 Years | 21 (8.0%) | 0 (0.0%) |
| 18 to 34 Years | 6 (4.0%) | 21 (14.1%) |
| 35 to 64 Years | 34 (10.8%) | 36 (9.6%) |
| 65 to 74 Years | 15 (16.9%) | 13 (13.3%) |
| 75 Years and over | 45 (52.3%) | 90 (55.6%) |
Disability Class by Sex by Age in Bellville
Disability Class: Hearing Difficulty
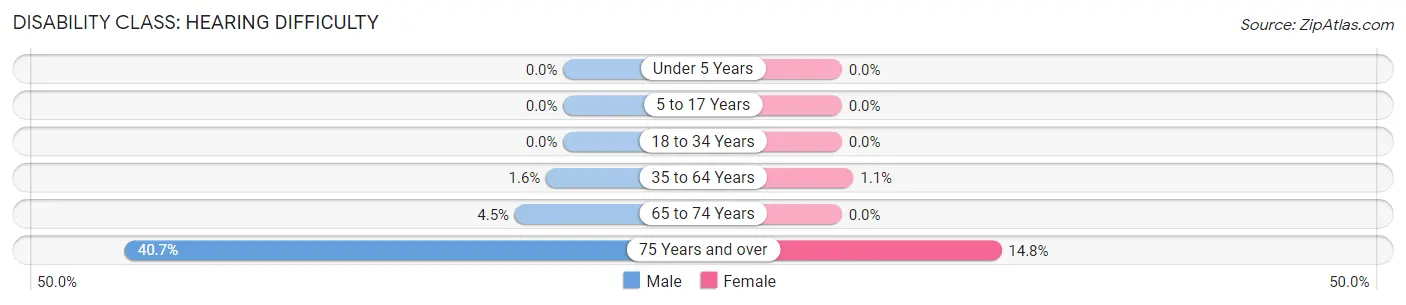
| Age Bracket | Male | Female |
| Under 5 Years | 0 (0.0%) | 0 (0.0%) |
| 5 to 17 Years | 0 (0.0%) | 0 (0.0%) |
| 18 to 34 Years | 0 (0.0%) | 0 (0.0%) |
| 35 to 64 Years | 5 (1.6%) | 4 (1.1%) |
| 65 to 74 Years | 4 (4.5%) | 0 (0.0%) |
| 75 Years and over | 35 (40.7%) | 24 (14.8%) |
Disability Class: Vision Difficulty
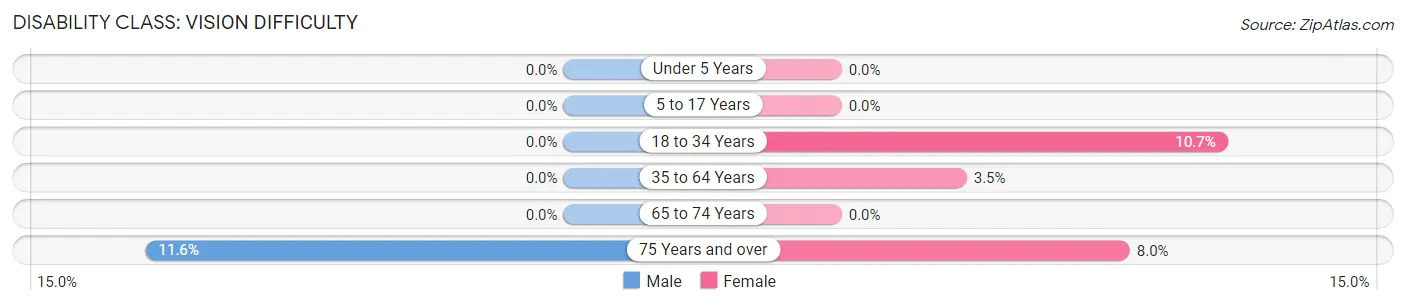
| Age Bracket | Male | Female |
| Under 5 Years | 0 (0.0%) | 0 (0.0%) |
| 5 to 17 Years | 0 (0.0%) | 0 (0.0%) |
| 18 to 34 Years | 0 (0.0%) | 16 (10.7%) |
| 35 to 64 Years | 0 (0.0%) | 13 (3.5%) |
| 65 to 74 Years | 0 (0.0%) | 0 (0.0%) |
| 75 Years and over | 10 (11.6%) | 13 (8.0%) |
Disability Class: Cognitive Difficulty
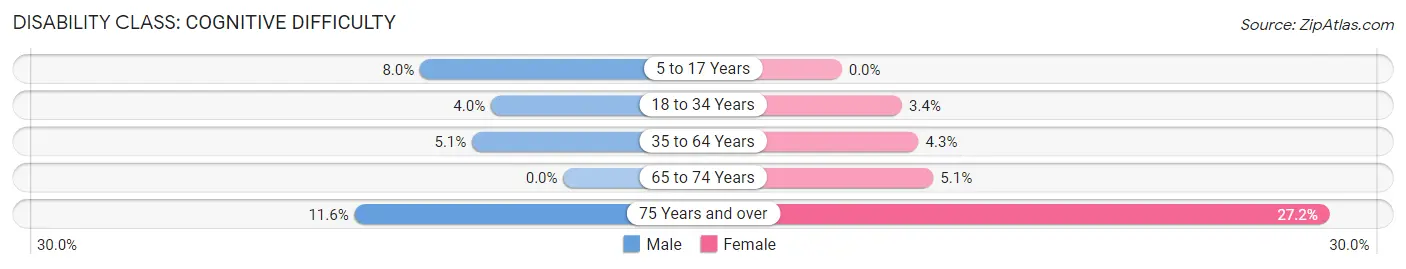
| Age Bracket | Male | Female |
| 5 to 17 Years | 21 (8.0%) | 0 (0.0%) |
| 18 to 34 Years | 6 (4.0%) | 5 (3.4%) |
| 35 to 64 Years | 16 (5.1%) | 16 (4.3%) |
| 65 to 74 Years | 0 (0.0%) | 5 (5.1%) |
| 75 Years and over | 10 (11.6%) | 44 (27.2%) |
Disability Class: Ambulatory Difficulty
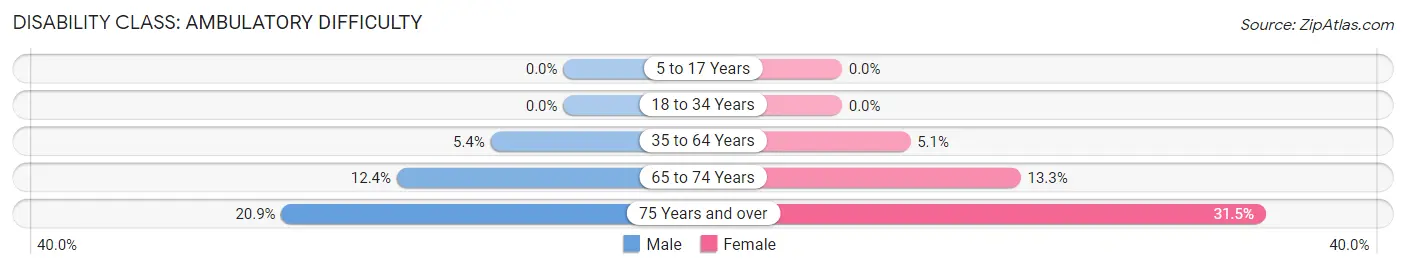
| Age Bracket | Male | Female |
| 5 to 17 Years | 0 (0.0%) | 0 (0.0%) |
| 18 to 34 Years | 0 (0.0%) | 0 (0.0%) |
| 35 to 64 Years | 17 (5.4%) | 19 (5.1%) |
| 65 to 74 Years | 11 (12.4%) | 13 (13.3%) |
| 75 Years and over | 18 (20.9%) | 51 (31.5%) |
Disability Class: Self-Care Difficulty
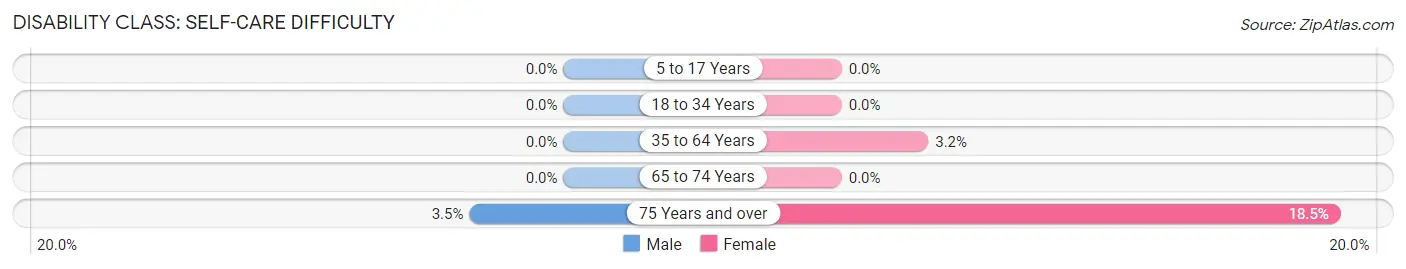
| Age Bracket | Male | Female |
| 5 to 17 Years | 0 (0.0%) | 0 (0.0%) |
| 18 to 34 Years | 0 (0.0%) | 0 (0.0%) |
| 35 to 64 Years | 0 (0.0%) | 12 (3.2%) |
| 65 to 74 Years | 0 (0.0%) | 0 (0.0%) |
| 75 Years and over | 3 (3.5%) | 30 (18.5%) |
Technology Access in Bellville
Computing Device Access in Bellville
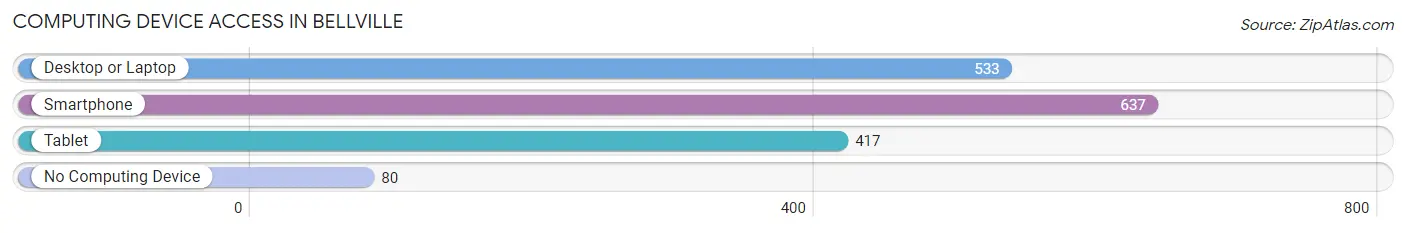
| Device Type | # Households | % Households |
| Desktop or Laptop | 533 | 67.1% |
| Smartphone | 637 | 80.2% |
| Tablet | 417 | 52.5% |
| No Computing Device | 80 | 10.1% |
| Total | 794 | 100.0% |
Internet Access in Bellville
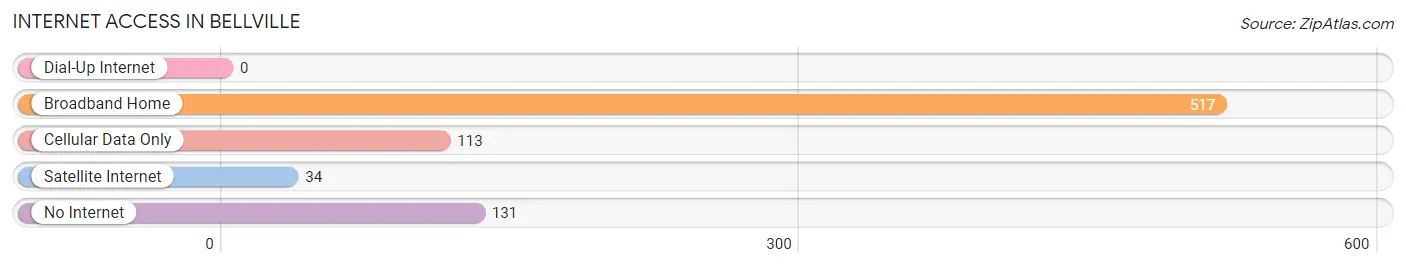
| Internet Type | # Households | % Households |
| Dial-Up Internet | 0 | 0.0% |
| Broadband Home | 517 | 65.1% |
| Cellular Data Only | 113 | 14.2% |
| Satellite Internet | 34 | 4.3% |
| No Internet | 131 | 16.5% |
| Total | 794 | 100.0% |
Bellville Summary
Bellville, Ohio is a small village located in Richland County, Ohio. It is situated in the north-central part of the state, approximately 30 miles north of Columbus. The village has a population of approximately 2,500 people and is part of the Mansfield Metropolitan Statistical Area.
History
Bellville was founded in 1815 by a group of settlers from Pennsylvania. The village was named after the Bell family, who were among the first settlers. The village was incorporated in 1837 and has remained a small, rural community ever since.
The village was an important stop on the Underground Railroad, with many of the local residents helping to hide and transport escaped slaves. During the Civil War, the village was home to a large number of Union soldiers.
Geography
Bellville is located in north-central Ohio, approximately 30 miles north of Columbus. The village is situated in the western part of Richland County, near the border with Ashland County. The village is located in the Mohican Valley, which is part of the Appalachian Plateau. The village is surrounded by rolling hills and forests, and is home to several small lakes and streams.
The climate in Bellville is typical of the Midwest, with hot summers and cold winters. The average annual temperature is around 50 degrees Fahrenheit, with an average high of around 75 degrees in the summer and an average low of around 25 degrees in the winter.
Economy
The economy of Bellville is largely based on agriculture and manufacturing. The village is home to several small farms, which produce a variety of crops, including corn, soybeans, and wheat. The village is also home to several small manufacturing companies, which produce a variety of products, including furniture, automotive parts, and medical supplies.
The village is also home to several small businesses, including restaurants, retail stores, and service providers. The village is also home to a branch of the Richland County Bank, which provides banking services to the local community.
Demographics
As of the 2010 census, the population of Bellville was 2,500. The racial makeup of the village was 97.2% White, 0.8% African American, 0.4% Native American, 0.4% Asian, and 1.2% from other races. The median household income was $41,250, and the median family income was $50,000.
The village is home to a variety of religious denominations, including Baptist, Methodist, Lutheran, and Catholic. The village is also home to a variety of cultural and recreational activities, including a local theater, a public library, and several parks.
Conclusion
Bellville, Ohio is a small village located in Richland County, Ohio. It is situated in the north-central part of the state, approximately 30 miles north of Columbus. The village has a population of approximately 2,500 people and is part of the Mansfield Metropolitan Statistical Area. The village was founded in 1815 and has remained a small, rural community ever since. The economy of Bellville is largely based on agriculture and manufacturing, and the village is home to several small businesses, including restaurants, retail stores, and service providers. The racial makeup of the village is 97.2% White, 0.8% African American, 0.4% Native American, 0.4% Asian, and 1.2% from other races. The village is home to a variety of religious denominations, and a variety of cultural and recreational activities.
Common Questions
What is Per Capita Income in Bellville?
Per Capita income in Bellville is $29,014.
What is the Median Family Income in Bellville?
Median Family Income in Bellville is $74,583.
What is the Median Household income in Bellville?
Median Household Income in Bellville is $54,259.
What is Income or Wage Gap in Bellville?
Income or Wage Gap in Bellville is 43.3%.
Women in Bellville earn 56.7 cents for every dollar earned by a man.
What is Inequality or Gini Index in Bellville?
Inequality or Gini Index in Bellville is 0.43.
What is the Total Population of Bellville?
Total Population of Bellville is 1,995.
What is the Total Male Population of Bellville?
Total Male Population of Bellville is 958.
What is the Total Female Population of Bellville?
Total Female Population of Bellville is 1,037.
What is the Ratio of Males per 100 Females in Bellville?
There are 92.38 Males per 100 Females in Bellville.
What is the Ratio of Females per 100 Males in Bellville?
There are 108.25 Females per 100 Males in Bellville.
What is the Median Population Age in Bellville?
Median Population Age in Bellville is 38.3 Years.
What is the Average Family Size in Bellville
Average Family Size in Bellville is 3.0 People.
What is the Average Household Size in Bellville
Average Household Size in Bellville is 2.5 People.
How Large is the Labor Force in Bellville?
There are 971 People in the Labor Forcein in Bellville.
What is the Percentage of People in the Labor Force in Bellville?
63.2% of People are in the Labor Force in Bellville.
What is the Unemployment Rate in Bellville?
Unemployment Rate in Bellville is 2.0%.