Bellaire, OH Map & Demographics
Bellaire Map
Bellaire Overview
$25,476
PER CAPITA INCOME
$50,882
AVG FAMILY INCOME
$40,650
AVG HOUSEHOLD INCOME
11.6%
WAGE / INCOME GAP [ % ]
88.4¢/ $1
WAGE / INCOME GAP [ $ ]
$10,633
FAMILY INCOME DEFICIT
0.47
INEQUALITY / GINI INDEX
3,878
TOTAL POPULATION
2,067
MALE POPULATION
1,811
FEMALE POPULATION
114.14
MALES / 100 FEMALES
87.61
FEMALES / 100 MALES
35.8
MEDIAN AGE
3.6
AVG FAMILY SIZE
2.5
AVG HOUSEHOLD SIZE
1,810
LABOR FORCE [ PEOPLE ]
59.6%
PERCENT IN LABOR FORCE
9.3%
UNEMPLOYMENT RATE
Bellaire Zip Codes
Bellaire Area Codes
Income in Bellaire
Income Overview in Bellaire
Per Capita Income in Bellaire is $25,476, while median incomes of families and households are $50,882 and $40,650 respectively.
| Characteristic | Number | Measure |
| Per Capita Income | 3,878 | $25,476 |
| Median Family Income | 786 | $50,882 |
| Mean Family Income | 786 | $67,579 |
| Median Household Income | 1,502 | $40,650 |
| Mean Household Income | 1,502 | $60,486 |
| Income Deficit | 786 | $10,633 |
| Wage / Income Gap (%) | 3,878 | 11.62% |
| Wage / Income Gap ($) | 3,878 | 88.38¢ per $1 |
| Gini / Inequality Index | 3,878 | 0.47 |
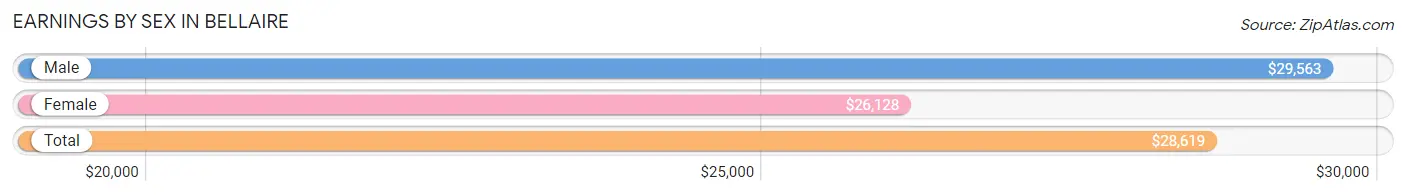
Earnings by Sex in Bellaire
Average Earnings in Bellaire are $28,619, $29,563 for men and $26,128 for women, a difference of 11.6%.
| Sex | Number | Average Earnings |
| Male | 1,079 (58.5%) | $29,563 |
| Female | 765 (41.5%) | $26,128 |
| Total | 1,844 (100.0%) | $28,619 |
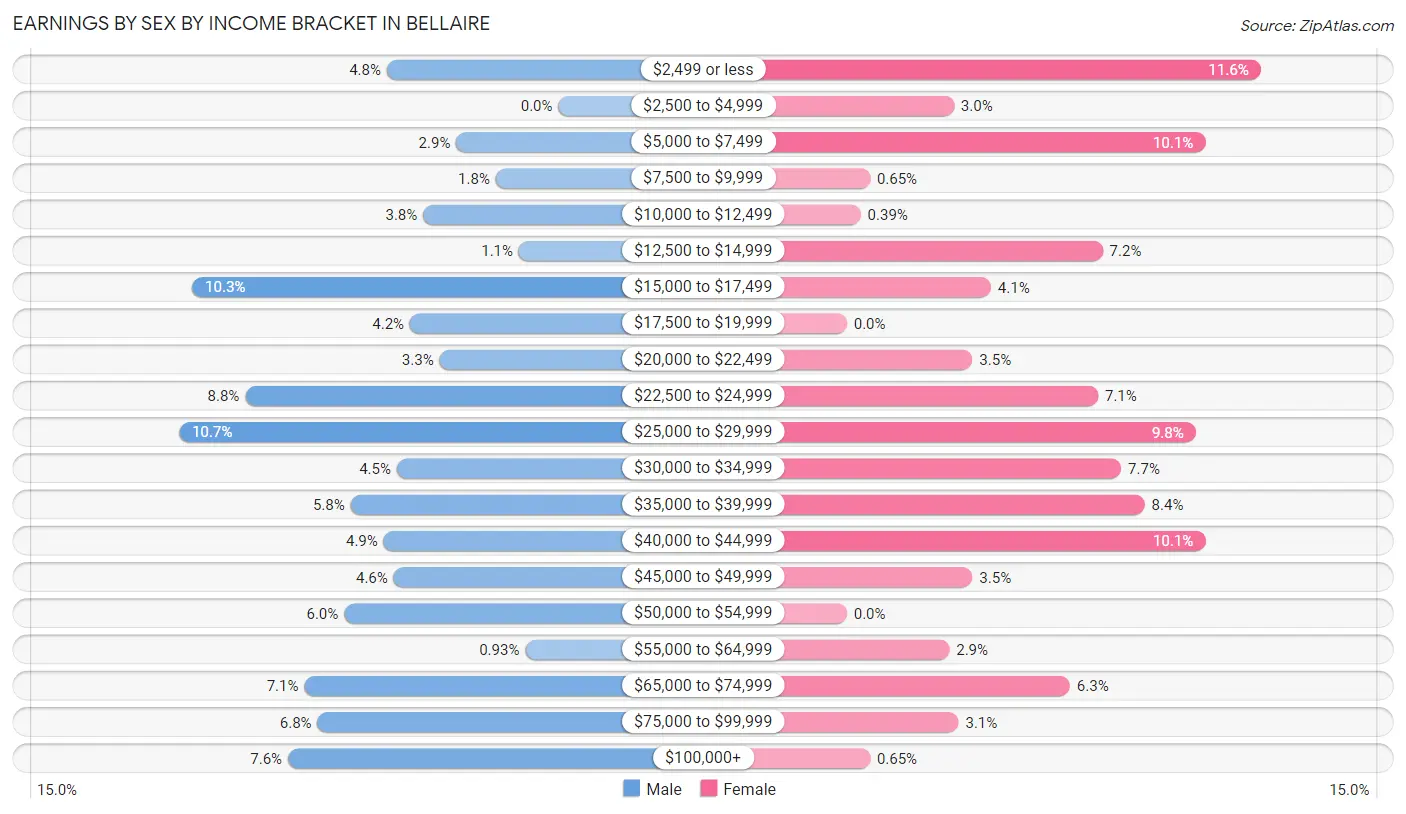
Earnings by Sex by Income Bracket in Bellaire
The most common earnings brackets in Bellaire are $25,000 to $29,999 for men (115 | 10.7%) and $2,499 or less for women (89 | 11.6%).
| Income | Male | Female |
| $2,499 or less | 52 (4.8%) | 89 (11.6%) |
| $2,500 to $4,999 | 0 (0.0%) | 23 (3.0%) |
| $5,000 to $7,499 | 31 (2.9%) | 77 (10.1%) |
| $7,500 to $9,999 | 19 (1.8%) | 5 (0.6%) |
| $10,000 to $12,499 | 41 (3.8%) | 3 (0.4%) |
| $12,500 to $14,999 | 12 (1.1%) | 55 (7.2%) |
| $15,000 to $17,499 | 111 (10.3%) | 31 (4.1%) |
| $17,500 to $19,999 | 45 (4.2%) | 0 (0.0%) |
| $20,000 to $22,499 | 36 (3.3%) | 27 (3.5%) |
| $22,500 to $24,999 | 95 (8.8%) | 54 (7.1%) |
| $25,000 to $29,999 | 115 (10.7%) | 75 (9.8%) |
| $30,000 to $34,999 | 49 (4.5%) | 59 (7.7%) |
| $35,000 to $39,999 | 63 (5.8%) | 64 (8.4%) |
| $40,000 to $44,999 | 53 (4.9%) | 77 (10.1%) |
| $45,000 to $49,999 | 50 (4.6%) | 27 (3.5%) |
| $50,000 to $54,999 | 65 (6.0%) | 0 (0.0%) |
| $55,000 to $64,999 | 10 (0.9%) | 22 (2.9%) |
| $65,000 to $74,999 | 77 (7.1%) | 48 (6.3%) |
| $75,000 to $99,999 | 73 (6.8%) | 24 (3.1%) |
| $100,000+ | 82 (7.6%) | 5 (0.6%) |
| Total | 1,079 (100.0%) | 765 (100.0%) |
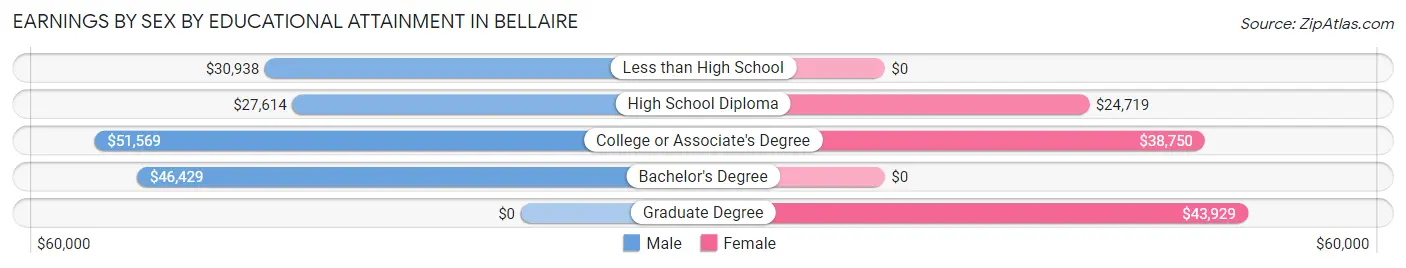
Earnings by Sex by Educational Attainment in Bellaire
Average earnings in Bellaire are $40,156 for men and $29,669 for women, a difference of 26.1%. Men with an educational attainment of college or associate's degree enjoy the highest average annual earnings of $51,569, while those with high school diploma education earn the least with $27,614. Women with an educational attainment of graduate degree earn the most with the average annual earnings of $43,929, while those with high school diploma education have the smallest earnings of $24,719.
| Educational Attainment | Male Income | Female Income |
| Less than High School | $30,938 | $0 |
| High School Diploma | $27,614 | $24,719 |
| College or Associate's Degree | $51,569 | $38,750 |
| Bachelor's Degree | $46,429 | $0 |
| Graduate Degree | - | - |
| Total | $40,156 | $29,669 |
Family Income in Bellaire
Family Income Brackets in Bellaire
According to the Bellaire family income data, there are 148 families falling into the $35,000 to $49,999 income range, which is the most common income bracket and makes up 18.8% of all families. Conversely, the $200,000+ income bracket is the least frequent group with only 12 families (1.5%) belonging to this category.
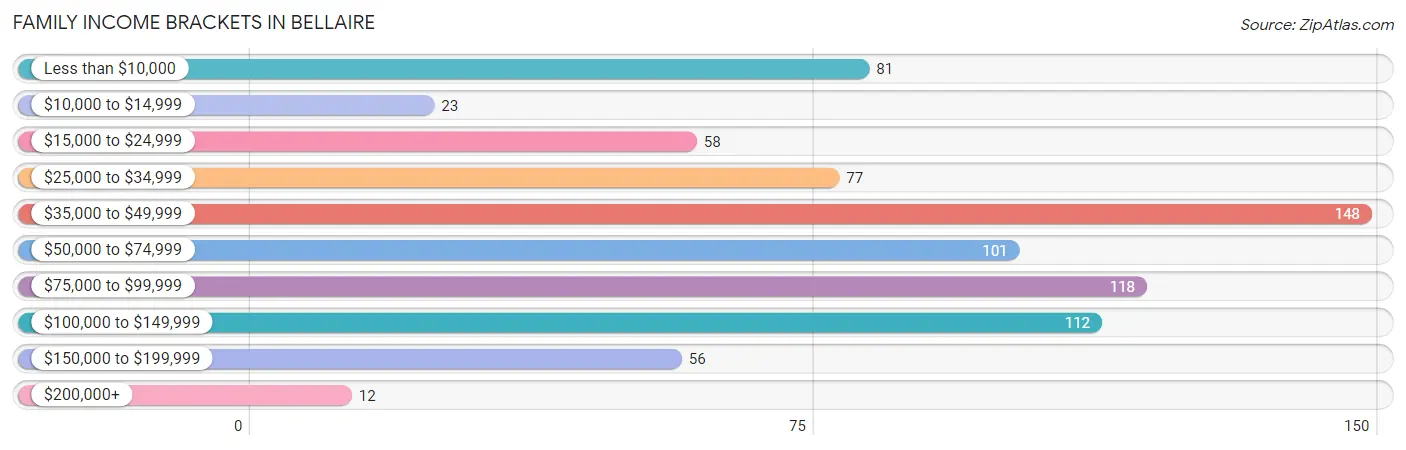
| Income Bracket | # Families | % Families |
| Less than $10,000 | 81 | 10.3% |
| $10,000 to $14,999 | 23 | 2.9% |
| $15,000 to $24,999 | 58 | 7.4% |
| $25,000 to $34,999 | 77 | 9.8% |
| $35,000 to $49,999 | 148 | 18.8% |
| $50,000 to $74,999 | 101 | 12.8% |
| $75,000 to $99,999 | 118 | 15.0% |
| $100,000 to $149,999 | 112 | 14.2% |
| $150,000 to $199,999 | 56 | 7.1% |
| $200,000+ | 12 | 1.5% |
Family Income by Famaliy Size in Bellaire
4-person families (179 | 22.8%) account for the highest median family income in Bellaire with $108,646 per family, while 4-person families (179 | 22.8%) have the highest median income of $27,162 per family member.
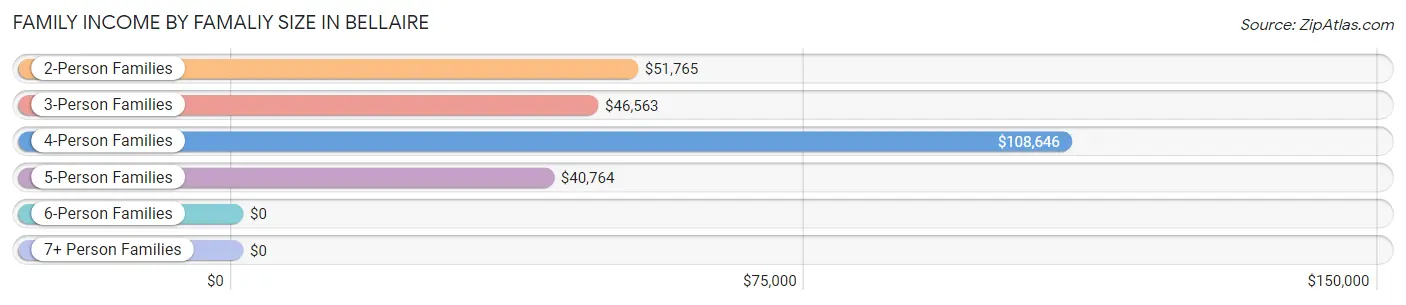
| Income Bracket | # Families | Median Income |
| 2-Person Families | 374 (47.6%) | $51,765 |
| 3-Person Families | 168 (21.4%) | $46,563 |
| 4-Person Families | 179 (22.8%) | $108,646 |
| 5-Person Families | 57 (7.2%) | $40,764 |
| 6-Person Families | 0 (0.0%) | $0 |
| 7+ Person Families | 8 (1.0%) | $0 |
| Total | 786 (100.0%) | $50,882 |
Family Income by Number of Earners in Bellaire
The median family income in Bellaire is $50,882, with families comprising 3+ earners (34) having the highest median family income of $138,000, while families with 1 earner (410) have the lowest median family income of $35,862, accounting for 4.3% and 52.2% of families, respectively.
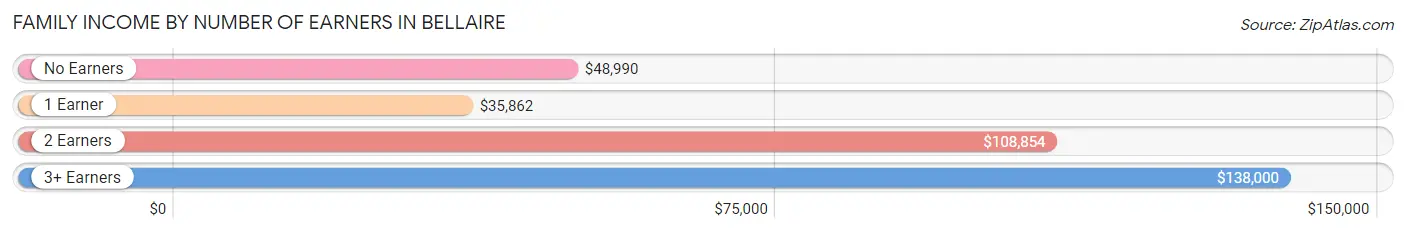
| Number of Earners | # Families | Median Income |
| No Earners | 97 (12.3%) | $48,990 |
| 1 Earner | 410 (52.2%) | $35,862 |
| 2 Earners | 245 (31.2%) | $108,854 |
| 3+ Earners | 34 (4.3%) | $138,000 |
| Total | 786 (100.0%) | $50,882 |
Household Income in Bellaire
Household Income Brackets in Bellaire
With 327 households falling in the category, the $25,000 to $34,999 income range is the most frequent in Bellaire, accounting for 21.8% of all households. In contrast, only 32 households (2.1%) fall into the $200,000+ income bracket, making it the least populous group.
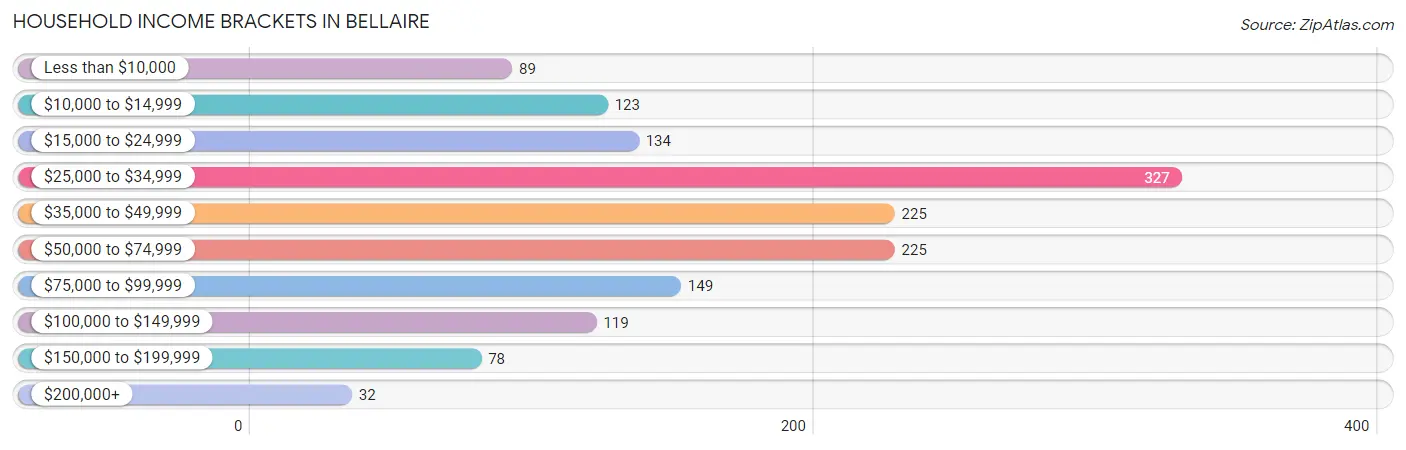
| Income Bracket | # Households | % Households |
| Less than $10,000 | 89 | 5.9% |
| $10,000 to $14,999 | 123 | 8.2% |
| $15,000 to $24,999 | 134 | 8.9% |
| $25,000 to $34,999 | 327 | 21.8% |
| $35,000 to $49,999 | 225 | 15.0% |
| $50,000 to $74,999 | 225 | 15.0% |
| $75,000 to $99,999 | 149 | 9.9% |
| $100,000 to $149,999 | 119 | 7.9% |
| $150,000 to $199,999 | 78 | 5.2% |
| $200,000+ | 32 | 2.1% |
Household Income by Householder Age in Bellaire
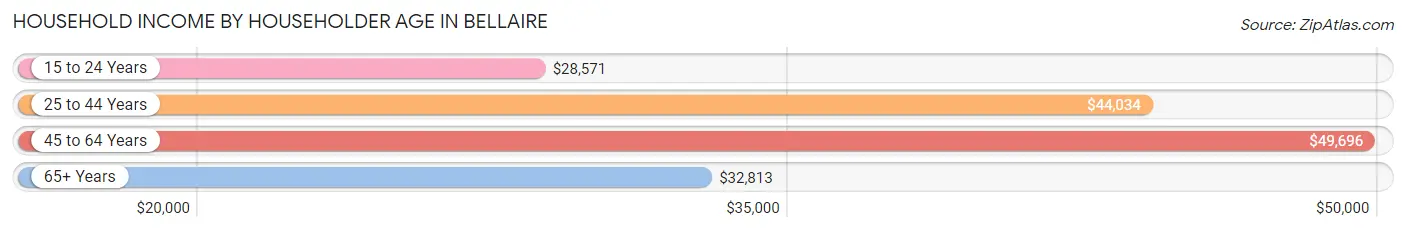
The median household income in Bellaire is $40,650, with the highest median household income of $49,696 found in the 45 to 64 years age bracket for the primary householder. A total of 567 households (37.8%) fall into this category. Meanwhile, the 15 to 24 years age bracket for the primary householder has the lowest median household income of $28,571, with 120 households (8.0%) in this group.
| Income Bracket | # Households | Median Income |
| 15 to 24 Years | 120 (8.0%) | $28,571 |
| 25 to 44 Years | 355 (23.6%) | $44,034 |
| 45 to 64 Years | 567 (37.8%) | $49,696 |
| 65+ Years | 460 (30.6%) | $32,813 |
| Total | 1,502 (100.0%) | $40,650 |
Poverty in Bellaire
Income Below Poverty by Sex and Age in Bellaire
With 21.2% poverty level for males and 24.8% for females among the residents of Bellaire, under 5 year old males and 16 and 17 year old females are the most vulnerable to poverty, with 119 males (54.6%) and 20 females (100.0%) in their respective age groups living below the poverty level.
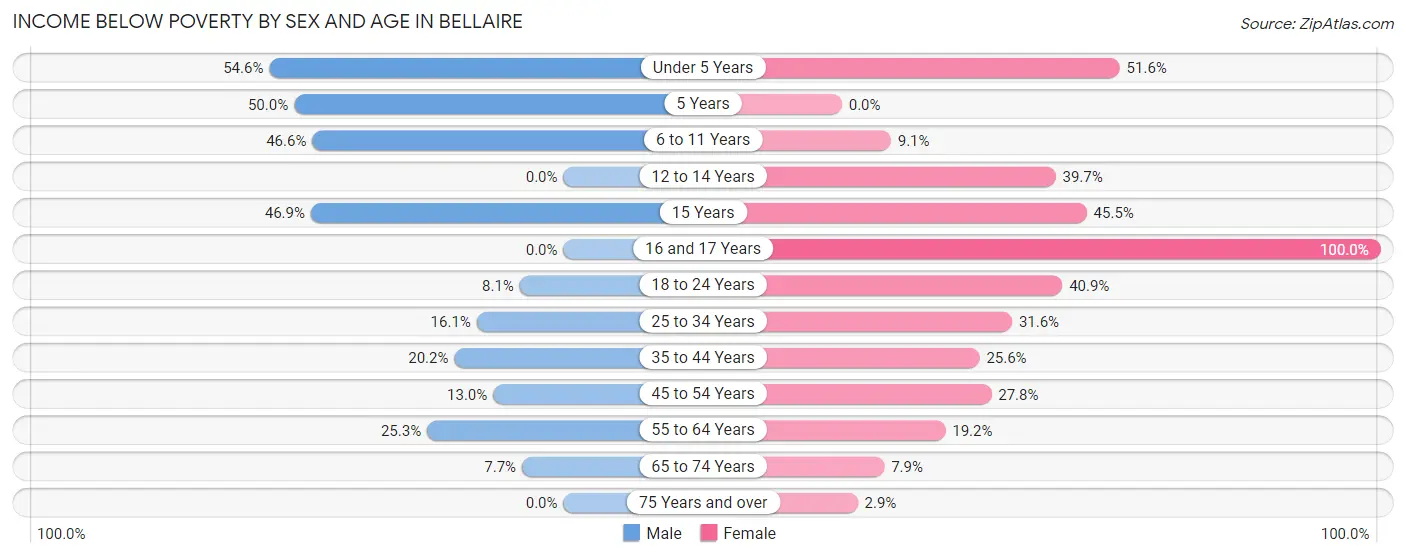
| Age Bracket | Male | Female |
| Under 5 Years | 119 (54.6%) | 49 (51.6%) |
| 5 Years | 31 (50.0%) | 0 (0.0%) |
| 6 to 11 Years | 55 (46.6%) | 15 (9.1%) |
| 12 to 14 Years | 0 (0.0%) | 25 (39.7%) |
| 15 Years | 15 (46.9%) | 5 (45.5%) |
| 16 and 17 Years | 0 (0.0%) | 20 (100.0%) |
| 18 to 24 Years | 24 (8.1%) | 63 (40.9%) |
| 25 to 34 Years | 42 (16.1%) | 96 (31.6%) |
| 35 to 44 Years | 34 (20.2%) | 35 (25.6%) |
| 45 to 54 Years | 36 (13.0%) | 63 (27.8%) |
| 55 to 64 Years | 61 (25.3%) | 58 (19.2%) |
| 65 to 74 Years | 19 (7.7%) | 10 (7.9%) |
| 75 Years and over | 0 (0.0%) | 5 (2.9%) |
| Total | 436 (21.2%) | 444 (24.8%) |
Income Above Poverty by Sex and Age in Bellaire
According to the poverty statistics in Bellaire, males aged 12 to 14 years and females aged 5 years are the age groups that are most secure financially, with 100.0% of males and 100.0% of females in these age groups living above the poverty line.
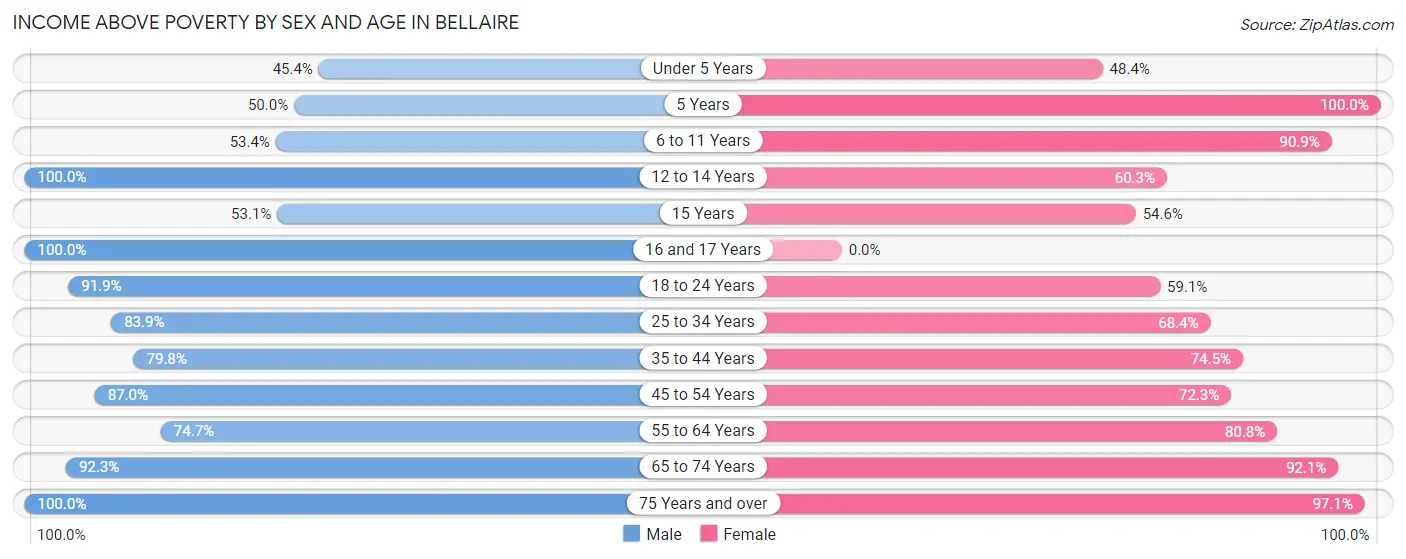
| Age Bracket | Male | Female |
| Under 5 Years | 99 (45.4%) | 46 (48.4%) |
| 5 Years | 31 (50.0%) | 17 (100.0%) |
| 6 to 11 Years | 63 (53.4%) | 150 (90.9%) |
| 12 to 14 Years | 32 (100.0%) | 38 (60.3%) |
| 15 Years | 17 (53.1%) | 6 (54.5%) |
| 16 and 17 Years | 30 (100.0%) | 0 (0.0%) |
| 18 to 24 Years | 272 (91.9%) | 91 (59.1%) |
| 25 to 34 Years | 219 (83.9%) | 208 (68.4%) |
| 35 to 44 Years | 134 (79.8%) | 102 (74.5%) |
| 45 to 54 Years | 240 (87.0%) | 164 (72.3%) |
| 55 to 64 Years | 180 (74.7%) | 244 (80.8%) |
| 65 to 74 Years | 228 (92.3%) | 117 (92.1%) |
| 75 Years and over | 77 (100.0%) | 165 (97.1%) |
| Total | 1,622 (78.8%) | 1,348 (75.2%) |
Income Below Poverty Among Married-Couple Families in Bellaire
The poverty statistics for married-couple families in Bellaire show that 6.0% or 27 of the total 447 families live below the poverty line. Families with 3 or 4 children have the highest poverty rate of 42.3%, comprising of 11 families. On the other hand, families with 1 or 2 children have the lowest poverty rate of 0.0%, which includes 0 families.
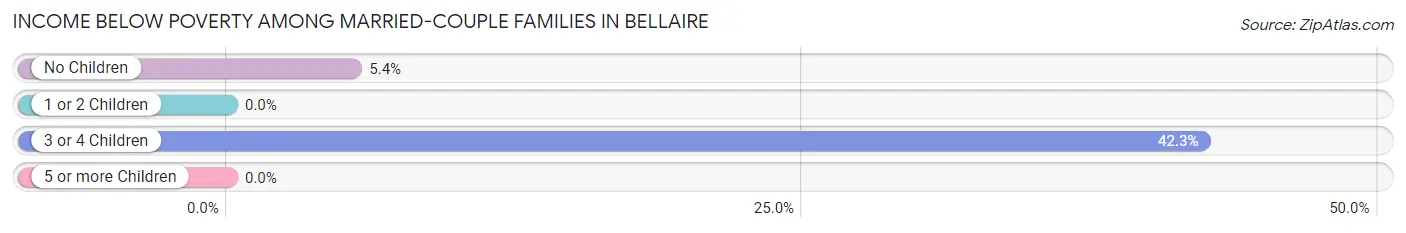
| Children | Above Poverty | Below Poverty |
| No Children | 280 (94.6%) | 16 (5.4%) |
| 1 or 2 Children | 117 (100.0%) | 0 (0.0%) |
| 3 or 4 Children | 15 (57.7%) | 11 (42.3%) |
| 5 or more Children | 8 (100.0%) | 0 (0.0%) |
| Total | 420 (94.0%) | 27 (6.0%) |
Income Below Poverty Among Single-Parent Households in Bellaire
According to the poverty data in Bellaire, 26.7% or 20 single-father households and 48.1% or 127 single-mother households are living below the poverty line. Among single-father households, those with 1 or 2 children have the highest poverty rate, with 18 households (31.6%) experiencing poverty. Likewise, among single-mother households, those with 3 or 4 children have the highest poverty rate, with 51 households (62.2%) falling below the poverty line.
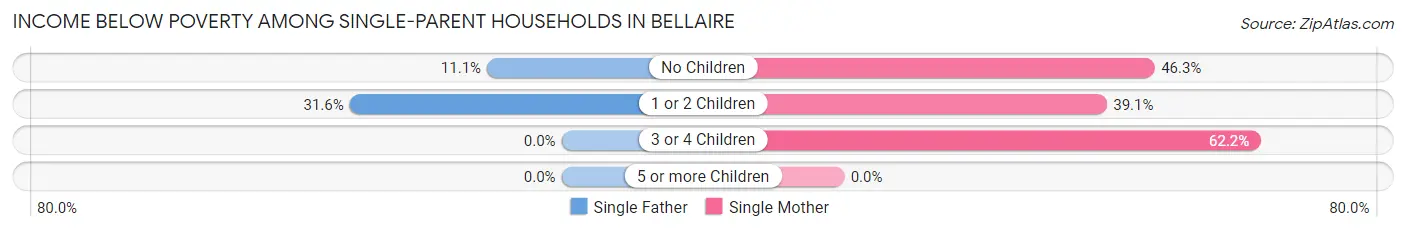
| Children | Single Father | Single Mother |
| No Children | 2 (11.1%) | 31 (46.3%) |
| 1 or 2 Children | 18 (31.6%) | 45 (39.1%) |
| 3 or 4 Children | 0 (0.0%) | 51 (62.2%) |
| 5 or more Children | 0 (0.0%) | 0 (0.0%) |
| Total | 20 (26.7%) | 127 (48.1%) |
Income Below Poverty Among Married-Couple vs Single-Parent Households in Bellaire
The poverty data for Bellaire shows that 27 of the married-couple family households (6.0%) and 147 of the single-parent households (43.4%) are living below the poverty level. Within the married-couple family households, those with 3 or 4 children have the highest poverty rate, with 11 households (42.3%) falling below the poverty line. Among the single-parent households, those with 3 or 4 children have the highest poverty rate, with 51 household (62.2%) living below poverty.
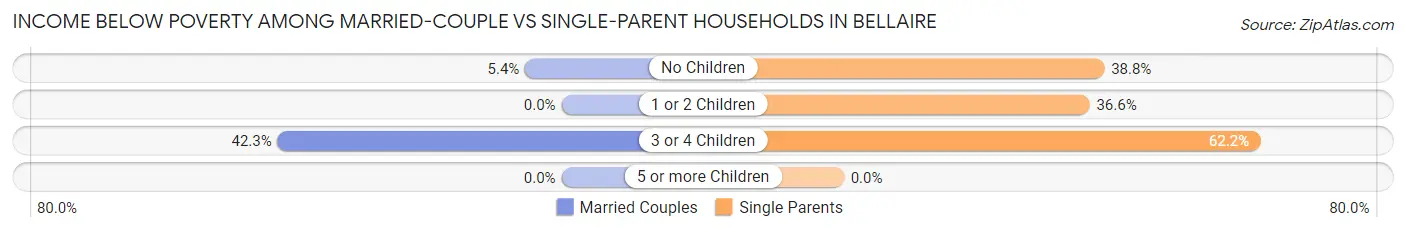
| Children | Married-Couple Families | Single-Parent Households |
| No Children | 16 (5.4%) | 33 (38.8%) |
| 1 or 2 Children | 0 (0.0%) | 63 (36.6%) |
| 3 or 4 Children | 11 (42.3%) | 51 (62.2%) |
| 5 or more Children | 0 (0.0%) | 0 (0.0%) |
| Total | 27 (6.0%) | 147 (43.4%) |
Race in Bellaire
The most populous races in Bellaire are White / Caucasian (3,286 | 84.7%), Two or more Races (293 | 7.6%), and Black / African American (268 | 6.9%).
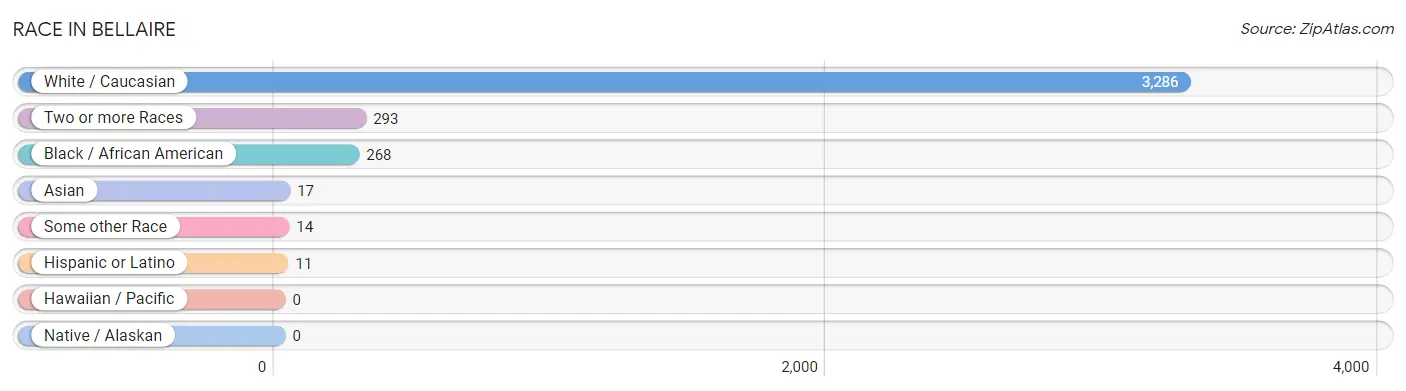
| Race | # Population | % Population |
| Asian | 17 | 0.4% |
| Black / African American | 268 | 6.9% |
| Hawaiian / Pacific | 0 | 0.0% |
| Hispanic or Latino | 11 | 0.3% |
| Native / Alaskan | 0 | 0.0% |
| White / Caucasian | 3,286 | 84.7% |
| Two or more Races | 293 | 7.6% |
| Some other Race | 14 | 0.4% |
| Total | 3,878 | 100.0% |
Ancestry in Bellaire
The most populous ancestries reported in Bellaire are German (729 | 18.8%), English (579 | 14.9%), Irish (503 | 13.0%), Italian (386 | 10.0%), and Polish (211 | 5.4%), together accounting for 62.1% of all Bellaire residents.
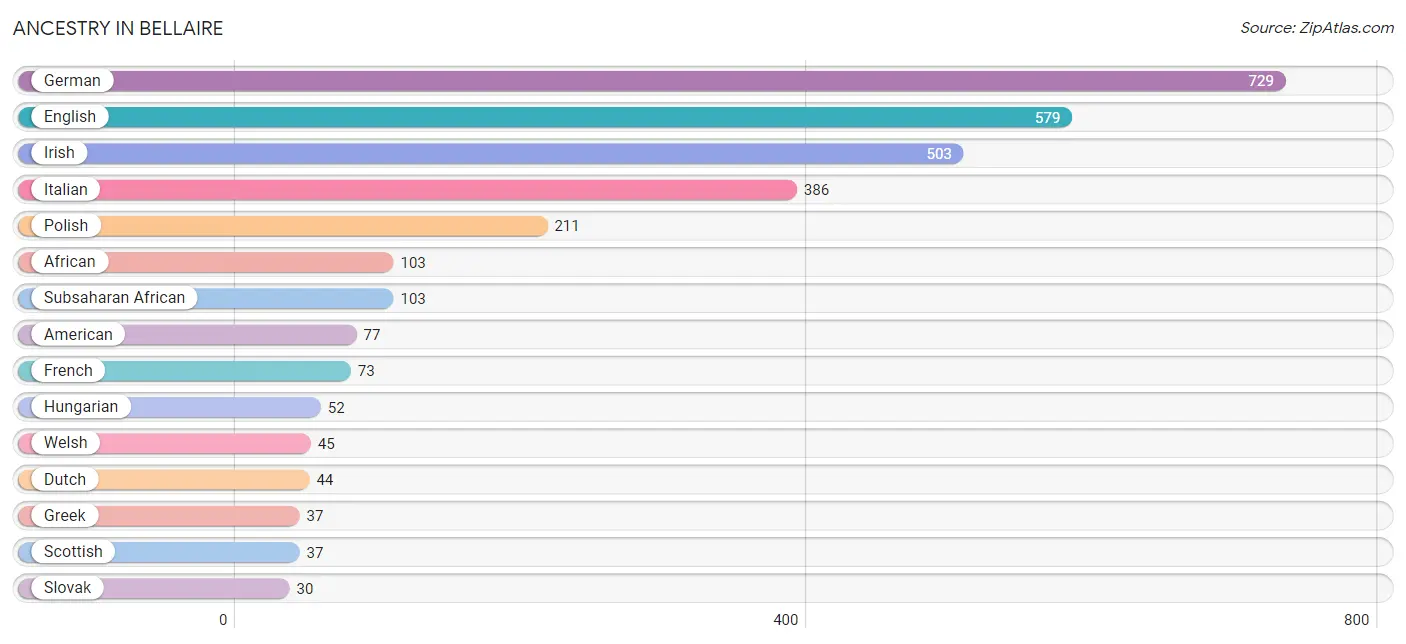
| Ancestry | # Population | % Population |
| African | 103 | 2.7% |
| American | 77 | 2.0% |
| Austrian | 11 | 0.3% |
| Blackfeet | 4 | 0.1% |
| Cherokee | 11 | 0.3% |
| Czech | 12 | 0.3% |
| Dutch | 44 | 1.1% |
| English | 579 | 14.9% |
| French | 73 | 1.9% |
| German | 729 | 18.8% |
| Greek | 37 | 0.9% |
| Hungarian | 52 | 1.3% |
| Irish | 503 | 13.0% |
| Italian | 386 | 10.0% |
| Korean | 17 | 0.4% |
| Mexican | 11 | 0.3% |
| Paiute | 4 | 0.1% |
| Polish | 211 | 5.4% |
| Scandinavian | 14 | 0.4% |
| Scotch-Irish | 21 | 0.5% |
| Scottish | 37 | 0.9% |
| Slovak | 30 | 0.8% |
| Subsaharan African | 103 | 2.7% |
| Ukrainian | 5 | 0.1% |
| Welsh | 45 | 1.2% | View All 25 Rows |
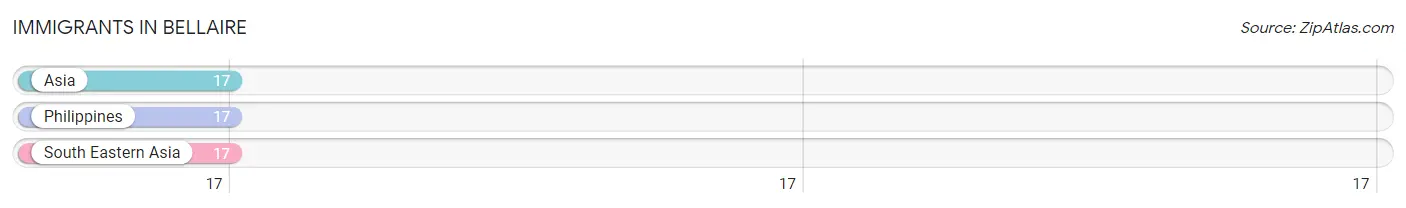
Immigrants in Bellaire
The most numerous immigrant groups reported in Bellaire came from Asia (17 | 0.4%), Philippines (17 | 0.4%), and South Eastern Asia (17 | 0.4%), together accounting for 1.3% of all Bellaire residents.
| Immigration Origin | # Population | % Population |
| Asia | 17 | 0.4% |
| Philippines | 17 | 0.4% |
| South Eastern Asia | 17 | 0.4% | View All 3 Rows |
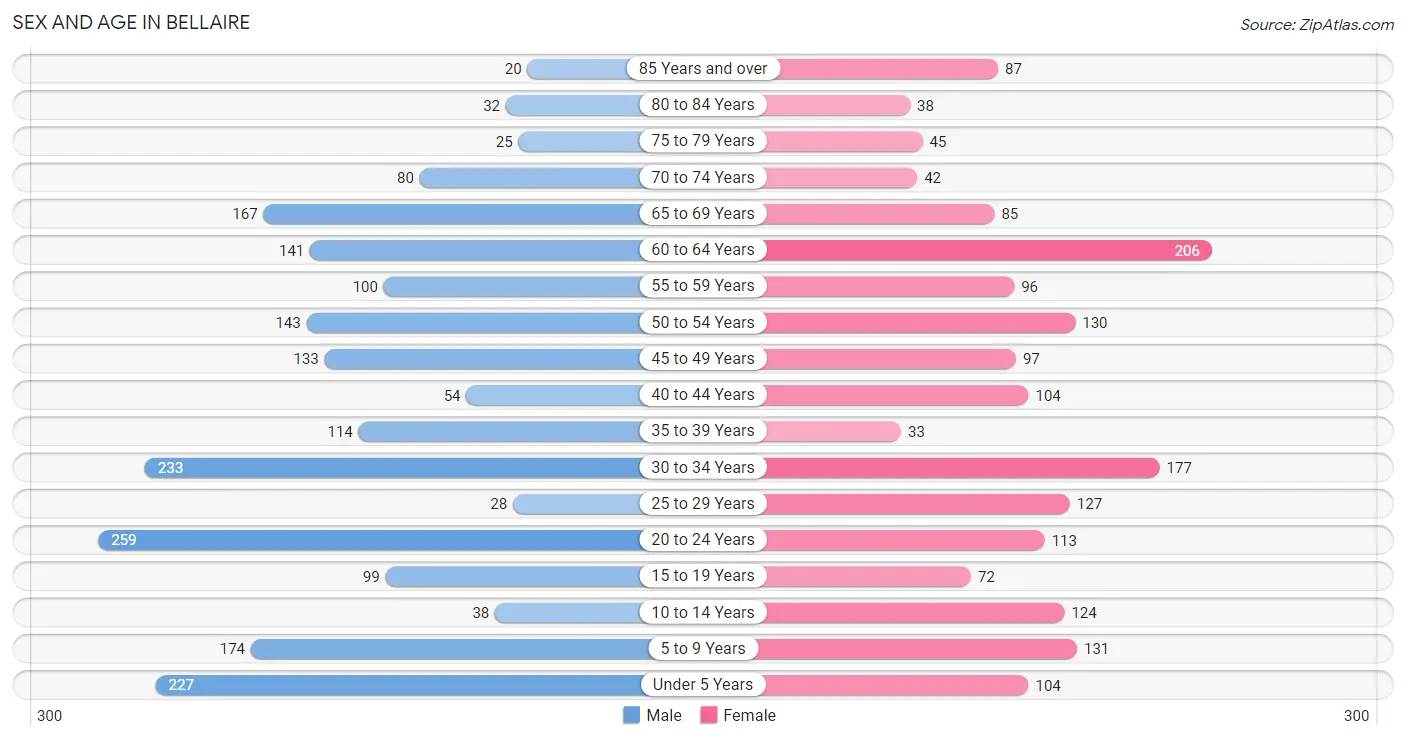
Sex and Age in Bellaire
Sex and Age in Bellaire
The most populous age groups in Bellaire are 20 to 24 Years (259 | 12.5%) for men and 60 to 64 Years (206 | 11.4%) for women.
| Age Bracket | Male | Female |
| Under 5 Years | 227 (11.0%) | 104 (5.7%) |
| 5 to 9 Years | 174 (8.4%) | 131 (7.2%) |
| 10 to 14 Years | 38 (1.8%) | 124 (6.9%) |
| 15 to 19 Years | 99 (4.8%) | 72 (4.0%) |
| 20 to 24 Years | 259 (12.5%) | 113 (6.2%) |
| 25 to 29 Years | 28 (1.3%) | 127 (7.0%) |
| 30 to 34 Years | 233 (11.3%) | 177 (9.8%) |
| 35 to 39 Years | 114 (5.5%) | 33 (1.8%) |
| 40 to 44 Years | 54 (2.6%) | 104 (5.7%) |
| 45 to 49 Years | 133 (6.4%) | 97 (5.4%) |
| 50 to 54 Years | 143 (6.9%) | 130 (7.2%) |
| 55 to 59 Years | 100 (4.8%) | 96 (5.3%) |
| 60 to 64 Years | 141 (6.8%) | 206 (11.4%) |
| 65 to 69 Years | 167 (8.1%) | 85 (4.7%) |
| 70 to 74 Years | 80 (3.9%) | 42 (2.3%) |
| 75 to 79 Years | 25 (1.2%) | 45 (2.5%) |
| 80 to 84 Years | 32 (1.5%) | 38 (2.1%) |
| 85 Years and over | 20 (1.0%) | 87 (4.8%) |
| Total | 2,067 (100.0%) | 1,811 (100.0%) |
Families and Households in Bellaire
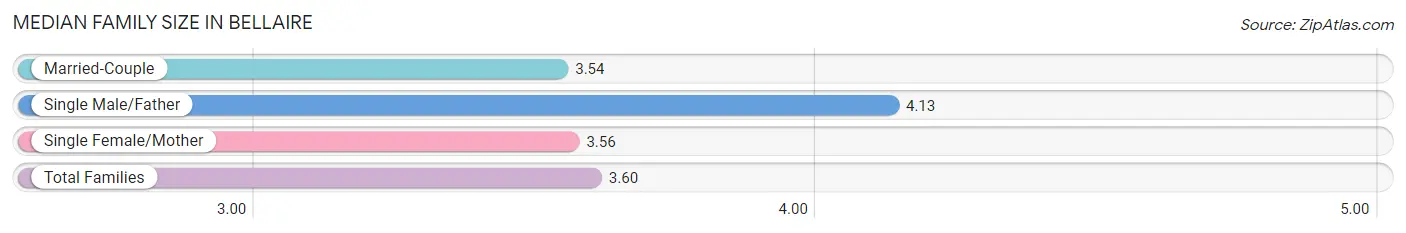
Median Family Size in Bellaire
The median family size in Bellaire is 3.60 persons per family, with single male/father families (75 | 9.5%) accounting for the largest median family size of 4.13 persons per family. On the other hand, married-couple families (447 | 56.9%) represent the smallest median family size with 3.54 persons per family.
| Family Type | # Families | Family Size |
| Married-Couple | 447 (56.9%) | 3.54 |
| Single Male/Father | 75 (9.5%) | 4.13 |
| Single Female/Mother | 264 (33.6%) | 3.56 |
| Total Families | 786 (100.0%) | 3.60 |
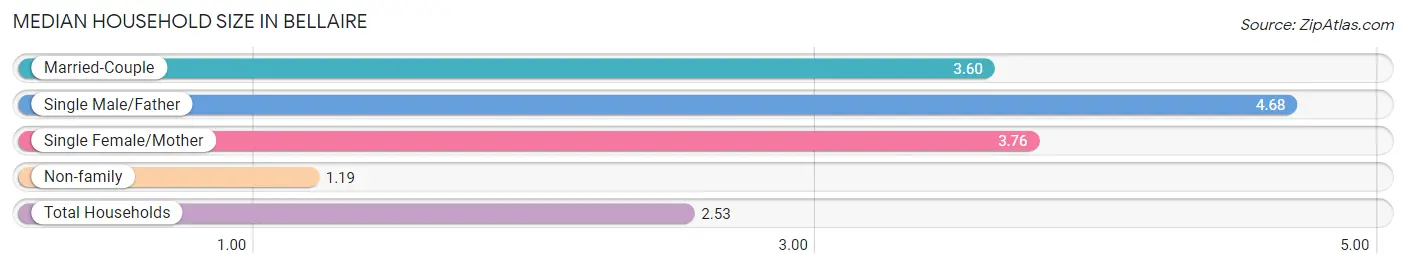
Median Household Size in Bellaire
The median household size in Bellaire is 2.53 persons per household, with single male/father households (75 | 5.0%) accounting for the largest median household size of 4.68 persons per household. non-family households (716 | 47.7%) represent the smallest median household size with 1.19 persons per household.
| Household Type | # Households | Household Size |
| Married-Couple | 447 (29.8%) | 3.60 |
| Single Male/Father | 75 (5.0%) | 4.68 |
| Single Female/Mother | 264 (17.6%) | 3.76 |
| Non-family | 716 (47.7%) | 1.19 |
| Total Households | 1,502 (100.0%) | 2.53 |
Household Size by Marriage Status in Bellaire
Out of a total of 1,502 households in Bellaire, 786 (52.3%) are family households, while 716 (47.7%) are nonfamily households. The most numerous type of family households are 2-person households, comprising 346, and the most common type of nonfamily households are 1-person households, comprising 635.
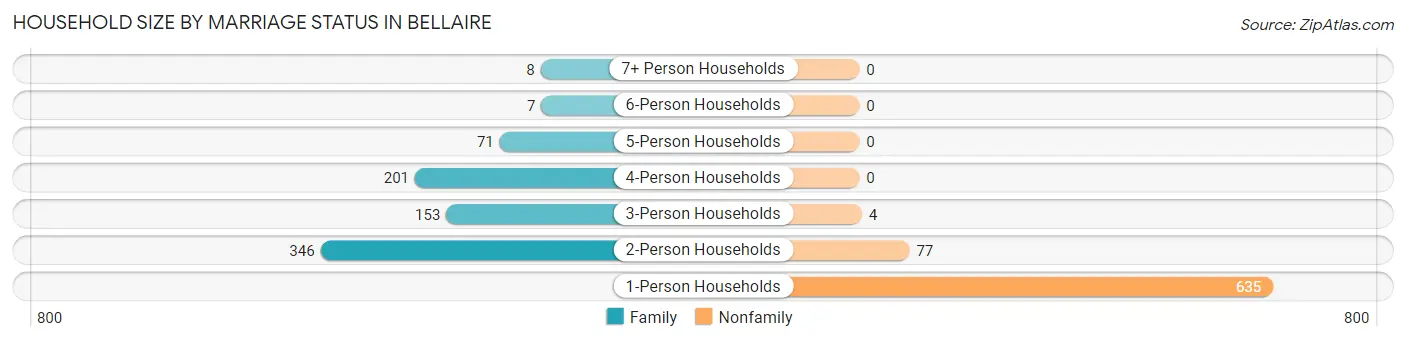
| Household Size | Family Households | Nonfamily Households |
| 1-Person Households | - | 635 (42.3%) |
| 2-Person Households | 346 (23.0%) | 77 (5.1%) |
| 3-Person Households | 153 (10.2%) | 4 (0.3%) |
| 4-Person Households | 201 (13.4%) | 0 (0.0%) |
| 5-Person Households | 71 (4.7%) | 0 (0.0%) |
| 6-Person Households | 7 (0.5%) | 0 (0.0%) |
| 7+ Person Households | 8 (0.5%) | 0 (0.0%) |
| Total | 786 (52.3%) | 716 (47.7%) |
Female Fertility in Bellaire
Fertility by Age in Bellaire
Average fertility rate in Bellaire is 45.0 births per 1,000 women. Women in the age bracket of 20 to 34 years have the highest fertility rate with 82.0 births per 1,000 women. Women in the age bracket of 20 to 34 years acount for 100.0% of all women with births.
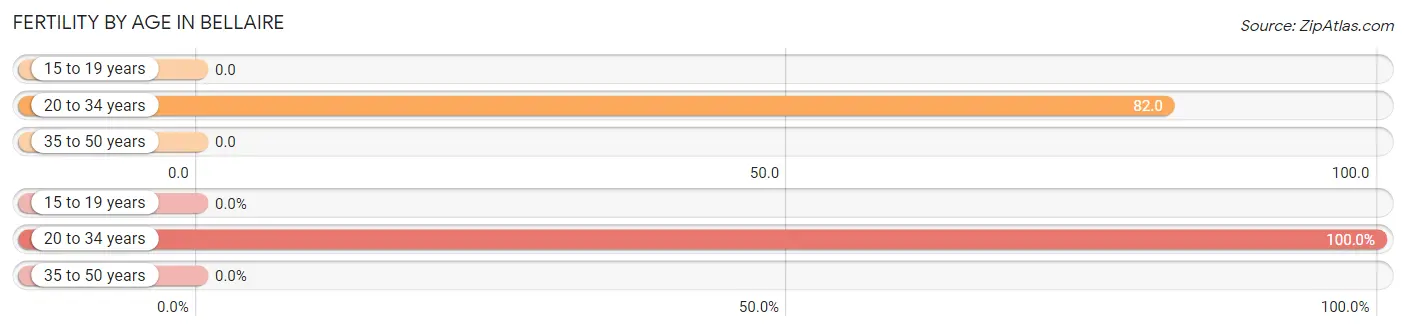
| Age Bracket | Women with Births | Births / 1,000 Women |
| 15 to 19 years | 0 (0.0%) | 0.0 |
| 20 to 34 years | 34 (100.0%) | 82.0 |
| 35 to 50 years | 0 (0.0%) | 0.0 |
| Total | 34 (100.0%) | 45.0 |
Fertility by Age by Marriage Status in Bellaire
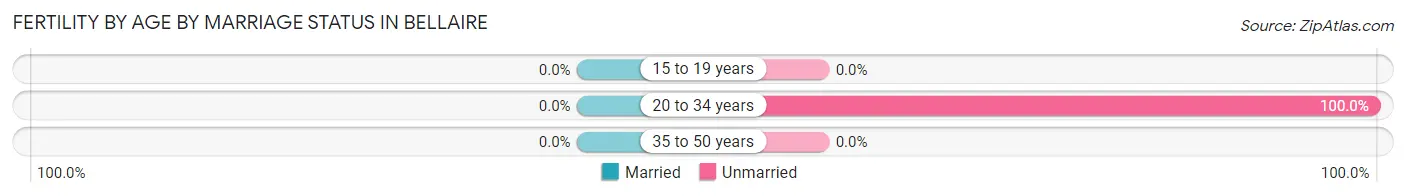
| Age Bracket | Married | Unmarried |
| 15 to 19 years | 0 (0.0%) | 0 (0.0%) |
| 20 to 34 years | 0 (0.0%) | 34 (100.0%) |
| 35 to 50 years | 0 (0.0%) | 0 (0.0%) |
| Total | 0 (0.0%) | 34 (100.0%) |
Fertility by Education in Bellaire
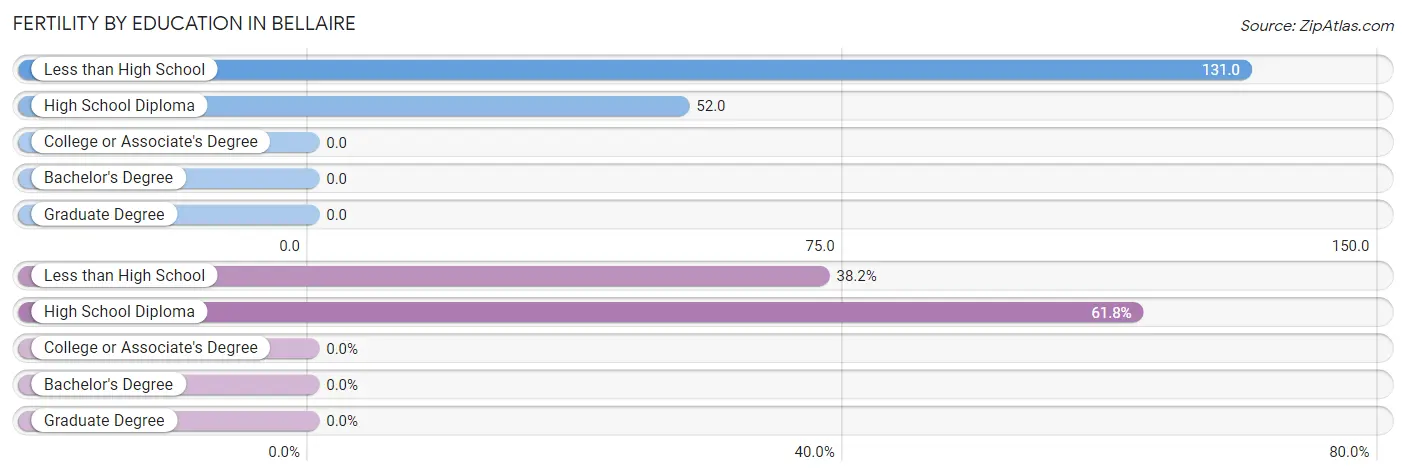
| Educational Attainment | Women with Births | Births / 1,000 Women |
| Less than High School | 13 (38.2%) | 131.0 |
| High School Diploma | 21 (61.8%) | 52.0 |
| College or Associate's Degree | 0 (0.0%) | 0.0 |
| Bachelor's Degree | 0 (0.0%) | 0.0 |
| Graduate Degree | 0 (0.0%) | 0.0 |
| Total | 34 (100.0%) | 45.0 |
Fertility by Education by Marriage Status in Bellaire
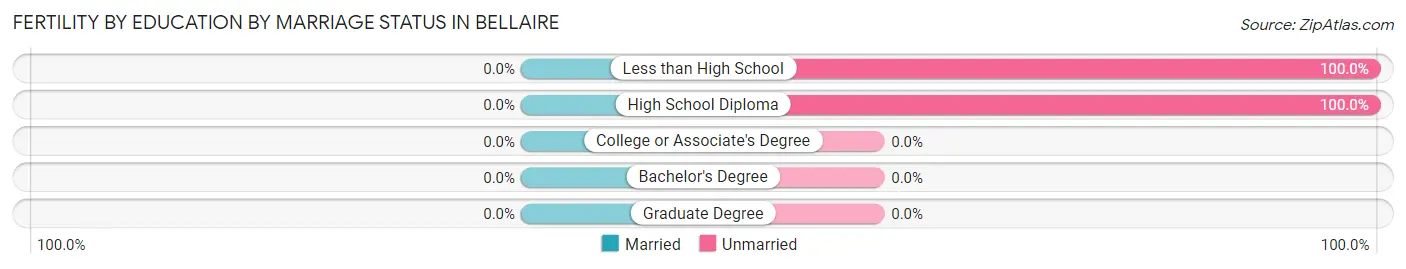
| Educational Attainment | Married | Unmarried |
| Less than High School | 0 (0.0%) | 13 (100.0%) |
| High School Diploma | 0 (0.0%) | 21 (100.0%) |
| College or Associate's Degree | 0 (0.0%) | 0 (0.0%) |
| Bachelor's Degree | 0 (0.0%) | 0 (0.0%) |
| Graduate Degree | 0 (0.0%) | 0 (0.0%) |
| Total | 0 (0.0%) | 34 (100.0%) |
Employment Characteristics in Bellaire
Employment by Class of Employer in Bellaire
Among the 1,628 employed individuals in Bellaire, private company employees (1,313 | 80.6%), not-for-profit organizations (135 | 8.3%), and local government employees (110 | 6.8%) make up the most common classes of employment.
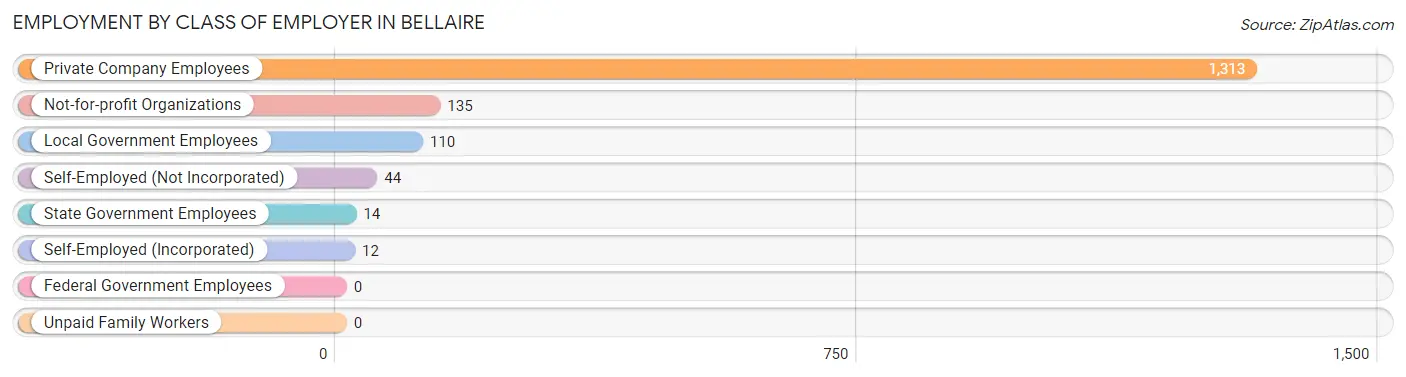
| Employer Class | # Employees | % Employees |
| Private Company Employees | 1,313 | 80.6% |
| Self-Employed (Incorporated) | 12 | 0.7% |
| Self-Employed (Not Incorporated) | 44 | 2.7% |
| Not-for-profit Organizations | 135 | 8.3% |
| Local Government Employees | 110 | 6.8% |
| State Government Employees | 14 | 0.9% |
| Federal Government Employees | 0 | 0.0% |
| Unpaid Family Workers | 0 | 0.0% |
| Total | 1,628 | 100.0% |
Employment Status by Age in Bellaire
According to the labor force statistics for Bellaire, out of the total population over 16 years of age (3,037), 59.6% or 1,810 individuals are in the labor force, with 9.3% or 168 of them unemployed. The age group with the highest labor force participation rate is 35 to 44 years, with 87.9% or 268 individuals in the labor force. Within the labor force, the 16 to 19 years age range has the highest percentage of unemployed individuals, with 15.4% or 12 of them being unemployed.
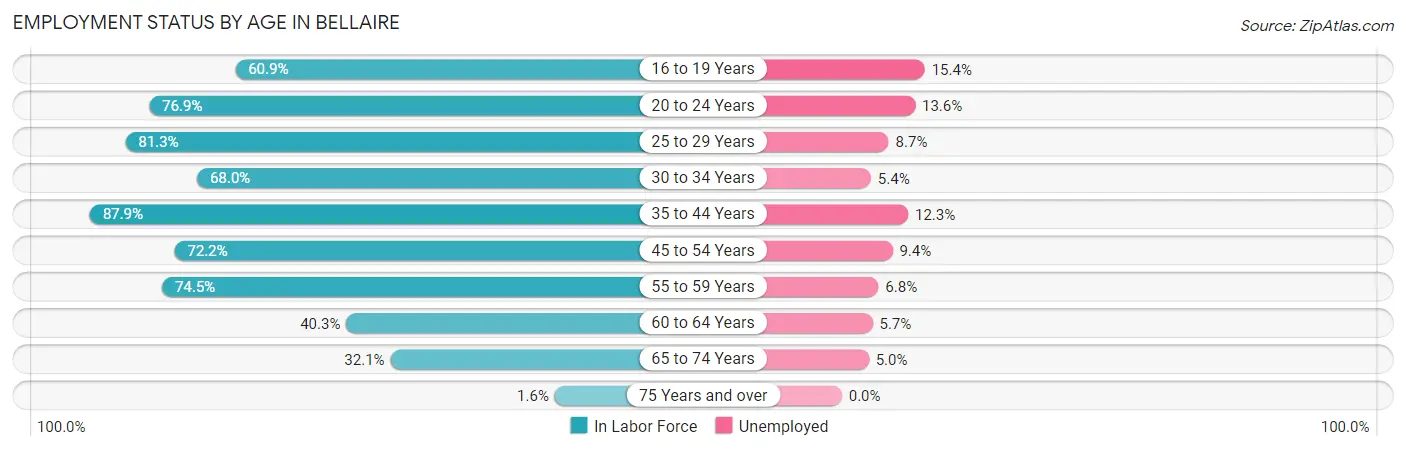
| Age Bracket | In Labor Force | Unemployed |
| 16 to 19 Years | 78 (60.9%) | 12 (15.4%) |
| 20 to 24 Years | 286 (76.9%) | 39 (13.6%) |
| 25 to 29 Years | 126 (81.3%) | 11 (8.7%) |
| 30 to 34 Years | 279 (68.0%) | 15 (5.4%) |
| 35 to 44 Years | 268 (87.9%) | 33 (12.3%) |
| 45 to 54 Years | 363 (72.2%) | 34 (9.4%) |
| 55 to 59 Years | 146 (74.5%) | 10 (6.8%) |
| 60 to 64 Years | 140 (40.3%) | 8 (5.7%) |
| 65 to 74 Years | 120 (32.1%) | 6 (5.0%) |
| 75 Years and over | 4 (1.6%) | 0 (0.0%) |
| Total | 1,810 (59.6%) | 168 (9.3%) |
Employment Status by Educational Attainment in Bellaire
According to labor force statistics for Bellaire, 69.0% of individuals (1,322) out of the total population between 25 and 64 years of age (1,916) are in the labor force, with 8.4% or 111 of them being unemployed. The group with the highest labor force participation rate are those with the educational attainment of bachelor's degree or higher, with 100.0% or 96 individuals in the labor force. Within the labor force, individuals with less than high school education have the highest percentage of unemployment, with 41.4% or 24 of them being unemployed.
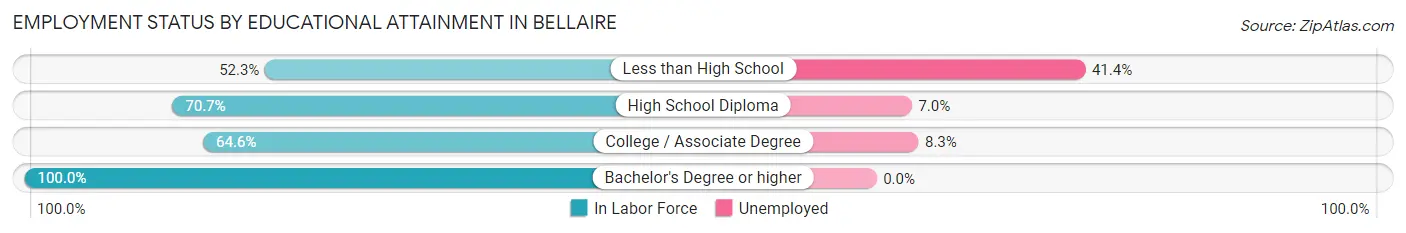
| Educational Attainment | In Labor Force | Unemployed |
| Less than High School | 58 (52.3%) | 46 (41.4%) |
| High School Diploma | 745 (70.7%) | 74 (7.0%) |
| College / Associate Degree | 423 (64.6%) | 54 (8.3%) |
| Bachelor's Degree or higher | 96 (100.0%) | 0 (0.0%) |
| Total | 1,322 (69.0%) | 161 (8.4%) |
Employment Occupations by Sex in Bellaire
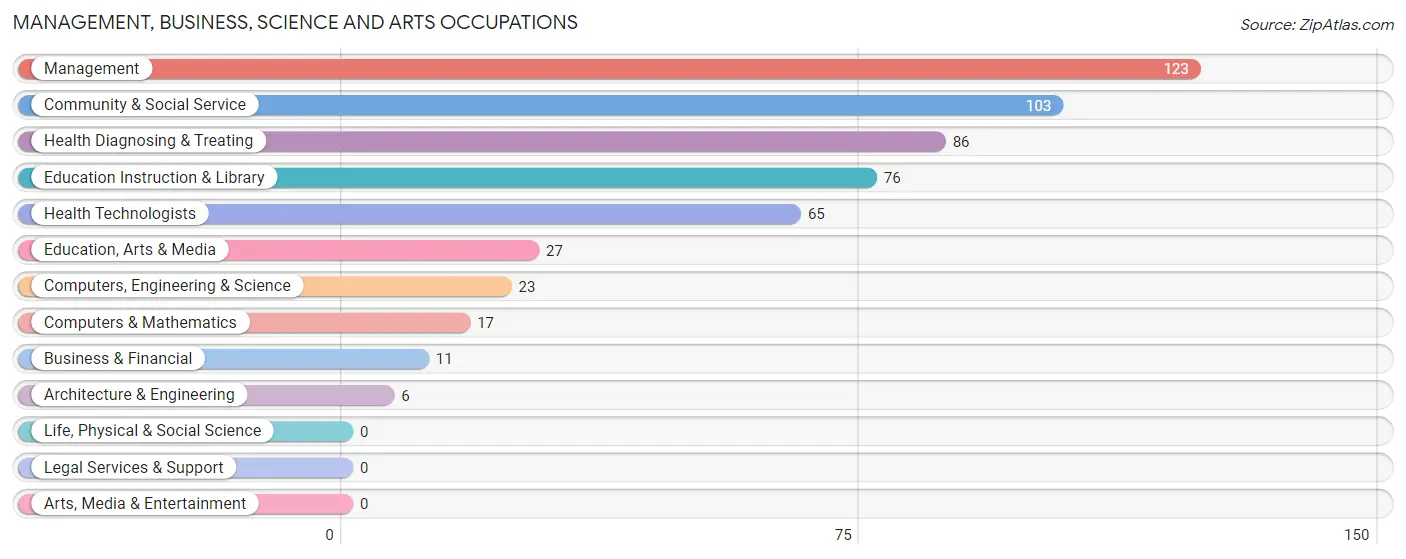
Management, Business, Science and Arts Occupations
The most common Management, Business, Science and Arts occupations in Bellaire are Management (123 | 7.5%), Community & Social Service (103 | 6.3%), Health Diagnosing & Treating (86 | 5.2%), Education Instruction & Library (76 | 4.6%), and Health Technologists (65 | 4.0%).
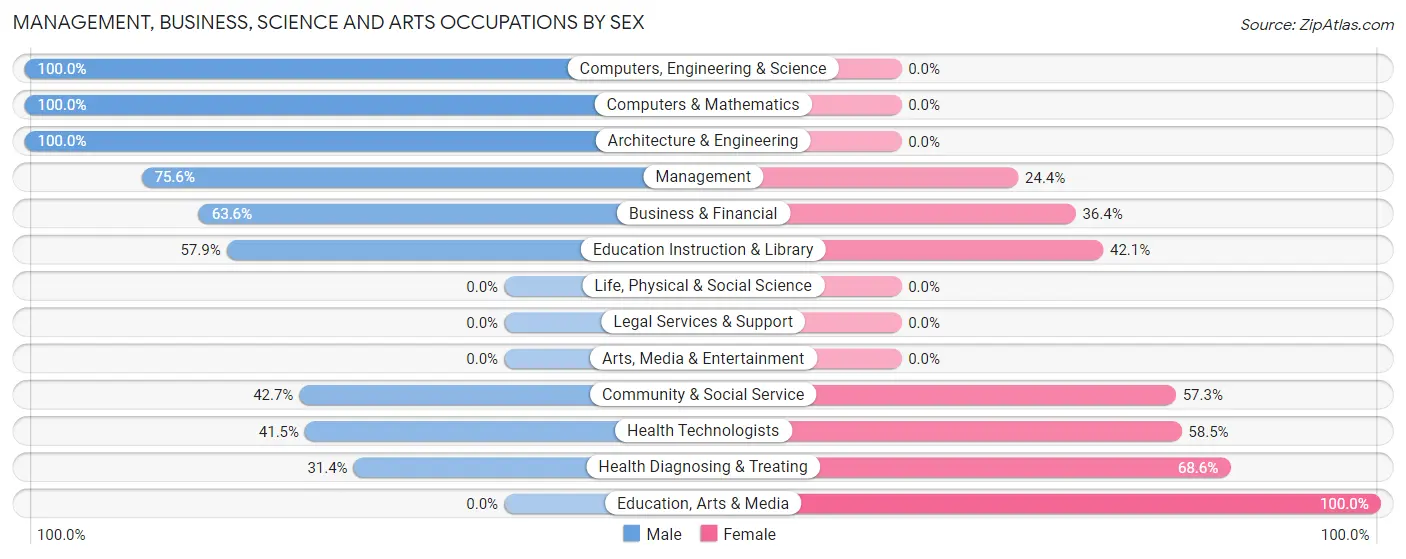
Management, Business, Science and Arts Occupations by Sex
Within the Management, Business, Science and Arts occupations in Bellaire, the most male-oriented occupations are Computers, Engineering & Science (100.0%), Computers & Mathematics (100.0%), and Architecture & Engineering (100.0%), while the most female-oriented occupations are Education, Arts & Media (100.0%), Health Diagnosing & Treating (68.6%), and Health Technologists (58.5%).
| Occupation | Male | Female |
| Management | 93 (75.6%) | 30 (24.4%) |
| Business & Financial | 7 (63.6%) | 4 (36.4%) |
| Computers, Engineering & Science | 23 (100.0%) | 0 (0.0%) |
| Computers & Mathematics | 17 (100.0%) | 0 (0.0%) |
| Architecture & Engineering | 6 (100.0%) | 0 (0.0%) |
| Life, Physical & Social Science | 0 (0.0%) | 0 (0.0%) |
| Community & Social Service | 44 (42.7%) | 59 (57.3%) |
| Education, Arts & Media | 0 (0.0%) | 27 (100.0%) |
| Legal Services & Support | 0 (0.0%) | 0 (0.0%) |
| Education Instruction & Library | 44 (57.9%) | 32 (42.1%) |
| Arts, Media & Entertainment | 0 (0.0%) | 0 (0.0%) |
| Health Diagnosing & Treating | 27 (31.4%) | 59 (68.6%) |
| Health Technologists | 27 (41.5%) | 38 (58.5%) |
| Total (Category) | 194 (56.1%) | 152 (43.9%) |
| Total (Overall) | 976 (59.4%) | 666 (40.6%) |
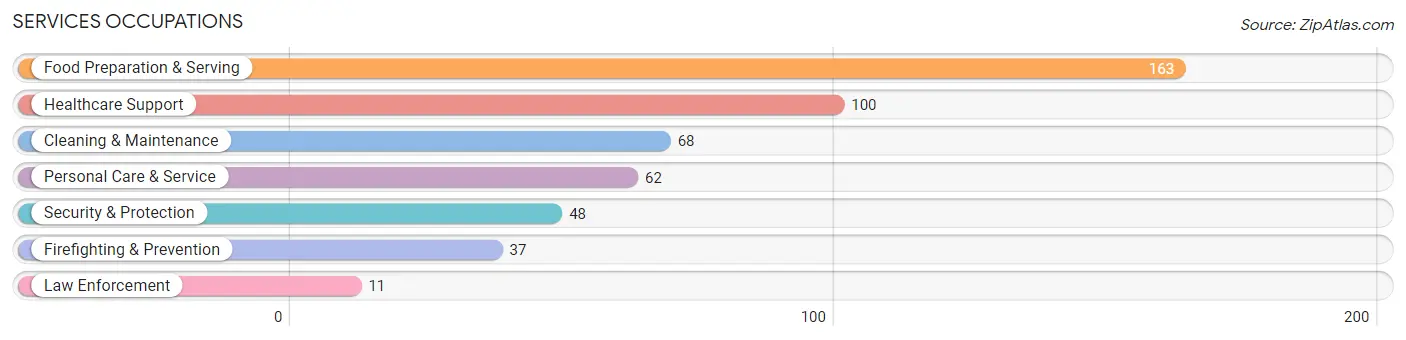
Services Occupations
The most common Services occupations in Bellaire are Food Preparation & Serving (163 | 9.9%), Healthcare Support (100 | 6.1%), Cleaning & Maintenance (68 | 4.1%), Personal Care & Service (62 | 3.8%), and Security & Protection (48 | 2.9%).
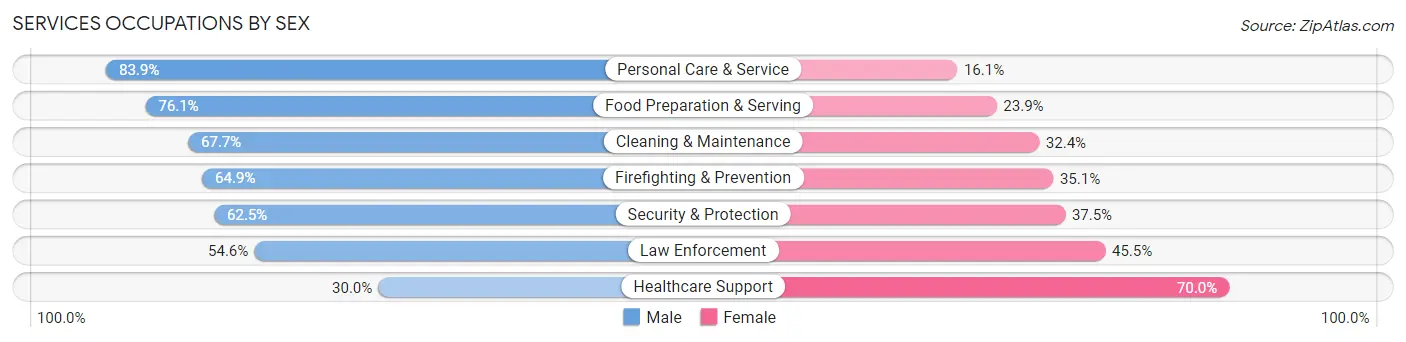
Services Occupations by Sex
Within the Services occupations in Bellaire, the most male-oriented occupations are Personal Care & Service (83.9%), Food Preparation & Serving (76.1%), and Cleaning & Maintenance (67.6%), while the most female-oriented occupations are Healthcare Support (70.0%), Law Enforcement (45.5%), and Security & Protection (37.5%).
| Occupation | Male | Female |
| Healthcare Support | 30 (30.0%) | 70 (70.0%) |
| Security & Protection | 30 (62.5%) | 18 (37.5%) |
| Firefighting & Prevention | 24 (64.9%) | 13 (35.1%) |
| Law Enforcement | 6 (54.5%) | 5 (45.5%) |
| Food Preparation & Serving | 124 (76.1%) | 39 (23.9%) |
| Cleaning & Maintenance | 46 (67.6%) | 22 (32.4%) |
| Personal Care & Service | 52 (83.9%) | 10 (16.1%) |
| Total (Category) | 282 (63.9%) | 159 (36.0%) |
| Total (Overall) | 976 (59.4%) | 666 (40.6%) |
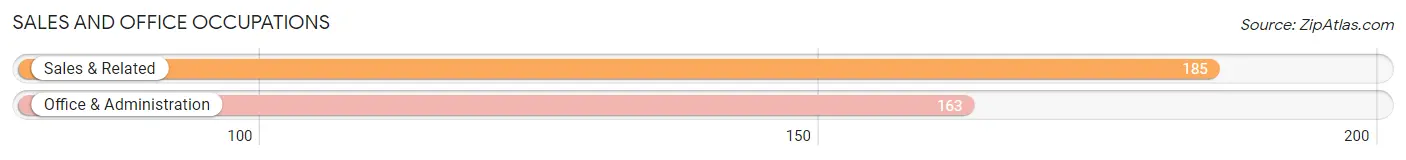
Sales and Office Occupations
The most common Sales and Office occupations in Bellaire are Sales & Related (185 | 11.3%), and Office & Administration (163 | 9.9%).
Sales and Office Occupations by Sex
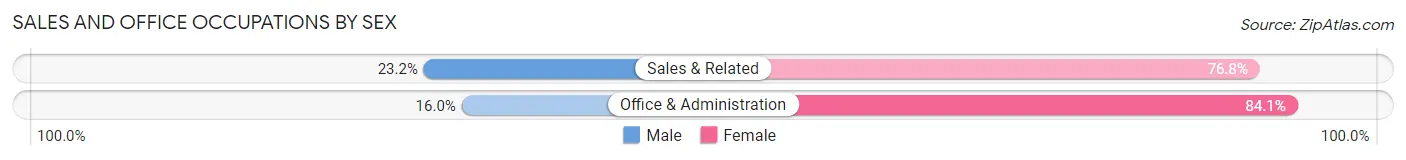
| Occupation | Male | Female |
| Sales & Related | 43 (23.2%) | 142 (76.8%) |
| Office & Administration | 26 (16.0%) | 137 (84.1%) |
| Total (Category) | 69 (19.8%) | 279 (80.2%) |
| Total (Overall) | 976 (59.4%) | 666 (40.6%) |
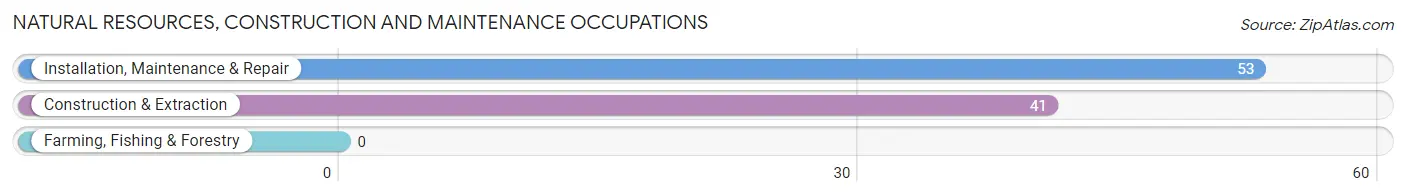
Natural Resources, Construction and Maintenance Occupations
The most common Natural Resources, Construction and Maintenance occupations in Bellaire are Installation, Maintenance & Repair (53 | 3.2%), and Construction & Extraction (41 | 2.5%).
Natural Resources, Construction and Maintenance Occupations by Sex
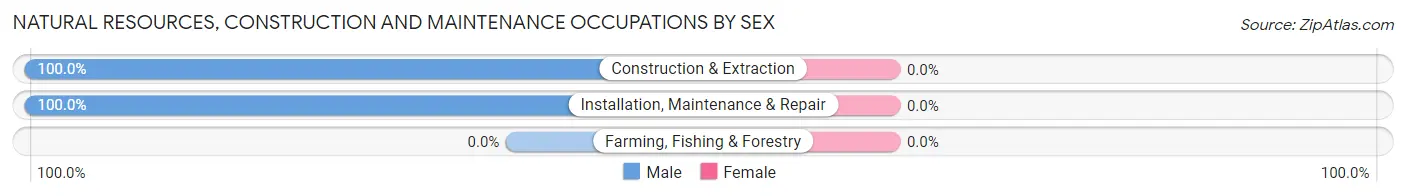
| Occupation | Male | Female |
| Farming, Fishing & Forestry | 0 (0.0%) | 0 (0.0%) |
| Construction & Extraction | 41 (100.0%) | 0 (0.0%) |
| Installation, Maintenance & Repair | 53 (100.0%) | 0 (0.0%) |
| Total (Category) | 94 (100.0%) | 0 (0.0%) |
| Total (Overall) | 976 (59.4%) | 666 (40.6%) |
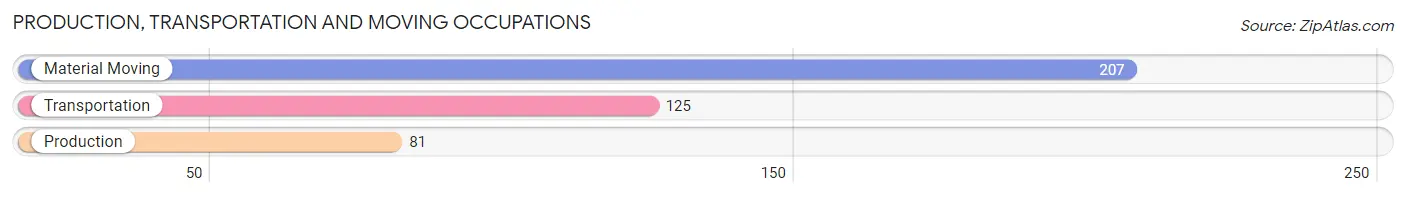
Production, Transportation and Moving Occupations
The most common Production, Transportation and Moving occupations in Bellaire are Material Moving (207 | 12.6%), Transportation (125 | 7.6%), and Production (81 | 4.9%).
Production, Transportation and Moving Occupations by Sex
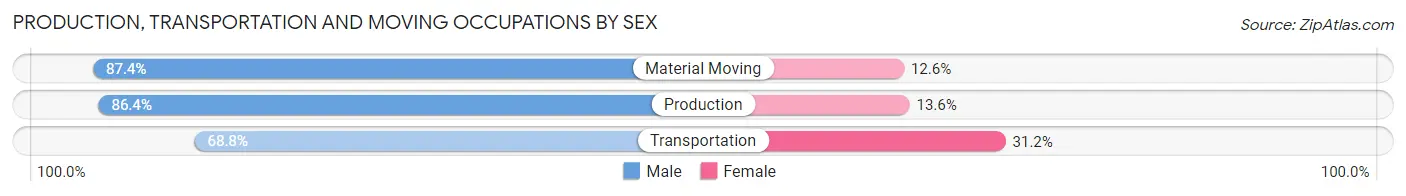
| Occupation | Male | Female |
| Production | 70 (86.4%) | 11 (13.6%) |
| Transportation | 86 (68.8%) | 39 (31.2%) |
| Material Moving | 181 (87.4%) | 26 (12.6%) |
| Total (Category) | 337 (81.6%) | 76 (18.4%) |
| Total (Overall) | 976 (59.4%) | 666 (40.6%) |
Employment Industries by Sex in Bellaire
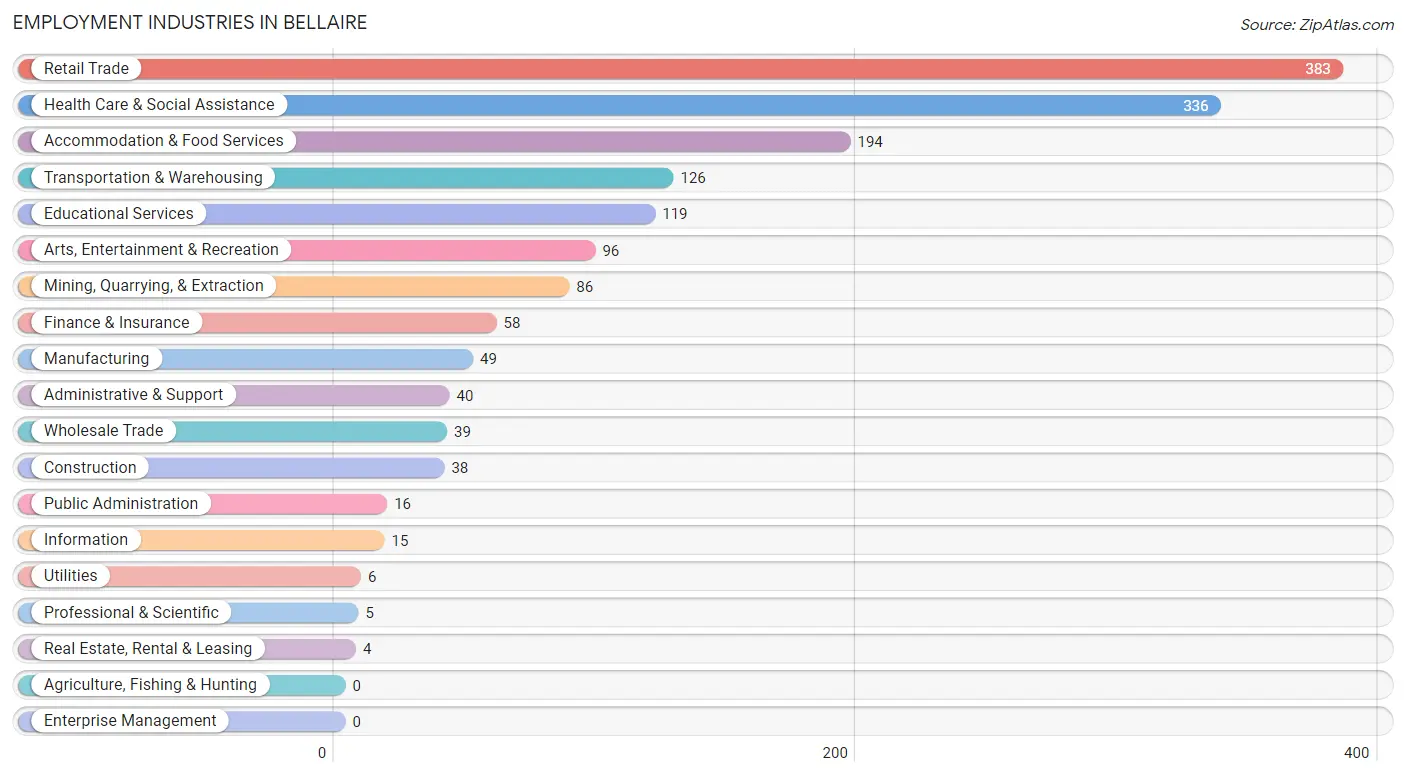
Employment Industries in Bellaire
The major employment industries in Bellaire include Retail Trade (383 | 23.3%), Health Care & Social Assistance (336 | 20.5%), Accommodation & Food Services (194 | 11.8%), Transportation & Warehousing (126 | 7.7%), and Educational Services (119 | 7.2%).
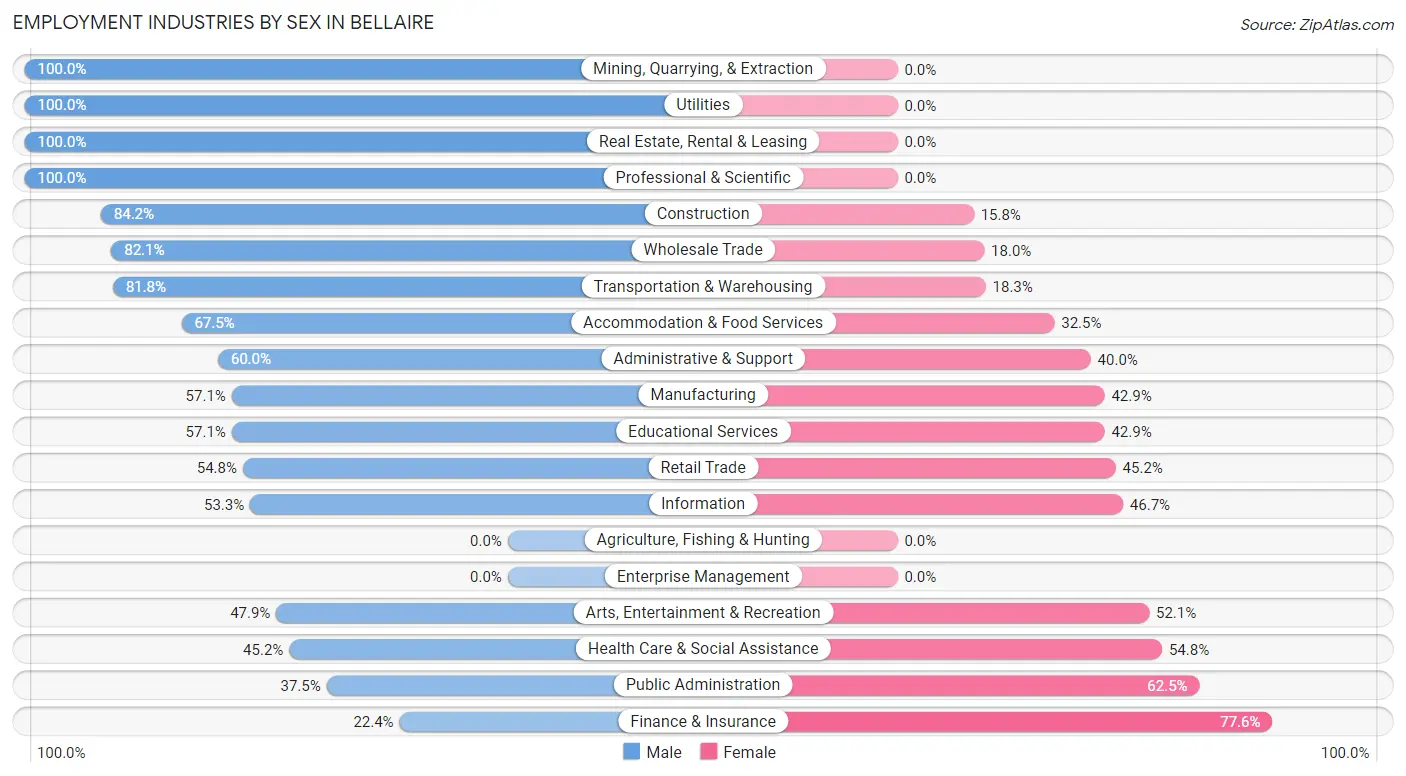
Employment Industries by Sex in Bellaire
The Bellaire industries that see more men than women are Mining, Quarrying, & Extraction (100.0%), Utilities (100.0%), and Real Estate, Rental & Leasing (100.0%), whereas the industries that tend to have a higher number of women are Finance & Insurance (77.6%), Public Administration (62.5%), and Health Care & Social Assistance (54.8%).
| Industry | Male | Female |
| Agriculture, Fishing & Hunting | 0 (0.0%) | 0 (0.0%) |
| Mining, Quarrying, & Extraction | 86 (100.0%) | 0 (0.0%) |
| Construction | 32 (84.2%) | 6 (15.8%) |
| Manufacturing | 28 (57.1%) | 21 (42.9%) |
| Wholesale Trade | 32 (82.1%) | 7 (17.9%) |
| Retail Trade | 210 (54.8%) | 173 (45.2%) |
| Transportation & Warehousing | 103 (81.8%) | 23 (18.2%) |
| Utilities | 6 (100.0%) | 0 (0.0%) |
| Information | 8 (53.3%) | 7 (46.7%) |
| Finance & Insurance | 13 (22.4%) | 45 (77.6%) |
| Real Estate, Rental & Leasing | 4 (100.0%) | 0 (0.0%) |
| Professional & Scientific | 5 (100.0%) | 0 (0.0%) |
| Enterprise Management | 0 (0.0%) | 0 (0.0%) |
| Administrative & Support | 24 (60.0%) | 16 (40.0%) |
| Educational Services | 68 (57.1%) | 51 (42.9%) |
| Health Care & Social Assistance | 152 (45.2%) | 184 (54.8%) |
| Arts, Entertainment & Recreation | 46 (47.9%) | 50 (52.1%) |
| Accommodation & Food Services | 131 (67.5%) | 63 (32.5%) |
| Public Administration | 6 (37.5%) | 10 (62.5%) |
| Total | 976 (59.4%) | 666 (40.6%) |
Education in Bellaire
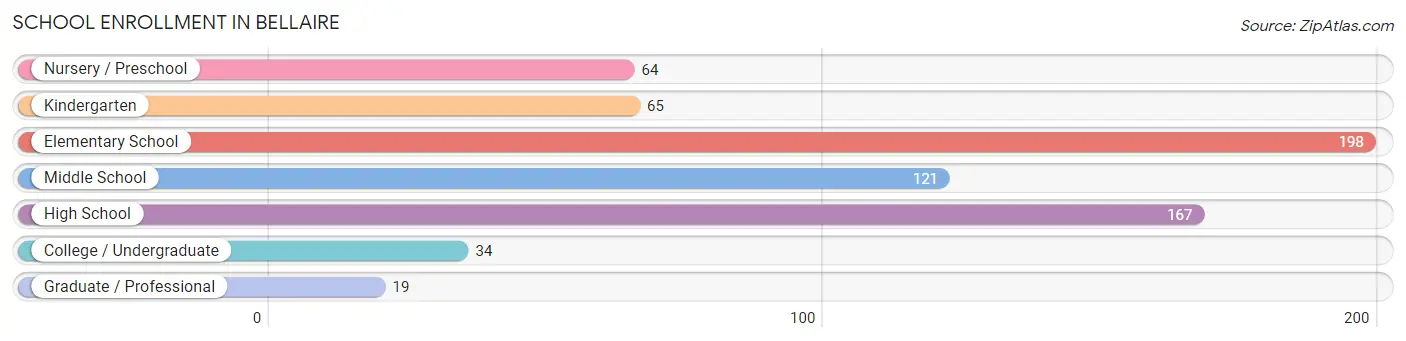
School Enrollment in Bellaire
The most common levels of schooling among the 668 students in Bellaire are elementary school (198 | 29.6%), high school (167 | 25.0%), and middle school (121 | 18.1%).
| School Level | # Students | % Students |
| Nursery / Preschool | 64 | 9.6% |
| Kindergarten | 65 | 9.7% |
| Elementary School | 198 | 29.6% |
| Middle School | 121 | 18.1% |
| High School | 167 | 25.0% |
| College / Undergraduate | 34 | 5.1% |
| Graduate / Professional | 19 | 2.8% |
| Total | 668 | 100.0% |
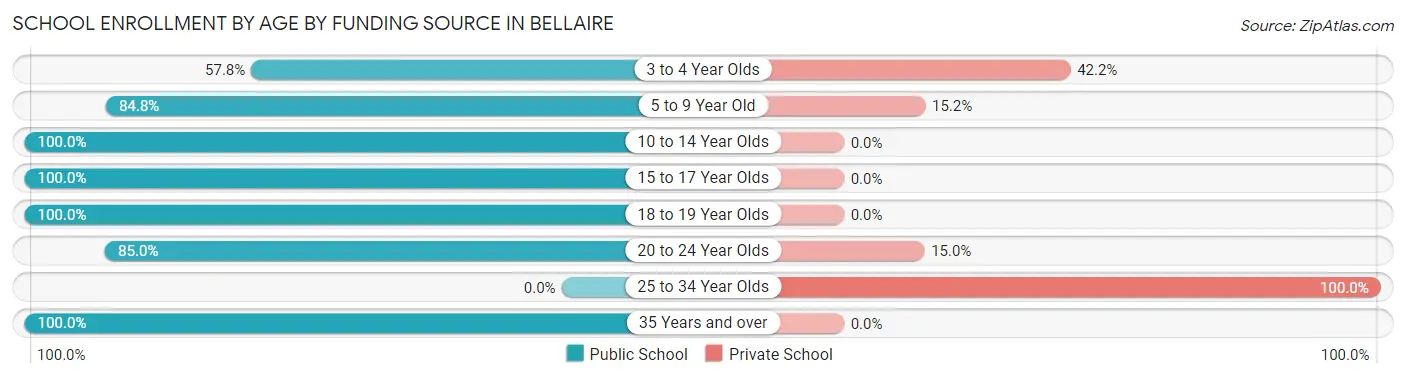
School Enrollment by Age by Funding Source in Bellaire
Out of a total of 668 students who are enrolled in schools in Bellaire, 80 (12.0%) attend a private institution, while the remaining 588 (88.0%) are enrolled in public schools. The age group of 25 to 34 year olds has the highest likelihood of being enrolled in private schools, with 13 (100.0% in the age bracket) enrolled. Conversely, the age group of 10 to 14 year olds has the lowest likelihood of being enrolled in a private school, with 162 (100.0% in the age bracket) attending a public institution.
| Age Bracket | Public School | Private School |
| 3 to 4 Year Olds | 37 (57.8%) | 27 (42.2%) |
| 5 to 9 Year Old | 207 (84.8%) | 37 (15.2%) |
| 10 to 14 Year Olds | 162 (100.0%) | 0 (0.0%) |
| 15 to 17 Year Olds | 93 (100.0%) | 0 (0.0%) |
| 18 to 19 Year Olds | 57 (100.0%) | 0 (0.0%) |
| 20 to 24 Year Olds | 17 (85.0%) | 3 (15.0%) |
| 25 to 34 Year Olds | 0 (0.0%) | 13 (100.0%) |
| 35 Years and over | 15 (100.0%) | 0 (0.0%) |
| Total | 588 (88.0%) | 80 (12.0%) |
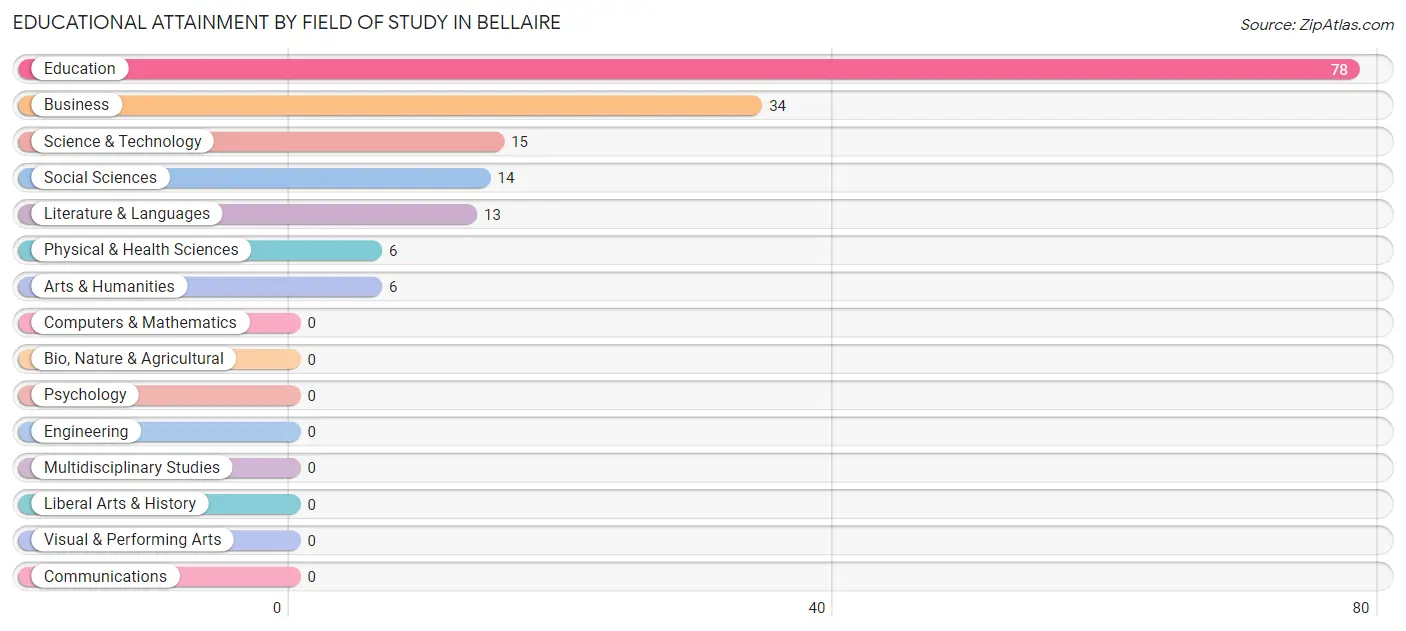
Educational Attainment by Field of Study in Bellaire
Education (78 | 47.0%), business (34 | 20.5%), science & technology (15 | 9.0%), social sciences (14 | 8.4%), and literature & languages (13 | 7.8%) are the most common fields of study among 166 individuals in Bellaire who have obtained a bachelor's degree or higher.
| Field of Study | # Graduates | % Graduates |
| Computers & Mathematics | 0 | 0.0% |
| Bio, Nature & Agricultural | 0 | 0.0% |
| Physical & Health Sciences | 6 | 3.6% |
| Psychology | 0 | 0.0% |
| Social Sciences | 14 | 8.4% |
| Engineering | 0 | 0.0% |
| Multidisciplinary Studies | 0 | 0.0% |
| Science & Technology | 15 | 9.0% |
| Business | 34 | 20.5% |
| Education | 78 | 47.0% |
| Literature & Languages | 13 | 7.8% |
| Liberal Arts & History | 0 | 0.0% |
| Visual & Performing Arts | 0 | 0.0% |
| Communications | 0 | 0.0% |
| Arts & Humanities | 6 | 3.6% |
| Total | 166 | 100.0% |
Transportation & Commute in Bellaire
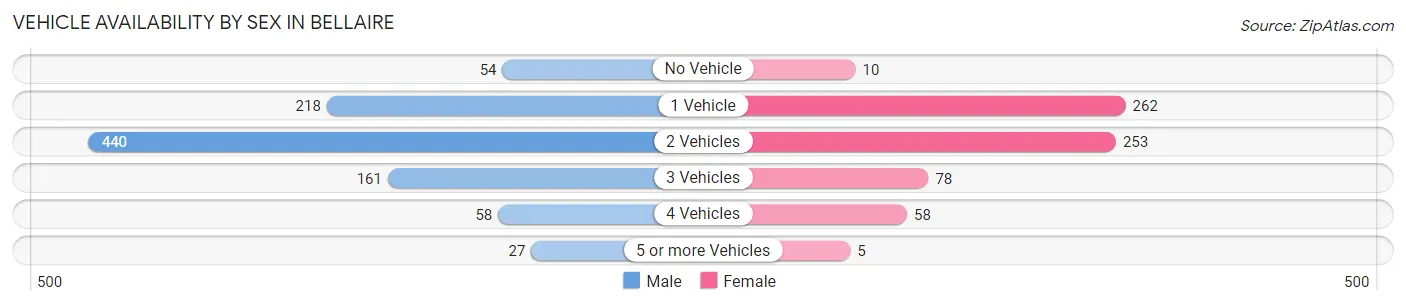
Vehicle Availability by Sex in Bellaire
The most prevalent vehicle ownership categories in Bellaire are males with 2 vehicles (440, accounting for 45.9%) and females with 2 vehicles (253, making up 66.1%).
| Vehicles Available | Male | Female |
| No Vehicle | 54 (5.6%) | 10 (1.5%) |
| 1 Vehicle | 218 (22.8%) | 262 (39.3%) |
| 2 Vehicles | 440 (45.9%) | 253 (38.0%) |
| 3 Vehicles | 161 (16.8%) | 78 (11.7%) |
| 4 Vehicles | 58 (6.0%) | 58 (8.7%) |
| 5 or more Vehicles | 27 (2.8%) | 5 (0.7%) |
| Total | 958 (100.0%) | 666 (100.0%) |
Commute Time in Bellaire
The most frequently occuring commute durations in Bellaire are 20 to 24 minutes (358 commuters, 23.3%), 15 to 19 minutes (285 commuters, 18.6%), and 10 to 14 minutes (257 commuters, 16.8%).
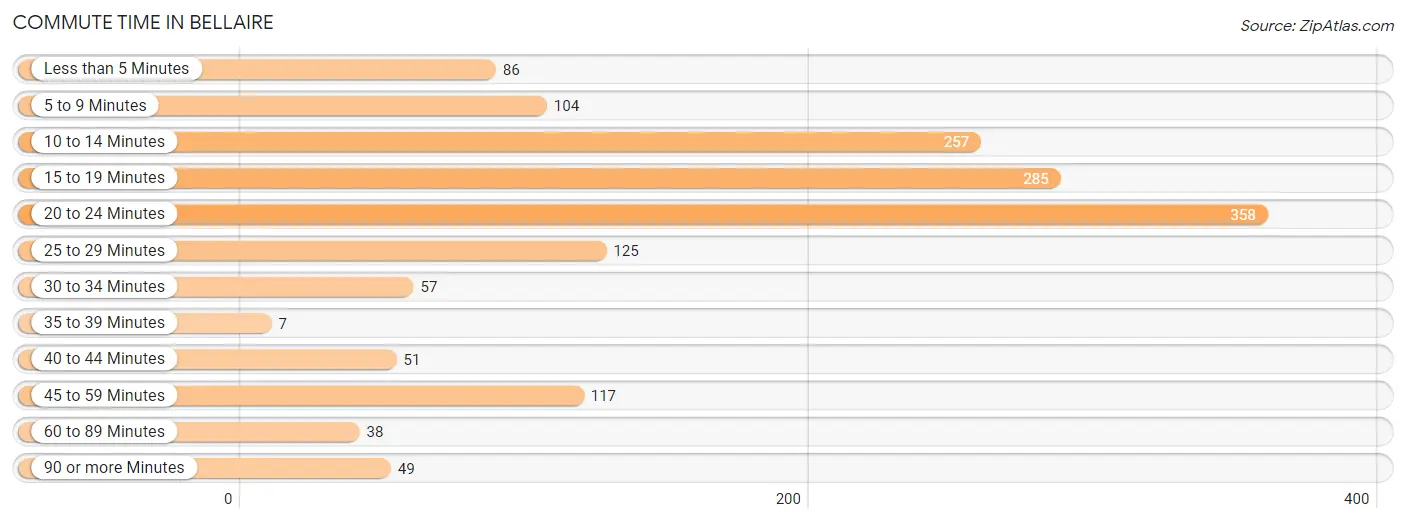
| Commute Time | # Commuters | % Commuters |
| Less than 5 Minutes | 86 | 5.6% |
| 5 to 9 Minutes | 104 | 6.8% |
| 10 to 14 Minutes | 257 | 16.8% |
| 15 to 19 Minutes | 285 | 18.6% |
| 20 to 24 Minutes | 358 | 23.3% |
| 25 to 29 Minutes | 125 | 8.2% |
| 30 to 34 Minutes | 57 | 3.7% |
| 35 to 39 Minutes | 7 | 0.5% |
| 40 to 44 Minutes | 51 | 3.3% |
| 45 to 59 Minutes | 117 | 7.6% |
| 60 to 89 Minutes | 38 | 2.5% |
| 90 or more Minutes | 49 | 3.2% |
Commute Time by Sex in Bellaire
The most common commute times in Bellaire are 10 to 14 minutes (176 commuters, 20.0%) for males and 20 to 24 minutes (198 commuters, 30.4%) for females.
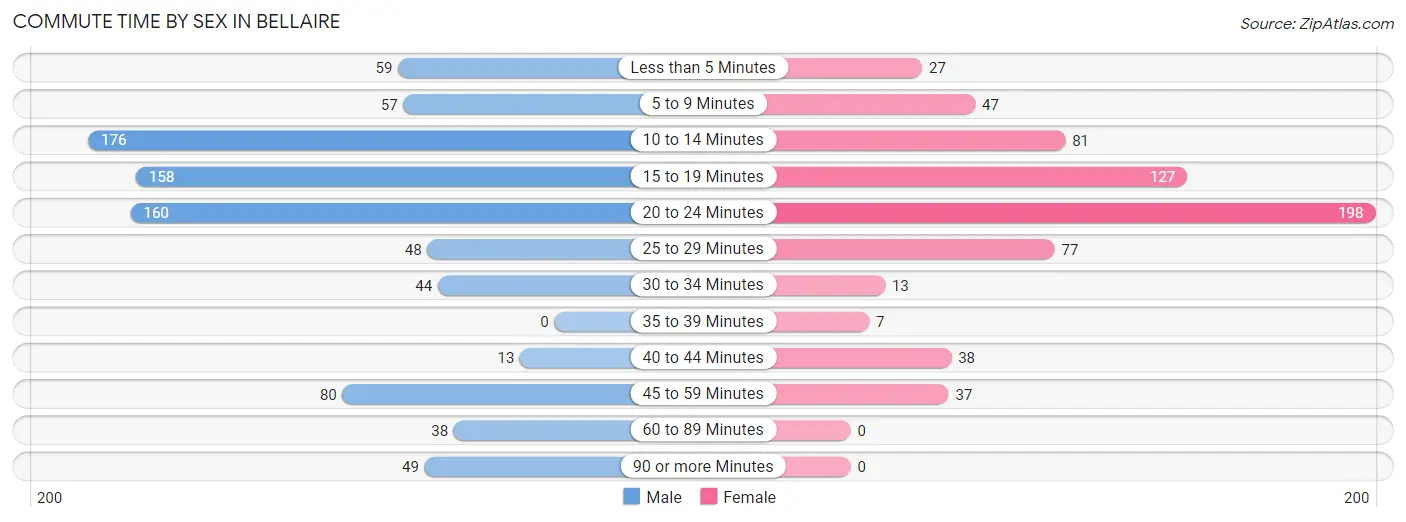
| Commute Time | Male | Female |
| Less than 5 Minutes | 59 (6.7%) | 27 (4.1%) |
| 5 to 9 Minutes | 57 (6.5%) | 47 (7.2%) |
| 10 to 14 Minutes | 176 (20.0%) | 81 (12.4%) |
| 15 to 19 Minutes | 158 (17.9%) | 127 (19.5%) |
| 20 to 24 Minutes | 160 (18.1%) | 198 (30.4%) |
| 25 to 29 Minutes | 48 (5.4%) | 77 (11.8%) |
| 30 to 34 Minutes | 44 (5.0%) | 13 (2.0%) |
| 35 to 39 Minutes | 0 (0.0%) | 7 (1.1%) |
| 40 to 44 Minutes | 13 (1.5%) | 38 (5.8%) |
| 45 to 59 Minutes | 80 (9.1%) | 37 (5.7%) |
| 60 to 89 Minutes | 38 (4.3%) | 0 (0.0%) |
| 90 or more Minutes | 49 (5.6%) | 0 (0.0%) |
Time of Departure to Work by Sex in Bellaire
The most frequent times of departure to work in Bellaire are 5:30 AM to 5:59 AM (139, 15.8%) for males and 8:00 AM to 8:29 AM (135, 20.7%) for females.
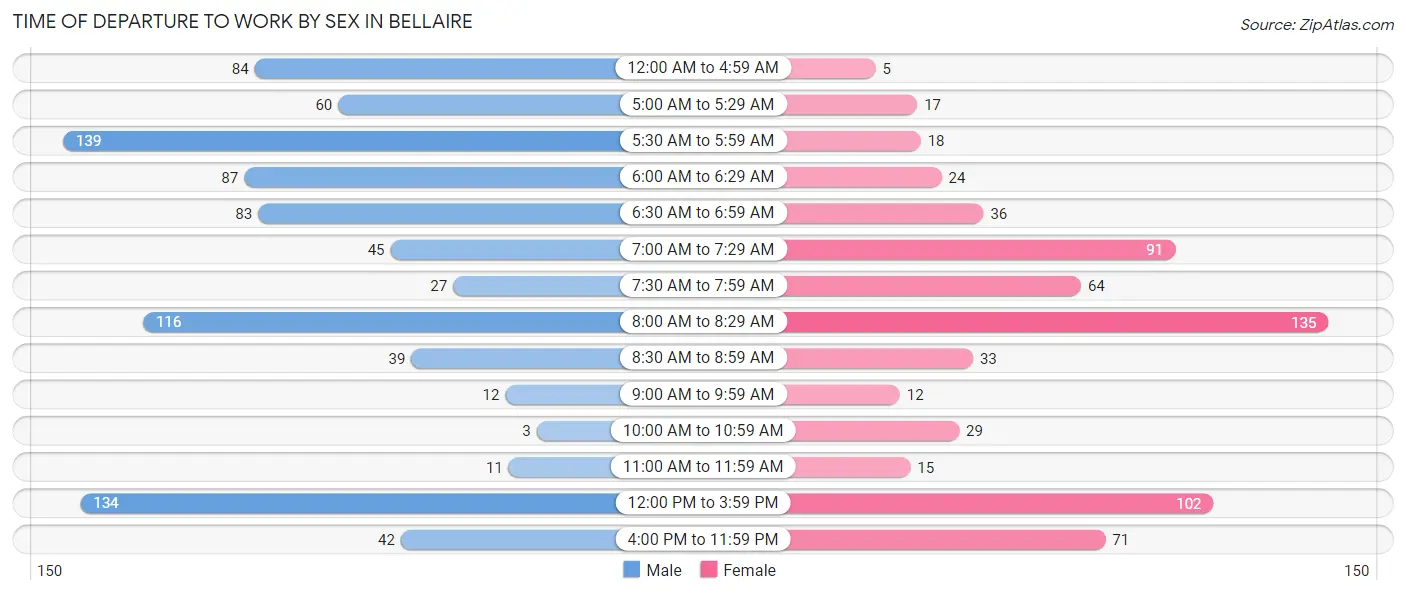
| Time of Departure | Male | Female |
| 12:00 AM to 4:59 AM | 84 (9.5%) | 5 (0.8%) |
| 5:00 AM to 5:29 AM | 60 (6.8%) | 17 (2.6%) |
| 5:30 AM to 5:59 AM | 139 (15.8%) | 18 (2.8%) |
| 6:00 AM to 6:29 AM | 87 (9.9%) | 24 (3.7%) |
| 6:30 AM to 6:59 AM | 83 (9.4%) | 36 (5.5%) |
| 7:00 AM to 7:29 AM | 45 (5.1%) | 91 (14.0%) |
| 7:30 AM to 7:59 AM | 27 (3.1%) | 64 (9.8%) |
| 8:00 AM to 8:29 AM | 116 (13.2%) | 135 (20.7%) |
| 8:30 AM to 8:59 AM | 39 (4.4%) | 33 (5.1%) |
| 9:00 AM to 9:59 AM | 12 (1.4%) | 12 (1.8%) |
| 10:00 AM to 10:59 AM | 3 (0.3%) | 29 (4.4%) |
| 11:00 AM to 11:59 AM | 11 (1.3%) | 15 (2.3%) |
| 12:00 PM to 3:59 PM | 134 (15.2%) | 102 (15.6%) |
| 4:00 PM to 11:59 PM | 42 (4.8%) | 71 (10.9%) |
| Total | 882 (100.0%) | 652 (100.0%) |
Housing Occupancy in Bellaire
Occupancy by Ownership in Bellaire
Of the total 1,502 dwellings in Bellaire, owner-occupied units account for 839 (55.9%), while renter-occupied units make up 663 (44.1%).
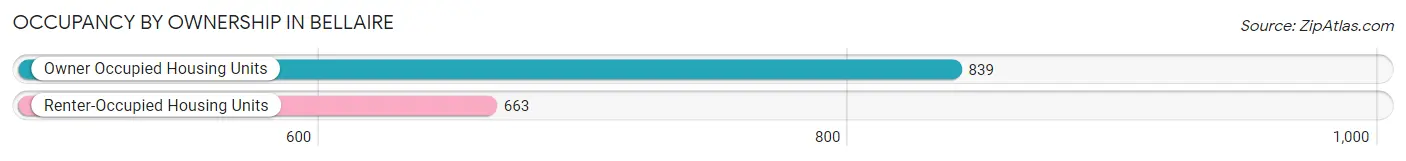
| Occupancy | # Housing Units | % Housing Units |
| Owner Occupied Housing Units | 839 | 55.9% |
| Renter-Occupied Housing Units | 663 | 44.1% |
| Total Occupied Housing Units | 1,502 | 100.0% |
Occupancy by Household Size in Bellaire
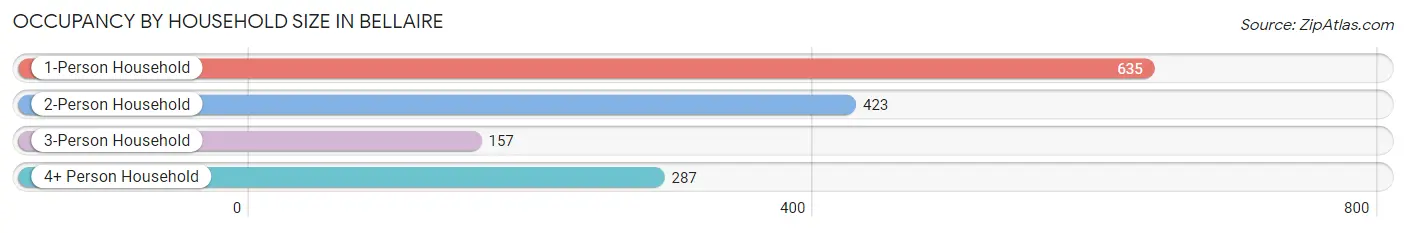
| Household Size | # Housing Units | % Housing Units |
| 1-Person Household | 635 | 42.3% |
| 2-Person Household | 423 | 28.2% |
| 3-Person Household | 157 | 10.4% |
| 4+ Person Household | 287 | 19.1% |
| Total Housing Units | 1,502 | 100.0% |
Occupancy by Ownership by Household Size in Bellaire
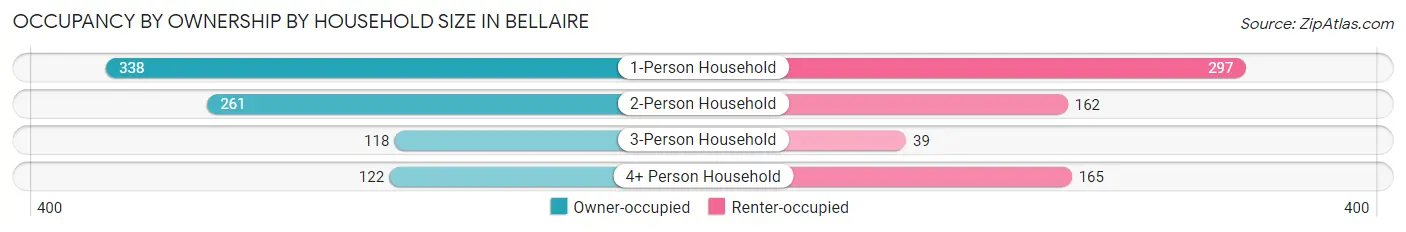
| Household Size | Owner-occupied | Renter-occupied |
| 1-Person Household | 338 (53.2%) | 297 (46.8%) |
| 2-Person Household | 261 (61.7%) | 162 (38.3%) |
| 3-Person Household | 118 (75.2%) | 39 (24.8%) |
| 4+ Person Household | 122 (42.5%) | 165 (57.5%) |
| Total Housing Units | 839 (55.9%) | 663 (44.1%) |
Occupancy by Educational Attainment in Bellaire
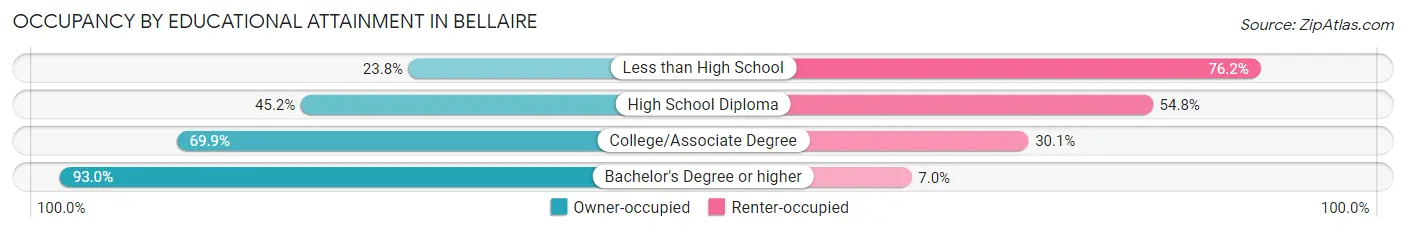
| Household Size | Owner-occupied | Renter-occupied |
| Less than High School | 25 (23.8%) | 80 (76.2%) |
| High School Diploma | 333 (45.2%) | 404 (54.8%) |
| College/Associate Degree | 401 (69.9%) | 173 (30.1%) |
| Bachelor's Degree or higher | 80 (93.0%) | 6 (7.0%) |
Occupancy by Age of Householder in Bellaire
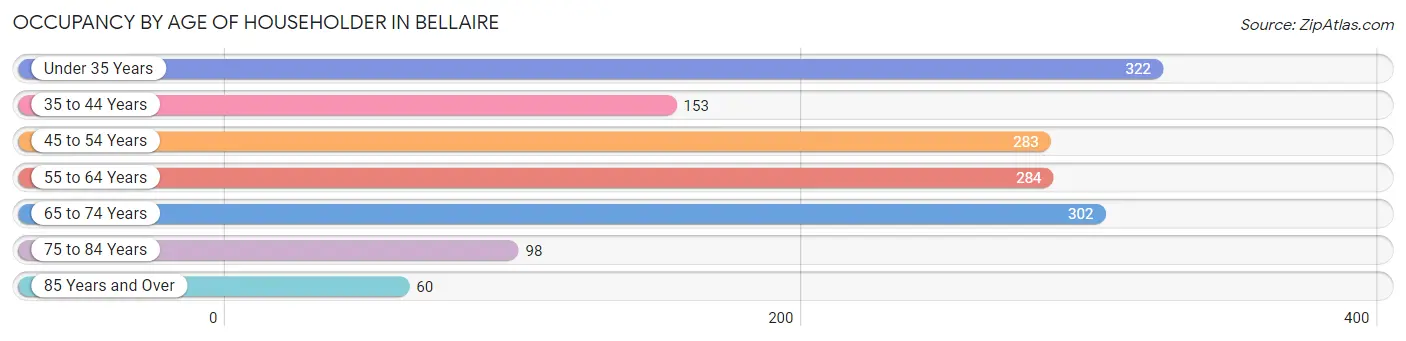
| Age Bracket | # Households | % Households |
| Under 35 Years | 322 | 21.4% |
| 35 to 44 Years | 153 | 10.2% |
| 45 to 54 Years | 283 | 18.8% |
| 55 to 64 Years | 284 | 18.9% |
| 65 to 74 Years | 302 | 20.1% |
| 75 to 84 Years | 98 | 6.5% |
| 85 Years and Over | 60 | 4.0% |
| Total | 1,502 | 100.0% |
Housing Finances in Bellaire
Median Income by Occupancy in Bellaire
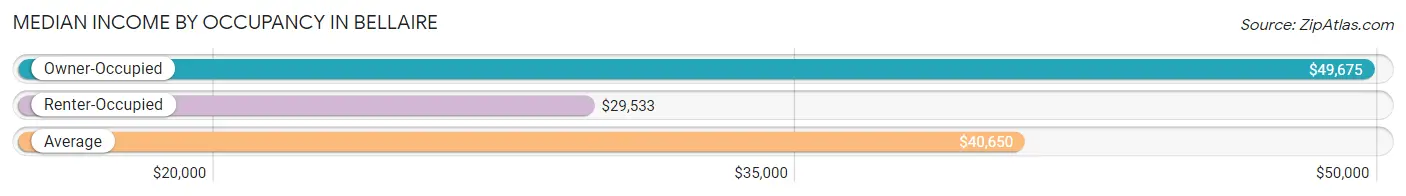
| Occupancy Type | # Households | Median Income |
| Owner-Occupied | 839 (55.9%) | $49,675 |
| Renter-Occupied | 663 (44.1%) | $29,533 |
| Average | 1,502 (100.0%) | $40,650 |
Occupancy by Householder Income Bracket in Bellaire
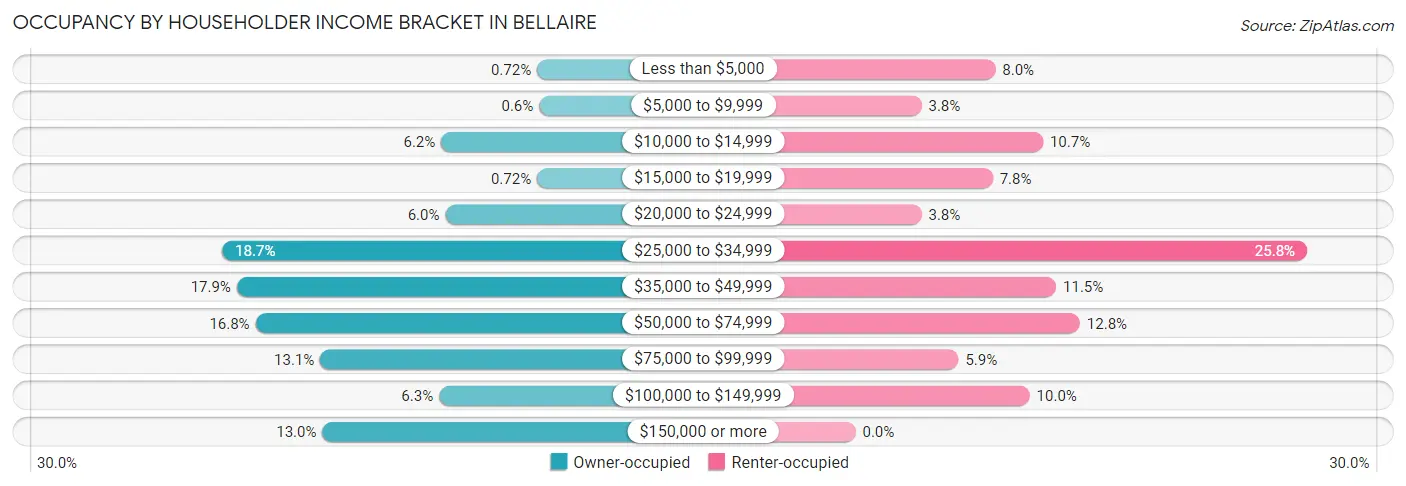
| Income Bracket | Owner-occupied | Renter-occupied |
| Less than $5,000 | 6 (0.7%) | 53 (8.0%) |
| $5,000 to $9,999 | 5 (0.6%) | 25 (3.8%) |
| $10,000 to $14,999 | 52 (6.2%) | 71 (10.7%) |
| $15,000 to $19,999 | 6 (0.7%) | 52 (7.8%) |
| $20,000 to $24,999 | 50 (6.0%) | 25 (3.8%) |
| $25,000 to $34,999 | 157 (18.7%) | 171 (25.8%) |
| $35,000 to $49,999 | 150 (17.9%) | 76 (11.5%) |
| $50,000 to $74,999 | 141 (16.8%) | 85 (12.8%) |
| $75,000 to $99,999 | 110 (13.1%) | 39 (5.9%) |
| $100,000 to $149,999 | 53 (6.3%) | 66 (10.0%) |
| $150,000 or more | 109 (13.0%) | 0 (0.0%) |
| Total | 839 (100.0%) | 663 (100.0%) |
Monthly Housing Cost Tiers in Bellaire
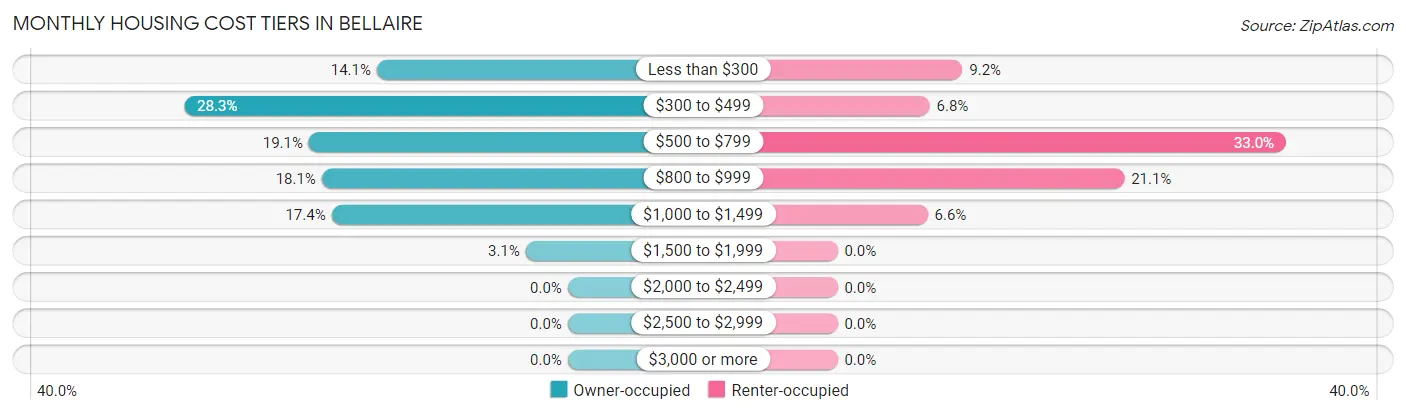
| Monthly Cost | Owner-occupied | Renter-occupied |
| Less than $300 | 118 (14.1%) | 61 (9.2%) |
| $300 to $499 | 237 (28.2%) | 45 (6.8%) |
| $500 to $799 | 160 (19.1%) | 219 (33.0%) |
| $800 to $999 | 152 (18.1%) | 140 (21.1%) |
| $1,000 to $1,499 | 146 (17.4%) | 44 (6.6%) |
| $1,500 to $1,999 | 26 (3.1%) | 0 (0.0%) |
| $2,000 to $2,499 | 0 (0.0%) | 0 (0.0%) |
| $2,500 to $2,999 | 0 (0.0%) | 0 (0.0%) |
| $3,000 or more | 0 (0.0%) | 0 (0.0%) |
| Total | 839 (100.0%) | 663 (100.0%) |
Physical Housing Characteristics in Bellaire
Housing Structures in Bellaire
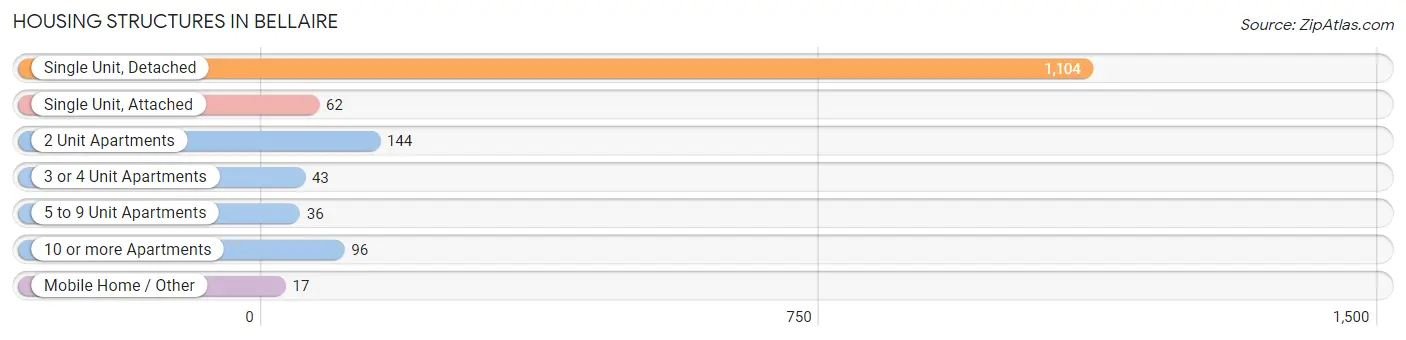
| Structure Type | # Housing Units | % Housing Units |
| Single Unit, Detached | 1,104 | 73.5% |
| Single Unit, Attached | 62 | 4.1% |
| 2 Unit Apartments | 144 | 9.6% |
| 3 or 4 Unit Apartments | 43 | 2.9% |
| 5 to 9 Unit Apartments | 36 | 2.4% |
| 10 or more Apartments | 96 | 6.4% |
| Mobile Home / Other | 17 | 1.1% |
| Total | 1,502 | 100.0% |
Housing Structures by Occupancy in Bellaire
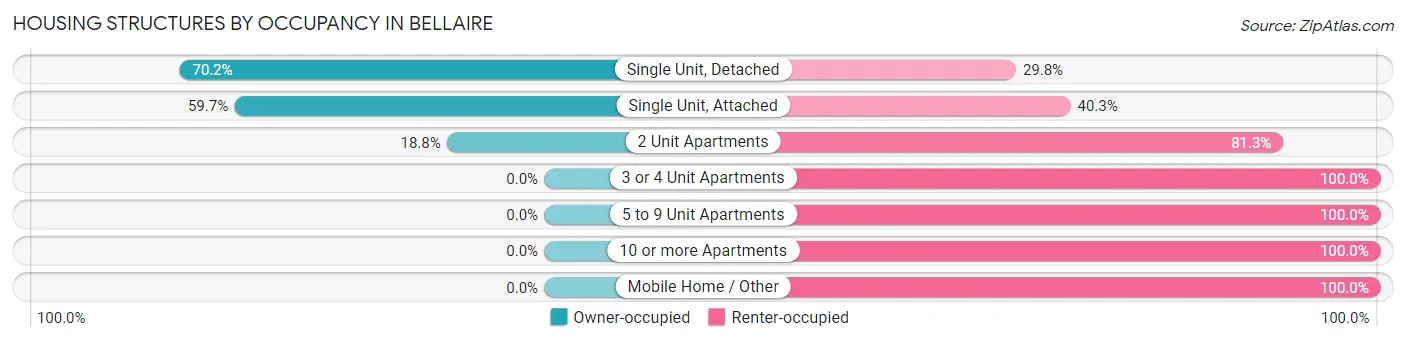
| Structure Type | Owner-occupied | Renter-occupied |
| Single Unit, Detached | 775 (70.2%) | 329 (29.8%) |
| Single Unit, Attached | 37 (59.7%) | 25 (40.3%) |
| 2 Unit Apartments | 27 (18.8%) | 117 (81.2%) |
| 3 or 4 Unit Apartments | 0 (0.0%) | 43 (100.0%) |
| 5 to 9 Unit Apartments | 0 (0.0%) | 36 (100.0%) |
| 10 or more Apartments | 0 (0.0%) | 96 (100.0%) |
| Mobile Home / Other | 0 (0.0%) | 17 (100.0%) |
| Total | 839 (55.9%) | 663 (44.1%) |
Housing Structures by Number of Rooms in Bellaire
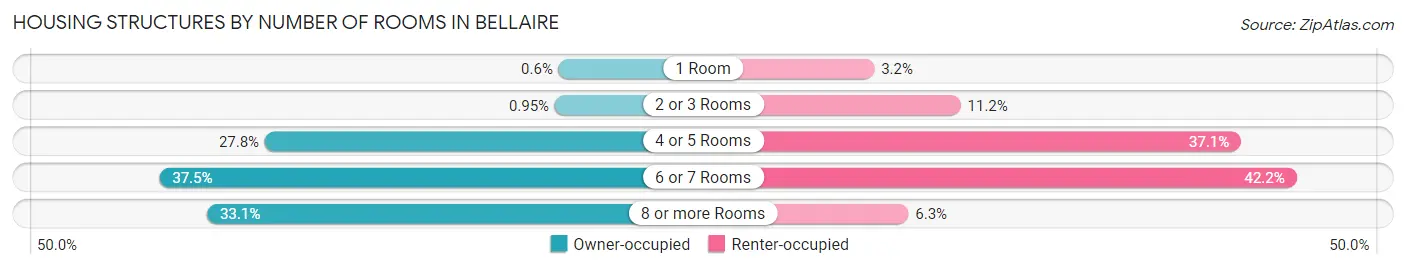
| Number of Rooms | Owner-occupied | Renter-occupied |
| 1 Room | 5 (0.6%) | 21 (3.2%) |
| 2 or 3 Rooms | 8 (0.9%) | 74 (11.2%) |
| 4 or 5 Rooms | 233 (27.8%) | 246 (37.1%) |
| 6 or 7 Rooms | 315 (37.5%) | 280 (42.2%) |
| 8 or more Rooms | 278 (33.1%) | 42 (6.3%) |
| Total | 839 (100.0%) | 663 (100.0%) |
Housing Structure by Heating Type in Bellaire
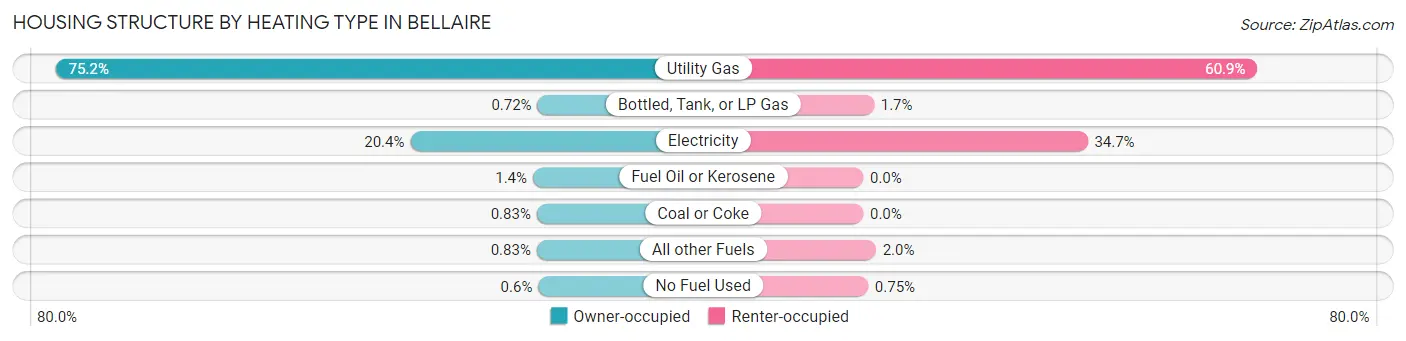
| Heating Type | Owner-occupied | Renter-occupied |
| Utility Gas | 631 (75.2%) | 404 (60.9%) |
| Bottled, Tank, or LP Gas | 6 (0.7%) | 11 (1.7%) |
| Electricity | 171 (20.4%) | 230 (34.7%) |
| Fuel Oil or Kerosene | 12 (1.4%) | 0 (0.0%) |
| Coal or Coke | 7 (0.8%) | 0 (0.0%) |
| All other Fuels | 7 (0.8%) | 13 (2.0%) |
| No Fuel Used | 5 (0.6%) | 5 (0.7%) |
| Total | 839 (100.0%) | 663 (100.0%) |
Household Vehicle Usage in Bellaire
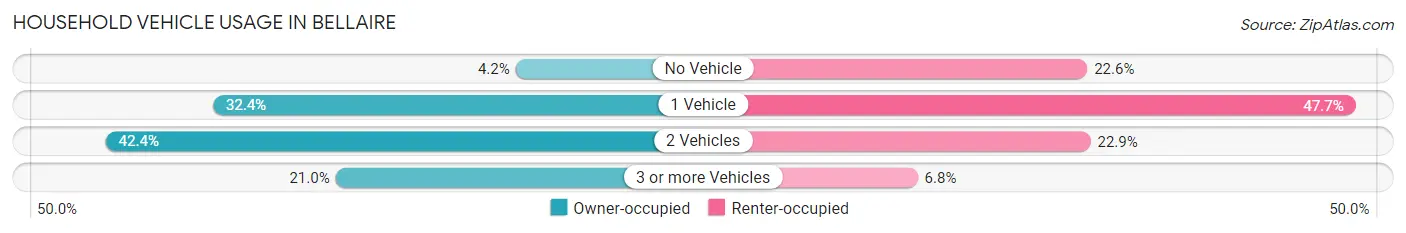
| Vehicles per Household | Owner-occupied | Renter-occupied |
| No Vehicle | 35 (4.2%) | 150 (22.6%) |
| 1 Vehicle | 272 (32.4%) | 316 (47.7%) |
| 2 Vehicles | 356 (42.4%) | 152 (22.9%) |
| 3 or more Vehicles | 176 (21.0%) | 45 (6.8%) |
| Total | 839 (100.0%) | 663 (100.0%) |
Real Estate & Mortgages in Bellaire
Real Estate and Mortgage Overview in Bellaire
| Characteristic | Without Mortgage | With Mortgage |
| Housing Units | 497 | 342 |
| Median Property Value | $84,600 | $88,600 |
| Median Household Income | $41,150 | $47 |
| Monthly Housing Costs | $432 | $0 |
| Real Estate Taxes | $782 | $40 |
Property Value by Mortgage Status in Bellaire
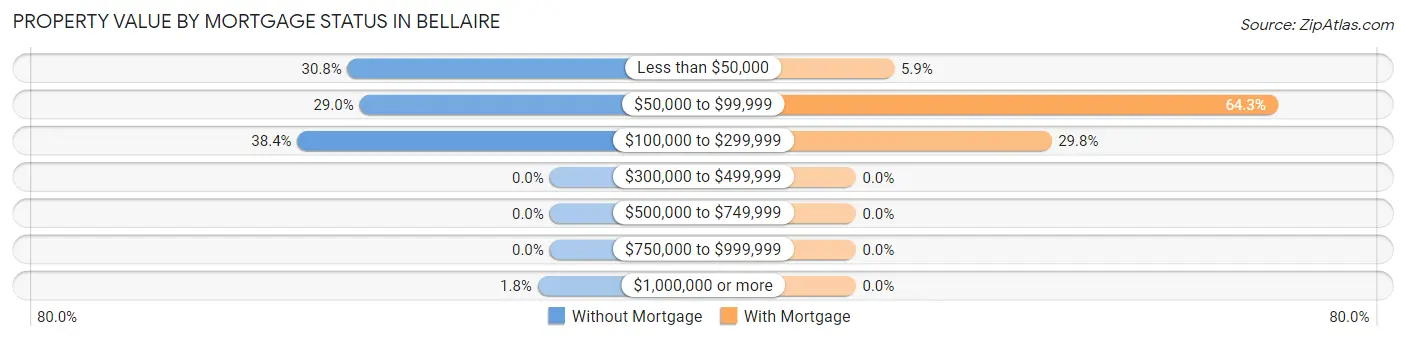
| Property Value | Without Mortgage | With Mortgage |
| Less than $50,000 | 153 (30.8%) | 20 (5.9%) |
| $50,000 to $99,999 | 144 (29.0%) | 220 (64.3%) |
| $100,000 to $299,999 | 191 (38.4%) | 102 (29.8%) |
| $300,000 to $499,999 | 0 (0.0%) | 0 (0.0%) |
| $500,000 to $749,999 | 0 (0.0%) | 0 (0.0%) |
| $750,000 to $999,999 | 0 (0.0%) | 0 (0.0%) |
| $1,000,000 or more | 9 (1.8%) | 0 (0.0%) |
| Total | 497 (100.0%) | 342 (100.0%) |
Household Income by Mortgage Status in Bellaire
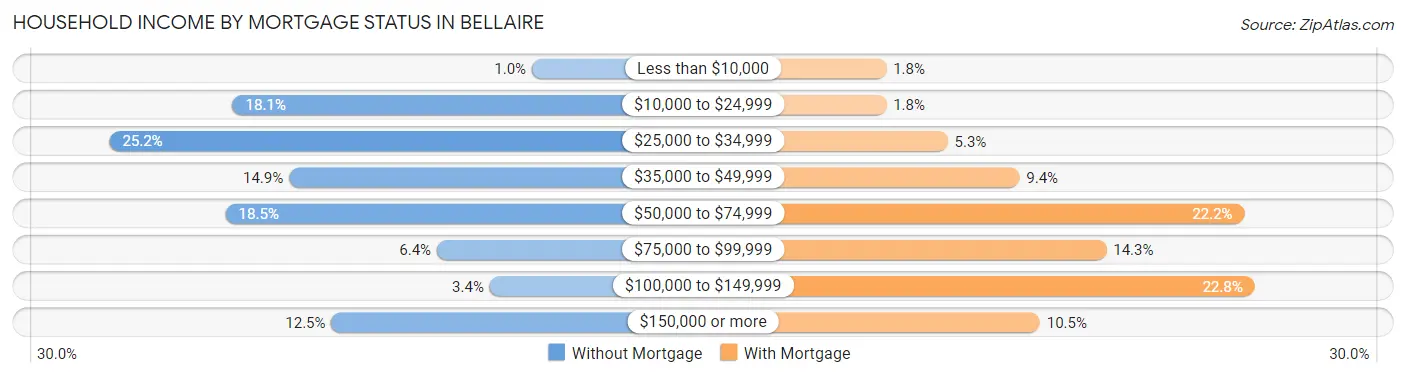
| Household Income | Without Mortgage | With Mortgage |
| Less than $10,000 | 5 (1.0%) | 6 (1.8%) |
| $10,000 to $24,999 | 90 (18.1%) | 6 (1.8%) |
| $25,000 to $34,999 | 125 (25.2%) | 18 (5.3%) |
| $35,000 to $49,999 | 74 (14.9%) | 32 (9.4%) |
| $50,000 to $74,999 | 92 (18.5%) | 76 (22.2%) |
| $75,000 to $99,999 | 32 (6.4%) | 49 (14.3%) |
| $100,000 to $149,999 | 17 (3.4%) | 78 (22.8%) |
| $150,000 or more | 62 (12.5%) | 36 (10.5%) |
| Total | 497 (100.0%) | 342 (100.0%) |
Property Value to Household Income Ratio in Bellaire
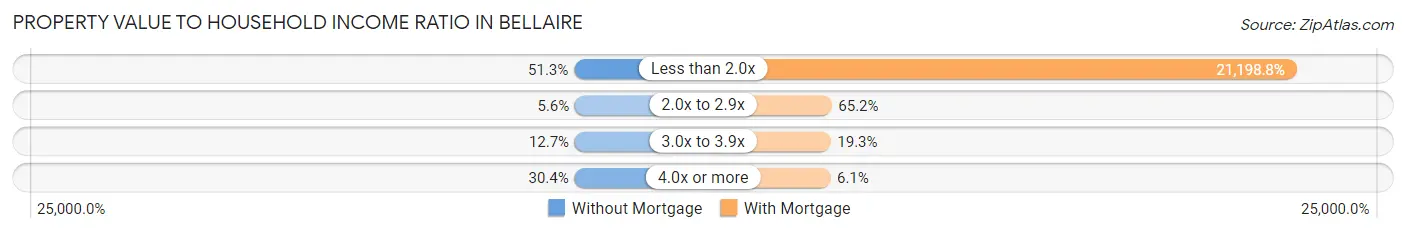
| Value-to-Income Ratio | Without Mortgage | With Mortgage |
| Less than 2.0x | 255 (51.3%) | 72,500 (21,198.8%) |
| 2.0x to 2.9x | 28 (5.6%) | 223 (65.2%) |
| 3.0x to 3.9x | 63 (12.7%) | 66 (19.3%) |
| 4.0x or more | 151 (30.4%) | 21 (6.1%) |
| Total | 497 (100.0%) | 342 (100.0%) |
Real Estate Taxes by Mortgage Status in Bellaire
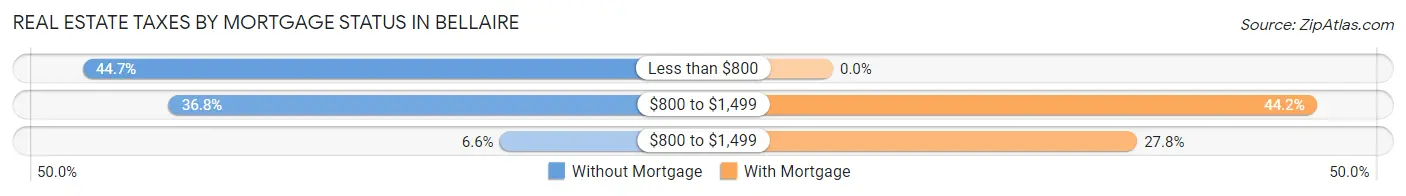
| Property Taxes | Without Mortgage | With Mortgage |
| Less than $800 | 222 (44.7%) | 0 (0.0%) |
| $800 to $1,499 | 183 (36.8%) | 151 (44.2%) |
| $800 to $1,499 | 33 (6.6%) | 95 (27.8%) |
| Total | 497 (100.0%) | 342 (100.0%) |
Health & Disability in Bellaire
Health Insurance Coverage by Age in Bellaire
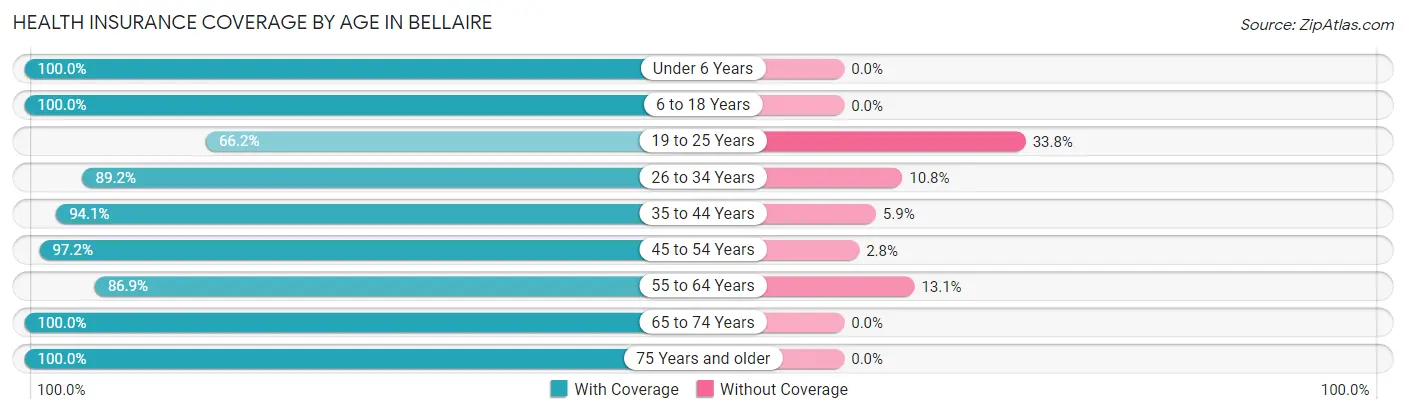
| Age Bracket | With Coverage | Without Coverage |
| Under 6 Years | 410 (100.0%) | 0 (0.0%) |
| 6 to 18 Years | 549 (100.0%) | 0 (0.0%) |
| 19 to 25 Years | 266 (66.2%) | 136 (33.8%) |
| 26 to 34 Years | 486 (89.2%) | 59 (10.8%) |
| 35 to 44 Years | 287 (94.1%) | 18 (5.9%) |
| 45 to 54 Years | 489 (97.2%) | 14 (2.8%) |
| 55 to 64 Years | 472 (86.9%) | 71 (13.1%) |
| 65 to 74 Years | 374 (100.0%) | 0 (0.0%) |
| 75 Years and older | 247 (100.0%) | 0 (0.0%) |
| Total | 3,580 (92.3%) | 298 (7.7%) |
Health Insurance Coverage by Citizenship Status in Bellaire
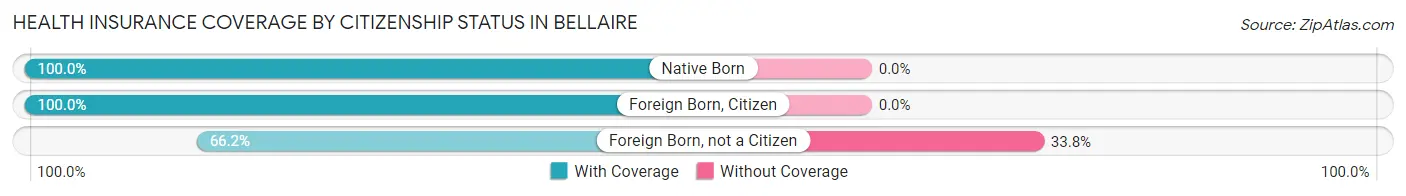
| Citizenship Status | With Coverage | Without Coverage |
| Native Born | 410 (100.0%) | 0 (0.0%) |
| Foreign Born, Citizen | 549 (100.0%) | 0 (0.0%) |
| Foreign Born, not a Citizen | 266 (66.2%) | 136 (33.8%) |
Health Insurance Coverage by Household Income in Bellaire
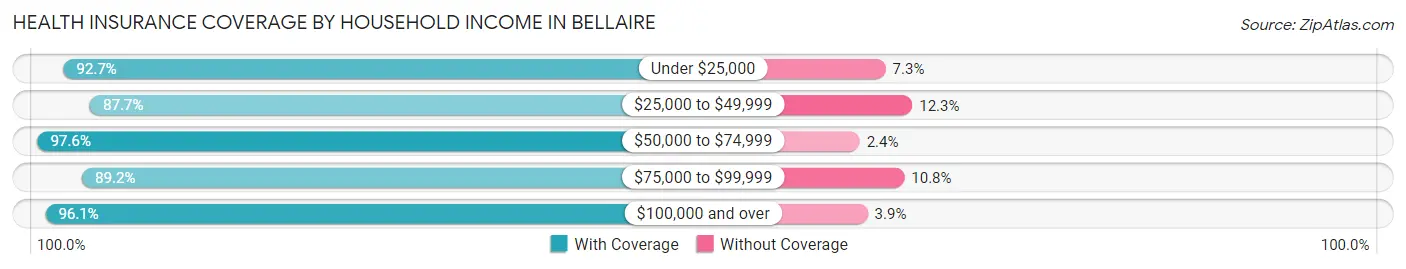
| Household Income | With Coverage | Without Coverage |
| Under $25,000 | 599 (92.7%) | 47 (7.3%) |
| $25,000 to $49,999 | 1,050 (87.7%) | 147 (12.3%) |
| $50,000 to $74,999 | 646 (97.6%) | 16 (2.4%) |
| $75,000 to $99,999 | 430 (89.2%) | 52 (10.8%) |
| $100,000 and over | 787 (96.1%) | 32 (3.9%) |
Public vs Private Health Insurance Coverage by Age in Bellaire
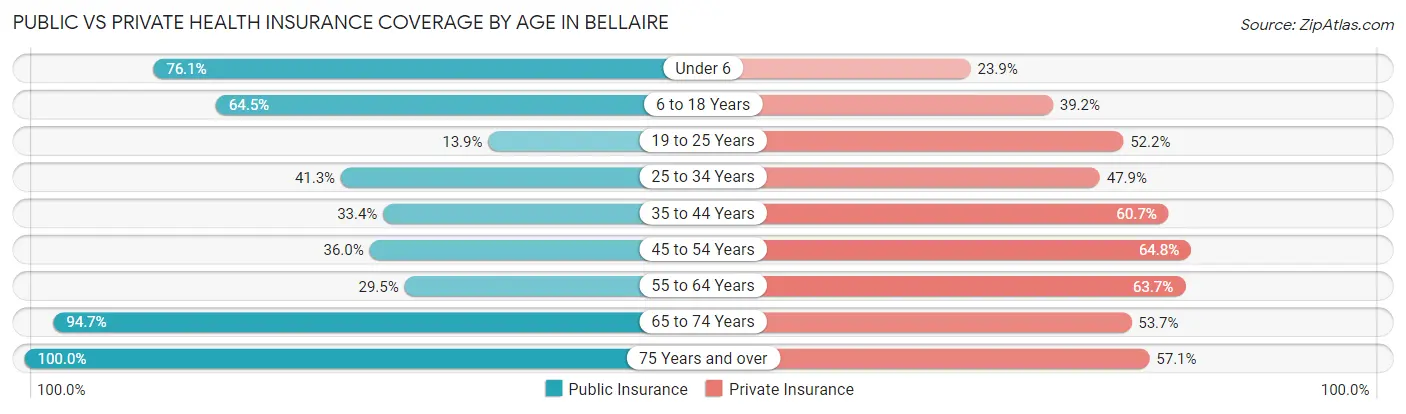
| Age Bracket | Public Insurance | Private Insurance |
| Under 6 | 312 (76.1%) | 98 (23.9%) |
| 6 to 18 Years | 354 (64.5%) | 215 (39.2%) |
| 19 to 25 Years | 56 (13.9%) | 210 (52.2%) |
| 25 to 34 Years | 225 (41.3%) | 261 (47.9%) |
| 35 to 44 Years | 102 (33.4%) | 185 (60.7%) |
| 45 to 54 Years | 181 (36.0%) | 326 (64.8%) |
| 55 to 64 Years | 160 (29.5%) | 346 (63.7%) |
| 65 to 74 Years | 354 (94.7%) | 201 (53.7%) |
| 75 Years and over | 247 (100.0%) | 141 (57.1%) |
| Total | 1,991 (51.3%) | 1,983 (51.1%) |
Disability Status by Sex by Age in Bellaire
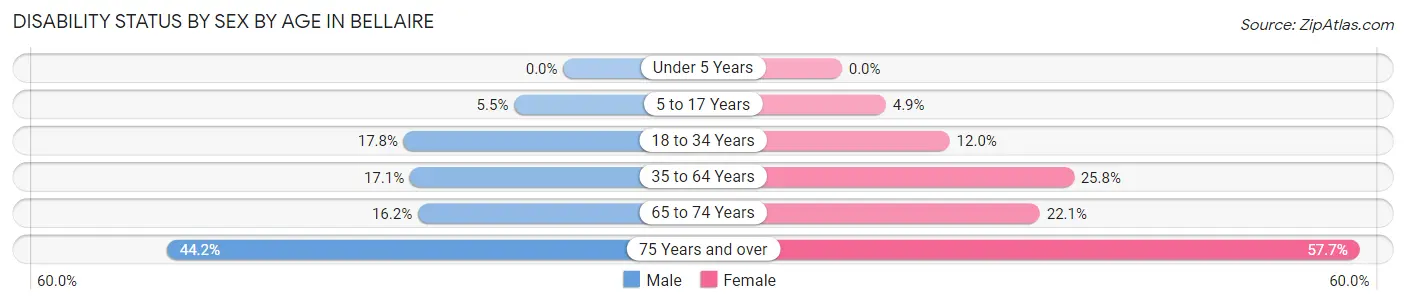
| Age Bracket | Male | Female |
| Under 5 Years | 0 (0.0%) | 0 (0.0%) |
| 5 to 17 Years | 15 (5.5%) | 14 (4.9%) |
| 18 to 34 Years | 99 (17.8%) | 55 (12.0%) |
| 35 to 64 Years | 117 (17.1%) | 172 (25.8%) |
| 65 to 74 Years | 40 (16.2%) | 28 (22.1%) |
| 75 Years and over | 34 (44.2%) | 98 (57.7%) |
Disability Class by Sex by Age in Bellaire
Disability Class: Hearing Difficulty
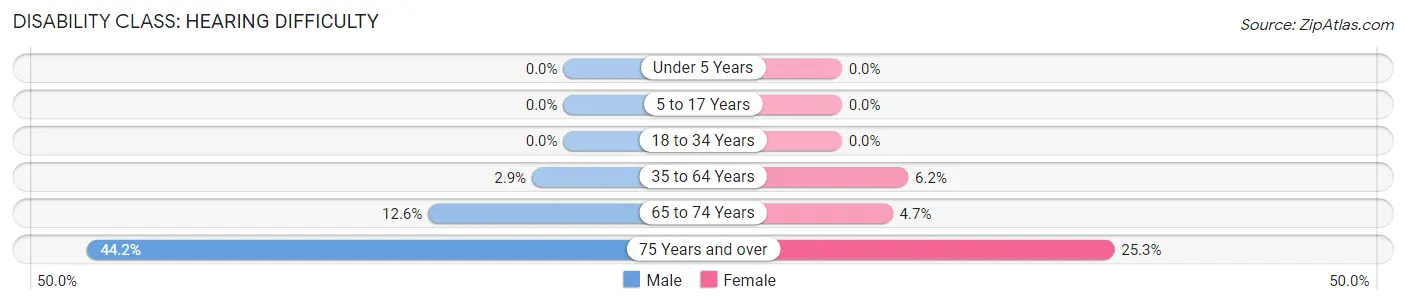
| Age Bracket | Male | Female |
| Under 5 Years | 0 (0.0%) | 0 (0.0%) |
| 5 to 17 Years | 0 (0.0%) | 0 (0.0%) |
| 18 to 34 Years | 0 (0.0%) | 0 (0.0%) |
| 35 to 64 Years | 20 (2.9%) | 41 (6.2%) |
| 65 to 74 Years | 31 (12.6%) | 6 (4.7%) |
| 75 Years and over | 34 (44.2%) | 43 (25.3%) |
Disability Class: Vision Difficulty
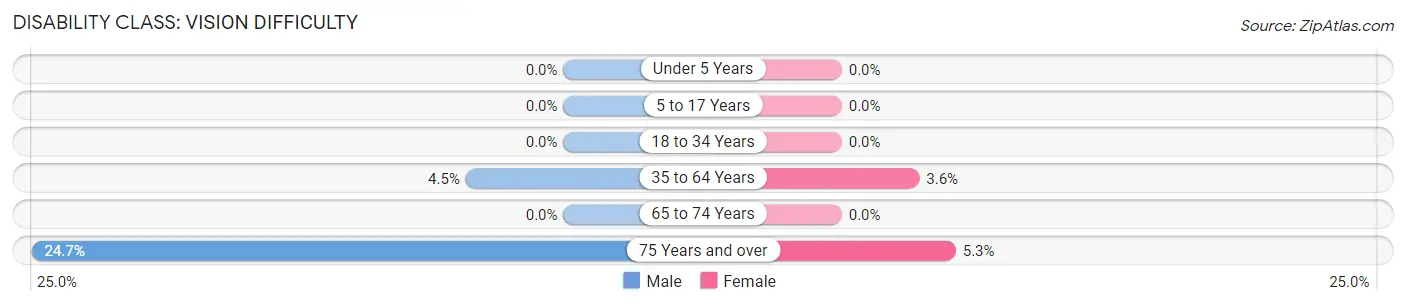
| Age Bracket | Male | Female |
| Under 5 Years | 0 (0.0%) | 0 (0.0%) |
| 5 to 17 Years | 0 (0.0%) | 0 (0.0%) |
| 18 to 34 Years | 0 (0.0%) | 0 (0.0%) |
| 35 to 64 Years | 31 (4.5%) | 24 (3.6%) |
| 65 to 74 Years | 0 (0.0%) | 0 (0.0%) |
| 75 Years and over | 19 (24.7%) | 9 (5.3%) |
Disability Class: Cognitive Difficulty
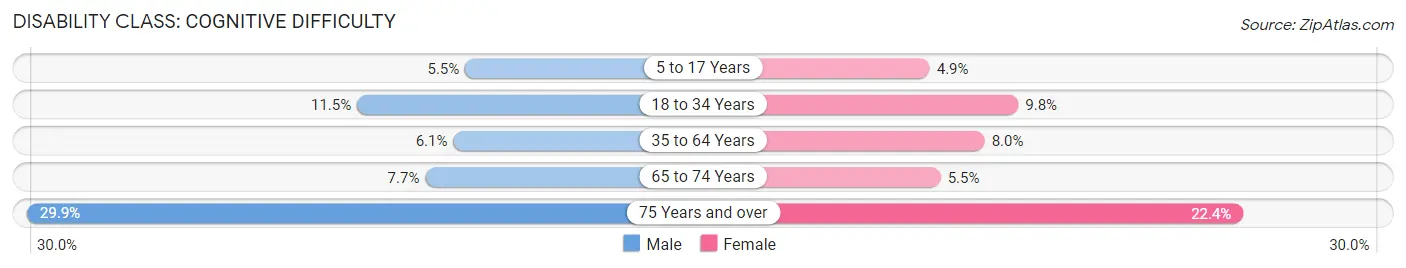
| Age Bracket | Male | Female |
| 5 to 17 Years | 15 (5.5%) | 14 (4.9%) |
| 18 to 34 Years | 64 (11.5%) | 45 (9.8%) |
| 35 to 64 Years | 42 (6.1%) | 53 (8.0%) |
| 65 to 74 Years | 19 (7.7%) | 7 (5.5%) |
| 75 Years and over | 23 (29.9%) | 38 (22.4%) |
Disability Class: Ambulatory Difficulty
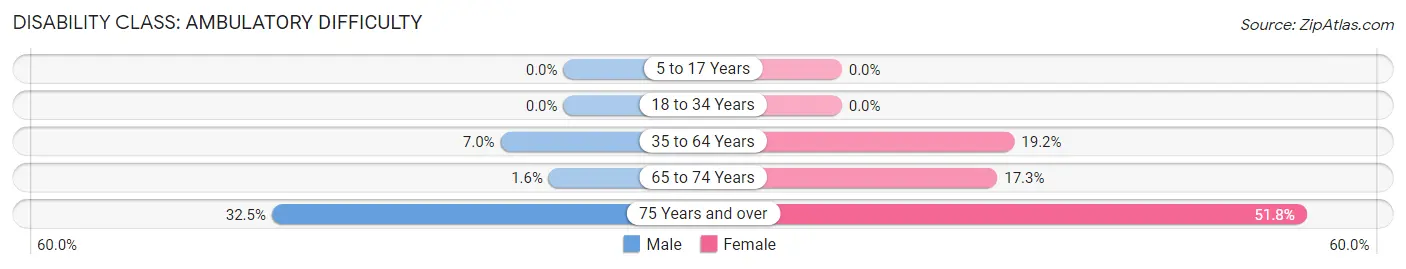
| Age Bracket | Male | Female |
| 5 to 17 Years | 0 (0.0%) | 0 (0.0%) |
| 18 to 34 Years | 0 (0.0%) | 0 (0.0%) |
| 35 to 64 Years | 48 (7.0%) | 128 (19.2%) |
| 65 to 74 Years | 4 (1.6%) | 22 (17.3%) |
| 75 Years and over | 25 (32.5%) | 88 (51.8%) |
Disability Class: Self-Care Difficulty
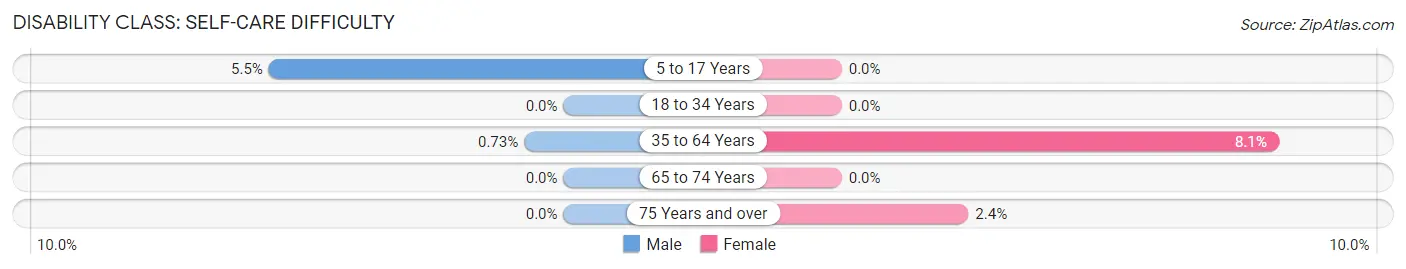
| Age Bracket | Male | Female |
| 5 to 17 Years | 15 (5.5%) | 0 (0.0%) |
| 18 to 34 Years | 0 (0.0%) | 0 (0.0%) |
| 35 to 64 Years | 5 (0.7%) | 54 (8.1%) |
| 65 to 74 Years | 0 (0.0%) | 0 (0.0%) |
| 75 Years and over | 0 (0.0%) | 4 (2.4%) |
Technology Access in Bellaire
Computing Device Access in Bellaire
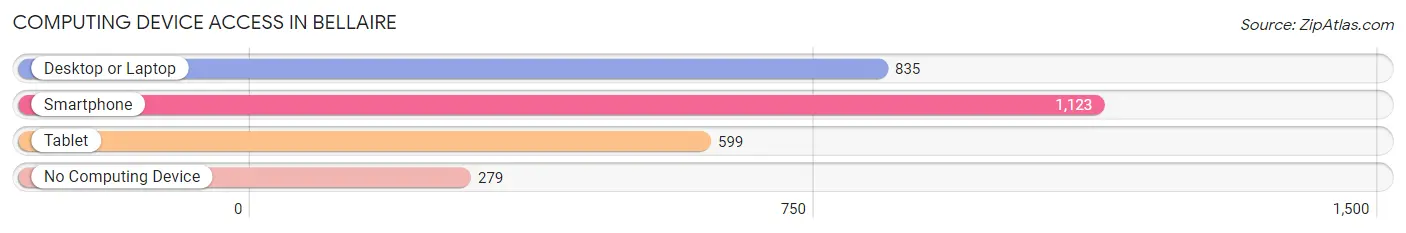
| Device Type | # Households | % Households |
| Desktop or Laptop | 835 | 55.6% |
| Smartphone | 1,123 | 74.8% |
| Tablet | 599 | 39.9% |
| No Computing Device | 279 | 18.6% |
| Total | 1,502 | 100.0% |
Internet Access in Bellaire
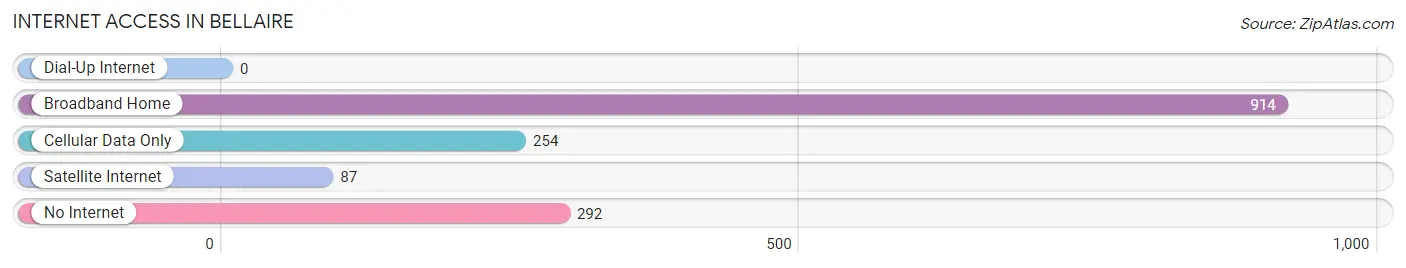
| Internet Type | # Households | % Households |
| Dial-Up Internet | 0 | 0.0% |
| Broadband Home | 914 | 60.9% |
| Cellular Data Only | 254 | 16.9% |
| Satellite Internet | 87 | 5.8% |
| No Internet | 292 | 19.4% |
| Total | 1,502 | 100.0% |
Bellaire Summary
Bellaire, Ohio is a small village located in Belmont County, Ohio. It is situated along the Ohio River, just south of Wheeling, West Virginia. The village has a population of approximately 4,000 people and is part of the larger Bellaire-Martins Ferry Metropolitan Statistical Area.
History
Bellaire was founded in 1853 by a group of settlers from Pennsylvania. The village was named after the Bellaire Iron Works, which was located nearby. The iron works was established in 1845 and was the first of its kind in the area. The iron works was a major employer in the area and helped to spur the growth of the village.
In the late 19th century, Bellaire became a major hub for the coal and oil industries. The village was home to several coal mines and oil refineries. The coal and oil industries helped to fuel the growth of the village and the surrounding area.
In the early 20th century, Bellaire became a major center for the glass industry. The village was home to several glass factories, which produced a variety of products including bottles, jars, and windows. The glass industry helped to further spur the growth of the village.
Geography
Bellaire is located in Belmont County, Ohio. The village is situated along the Ohio River, just south of Wheeling, West Virginia. The village is located in the Appalachian Plateau region of Ohio and is surrounded by rolling hills and forests. The village is located approximately 50 miles from Pittsburgh, Pennsylvania and approximately 70 miles from Columbus, Ohio.
Economy
The economy of Bellaire is largely based on the service industry. The village is home to several restaurants, bars, and other businesses that cater to the needs of the local population. The village is also home to several manufacturing companies, including a glass factory and a steel mill.
The village is also home to several retail stores, including a grocery store, a hardware store, and a pharmacy. The village is also home to several banks and other financial institutions.
Demographics
As of the 2010 census, the population of Bellaire was 4,000. The racial makeup of the village was 97.2% White, 0.7% African American, 0.2% Native American, 0.2% Asian, 0.2% from other races, and 1.7% from two or more races. Hispanic or Latino of any race were 0.7% of the population.
The median household income in Bellaire was $37,500, and the median family income was $45,000. The per capita income in the village was $19,000. About 11.2% of families and 14.2% of the population were below the poverty line, including 18.2% of those under age 18 and 8.2% of those age 65 or over.
Common Questions
What is Per Capita Income in Bellaire?
Per Capita income in Bellaire is $25,476.
What is the Median Family Income in Bellaire?
Median Family Income in Bellaire is $50,882.
What is the Median Household income in Bellaire?
Median Household Income in Bellaire is $40,650.
What is Income or Wage Gap in Bellaire?
Income or Wage Gap in Bellaire is 11.6%.
Women in Bellaire earn 88.4 cents for every dollar earned by a man.
What is Family Income Deficit in Bellaire?
Family Income Deficit in Bellaire is $10,633.
Families that are below poverty line in Bellaire earn $10,633 less on average than the poverty threshold level.
What is Inequality or Gini Index in Bellaire?
Inequality or Gini Index in Bellaire is 0.47.
What is the Total Population of Bellaire?
Total Population of Bellaire is 3,878.
What is the Total Male Population of Bellaire?
Total Male Population of Bellaire is 2,067.
What is the Total Female Population of Bellaire?
Total Female Population of Bellaire is 1,811.
What is the Ratio of Males per 100 Females in Bellaire?
There are 114.14 Males per 100 Females in Bellaire.
What is the Ratio of Females per 100 Males in Bellaire?
There are 87.61 Females per 100 Males in Bellaire.
What is the Median Population Age in Bellaire?
Median Population Age in Bellaire is 35.8 Years.
What is the Average Family Size in Bellaire
Average Family Size in Bellaire is 3.6 People.
What is the Average Household Size in Bellaire
Average Household Size in Bellaire is 2.5 People.
How Large is the Labor Force in Bellaire?
There are 1,810 People in the Labor Forcein in Bellaire.
What is the Percentage of People in the Labor Force in Bellaire?
59.6% of People are in the Labor Force in Bellaire.
What is the Unemployment Rate in Bellaire?
Unemployment Rate in Bellaire is 9.3%.