Beallsville, OH Map & Demographics
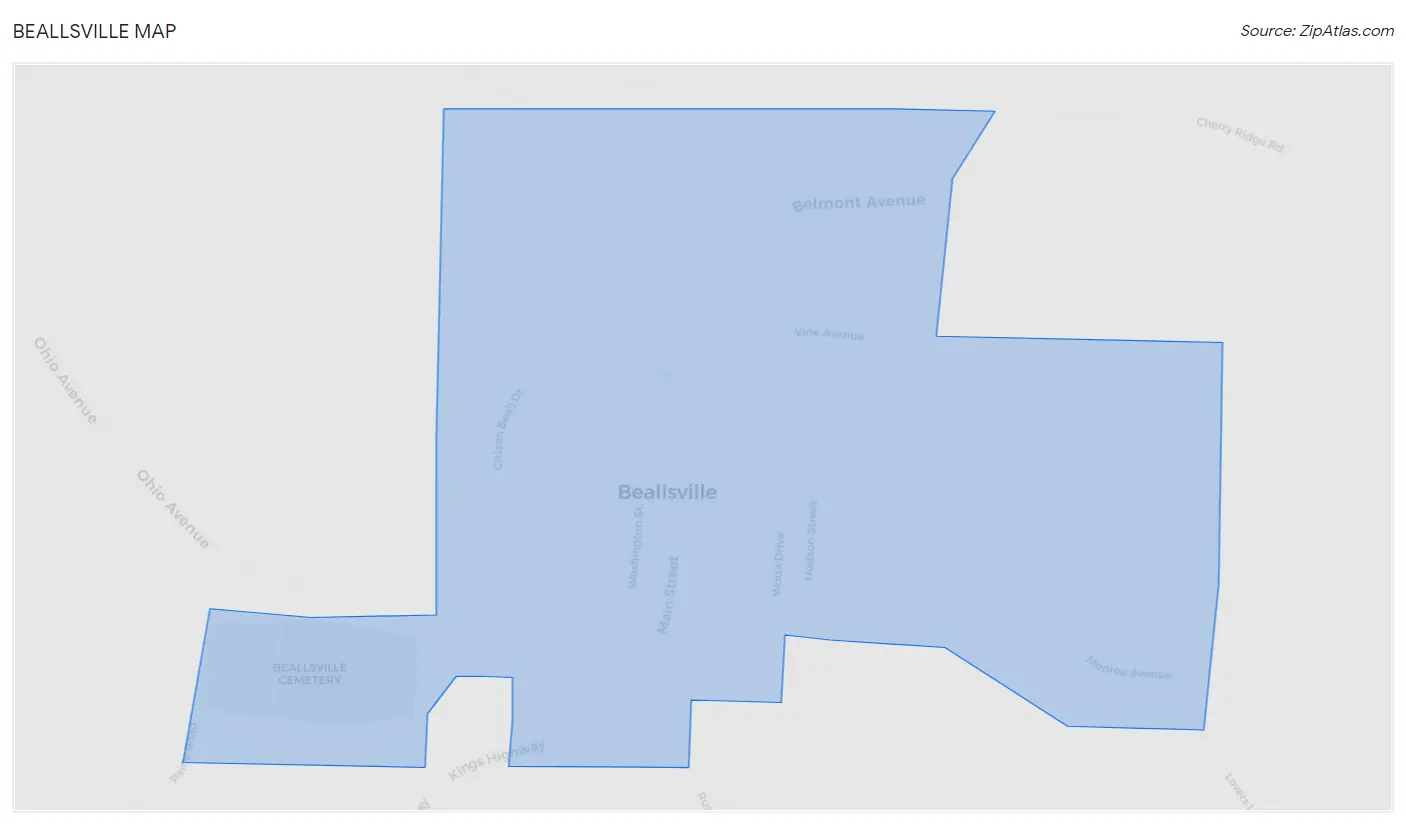
Beallsville Map
Beallsville Overview
$20,080
PER CAPITA INCOME
$54,583
AVG FAMILY INCOME
$33,125
AVG HOUSEHOLD INCOME
31.7%
WAGE / INCOME GAP [ % ]
68.3¢/ $1
WAGE / INCOME GAP [ $ ]
0.41
INEQUALITY / GINI INDEX
392
TOTAL POPULATION
201
MALE POPULATION
191
FEMALE POPULATION
105.24
MALES / 100 FEMALES
95.02
FEMALES / 100 MALES
34.6
MEDIAN AGE
2.9
AVG FAMILY SIZE
2.4
AVG HOUSEHOLD SIZE
155
LABOR FORCE [ PEOPLE ]
51.0%
PERCENT IN LABOR FORCE
4.5%
UNEMPLOYMENT RATE
Beallsville Zip Codes
Beallsville Area Codes
Income in Beallsville
Income Overview in Beallsville
Per Capita Income in Beallsville is $20,080, while median incomes of families and households are $54,583 and $33,125 respectively.
| Characteristic | Number | Measure |
| Per Capita Income | 392 | $20,080 |
| Median Family Income | 107 | $54,583 |
| Mean Family Income | 107 | $57,105 |
| Median Household Income | 163 | $33,125 |
| Mean Household Income | 163 | $46,486 |
| Income Deficit | 107 | $0 |
| Wage / Income Gap (%) | 392 | 31.75% |
| Wage / Income Gap ($) | 392 | 68.25¢ per $1 |
| Gini / Inequality Index | 392 | 0.41 |
Earnings by Sex in Beallsville
Average Earnings in Beallsville are $24,375, $33,750 for men and $23,036 for women, a difference of 31.8%.
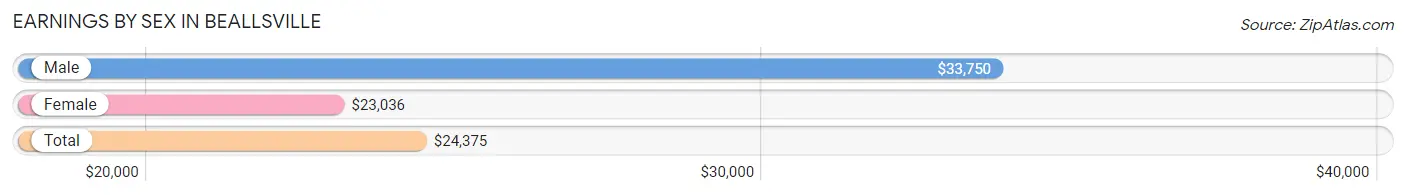
| Sex | Number | Average Earnings |
| Male | 70 (43.8%) | $33,750 |
| Female | 90 (56.2%) | $23,036 |
| Total | 160 (100.0%) | $24,375 |
Earnings by Sex by Income Bracket in Beallsville
The most common earnings brackets in Beallsville are $55,000 to $64,999 for men (11 | 15.7%) and $22,500 to $24,999 for women (28 | 31.1%).
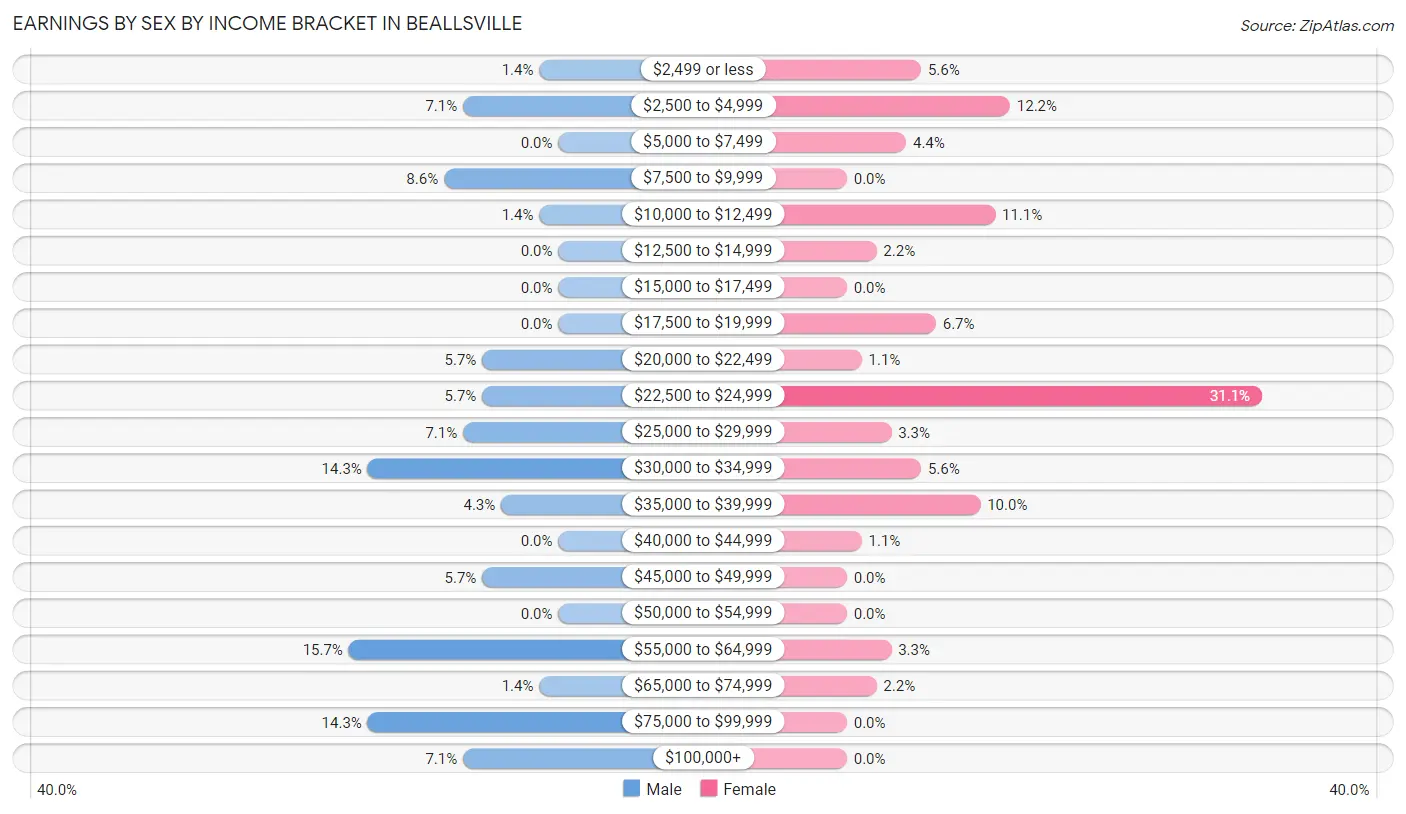
| Income | Male | Female |
| $2,499 or less | 1 (1.4%) | 5 (5.6%) |
| $2,500 to $4,999 | 5 (7.1%) | 11 (12.2%) |
| $5,000 to $7,499 | 0 (0.0%) | 4 (4.4%) |
| $7,500 to $9,999 | 6 (8.6%) | 0 (0.0%) |
| $10,000 to $12,499 | 1 (1.4%) | 10 (11.1%) |
| $12,500 to $14,999 | 0 (0.0%) | 2 (2.2%) |
| $15,000 to $17,499 | 0 (0.0%) | 0 (0.0%) |
| $17,500 to $19,999 | 0 (0.0%) | 6 (6.7%) |
| $20,000 to $22,499 | 4 (5.7%) | 1 (1.1%) |
| $22,500 to $24,999 | 4 (5.7%) | 28 (31.1%) |
| $25,000 to $29,999 | 5 (7.1%) | 3 (3.3%) |
| $30,000 to $34,999 | 10 (14.3%) | 5 (5.6%) |
| $35,000 to $39,999 | 3 (4.3%) | 9 (10.0%) |
| $40,000 to $44,999 | 0 (0.0%) | 1 (1.1%) |
| $45,000 to $49,999 | 4 (5.7%) | 0 (0.0%) |
| $50,000 to $54,999 | 0 (0.0%) | 0 (0.0%) |
| $55,000 to $64,999 | 11 (15.7%) | 3 (3.3%) |
| $65,000 to $74,999 | 1 (1.4%) | 2 (2.2%) |
| $75,000 to $99,999 | 10 (14.3%) | 0 (0.0%) |
| $100,000+ | 5 (7.1%) | 0 (0.0%) |
| Total | 70 (100.0%) | 90 (100.0%) |
Earnings by Sex by Educational Attainment in Beallsville
Average earnings in Beallsville are $45,625 for men and $23,580 for women, a difference of 48.3%. Men with an educational attainment of college or associate's degree enjoy the highest average annual earnings of $60,625, while those with high school diploma education earn the least with $39,375. Women with an educational attainment of college or associate's degree earn the most with the average annual earnings of $24,148, while those with high school diploma education have the smallest earnings of $11,625.
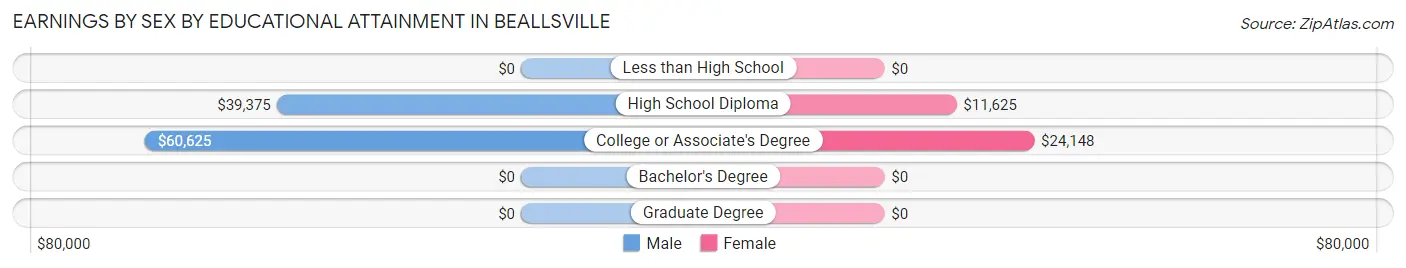
| Educational Attainment | Male Income | Female Income |
| Less than High School | - | - |
| High School Diploma | $39,375 | $11,625 |
| College or Associate's Degree | $60,625 | $24,148 |
| Bachelor's Degree | - | - |
| Graduate Degree | - | - |
| Total | $45,625 | $23,580 |
Family Income in Beallsville
Family Income Brackets in Beallsville
According to the Beallsville family income data, there are 33 families falling into the $50,000 to $74,999 income range, which is the most common income bracket and makes up 30.8% of all families.
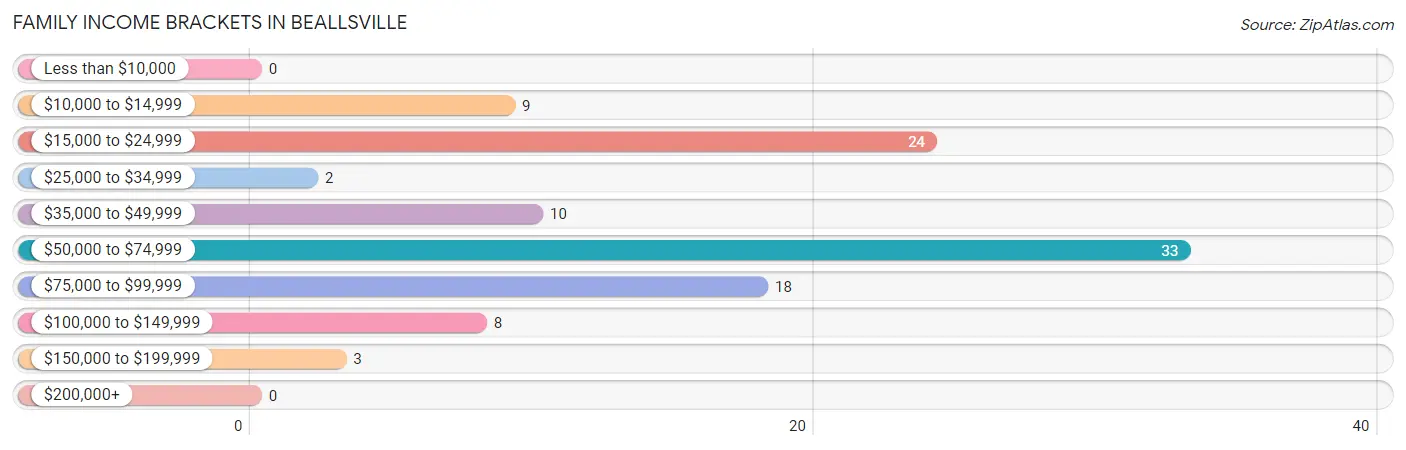
| Income Bracket | # Families | % Families |
| Less than $10,000 | 0 | 0.0% |
| $10,000 to $14,999 | 9 | 8.4% |
| $15,000 to $24,999 | 24 | 22.4% |
| $25,000 to $34,999 | 2 | 1.9% |
| $35,000 to $49,999 | 10 | 9.3% |
| $50,000 to $74,999 | 33 | 30.8% |
| $75,000 to $99,999 | 18 | 16.8% |
| $100,000 to $149,999 | 8 | 7.5% |
| $150,000 to $199,999 | 3 | 2.8% |
| $200,000+ | 0 | 0.0% |
Family Income by Famaliy Size in Beallsville
4-person families (17 | 15.9%) account for the highest median family income in Beallsville with $66,250 per family, while 2-person families (52 | 48.6%) have the highest median income of $31,042 per family member.
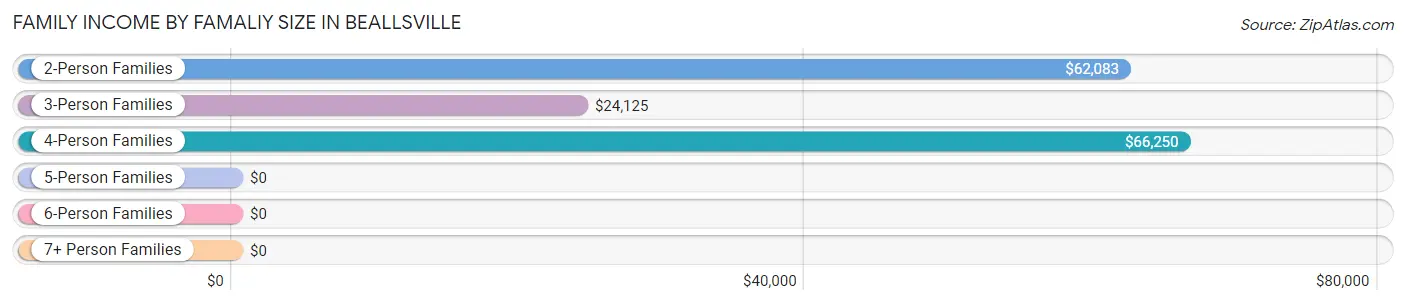
| Income Bracket | # Families | Median Income |
| 2-Person Families | 52 (48.6%) | $62,083 |
| 3-Person Families | 34 (31.8%) | $24,125 |
| 4-Person Families | 17 (15.9%) | $66,250 |
| 5-Person Families | 4 (3.7%) | $0 |
| 6-Person Families | 0 (0.0%) | $0 |
| 7+ Person Families | 0 (0.0%) | $0 |
| Total | 107 (100.0%) | $54,583 |
Family Income by Number of Earners in Beallsville
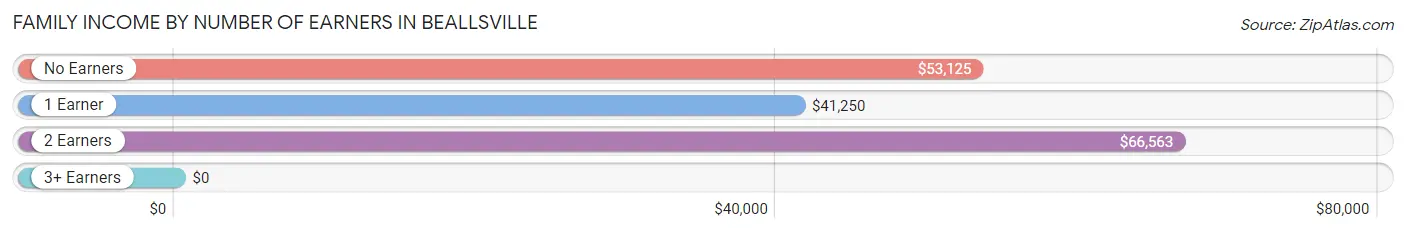
| Number of Earners | # Families | Median Income |
| No Earners | 21 (19.6%) | $53,125 |
| 1 Earner | 60 (56.1%) | $41,250 |
| 2 Earners | 26 (24.3%) | $66,563 |
| 3+ Earners | 0 (0.0%) | $0 |
| Total | 107 (100.0%) | $54,583 |
Household Income in Beallsville
Household Income Brackets in Beallsville
With 41 households falling in the category, the $50,000 to $74,999 income range is the most frequent in Beallsville, accounting for 25.2% of all households.
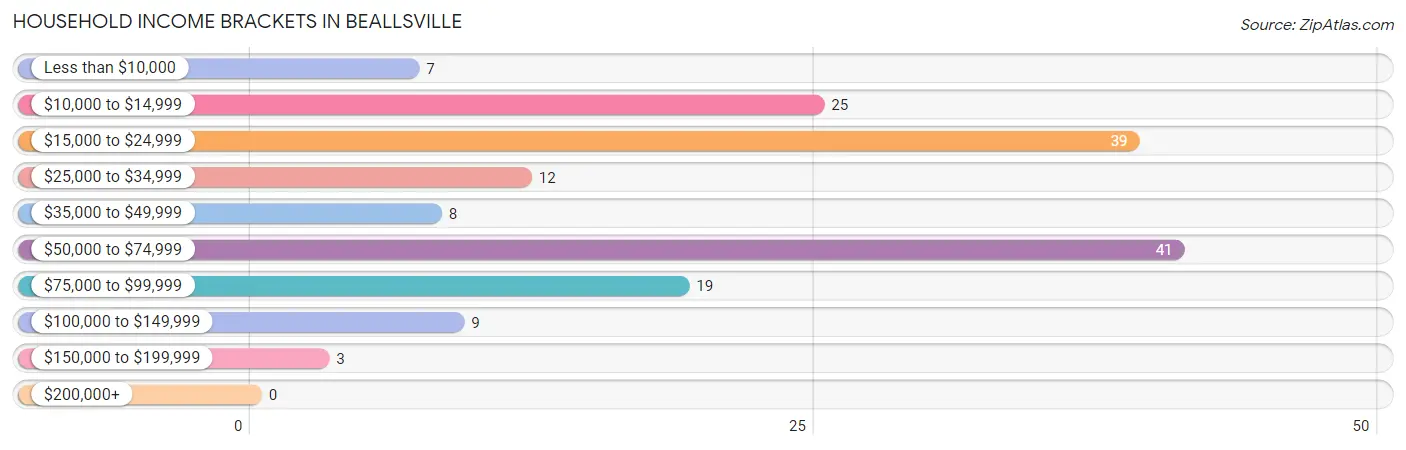
| Income Bracket | # Households | % Households |
| Less than $10,000 | 7 | 4.3% |
| $10,000 to $14,999 | 25 | 15.3% |
| $15,000 to $24,999 | 39 | 23.9% |
| $25,000 to $34,999 | 12 | 7.4% |
| $35,000 to $49,999 | 8 | 4.9% |
| $50,000 to $74,999 | 41 | 25.2% |
| $75,000 to $99,999 | 19 | 11.7% |
| $100,000 to $149,999 | 9 | 5.5% |
| $150,000 to $199,999 | 3 | 1.8% |
| $200,000+ | 0 | 0.0% |
Household Income by Householder Age in Beallsville
The median household income in Beallsville is $33,125, with the highest median household income of $60,625 found in the 45 to 64 years age bracket for the primary householder. A total of 55 households (33.7%) fall into this category. Meanwhile, the 15 to 24 years age bracket for the primary householder has the lowest median household income of $0, with 14 households (8.6%) in this group.
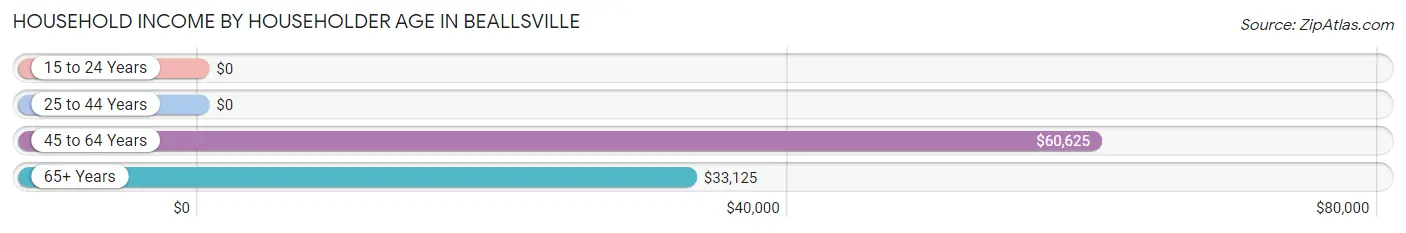
| Income Bracket | # Households | Median Income |
| 15 to 24 Years | 14 (8.6%) | $0 |
| 25 to 44 Years | 45 (27.6%) | $0 |
| 45 to 64 Years | 55 (33.7%) | $60,625 |
| 65+ Years | 49 (30.1%) | $33,125 |
| Total | 163 (100.0%) | $33,125 |
Poverty in Beallsville
Income Below Poverty by Sex and Age in Beallsville
With 29.3% poverty level for males and 26.2% for females among the residents of Beallsville, 6 to 11 year old males and 25 to 34 year old females are the most vulnerable to poverty, with 32 males (74.4%) and 22 females (66.7%) in their respective age groups living below the poverty level.
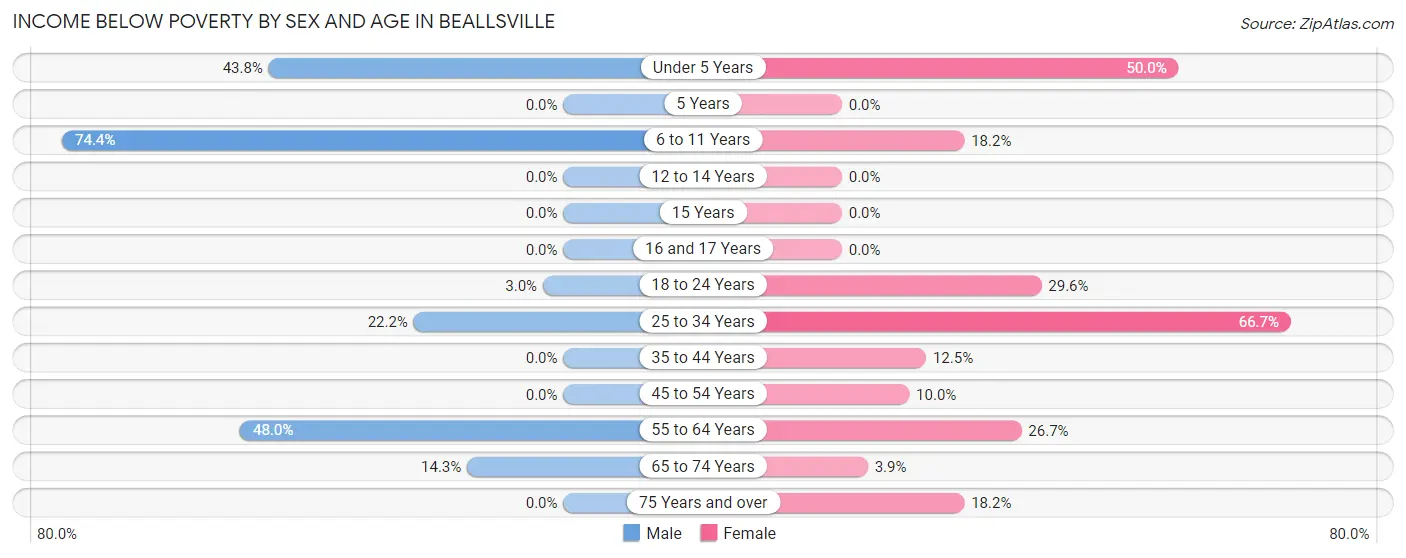
| Age Bracket | Male | Female |
| Under 5 Years | 7 (43.8%) | 3 (50.0%) |
| 5 Years | 0 (0.0%) | 0 (0.0%) |
| 6 to 11 Years | 32 (74.4%) | 2 (18.2%) |
| 12 to 14 Years | 0 (0.0%) | 0 (0.0%) |
| 15 Years | 0 (0.0%) | 0 (0.0%) |
| 16 and 17 Years | 0 (0.0%) | 0 (0.0%) |
| 18 to 24 Years | 1 (3.0%) | 8 (29.6%) |
| 25 to 34 Years | 4 (22.2%) | 22 (66.7%) |
| 35 to 44 Years | 0 (0.0%) | 2 (12.5%) |
| 45 to 54 Years | 0 (0.0%) | 2 (10.0%) |
| 55 to 64 Years | 12 (48.0%) | 8 (26.7%) |
| 65 to 74 Years | 3 (14.3%) | 1 (3.8%) |
| 75 Years and over | 0 (0.0%) | 2 (18.2%) |
| Total | 59 (29.3%) | 50 (26.2%) |
Income Above Poverty by Sex and Age in Beallsville
According to the poverty statistics in Beallsville, males aged 15 years and females aged 12 to 14 years are the age groups that are most secure financially, with 100.0% of males and 100.0% of females in these age groups living above the poverty line.
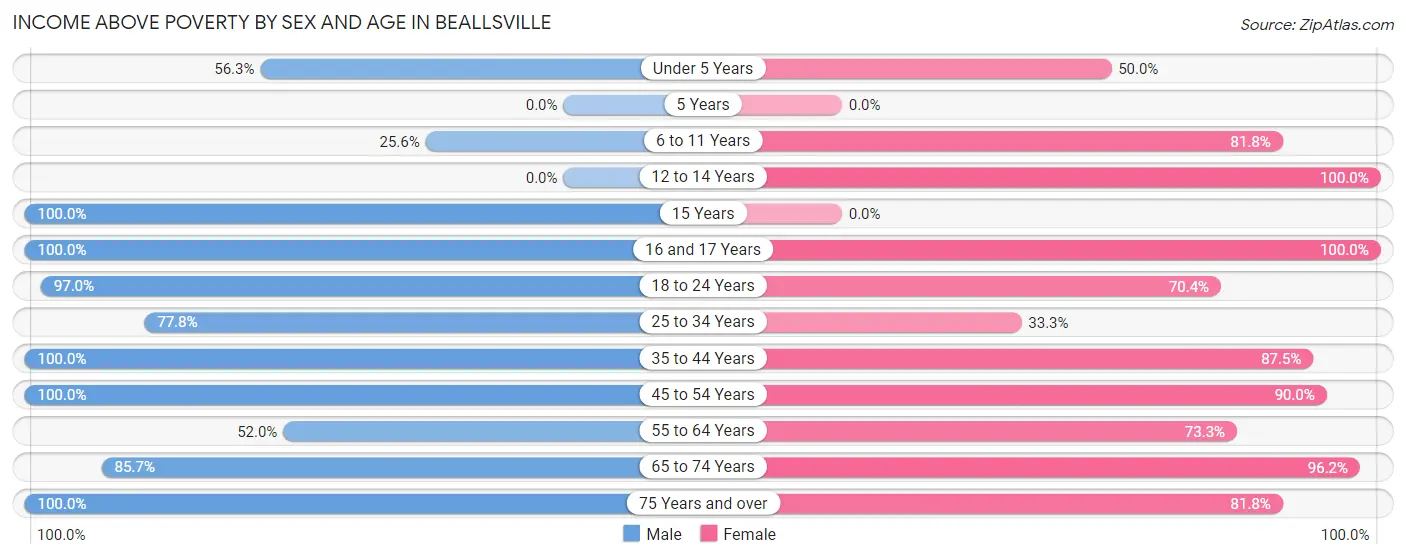
| Age Bracket | Male | Female |
| Under 5 Years | 9 (56.2%) | 3 (50.0%) |
| 5 Years | 0 (0.0%) | 0 (0.0%) |
| 6 to 11 Years | 11 (25.6%) | 9 (81.8%) |
| 12 to 14 Years | 0 (0.0%) | 6 (100.0%) |
| 15 Years | 6 (100.0%) | 0 (0.0%) |
| 16 and 17 Years | 3 (100.0%) | 5 (100.0%) |
| 18 to 24 Years | 32 (97.0%) | 19 (70.4%) |
| 25 to 34 Years | 14 (77.8%) | 11 (33.3%) |
| 35 to 44 Years | 5 (100.0%) | 14 (87.5%) |
| 45 to 54 Years | 24 (100.0%) | 18 (90.0%) |
| 55 to 64 Years | 13 (52.0%) | 22 (73.3%) |
| 65 to 74 Years | 18 (85.7%) | 25 (96.2%) |
| 75 Years and over | 7 (100.0%) | 9 (81.8%) |
| Total | 142 (70.7%) | 141 (73.8%) |
Income Below Poverty Among Married-Couple Families in Beallsville
The poverty statistics for married-couple families in Beallsville show that 3.6% or 2 of the total 56 families live below the poverty line. Families with no children have the highest poverty rate of 4.5%, comprising of 2 families. On the other hand, families with 1 or 2 children have the lowest poverty rate of 0.0%, which includes 0 families.
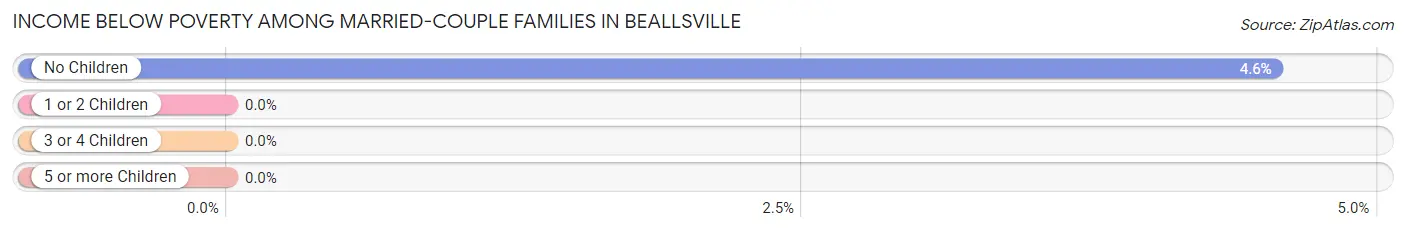
| Children | Above Poverty | Below Poverty |
| No Children | 42 (95.5%) | 2 (4.5%) |
| 1 or 2 Children | 12 (100.0%) | 0 (0.0%) |
| 3 or 4 Children | 0 (0.0%) | 0 (0.0%) |
| 5 or more Children | 0 (0.0%) | 0 (0.0%) |
| Total | 54 (96.4%) | 2 (3.6%) |
Income Below Poverty Among Single-Parent Households in Beallsville
According to the poverty data in Beallsville, 36.4% or 4 single-father households and 62.5% or 25 single-mother households are living below the poverty line. Among single-father households, those with 1 or 2 children have the highest poverty rate, with 4 households (66.7%) experiencing poverty. Likewise, among single-mother households, those with 1 or 2 children have the highest poverty rate, with 24 households (72.7%) falling below the poverty line.
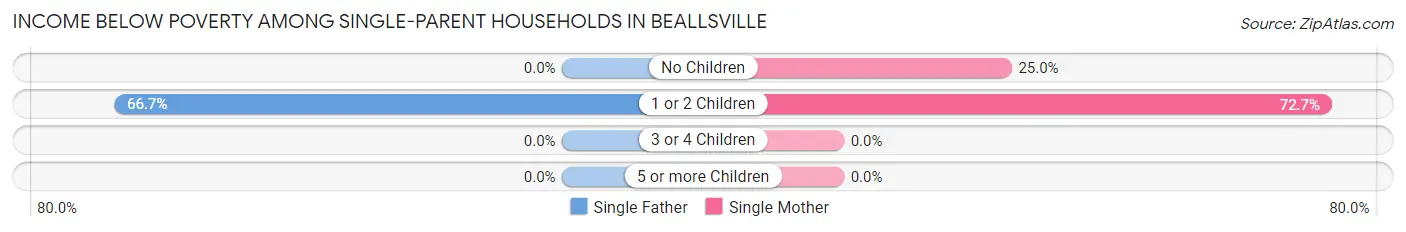
| Children | Single Father | Single Mother |
| No Children | 0 (0.0%) | 1 (25.0%) |
| 1 or 2 Children | 4 (66.7%) | 24 (72.7%) |
| 3 or 4 Children | 0 (0.0%) | 0 (0.0%) |
| 5 or more Children | 0 (0.0%) | 0 (0.0%) |
| Total | 4 (36.4%) | 25 (62.5%) |
Income Below Poverty Among Married-Couple vs Single-Parent Households in Beallsville
The poverty data for Beallsville shows that 2 of the married-couple family households (3.6%) and 29 of the single-parent households (56.9%) are living below the poverty level. Within the married-couple family households, those with no children have the highest poverty rate, with 2 households (4.5%) falling below the poverty line. Among the single-parent households, those with 1 or 2 children have the highest poverty rate, with 28 household (71.8%) living below poverty.
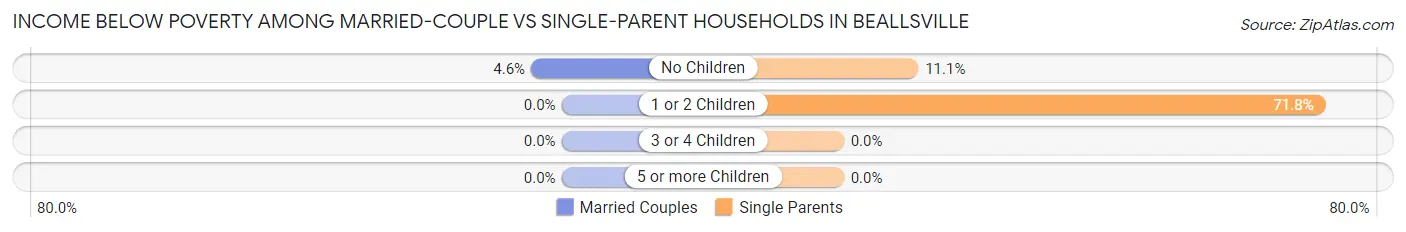
| Children | Married-Couple Families | Single-Parent Households |
| No Children | 2 (4.5%) | 1 (11.1%) |
| 1 or 2 Children | 0 (0.0%) | 28 (71.8%) |
| 3 or 4 Children | 0 (0.0%) | 0 (0.0%) |
| 5 or more Children | 0 (0.0%) | 0 (0.0%) |
| Total | 2 (3.6%) | 29 (56.9%) |
Race in Beallsville
The most populous races in Beallsville are White / Caucasian (378 | 96.4%), and Two or more Races (14 | 3.6%).
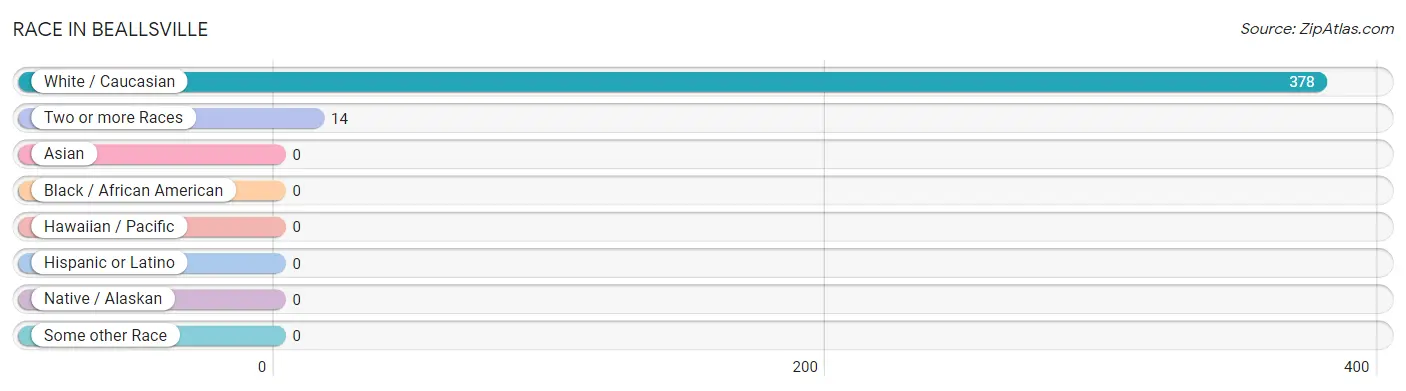
| Race | # Population | % Population |
| Asian | 0 | 0.0% |
| Black / African American | 0 | 0.0% |
| Hawaiian / Pacific | 0 | 0.0% |
| Hispanic or Latino | 0 | 0.0% |
| Native / Alaskan | 0 | 0.0% |
| White / Caucasian | 378 | 96.4% |
| Two or more Races | 14 | 3.6% |
| Some other Race | 0 | 0.0% |
| Total | 392 | 100.0% |
Ancestry in Beallsville
The most populous ancestries reported in Beallsville are German (66 | 16.8%), Irish (42 | 10.7%), Italian (27 | 6.9%), English (24 | 6.1%), and Polish (20 | 5.1%), together accounting for 45.7% of all Beallsville residents.
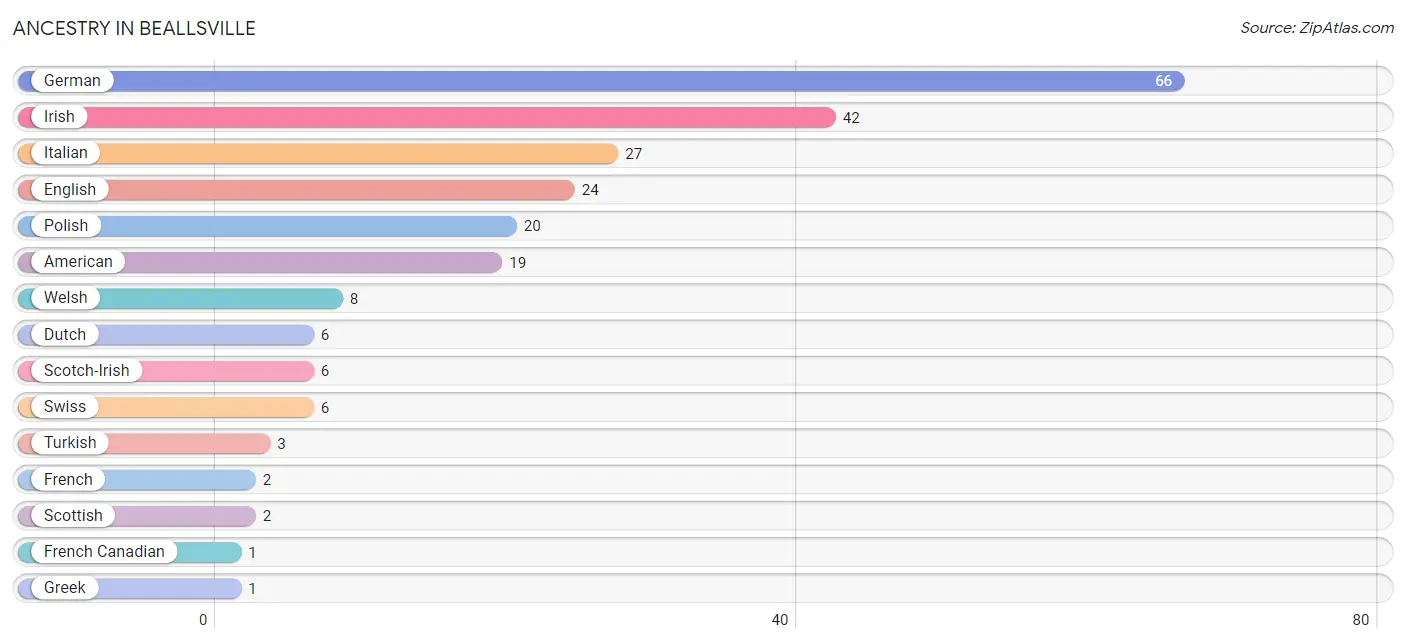
| Ancestry | # Population | % Population |
| American | 19 | 4.9% |
| Dutch | 6 | 1.5% |
| English | 24 | 6.1% |
| French | 2 | 0.5% |
| French Canadian | 1 | 0.3% |
| German | 66 | 16.8% |
| Greek | 1 | 0.3% |
| Irish | 42 | 10.7% |
| Italian | 27 | 6.9% |
| Polish | 20 | 5.1% |
| Scotch-Irish | 6 | 1.5% |
| Scottish | 2 | 0.5% |
| Slovak | 1 | 0.3% |
| Slovene | 1 | 0.3% |
| Swedish | 1 | 0.3% |
| Swiss | 6 | 1.5% |
| Turkish | 3 | 0.8% |
| Welsh | 8 | 2.0% | View All 18 Rows |
Immigrants in Beallsville
The most numerous immigrant groups reported in Beallsville came from Europe (2 | 0.5%), Germany (2 | 0.5%), and Western Europe (2 | 0.5%), together accounting for 1.5% of all Beallsville residents.
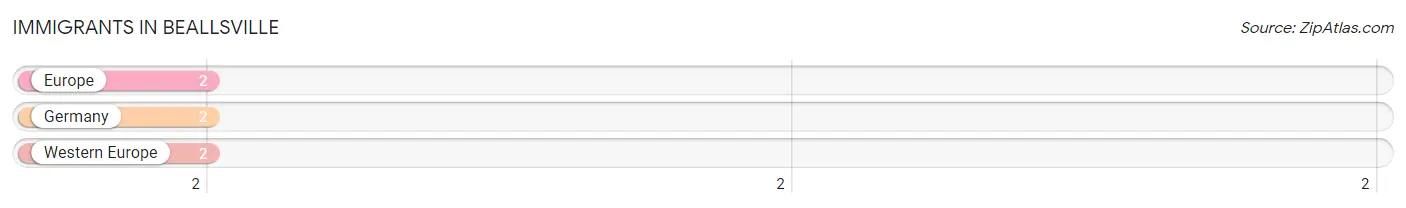
| Immigration Origin | # Population | % Population |
| Europe | 2 | 0.5% |
| Germany | 2 | 0.5% |
| Western Europe | 2 | 0.5% | View All 3 Rows |
Sex and Age in Beallsville
Sex and Age in Beallsville
The most populous age groups in Beallsville are 5 to 9 Years (24 | 11.9%) for men and 30 to 34 Years (31 | 16.2%) for women.
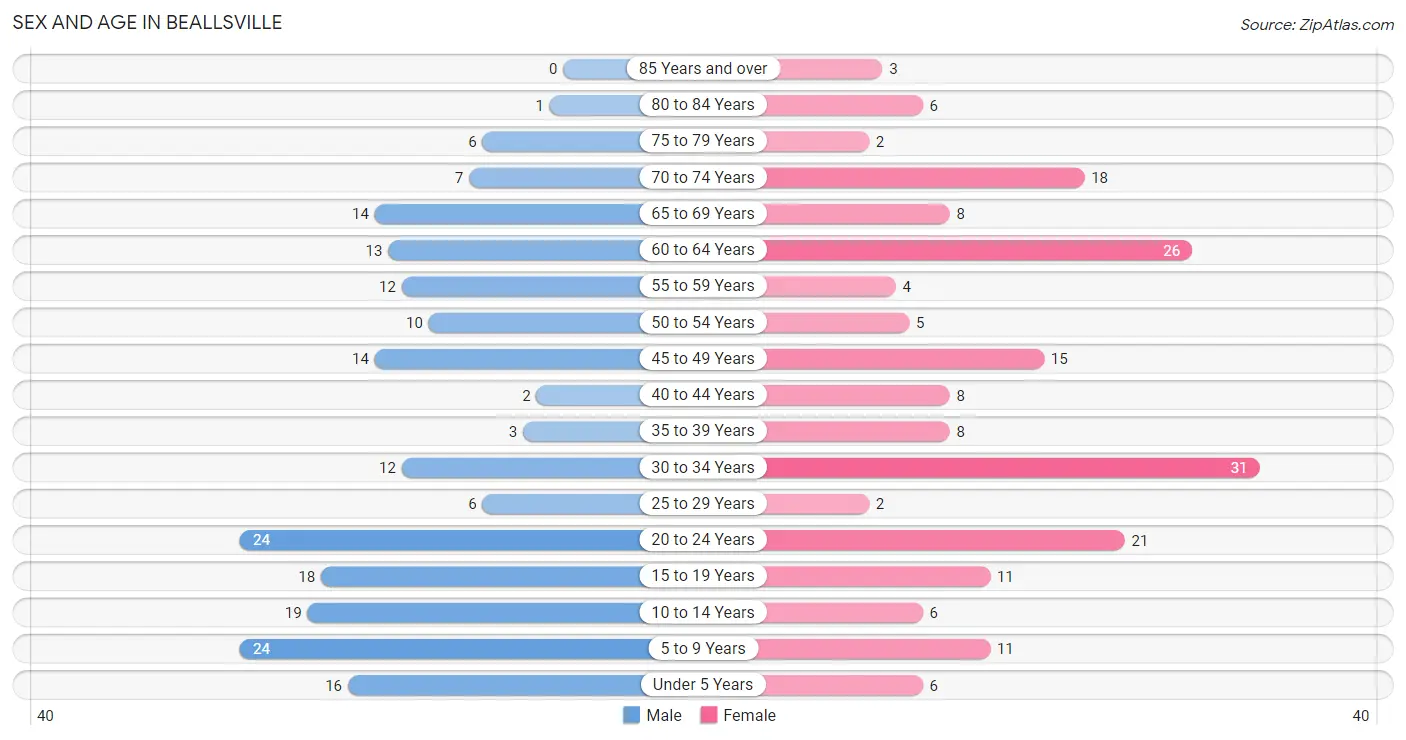
| Age Bracket | Male | Female |
| Under 5 Years | 16 (8.0%) | 6 (3.1%) |
| 5 to 9 Years | 24 (11.9%) | 11 (5.8%) |
| 10 to 14 Years | 19 (9.5%) | 6 (3.1%) |
| 15 to 19 Years | 18 (9.0%) | 11 (5.8%) |
| 20 to 24 Years | 24 (11.9%) | 21 (11.0%) |
| 25 to 29 Years | 6 (3.0%) | 2 (1.1%) |
| 30 to 34 Years | 12 (6.0%) | 31 (16.2%) |
| 35 to 39 Years | 3 (1.5%) | 8 (4.2%) |
| 40 to 44 Years | 2 (1.0%) | 8 (4.2%) |
| 45 to 49 Years | 14 (7.0%) | 15 (7.9%) |
| 50 to 54 Years | 10 (5.0%) | 5 (2.6%) |
| 55 to 59 Years | 12 (6.0%) | 4 (2.1%) |
| 60 to 64 Years | 13 (6.5%) | 26 (13.6%) |
| 65 to 69 Years | 14 (7.0%) | 8 (4.2%) |
| 70 to 74 Years | 7 (3.5%) | 18 (9.4%) |
| 75 to 79 Years | 6 (3.0%) | 2 (1.1%) |
| 80 to 84 Years | 1 (0.5%) | 6 (3.1%) |
| 85 Years and over | 0 (0.0%) | 3 (1.6%) |
| Total | 201 (100.0%) | 191 (100.0%) |
Families and Households in Beallsville
Median Family Size in Beallsville
The median family size in Beallsville is 2.90 persons per family, with single female/mother families (40 | 37.4%) accounting for the largest median family size of 3.4 persons per family. On the other hand, married-couple families (56 | 52.3%) represent the smallest median family size with 2.50 persons per family.
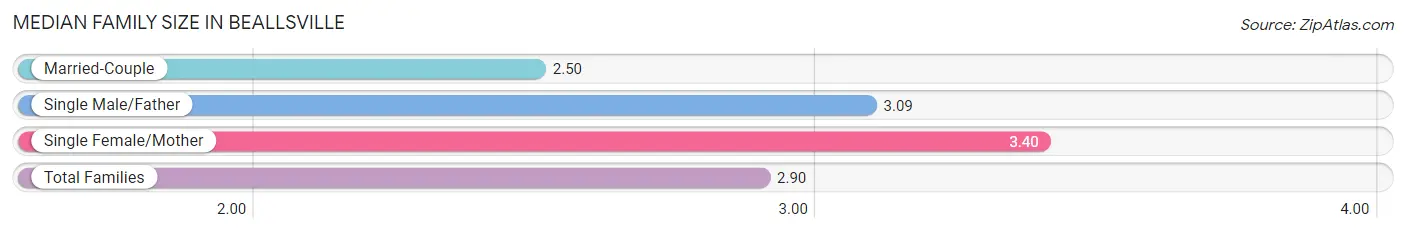
| Family Type | # Families | Family Size |
| Married-Couple | 56 (52.3%) | 2.50 |
| Single Male/Father | 11 (10.3%) | 3.09 |
| Single Female/Mother | 40 (37.4%) | 3.40 |
| Total Families | 107 (100.0%) | 2.90 |
Median Household Size in Beallsville
The median household size in Beallsville is 2.40 persons per household, with single male/father households (11 | 6.8%) accounting for the largest median household size of 3.91 persons per household. non-family households (56 | 34.4%) represent the smallest median household size with 1.16 persons per household.
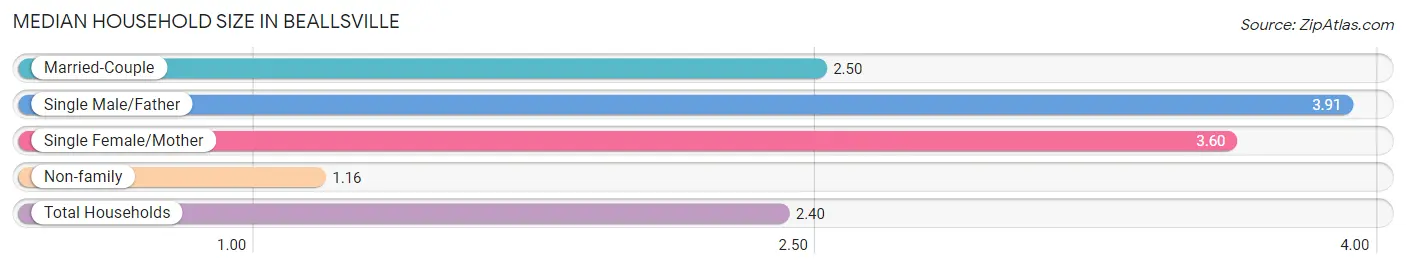
| Household Type | # Households | Household Size |
| Married-Couple | 56 (34.4%) | 2.50 |
| Single Male/Father | 11 (6.8%) | 3.91 |
| Single Female/Mother | 40 (24.5%) | 3.60 |
| Non-family | 56 (34.4%) | 1.16 |
| Total Households | 163 (100.0%) | 2.40 |
Household Size by Marriage Status in Beallsville
Out of a total of 163 households in Beallsville, 107 (65.6%) are family households, while 56 (34.4%) are nonfamily households. The most numerous type of family households are 2-person households, comprising 47, and the most common type of nonfamily households are 1-person households, comprising 49.
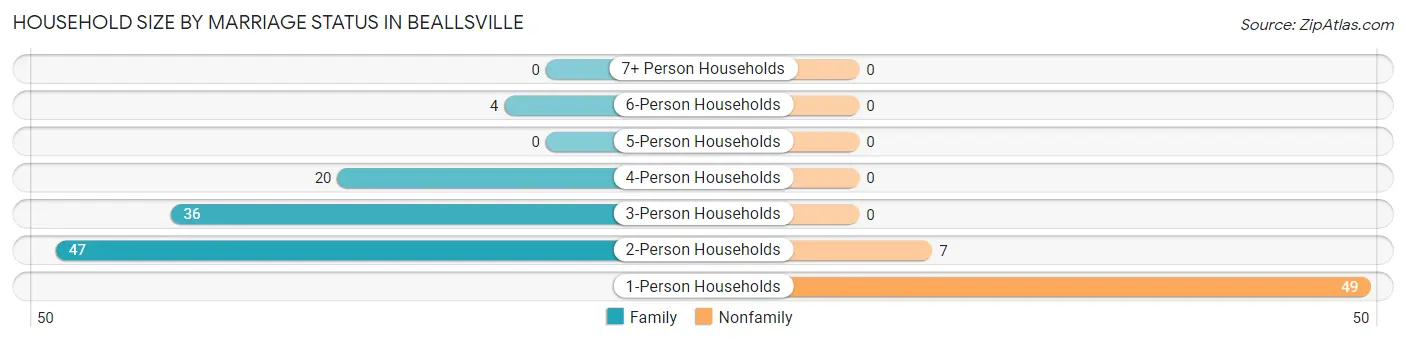
| Household Size | Family Households | Nonfamily Households |
| 1-Person Households | - | 49 (30.1%) |
| 2-Person Households | 47 (28.8%) | 7 (4.3%) |
| 3-Person Households | 36 (22.1%) | 0 (0.0%) |
| 4-Person Households | 20 (12.3%) | 0 (0.0%) |
| 5-Person Households | 0 (0.0%) | 0 (0.0%) |
| 6-Person Households | 4 (2.5%) | 0 (0.0%) |
| 7+ Person Households | 0 (0.0%) | 0 (0.0%) |
| Total | 107 (65.6%) | 56 (34.4%) |
Female Fertility in Beallsville
Fertility by Age in Beallsville
Average fertility rate in Beallsville is 72.0 births per 1,000 women. Women in the age bracket of 20 to 34 years have the highest fertility rate with 130.0 births per 1,000 women. Women in the age bracket of 20 to 34 years acount for 100.0% of all women with births.
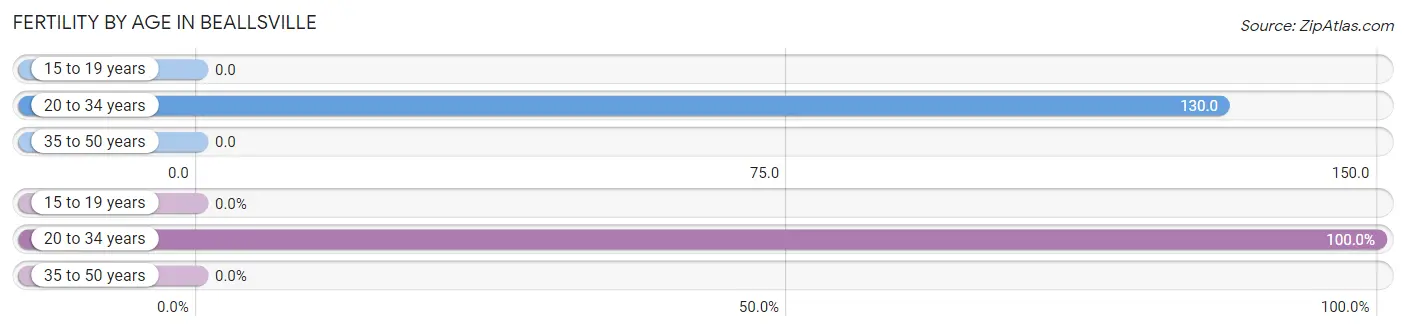
| Age Bracket | Women with Births | Births / 1,000 Women |
| 15 to 19 years | 0 (0.0%) | 0.0 |
| 20 to 34 years | 7 (100.0%) | 130.0 |
| 35 to 50 years | 0 (0.0%) | 0.0 |
| Total | 7 (100.0%) | 72.0 |
Fertility by Age by Marriage Status in Beallsville
71.4% of women with births (7) in Beallsville are married. The highest percentage of unmarried women with births falls into 20 to 34 years age bracket with 28.6% of them unmarried at the time of birth, while the lowest percentage of unmarried women with births belong to 20 to 34 years age bracket with 28.6% of them unmarried.
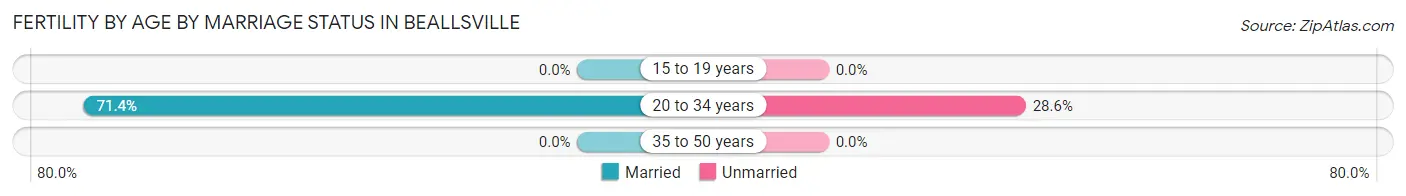
| Age Bracket | Married | Unmarried |
| 15 to 19 years | 0 (0.0%) | 0 (0.0%) |
| 20 to 34 years | 5 (71.4%) | 2 (28.6%) |
| 35 to 50 years | 0 (0.0%) | 0 (0.0%) |
| Total | 5 (71.4%) | 2 (28.6%) |
Fertility by Education in Beallsville
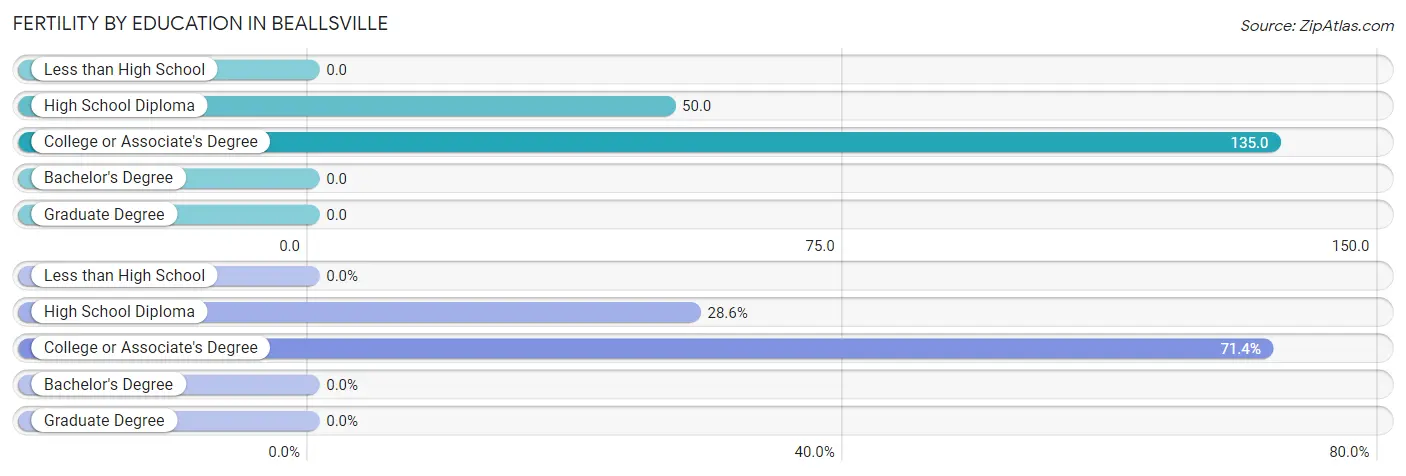
| Educational Attainment | Women with Births | Births / 1,000 Women |
| Less than High School | 0 (0.0%) | 0.0 |
| High School Diploma | 2 (28.6%) | 50.0 |
| College or Associate's Degree | 5 (71.4%) | 135.0 |
| Bachelor's Degree | 0 (0.0%) | 0.0 |
| Graduate Degree | 0 (0.0%) | 0.0 |
| Total | 7 (100.0%) | 72.0 |
Fertility by Education by Marriage Status in Beallsville
28.6% of women with births in Beallsville are unmarried. Women with the educational attainment of college or associate's degree are most likely to be married with 100.0% of them married at childbirth, while women with the educational attainment of high school diploma are least likely to be married with 100.0% of them unmarried at childbirth.
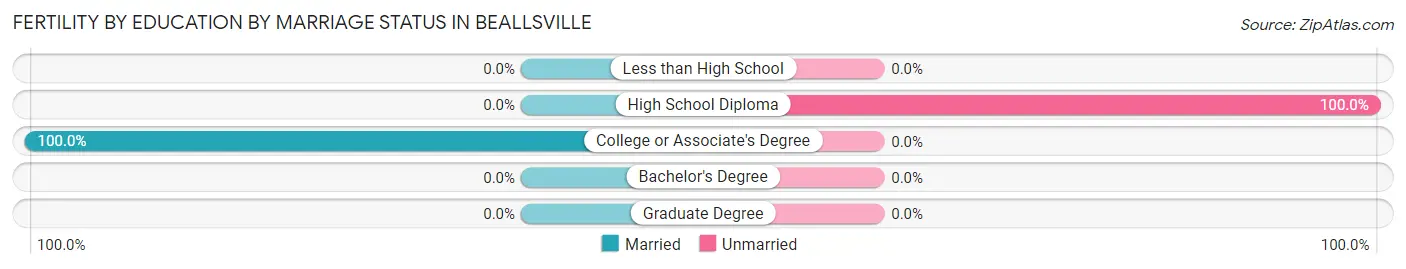
| Educational Attainment | Married | Unmarried |
| Less than High School | 0 (0.0%) | 0 (0.0%) |
| High School Diploma | 0 (0.0%) | 2 (100.0%) |
| College or Associate's Degree | 5 (100.0%) | 0 (0.0%) |
| Bachelor's Degree | 0 (0.0%) | 0 (0.0%) |
| Graduate Degree | 0 (0.0%) | 0 (0.0%) |
| Total | 5 (71.4%) | 2 (28.6%) |
Employment Characteristics in Beallsville
Employment by Class of Employer in Beallsville
Among the 145 employed individuals in Beallsville, private company employees (110 | 75.9%), not-for-profit organizations (21 | 14.5%), and local government employees (6 | 4.1%) make up the most common classes of employment.
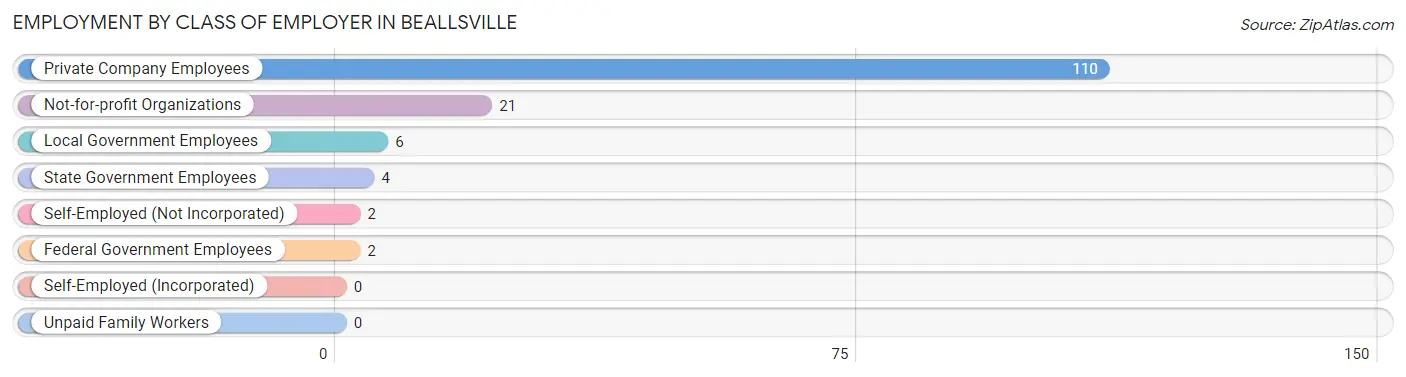
| Employer Class | # Employees | % Employees |
| Private Company Employees | 110 | 75.9% |
| Self-Employed (Incorporated) | 0 | 0.0% |
| Self-Employed (Not Incorporated) | 2 | 1.4% |
| Not-for-profit Organizations | 21 | 14.5% |
| Local Government Employees | 6 | 4.1% |
| State Government Employees | 4 | 2.8% |
| Federal Government Employees | 2 | 1.4% |
| Unpaid Family Workers | 0 | 0.0% |
| Total | 145 | 100.0% |
Employment Status by Age in Beallsville
According to the labor force statistics for Beallsville, out of the total population over 16 years of age (304), 51.0% or 155 individuals are in the labor force, with 4.5% or 7 of them unemployed. The age group with the highest labor force participation rate is 45 to 54 years, with 100.0% or 44 individuals in the labor force. Within the labor force, the 25 to 29 years age range has the highest percentage of unemployed individuals, with 66.7% or 4 of them being unemployed.
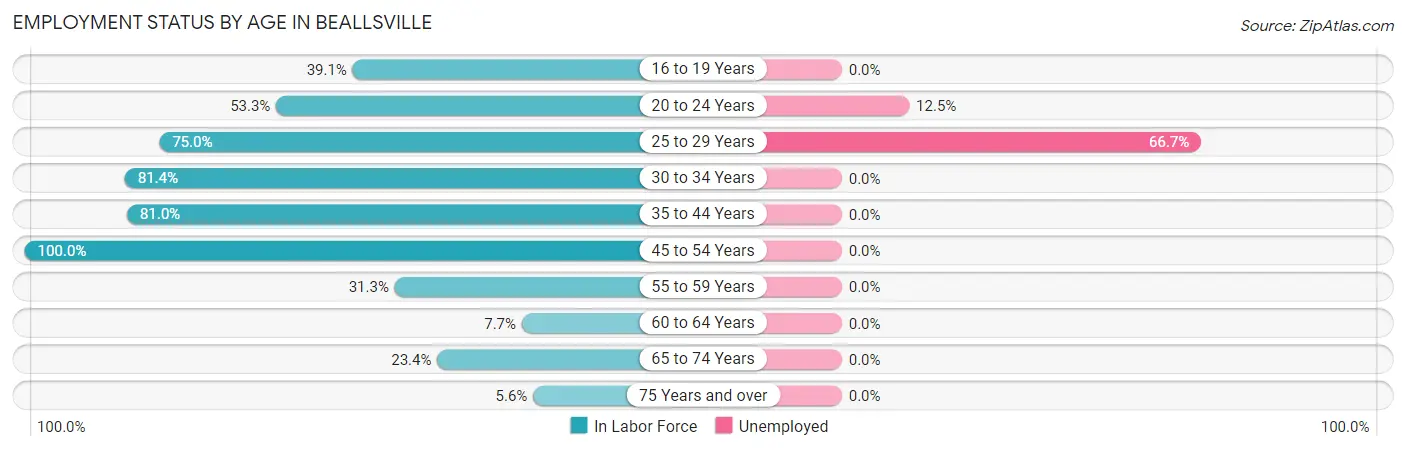
| Age Bracket | In Labor Force | Unemployed |
| 16 to 19 Years | 9 (39.1%) | 0 (0.0%) |
| 20 to 24 Years | 24 (53.3%) | 3 (12.5%) |
| 25 to 29 Years | 6 (75.0%) | 4 (66.7%) |
| 30 to 34 Years | 35 (81.4%) | 0 (0.0%) |
| 35 to 44 Years | 17 (81.0%) | 0 (0.0%) |
| 45 to 54 Years | 44 (100.0%) | 0 (0.0%) |
| 55 to 59 Years | 5 (31.3%) | 0 (0.0%) |
| 60 to 64 Years | 3 (7.7%) | 0 (0.0%) |
| 65 to 74 Years | 11 (23.4%) | 0 (0.0%) |
| 75 Years and over | 1 (5.6%) | 0 (0.0%) |
| Total | 155 (51.0%) | 7 (4.5%) |
Employment Status by Educational Attainment in Beallsville
According to labor force statistics for Beallsville, 64.3% of individuals (110) out of the total population between 25 and 64 years of age (171) are in the labor force, with 3.6% or 4 of them being unemployed. The group with the highest labor force participation rate are those with the educational attainment of bachelor's degree or higher, with 100.0% or 5 individuals in the labor force. Within the labor force, individuals with less than high school education have the highest percentage of unemployment, with 100.0% or 4 of them being unemployed.
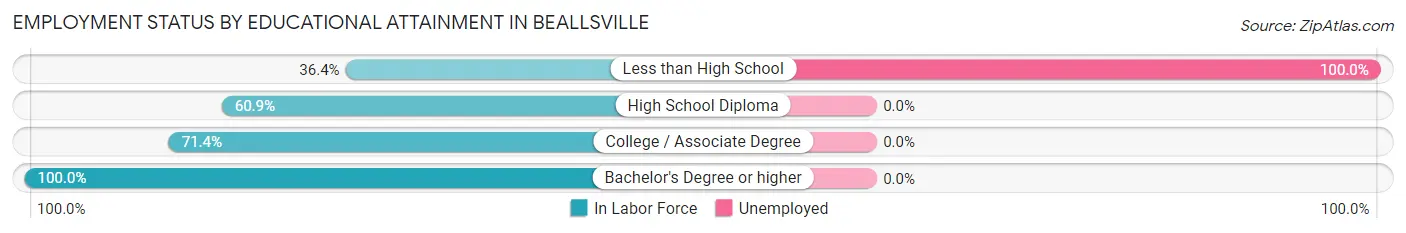
| Educational Attainment | In Labor Force | Unemployed |
| Less than High School | 4 (36.4%) | 11 (100.0%) |
| High School Diploma | 56 (60.9%) | 0 (0.0%) |
| College / Associate Degree | 45 (71.4%) | 0 (0.0%) |
| Bachelor's Degree or higher | 5 (100.0%) | 0 (0.0%) |
| Total | 110 (64.3%) | 6 (3.6%) |
Employment Occupations by Sex in Beallsville
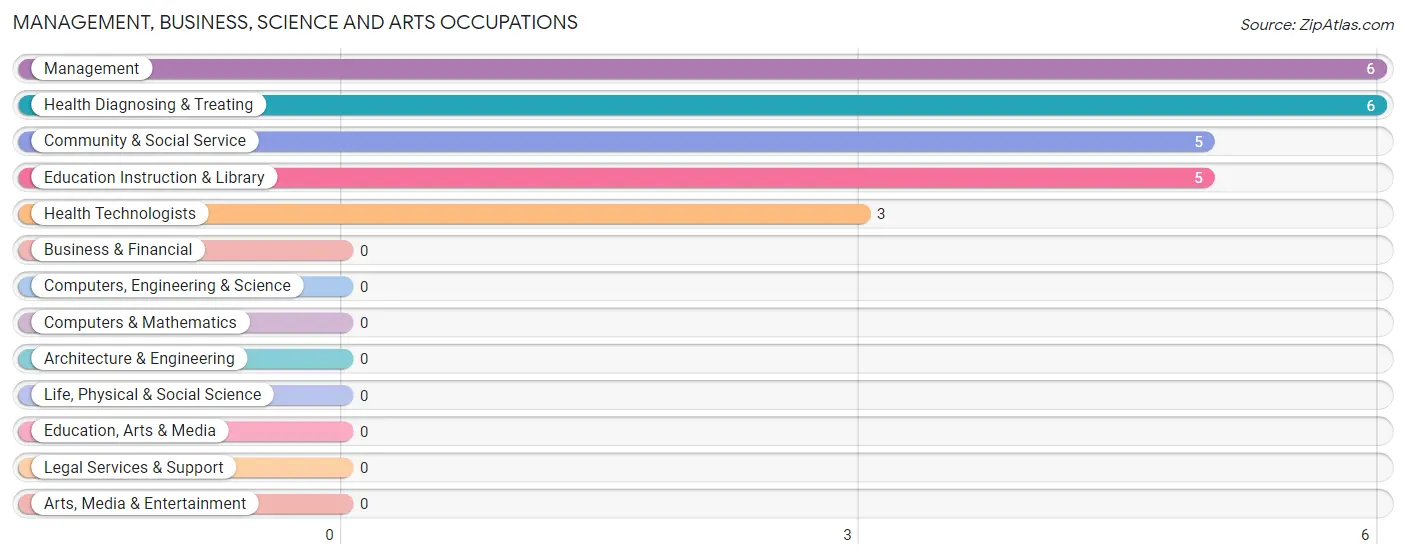
Management, Business, Science and Arts Occupations
The most common Management, Business, Science and Arts occupations in Beallsville are Management (6 | 4.1%), Health Diagnosing & Treating (6 | 4.1%), Community & Social Service (5 | 3.4%), Education Instruction & Library (5 | 3.4%), and Health Technologists (3 | 2.0%).
Management, Business, Science and Arts Occupations by Sex
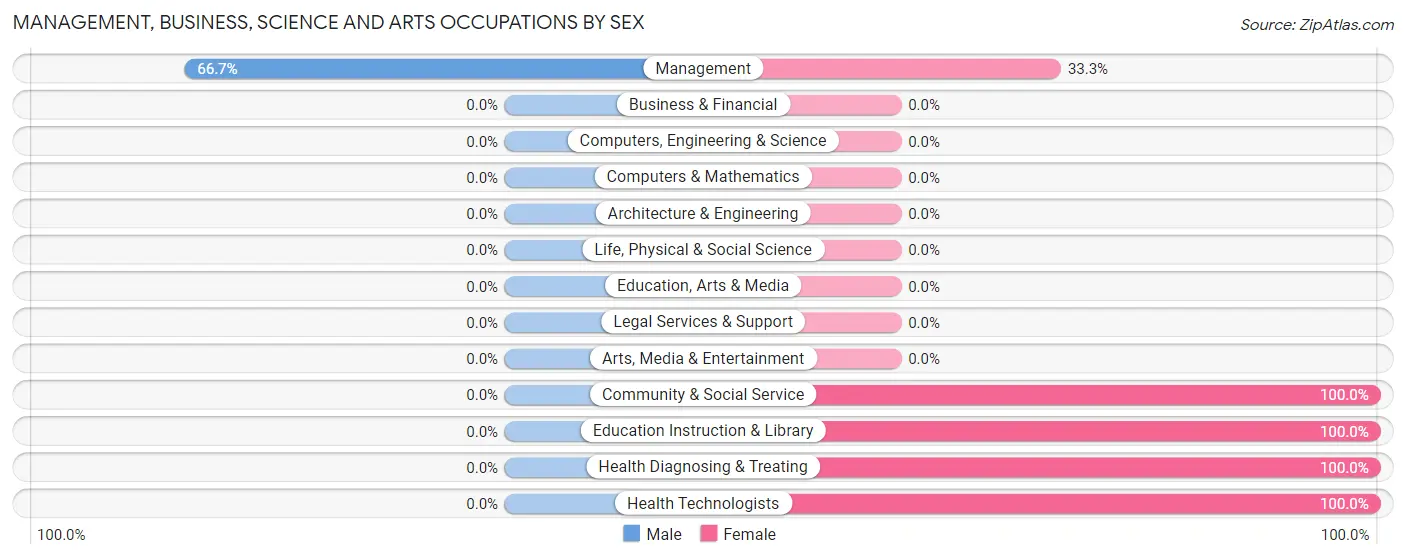
| Occupation | Male | Female |
| Management | 4 (66.7%) | 2 (33.3%) |
| Business & Financial | 0 (0.0%) | 0 (0.0%) |
| Computers, Engineering & Science | 0 (0.0%) | 0 (0.0%) |
| Computers & Mathematics | 0 (0.0%) | 0 (0.0%) |
| Architecture & Engineering | 0 (0.0%) | 0 (0.0%) |
| Life, Physical & Social Science | 0 (0.0%) | 0 (0.0%) |
| Community & Social Service | 0 (0.0%) | 5 (100.0%) |
| Education, Arts & Media | 0 (0.0%) | 0 (0.0%) |
| Legal Services & Support | 0 (0.0%) | 0 (0.0%) |
| Education Instruction & Library | 0 (0.0%) | 5 (100.0%) |
| Arts, Media & Entertainment | 0 (0.0%) | 0 (0.0%) |
| Health Diagnosing & Treating | 0 (0.0%) | 6 (100.0%) |
| Health Technologists | 0 (0.0%) | 3 (100.0%) |
| Total (Category) | 4 (23.5%) | 13 (76.5%) |
| Total (Overall) | 66 (44.6%) | 82 (55.4%) |
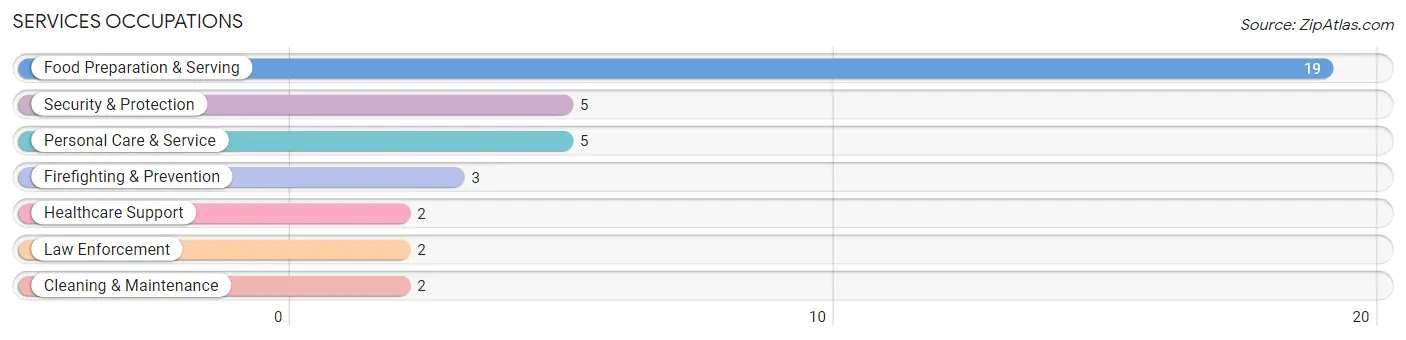
Services Occupations
The most common Services occupations in Beallsville are Food Preparation & Serving (19 | 12.8%), Security & Protection (5 | 3.4%), Personal Care & Service (5 | 3.4%), Firefighting & Prevention (3 | 2.0%), and Healthcare Support (2 | 1.3%).
Services Occupations by Sex
Within the Services occupations in Beallsville, the most male-oriented occupations are Law Enforcement (100.0%), Security & Protection (60.0%), and Firefighting & Prevention (33.3%), while the most female-oriented occupations are Healthcare Support (100.0%), Cleaning & Maintenance (100.0%), and Personal Care & Service (100.0%).
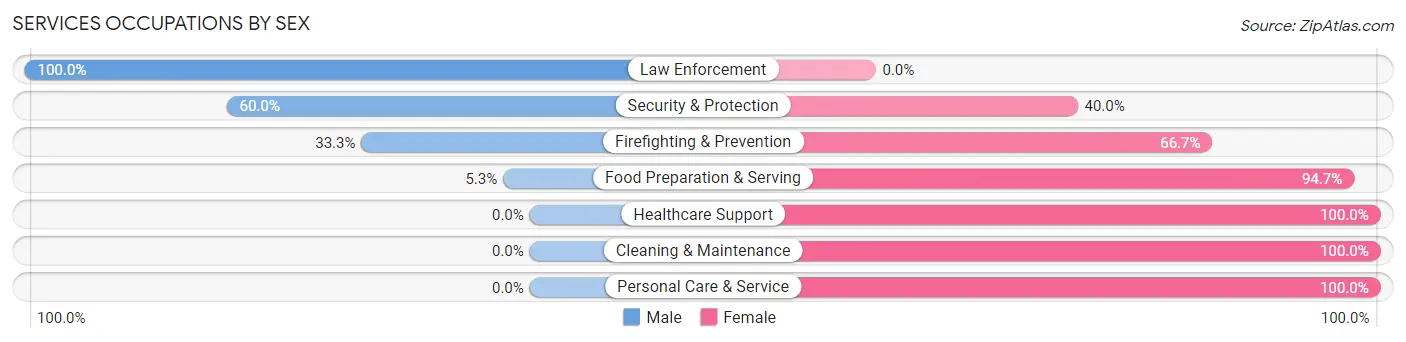
| Occupation | Male | Female |
| Healthcare Support | 0 (0.0%) | 2 (100.0%) |
| Security & Protection | 3 (60.0%) | 2 (40.0%) |
| Firefighting & Prevention | 1 (33.3%) | 2 (66.7%) |
| Law Enforcement | 2 (100.0%) | 0 (0.0%) |
| Food Preparation & Serving | 1 (5.3%) | 18 (94.7%) |
| Cleaning & Maintenance | 0 (0.0%) | 2 (100.0%) |
| Personal Care & Service | 0 (0.0%) | 5 (100.0%) |
| Total (Category) | 4 (12.1%) | 29 (87.9%) |
| Total (Overall) | 66 (44.6%) | 82 (55.4%) |
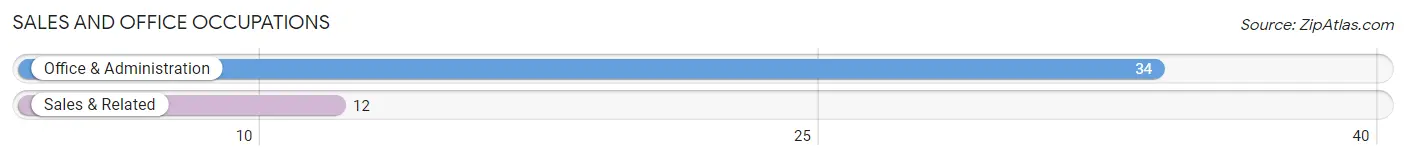
Sales and Office Occupations
The most common Sales and Office occupations in Beallsville are Office & Administration (34 | 23.0%), and Sales & Related (12 | 8.1%).
Sales and Office Occupations by Sex

| Occupation | Male | Female |
| Sales & Related | 5 (41.7%) | 7 (58.3%) |
| Office & Administration | 6 (17.6%) | 28 (82.4%) |
| Total (Category) | 11 (23.9%) | 35 (76.1%) |
| Total (Overall) | 66 (44.6%) | 82 (55.4%) |
Natural Resources, Construction and Maintenance Occupations
The most common Natural Resources, Construction and Maintenance occupations in Beallsville are Construction & Extraction (27 | 18.2%), and Installation, Maintenance & Repair (6 | 4.1%).
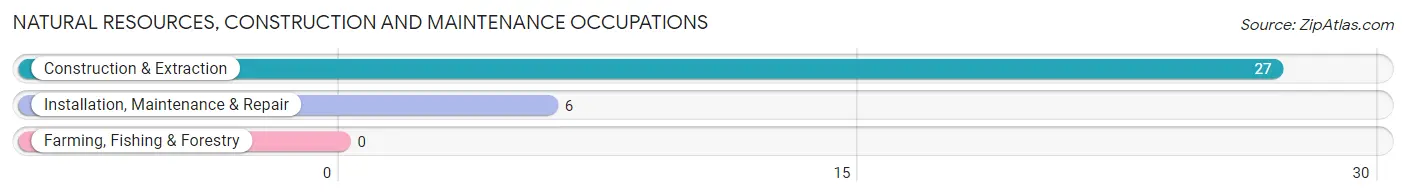
Natural Resources, Construction and Maintenance Occupations by Sex
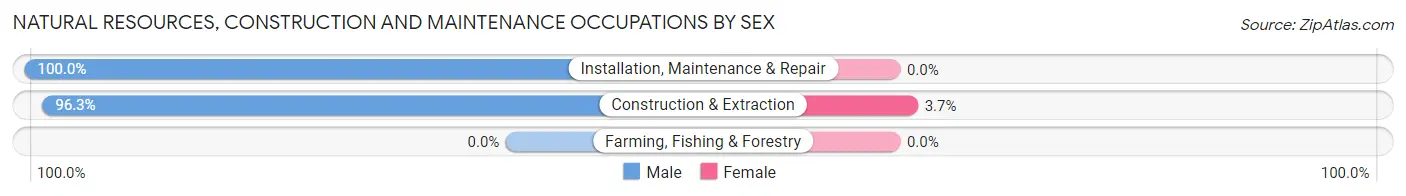
| Occupation | Male | Female |
| Farming, Fishing & Forestry | 0 (0.0%) | 0 (0.0%) |
| Construction & Extraction | 26 (96.3%) | 1 (3.7%) |
| Installation, Maintenance & Repair | 6 (100.0%) | 0 (0.0%) |
| Total (Category) | 32 (97.0%) | 1 (3.0%) |
| Total (Overall) | 66 (44.6%) | 82 (55.4%) |
Production, Transportation and Moving Occupations
The most common Production, Transportation and Moving occupations in Beallsville are Production (8 | 5.4%), Material Moving (7 | 4.7%), and Transportation (4 | 2.7%).
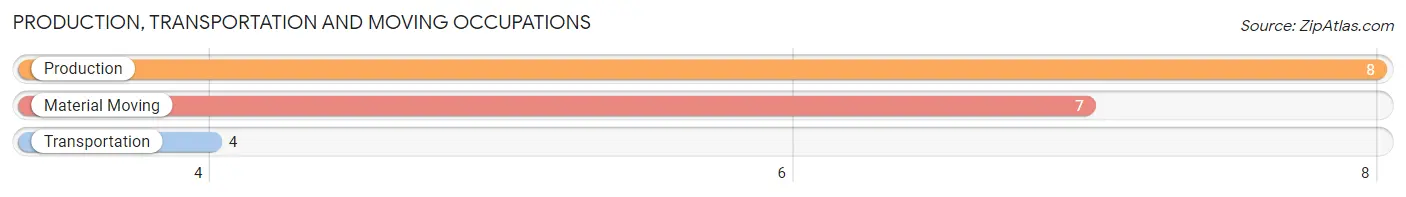
Production, Transportation and Moving Occupations by Sex
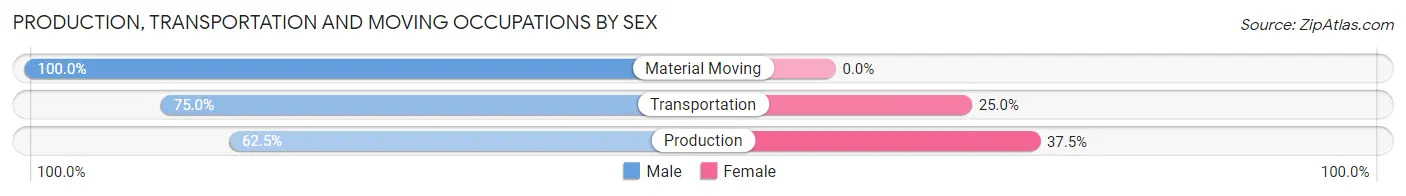
| Occupation | Male | Female |
| Production | 5 (62.5%) | 3 (37.5%) |
| Transportation | 3 (75.0%) | 1 (25.0%) |
| Material Moving | 7 (100.0%) | 0 (0.0%) |
| Total (Category) | 15 (78.9%) | 4 (21.0%) |
| Total (Overall) | 66 (44.6%) | 82 (55.4%) |
Employment Industries by Sex in Beallsville
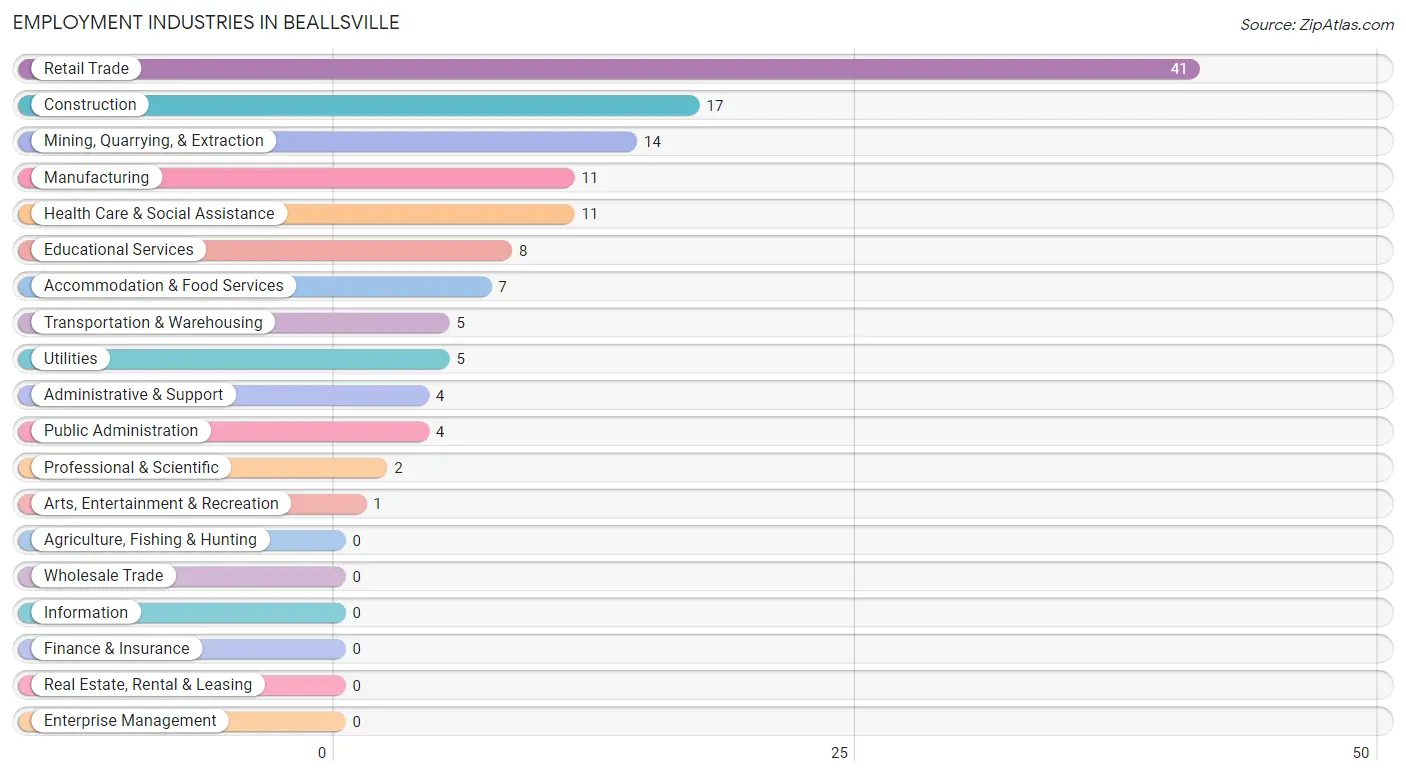
Employment Industries in Beallsville
The major employment industries in Beallsville include Retail Trade (41 | 27.7%), Construction (17 | 11.5%), Mining, Quarrying, & Extraction (14 | 9.5%), Manufacturing (11 | 7.4%), and Health Care & Social Assistance (11 | 7.4%).
Employment Industries by Sex in Beallsville
The Beallsville industries that see more men than women are Utilities (100.0%), Administrative & Support (100.0%), and Arts, Entertainment & Recreation (100.0%), whereas the industries that tend to have a higher number of women are Professional & Scientific (100.0%), Educational Services (100.0%), and Health Care & Social Assistance (100.0%).
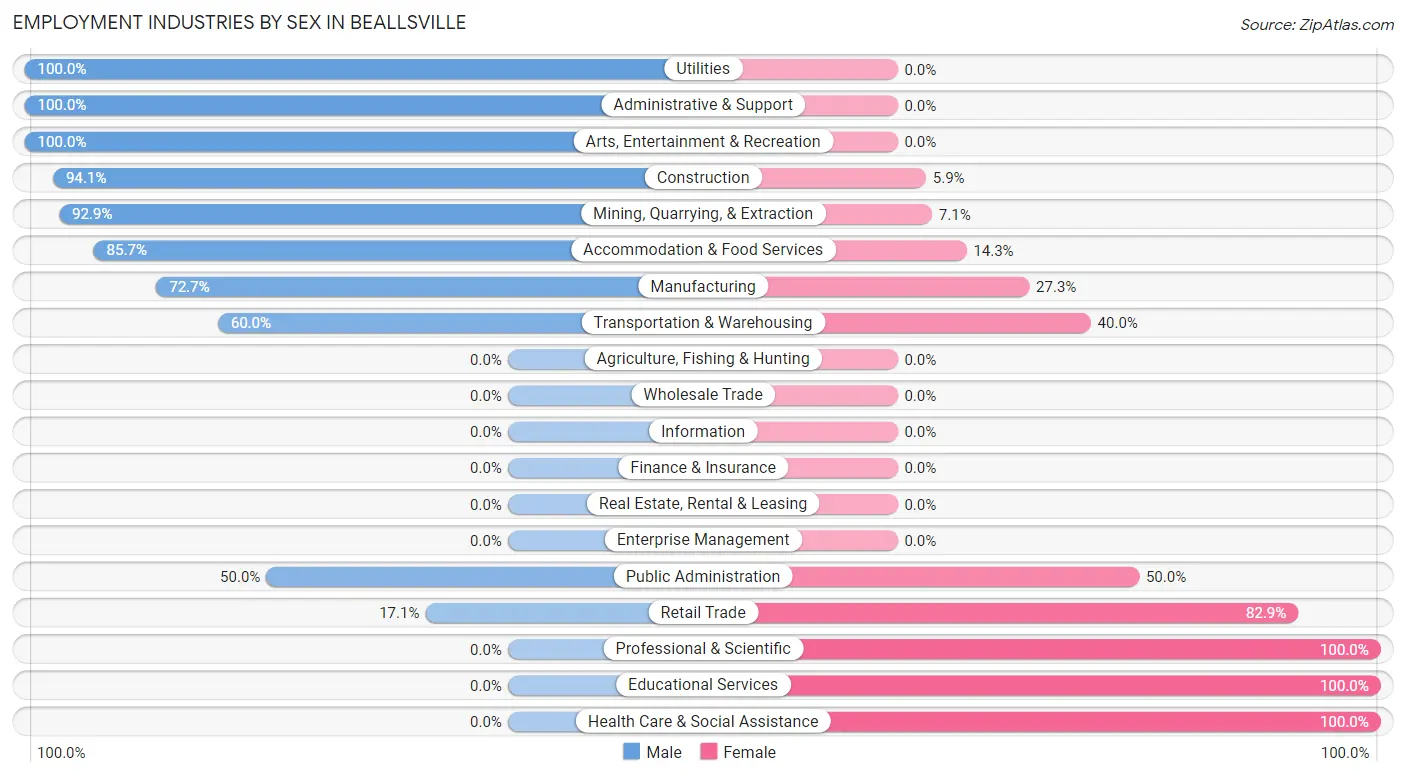
| Industry | Male | Female |
| Agriculture, Fishing & Hunting | 0 (0.0%) | 0 (0.0%) |
| Mining, Quarrying, & Extraction | 13 (92.9%) | 1 (7.1%) |
| Construction | 16 (94.1%) | 1 (5.9%) |
| Manufacturing | 8 (72.7%) | 3 (27.3%) |
| Wholesale Trade | 0 (0.0%) | 0 (0.0%) |
| Retail Trade | 7 (17.1%) | 34 (82.9%) |
| Transportation & Warehousing | 3 (60.0%) | 2 (40.0%) |
| Utilities | 5 (100.0%) | 0 (0.0%) |
| Information | 0 (0.0%) | 0 (0.0%) |
| Finance & Insurance | 0 (0.0%) | 0 (0.0%) |
| Real Estate, Rental & Leasing | 0 (0.0%) | 0 (0.0%) |
| Professional & Scientific | 0 (0.0%) | 2 (100.0%) |
| Enterprise Management | 0 (0.0%) | 0 (0.0%) |
| Administrative & Support | 4 (100.0%) | 0 (0.0%) |
| Educational Services | 0 (0.0%) | 8 (100.0%) |
| Health Care & Social Assistance | 0 (0.0%) | 11 (100.0%) |
| Arts, Entertainment & Recreation | 1 (100.0%) | 0 (0.0%) |
| Accommodation & Food Services | 6 (85.7%) | 1 (14.3%) |
| Public Administration | 2 (50.0%) | 2 (50.0%) |
| Total | 66 (44.6%) | 82 (55.4%) |
Education in Beallsville
School Enrollment in Beallsville
The most common levels of schooling among the 92 students in Beallsville are elementary school (36 | 39.1%), high school (27 | 29.3%), and middle school (22 | 23.9%).
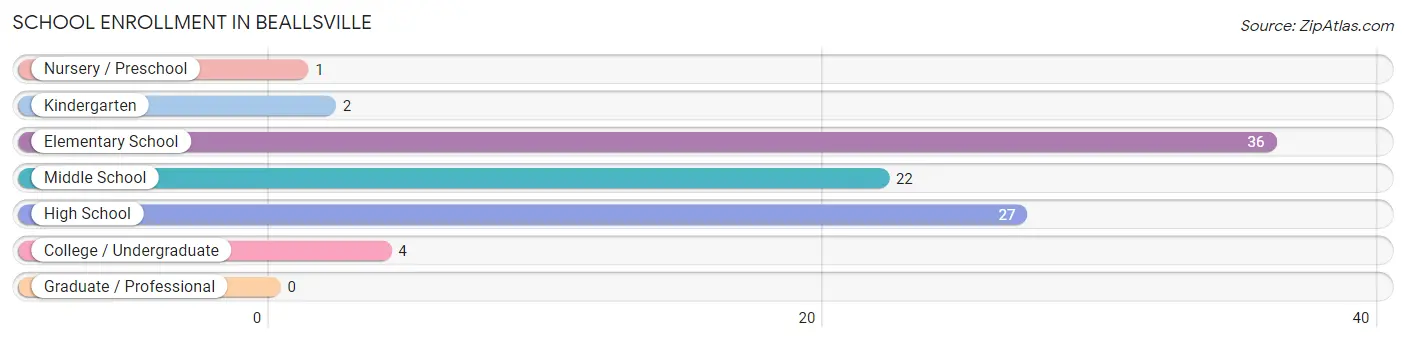
| School Level | # Students | % Students |
| Nursery / Preschool | 1 | 1.1% |
| Kindergarten | 2 | 2.2% |
| Elementary School | 36 | 39.1% |
| Middle School | 22 | 23.9% |
| High School | 27 | 29.3% |
| College / Undergraduate | 4 | 4.3% |
| Graduate / Professional | 0 | 0.0% |
| Total | 92 | 100.0% |
School Enrollment by Age by Funding Source in Beallsville
Out of a total of 92 students who are enrolled in schools in Beallsville, 1 (1.1%) attend a private institution, while the remaining 91 (98.9%) are enrolled in public schools. The age group of 15 to 17 year olds has the highest likelihood of being enrolled in private schools, with 1 (7.1% in the age bracket) enrolled. Conversely, the age group of 3 to 4 year olds has the lowest likelihood of being enrolled in a private school, with 1 (100.0% in the age bracket) attending a public institution.
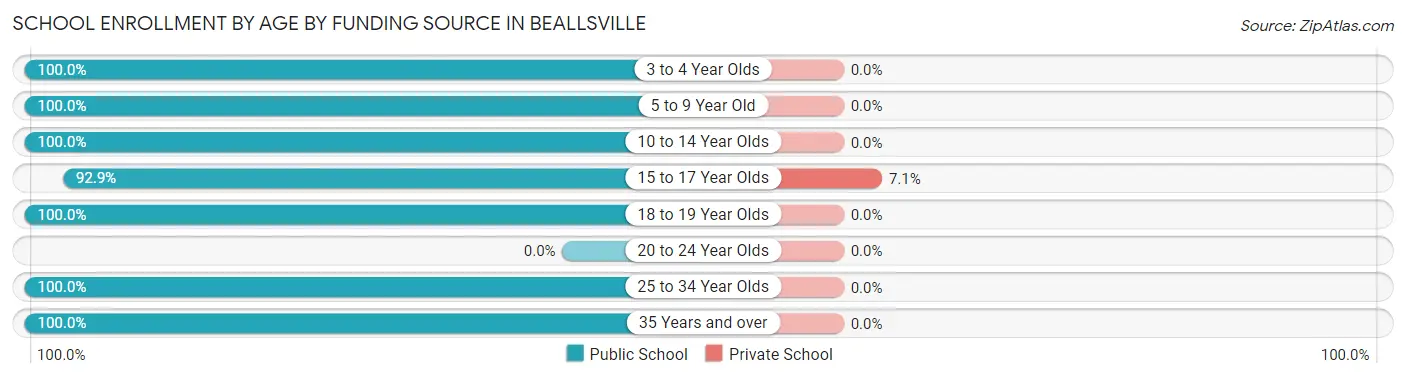
| Age Bracket | Public School | Private School |
| 3 to 4 Year Olds | 1 (100.0%) | 0 (0.0%) |
| 5 to 9 Year Old | 35 (100.0%) | 0 (0.0%) |
| 10 to 14 Year Olds | 25 (100.0%) | 0 (0.0%) |
| 15 to 17 Year Olds | 13 (92.9%) | 1 (7.1%) |
| 18 to 19 Year Olds | 12 (100.0%) | 0 (0.0%) |
| 20 to 24 Year Olds | 0 (0.0%) | 0 (0.0%) |
| 25 to 34 Year Olds | 2 (100.0%) | 0 (0.0%) |
| 35 Years and over | 3 (100.0%) | 0 (0.0%) |
| Total | 91 (98.9%) | 1 (1.1%) |
Educational Attainment by Field of Study in Beallsville
Education (5 | 55.6%), bio, nature & agricultural (2 | 22.2%), and business (2 | 22.2%) are the most common fields of study among 9 individuals in Beallsville who have obtained a bachelor's degree or higher.
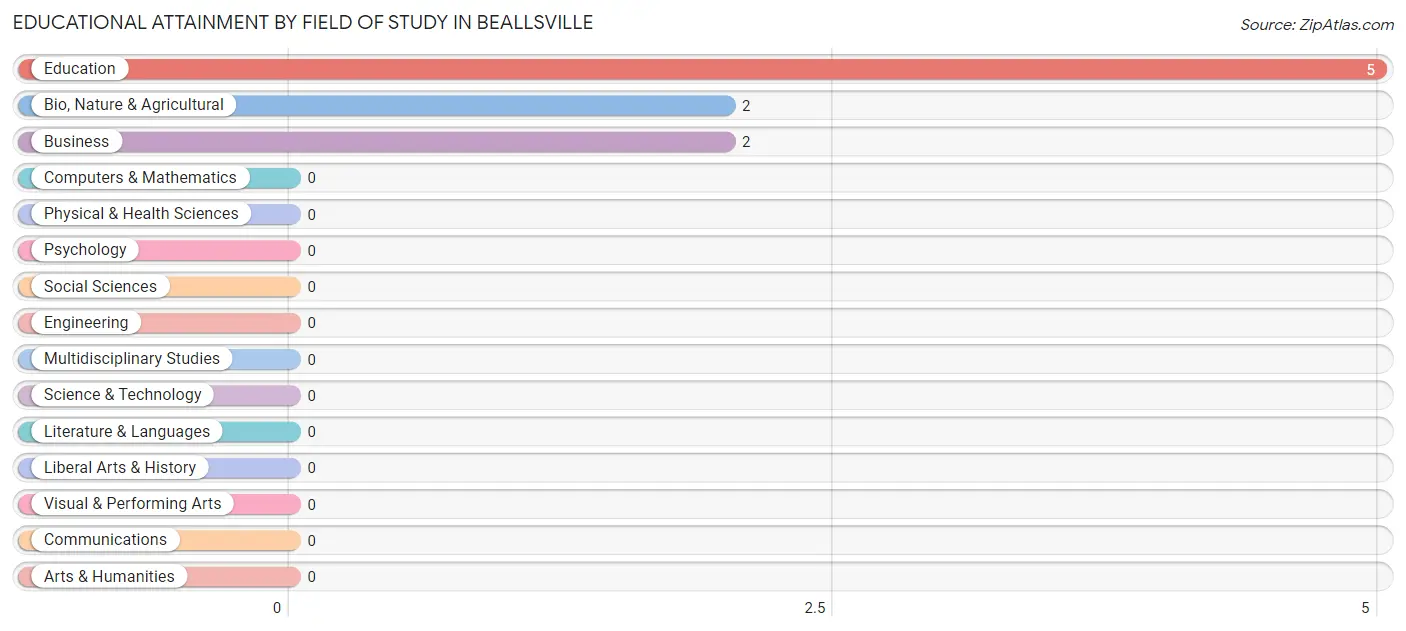
| Field of Study | # Graduates | % Graduates |
| Computers & Mathematics | 0 | 0.0% |
| Bio, Nature & Agricultural | 2 | 22.2% |
| Physical & Health Sciences | 0 | 0.0% |
| Psychology | 0 | 0.0% |
| Social Sciences | 0 | 0.0% |
| Engineering | 0 | 0.0% |
| Multidisciplinary Studies | 0 | 0.0% |
| Science & Technology | 0 | 0.0% |
| Business | 2 | 22.2% |
| Education | 5 | 55.6% |
| Literature & Languages | 0 | 0.0% |
| Liberal Arts & History | 0 | 0.0% |
| Visual & Performing Arts | 0 | 0.0% |
| Communications | 0 | 0.0% |
| Arts & Humanities | 0 | 0.0% |
| Total | 9 | 100.0% |
Transportation & Commute in Beallsville
Vehicle Availability by Sex in Beallsville
The most prevalent vehicle ownership categories in Beallsville are males with 3 vehicles (24, accounting for 36.4%) and females with 3 vehicles (15, making up 30.4%).
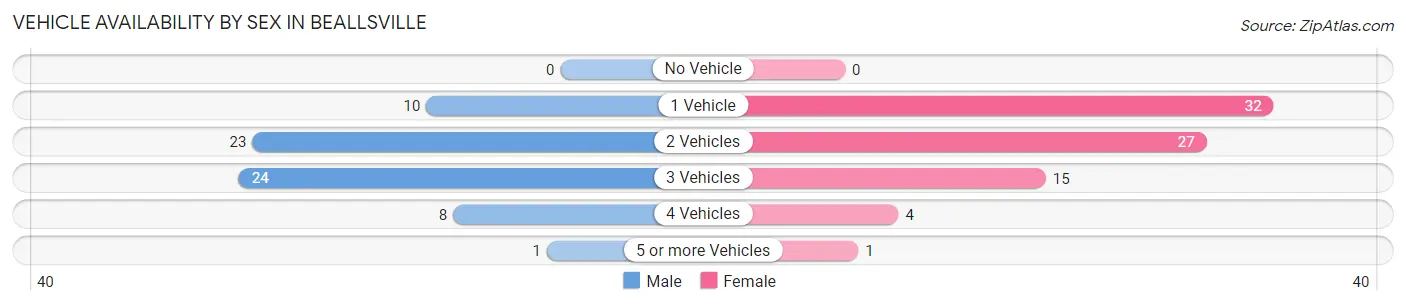
| Vehicles Available | Male | Female |
| No Vehicle | 0 (0.0%) | 0 (0.0%) |
| 1 Vehicle | 10 (15.1%) | 32 (40.5%) |
| 2 Vehicles | 23 (34.8%) | 27 (34.2%) |
| 3 Vehicles | 24 (36.4%) | 15 (19.0%) |
| 4 Vehicles | 8 (12.1%) | 4 (5.1%) |
| 5 or more Vehicles | 1 (1.5%) | 1 (1.3%) |
| Total | 66 (100.0%) | 79 (100.0%) |
Commute Time in Beallsville
The most frequently occuring commute durations in Beallsville are 5 to 9 minutes (40 commuters, 27.6%), 90 or more minutes (23 commuters, 15.9%), and 60 to 89 minutes (17 commuters, 11.7%).
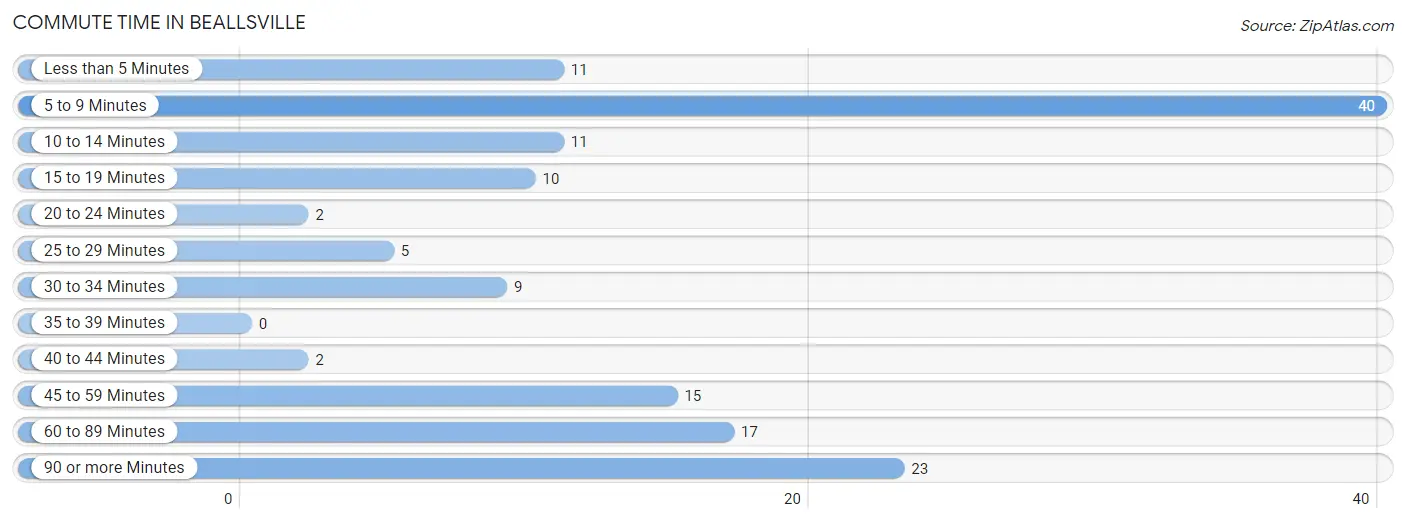
| Commute Time | # Commuters | % Commuters |
| Less than 5 Minutes | 11 | 7.6% |
| 5 to 9 Minutes | 40 | 27.6% |
| 10 to 14 Minutes | 11 | 7.6% |
| 15 to 19 Minutes | 10 | 6.9% |
| 20 to 24 Minutes | 2 | 1.4% |
| 25 to 29 Minutes | 5 | 3.5% |
| 30 to 34 Minutes | 9 | 6.2% |
| 35 to 39 Minutes | 0 | 0.0% |
| 40 to 44 Minutes | 2 | 1.4% |
| 45 to 59 Minutes | 15 | 10.3% |
| 60 to 89 Minutes | 17 | 11.7% |
| 90 or more Minutes | 23 | 15.9% |
Commute Time by Sex in Beallsville
The most common commute times in Beallsville are 90 or more minutes (19 commuters, 28.8%) for males and 5 to 9 minutes (32 commuters, 40.5%) for females.
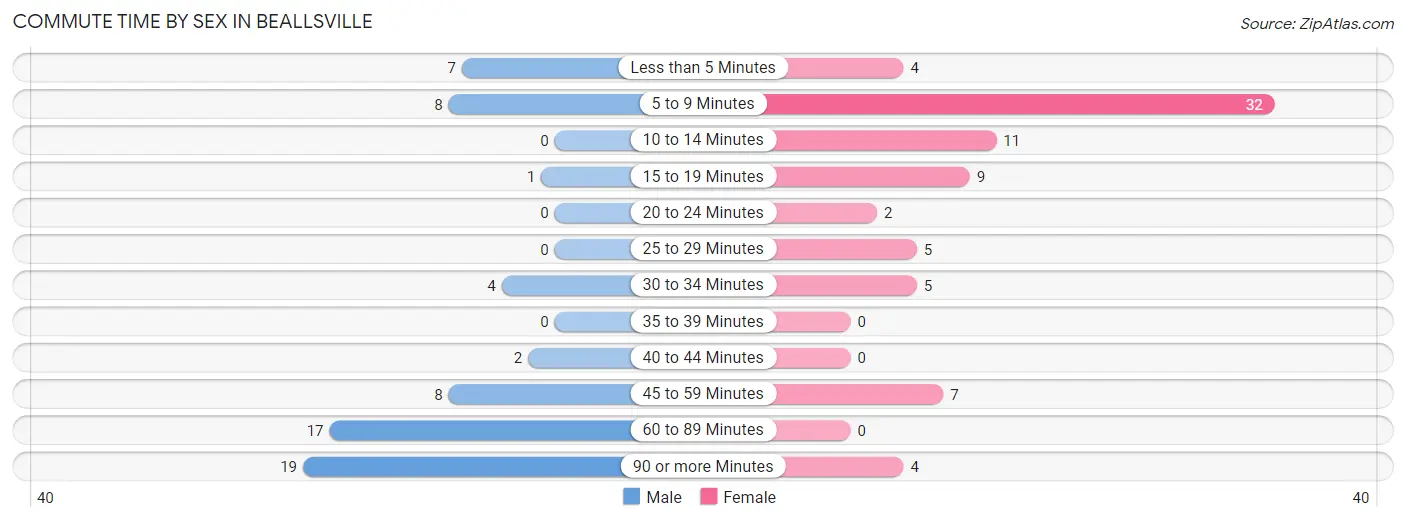
| Commute Time | Male | Female |
| Less than 5 Minutes | 7 (10.6%) | 4 (5.1%) |
| 5 to 9 Minutes | 8 (12.1%) | 32 (40.5%) |
| 10 to 14 Minutes | 0 (0.0%) | 11 (13.9%) |
| 15 to 19 Minutes | 1 (1.5%) | 9 (11.4%) |
| 20 to 24 Minutes | 0 (0.0%) | 2 (2.5%) |
| 25 to 29 Minutes | 0 (0.0%) | 5 (6.3%) |
| 30 to 34 Minutes | 4 (6.1%) | 5 (6.3%) |
| 35 to 39 Minutes | 0 (0.0%) | 0 (0.0%) |
| 40 to 44 Minutes | 2 (3.0%) | 0 (0.0%) |
| 45 to 59 Minutes | 8 (12.1%) | 7 (8.9%) |
| 60 to 89 Minutes | 17 (25.8%) | 0 (0.0%) |
| 90 or more Minutes | 19 (28.8%) | 4 (5.1%) |
Time of Departure to Work by Sex in Beallsville
The most frequent times of departure to work in Beallsville are 12:00 AM to 4:59 AM (18, 27.3%) for males and 7:30 AM to 7:59 AM (38, 48.1%) for females.
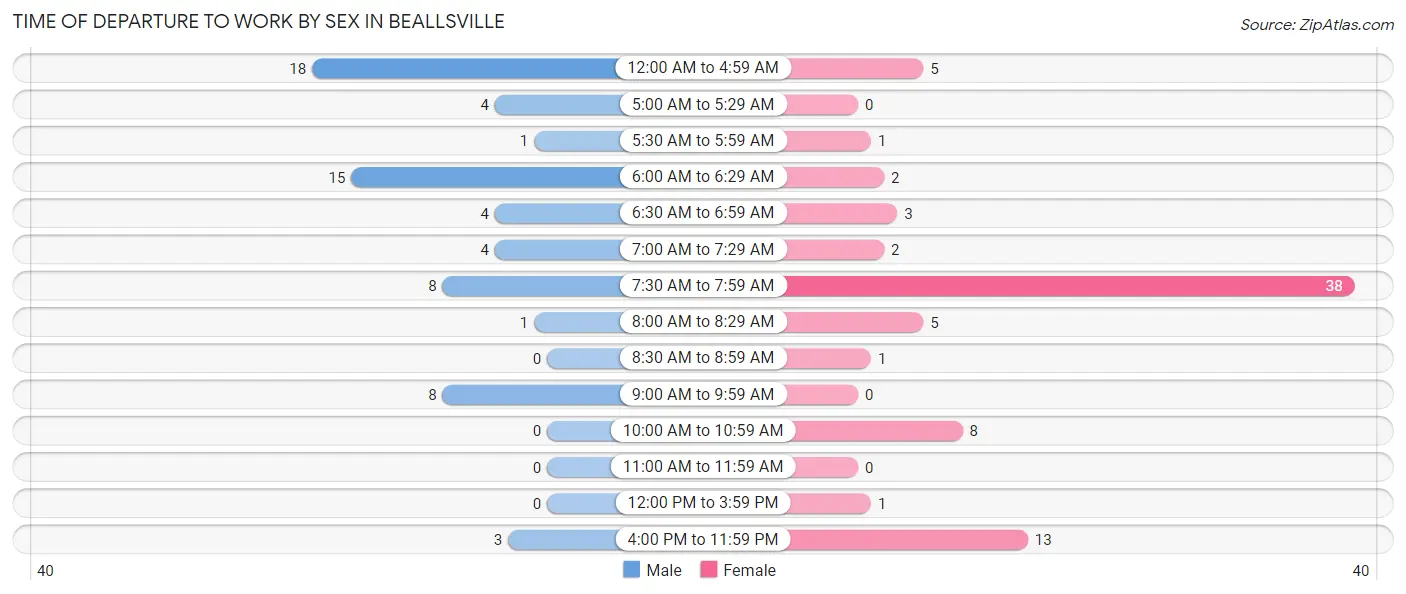
| Time of Departure | Male | Female |
| 12:00 AM to 4:59 AM | 18 (27.3%) | 5 (6.3%) |
| 5:00 AM to 5:29 AM | 4 (6.1%) | 0 (0.0%) |
| 5:30 AM to 5:59 AM | 1 (1.5%) | 1 (1.3%) |
| 6:00 AM to 6:29 AM | 15 (22.7%) | 2 (2.5%) |
| 6:30 AM to 6:59 AM | 4 (6.1%) | 3 (3.8%) |
| 7:00 AM to 7:29 AM | 4 (6.1%) | 2 (2.5%) |
| 7:30 AM to 7:59 AM | 8 (12.1%) | 38 (48.1%) |
| 8:00 AM to 8:29 AM | 1 (1.5%) | 5 (6.3%) |
| 8:30 AM to 8:59 AM | 0 (0.0%) | 1 (1.3%) |
| 9:00 AM to 9:59 AM | 8 (12.1%) | 0 (0.0%) |
| 10:00 AM to 10:59 AM | 0 (0.0%) | 8 (10.1%) |
| 11:00 AM to 11:59 AM | 0 (0.0%) | 0 (0.0%) |
| 12:00 PM to 3:59 PM | 0 (0.0%) | 1 (1.3%) |
| 4:00 PM to 11:59 PM | 3 (4.5%) | 13 (16.5%) |
| Total | 66 (100.0%) | 79 (100.0%) |
Housing Occupancy in Beallsville
Occupancy by Ownership in Beallsville
Of the total 163 dwellings in Beallsville, owner-occupied units account for 94 (57.7%), while renter-occupied units make up 69 (42.3%).
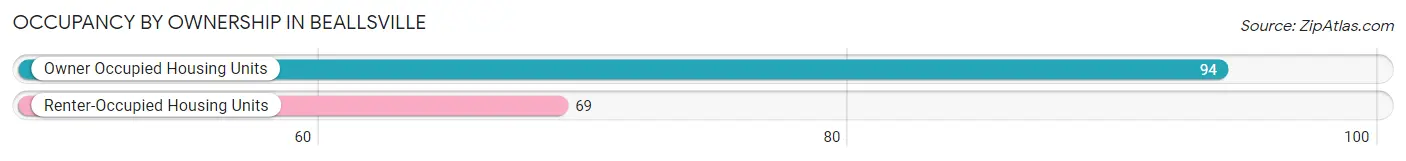
| Occupancy | # Housing Units | % Housing Units |
| Owner Occupied Housing Units | 94 | 57.7% |
| Renter-Occupied Housing Units | 69 | 42.3% |
| Total Occupied Housing Units | 163 | 100.0% |
Occupancy by Household Size in Beallsville
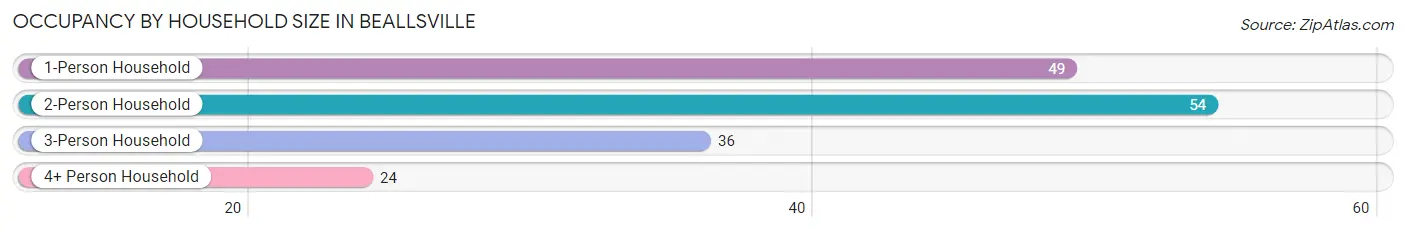
| Household Size | # Housing Units | % Housing Units |
| 1-Person Household | 49 | 30.1% |
| 2-Person Household | 54 | 33.1% |
| 3-Person Household | 36 | 22.1% |
| 4+ Person Household | 24 | 14.7% |
| Total Housing Units | 163 | 100.0% |
Occupancy by Ownership by Household Size in Beallsville
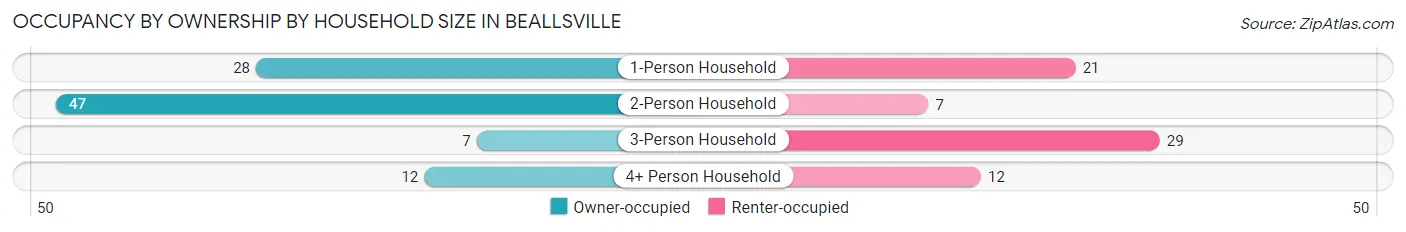
| Household Size | Owner-occupied | Renter-occupied |
| 1-Person Household | 28 (57.1%) | 21 (42.9%) |
| 2-Person Household | 47 (87.0%) | 7 (13.0%) |
| 3-Person Household | 7 (19.4%) | 29 (80.6%) |
| 4+ Person Household | 12 (50.0%) | 12 (50.0%) |
| Total Housing Units | 94 (57.7%) | 69 (42.3%) |
Occupancy by Educational Attainment in Beallsville
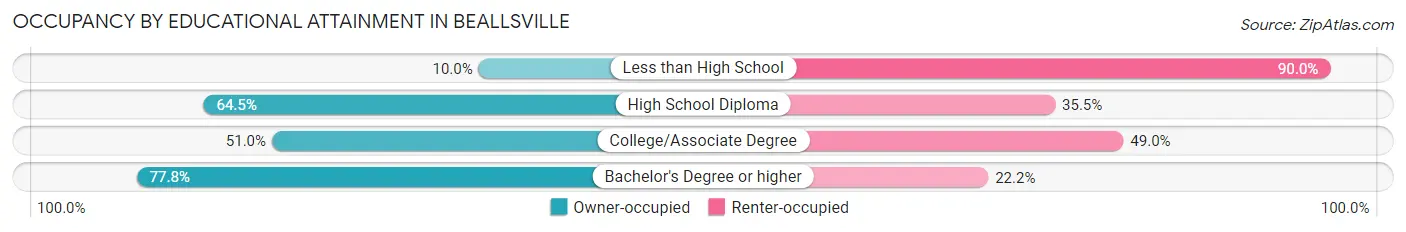
| Household Size | Owner-occupied | Renter-occupied |
| Less than High School | 1 (10.0%) | 9 (90.0%) |
| High School Diploma | 60 (64.5%) | 33 (35.5%) |
| College/Associate Degree | 26 (51.0%) | 25 (49.0%) |
| Bachelor's Degree or higher | 7 (77.8%) | 2 (22.2%) |
Occupancy by Age of Householder in Beallsville
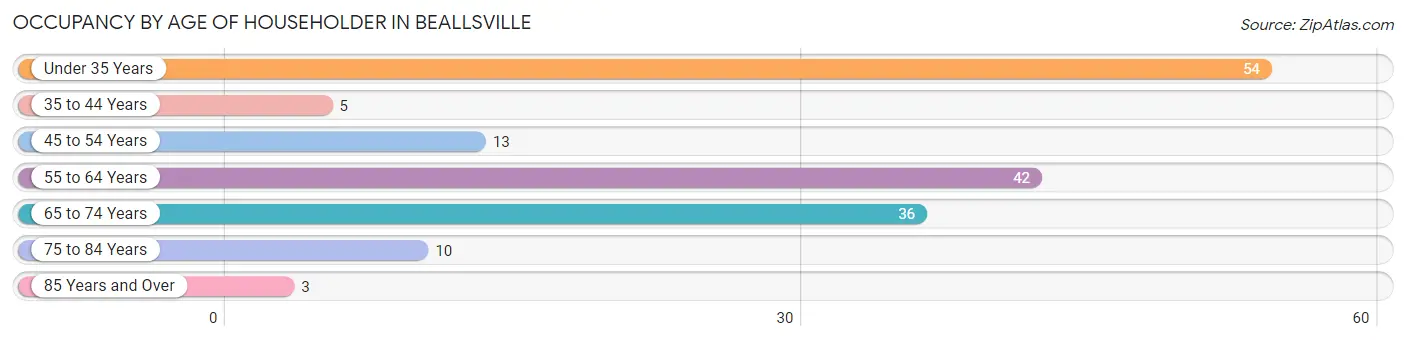
| Age Bracket | # Households | % Households |
| Under 35 Years | 54 | 33.1% |
| 35 to 44 Years | 5 | 3.1% |
| 45 to 54 Years | 13 | 8.0% |
| 55 to 64 Years | 42 | 25.8% |
| 65 to 74 Years | 36 | 22.1% |
| 75 to 84 Years | 10 | 6.1% |
| 85 Years and Over | 3 | 1.8% |
| Total | 163 | 100.0% |
Housing Finances in Beallsville
Median Income by Occupancy in Beallsville
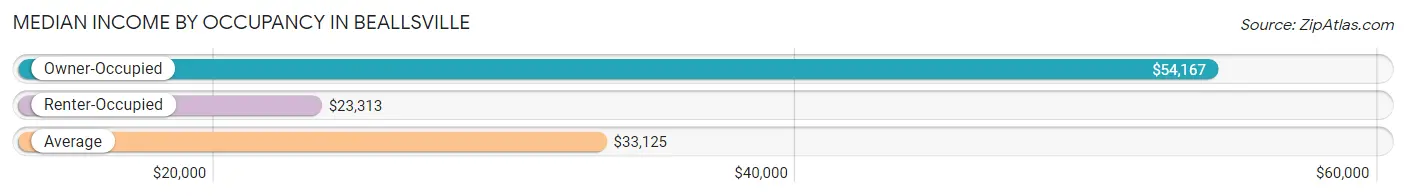
| Occupancy Type | # Households | Median Income |
| Owner-Occupied | 94 (57.7%) | $54,167 |
| Renter-Occupied | 69 (42.3%) | $23,313 |
| Average | 163 (100.0%) | $33,125 |
Occupancy by Householder Income Bracket in Beallsville
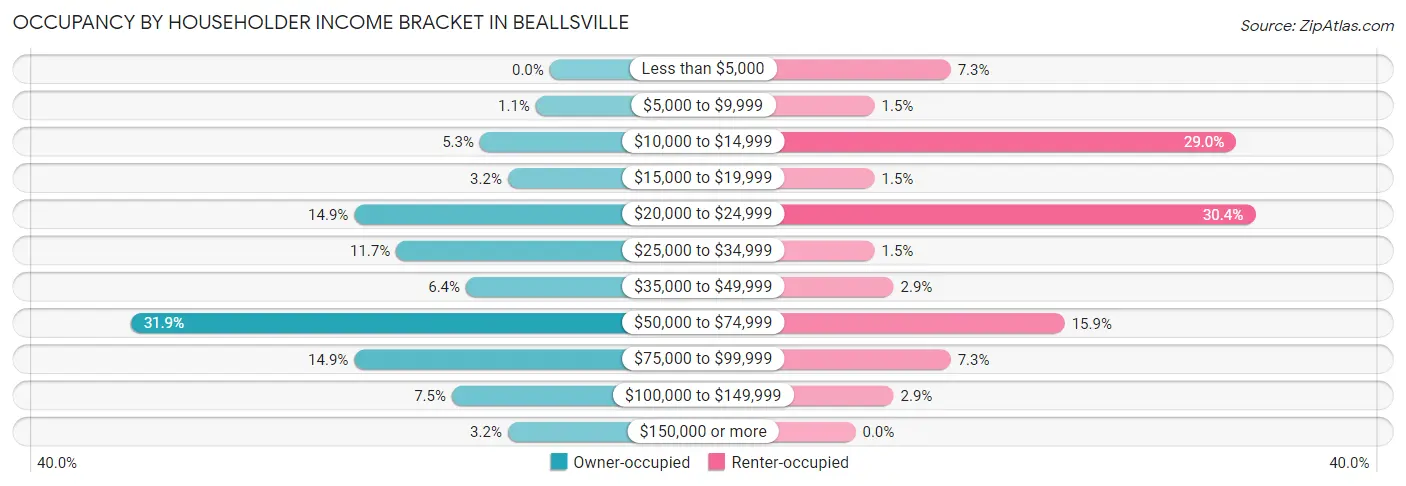
| Income Bracket | Owner-occupied | Renter-occupied |
| Less than $5,000 | 0 (0.0%) | 5 (7.2%) |
| $5,000 to $9,999 | 1 (1.1%) | 1 (1.5%) |
| $10,000 to $14,999 | 5 (5.3%) | 20 (29.0%) |
| $15,000 to $19,999 | 3 (3.2%) | 1 (1.5%) |
| $20,000 to $24,999 | 14 (14.9%) | 21 (30.4%) |
| $25,000 to $34,999 | 11 (11.7%) | 1 (1.5%) |
| $35,000 to $49,999 | 6 (6.4%) | 2 (2.9%) |
| $50,000 to $74,999 | 30 (31.9%) | 11 (15.9%) |
| $75,000 to $99,999 | 14 (14.9%) | 5 (7.2%) |
| $100,000 to $149,999 | 7 (7.4%) | 2 (2.9%) |
| $150,000 or more | 3 (3.2%) | 0 (0.0%) |
| Total | 94 (100.0%) | 69 (100.0%) |
Monthly Housing Cost Tiers in Beallsville
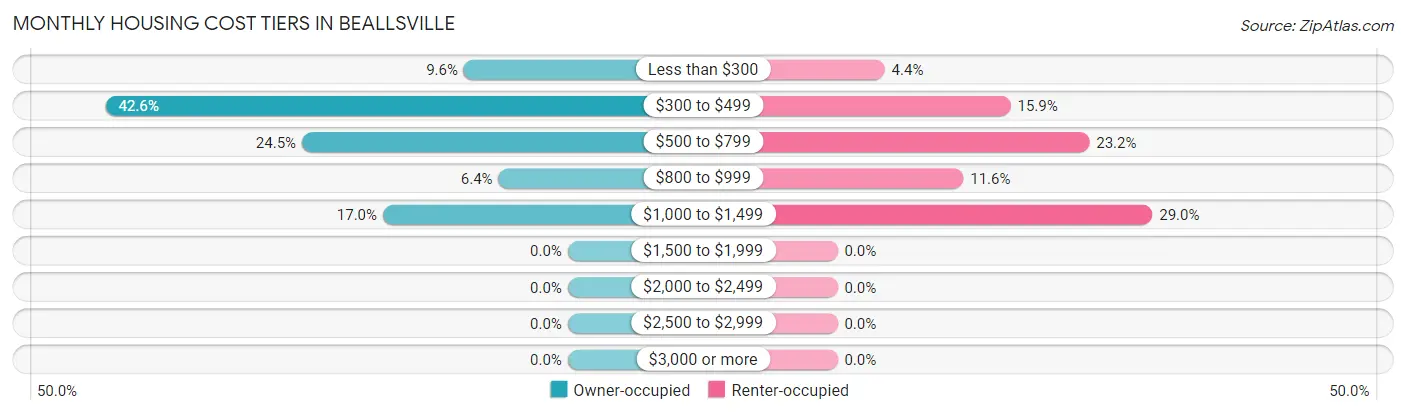
| Monthly Cost | Owner-occupied | Renter-occupied |
| Less than $300 | 9 (9.6%) | 3 (4.3%) |
| $300 to $499 | 40 (42.5%) | 11 (15.9%) |
| $500 to $799 | 23 (24.5%) | 16 (23.2%) |
| $800 to $999 | 6 (6.4%) | 8 (11.6%) |
| $1,000 to $1,499 | 16 (17.0%) | 20 (29.0%) |
| $1,500 to $1,999 | 0 (0.0%) | 0 (0.0%) |
| $2,000 to $2,499 | 0 (0.0%) | 0 (0.0%) |
| $2,500 to $2,999 | 0 (0.0%) | 0 (0.0%) |
| $3,000 or more | 0 (0.0%) | 0 (0.0%) |
| Total | 94 (100.0%) | 69 (100.0%) |
Physical Housing Characteristics in Beallsville
Housing Structures in Beallsville
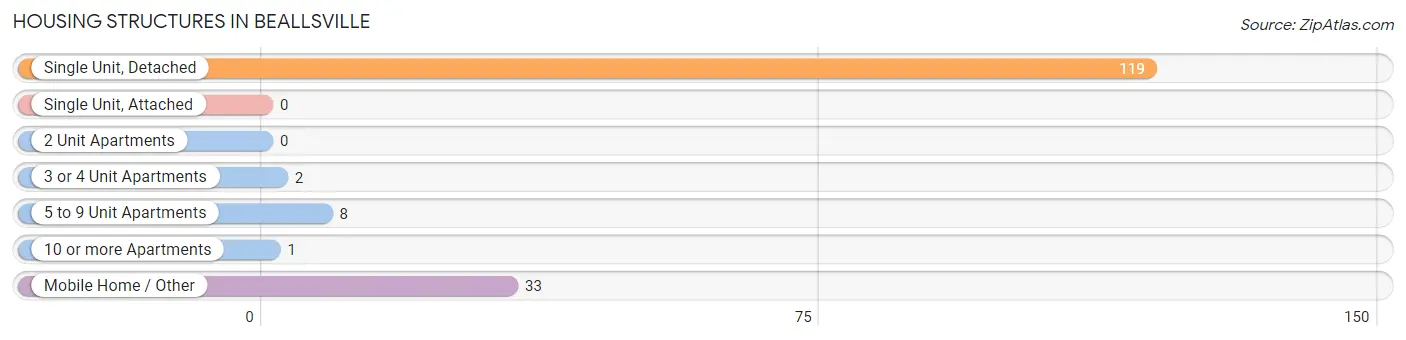
| Structure Type | # Housing Units | % Housing Units |
| Single Unit, Detached | 119 | 73.0% |
| Single Unit, Attached | 0 | 0.0% |
| 2 Unit Apartments | 0 | 0.0% |
| 3 or 4 Unit Apartments | 2 | 1.2% |
| 5 to 9 Unit Apartments | 8 | 4.9% |
| 10 or more Apartments | 1 | 0.6% |
| Mobile Home / Other | 33 | 20.3% |
| Total | 163 | 100.0% |
Housing Structures by Occupancy in Beallsville
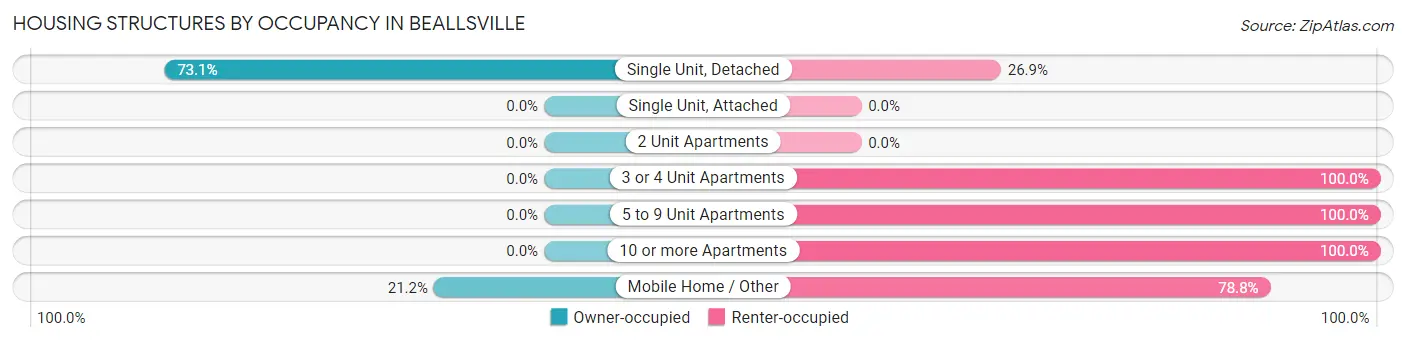
| Structure Type | Owner-occupied | Renter-occupied |
| Single Unit, Detached | 87 (73.1%) | 32 (26.9%) |
| Single Unit, Attached | 0 (0.0%) | 0 (0.0%) |
| 2 Unit Apartments | 0 (0.0%) | 0 (0.0%) |
| 3 or 4 Unit Apartments | 0 (0.0%) | 2 (100.0%) |
| 5 to 9 Unit Apartments | 0 (0.0%) | 8 (100.0%) |
| 10 or more Apartments | 0 (0.0%) | 1 (100.0%) |
| Mobile Home / Other | 7 (21.2%) | 26 (78.8%) |
| Total | 94 (57.7%) | 69 (42.3%) |
Housing Structures by Number of Rooms in Beallsville
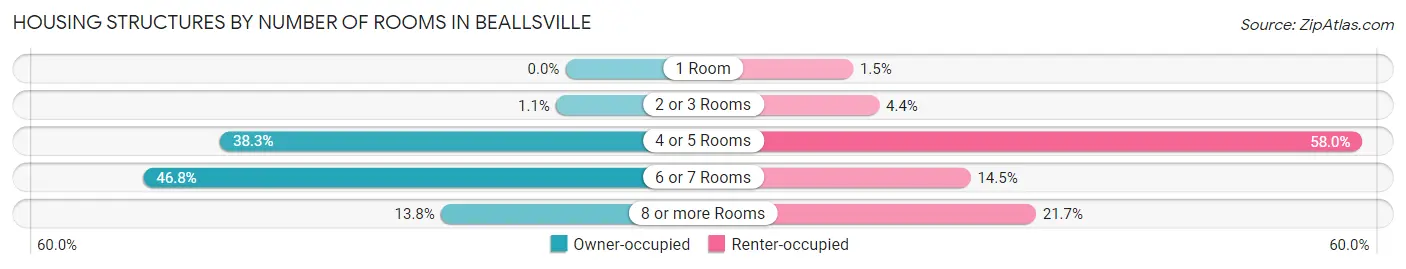
| Number of Rooms | Owner-occupied | Renter-occupied |
| 1 Room | 0 (0.0%) | 1 (1.5%) |
| 2 or 3 Rooms | 1 (1.1%) | 3 (4.3%) |
| 4 or 5 Rooms | 36 (38.3%) | 40 (58.0%) |
| 6 or 7 Rooms | 44 (46.8%) | 10 (14.5%) |
| 8 or more Rooms | 13 (13.8%) | 15 (21.7%) |
| Total | 94 (100.0%) | 69 (100.0%) |
Housing Structure by Heating Type in Beallsville
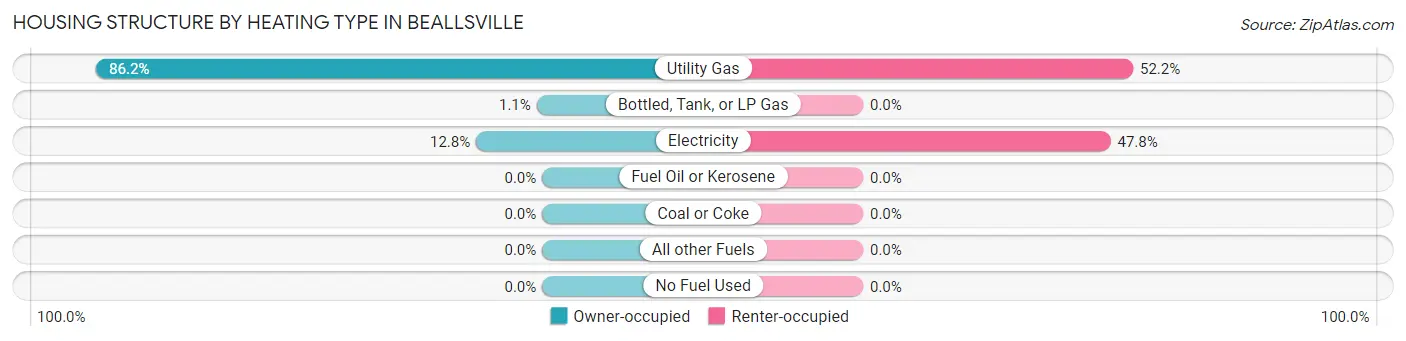
| Heating Type | Owner-occupied | Renter-occupied |
| Utility Gas | 81 (86.2%) | 36 (52.2%) |
| Bottled, Tank, or LP Gas | 1 (1.1%) | 0 (0.0%) |
| Electricity | 12 (12.8%) | 33 (47.8%) |
| Fuel Oil or Kerosene | 0 (0.0%) | 0 (0.0%) |
| Coal or Coke | 0 (0.0%) | 0 (0.0%) |
| All other Fuels | 0 (0.0%) | 0 (0.0%) |
| No Fuel Used | 0 (0.0%) | 0 (0.0%) |
| Total | 94 (100.0%) | 69 (100.0%) |
Household Vehicle Usage in Beallsville
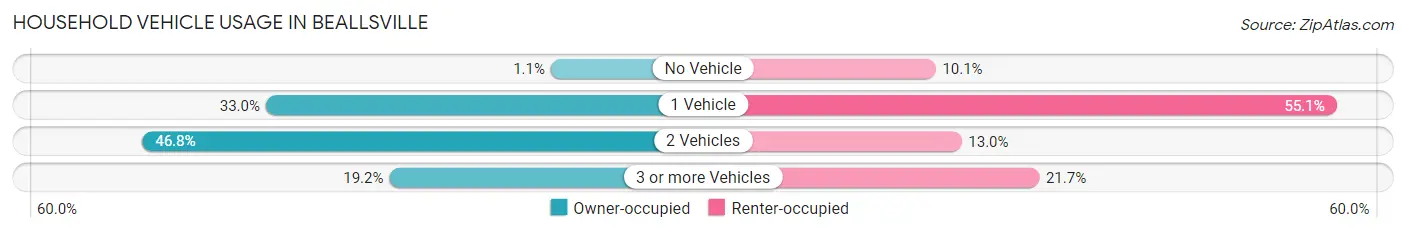
| Vehicles per Household | Owner-occupied | Renter-occupied |
| No Vehicle | 1 (1.1%) | 7 (10.1%) |
| 1 Vehicle | 31 (33.0%) | 38 (55.1%) |
| 2 Vehicles | 44 (46.8%) | 9 (13.0%) |
| 3 or more Vehicles | 18 (19.2%) | 15 (21.7%) |
| Total | 94 (100.0%) | 69 (100.0%) |
Real Estate & Mortgages in Beallsville
Real Estate and Mortgage Overview in Beallsville
| Characteristic | Without Mortgage | With Mortgage |
| Housing Units | 53 | 41 |
| Median Property Value | $88,800 | $113,300 |
| Median Household Income | $51,875 | $0 |
| Monthly Housing Costs | $357 | $0 |
| Real Estate Taxes | $621 | $2 |
Property Value by Mortgage Status in Beallsville
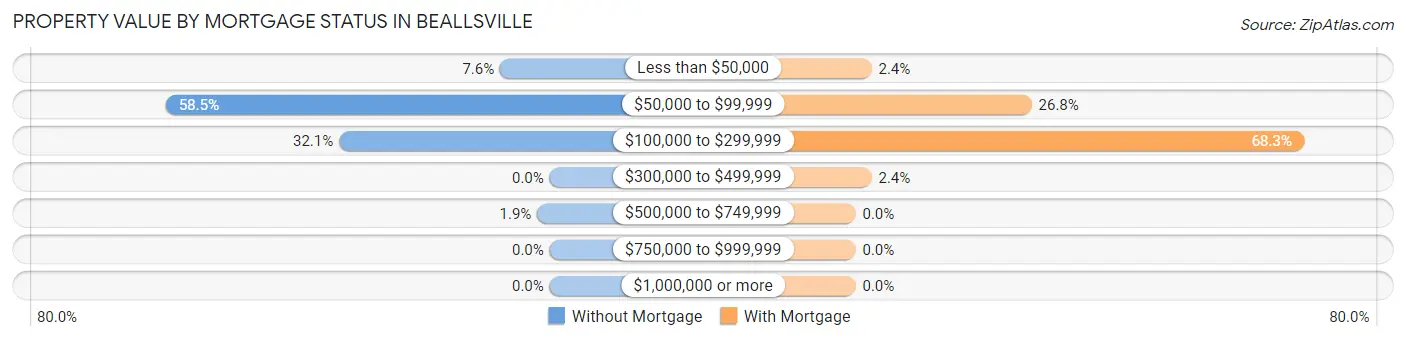
| Property Value | Without Mortgage | With Mortgage |
| Less than $50,000 | 4 (7.5%) | 1 (2.4%) |
| $50,000 to $99,999 | 31 (58.5%) | 11 (26.8%) |
| $100,000 to $299,999 | 17 (32.1%) | 28 (68.3%) |
| $300,000 to $499,999 | 0 (0.0%) | 1 (2.4%) |
| $500,000 to $749,999 | 1 (1.9%) | 0 (0.0%) |
| $750,000 to $999,999 | 0 (0.0%) | 0 (0.0%) |
| $1,000,000 or more | 0 (0.0%) | 0 (0.0%) |
| Total | 53 (100.0%) | 41 (100.0%) |
Household Income by Mortgage Status in Beallsville
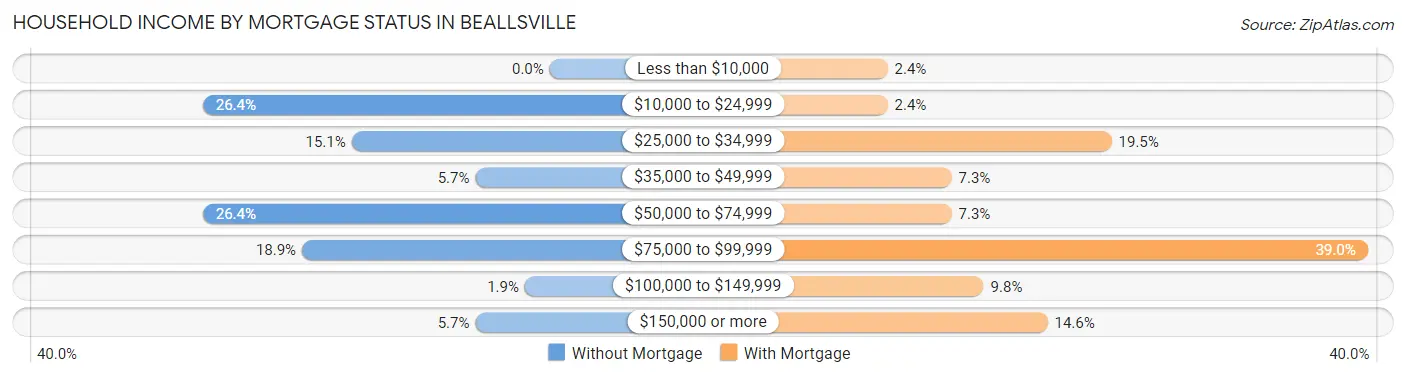
| Household Income | Without Mortgage | With Mortgage |
| Less than $10,000 | 0 (0.0%) | 1 (2.4%) |
| $10,000 to $24,999 | 14 (26.4%) | 1 (2.4%) |
| $25,000 to $34,999 | 8 (15.1%) | 8 (19.5%) |
| $35,000 to $49,999 | 3 (5.7%) | 3 (7.3%) |
| $50,000 to $74,999 | 14 (26.4%) | 3 (7.3%) |
| $75,000 to $99,999 | 10 (18.9%) | 16 (39.0%) |
| $100,000 to $149,999 | 1 (1.9%) | 4 (9.8%) |
| $150,000 or more | 3 (5.7%) | 6 (14.6%) |
| Total | 53 (100.0%) | 41 (100.0%) |
Property Value to Household Income Ratio in Beallsville
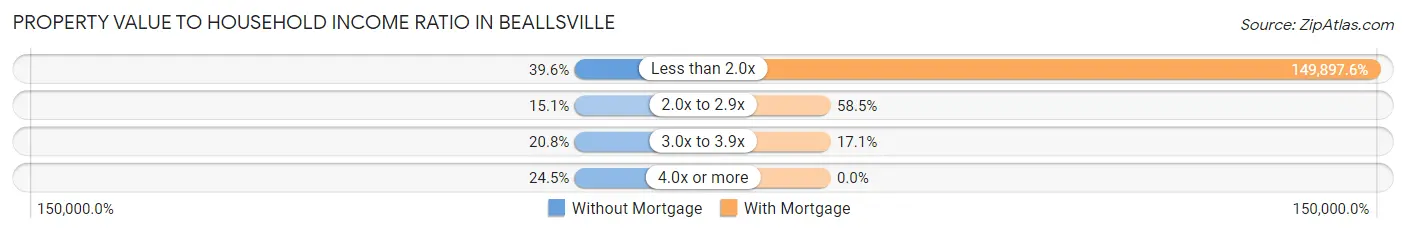
| Value-to-Income Ratio | Without Mortgage | With Mortgage |
| Less than 2.0x | 21 (39.6%) | 61,458 (149,897.6%) |
| 2.0x to 2.9x | 8 (15.1%) | 24 (58.5%) |
| 3.0x to 3.9x | 11 (20.7%) | 7 (17.1%) |
| 4.0x or more | 13 (24.5%) | 0 (0.0%) |
| Total | 53 (100.0%) | 41 (100.0%) |
Real Estate Taxes by Mortgage Status in Beallsville
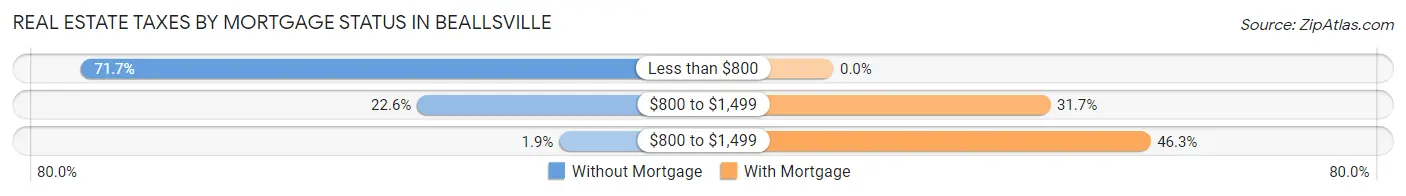
| Property Taxes | Without Mortgage | With Mortgage |
| Less than $800 | 38 (71.7%) | 0 (0.0%) |
| $800 to $1,499 | 12 (22.6%) | 13 (31.7%) |
| $800 to $1,499 | 1 (1.9%) | 19 (46.3%) |
| Total | 53 (100.0%) | 41 (100.0%) |
Health & Disability in Beallsville
Health Insurance Coverage by Age in Beallsville
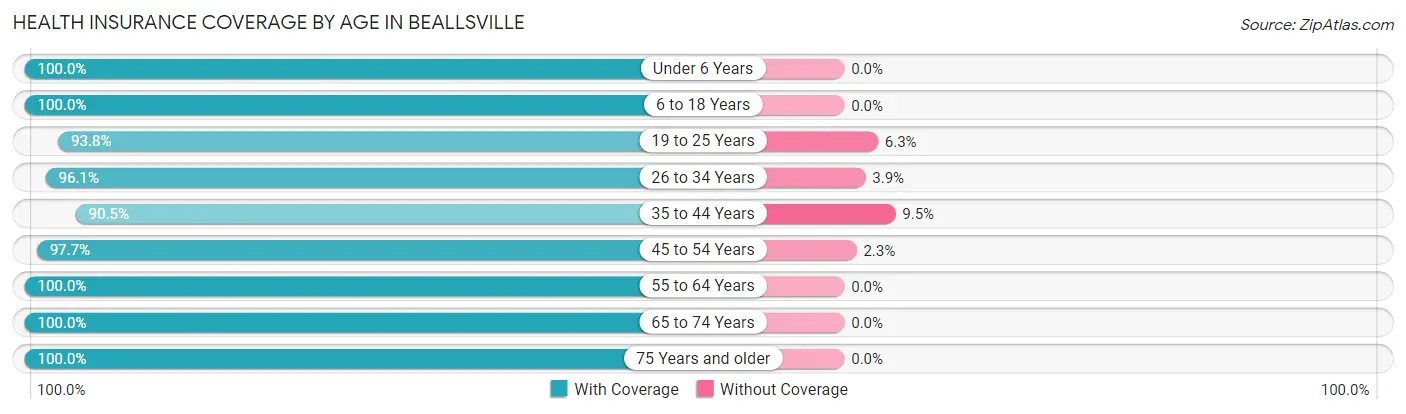
| Age Bracket | With Coverage | Without Coverage |
| Under 6 Years | 22 (100.0%) | 0 (0.0%) |
| 6 to 18 Years | 86 (100.0%) | 0 (0.0%) |
| 19 to 25 Years | 45 (93.8%) | 3 (6.2%) |
| 26 to 34 Years | 49 (96.1%) | 2 (3.9%) |
| 35 to 44 Years | 19 (90.5%) | 2 (9.5%) |
| 45 to 54 Years | 43 (97.7%) | 1 (2.3%) |
| 55 to 64 Years | 55 (100.0%) | 0 (0.0%) |
| 65 to 74 Years | 47 (100.0%) | 0 (0.0%) |
| 75 Years and older | 18 (100.0%) | 0 (0.0%) |
| Total | 384 (98.0%) | 8 (2.0%) |
Health Insurance Coverage by Citizenship Status in Beallsville
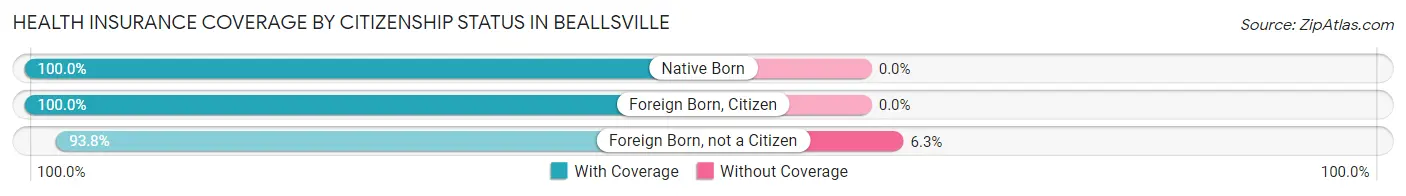
| Citizenship Status | With Coverage | Without Coverage |
| Native Born | 22 (100.0%) | 0 (0.0%) |
| Foreign Born, Citizen | 86 (100.0%) | 0 (0.0%) |
| Foreign Born, not a Citizen | 45 (93.8%) | 3 (6.2%) |
Health Insurance Coverage by Household Income in Beallsville
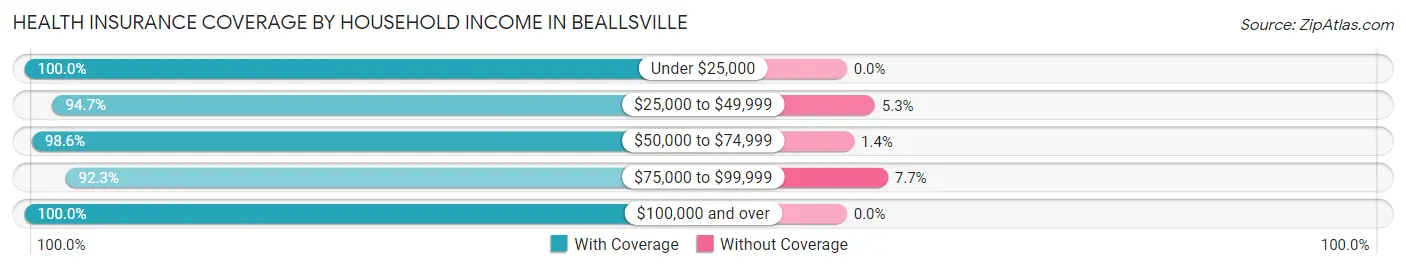
| Household Income | With Coverage | Without Coverage |
| Under $25,000 | 127 (100.0%) | 0 (0.0%) |
| $25,000 to $49,999 | 36 (94.7%) | 2 (5.3%) |
| $50,000 to $74,999 | 144 (98.6%) | 2 (1.4%) |
| $75,000 to $99,999 | 48 (92.3%) | 4 (7.7%) |
| $100,000 and over | 29 (100.0%) | 0 (0.0%) |
Public vs Private Health Insurance Coverage by Age in Beallsville
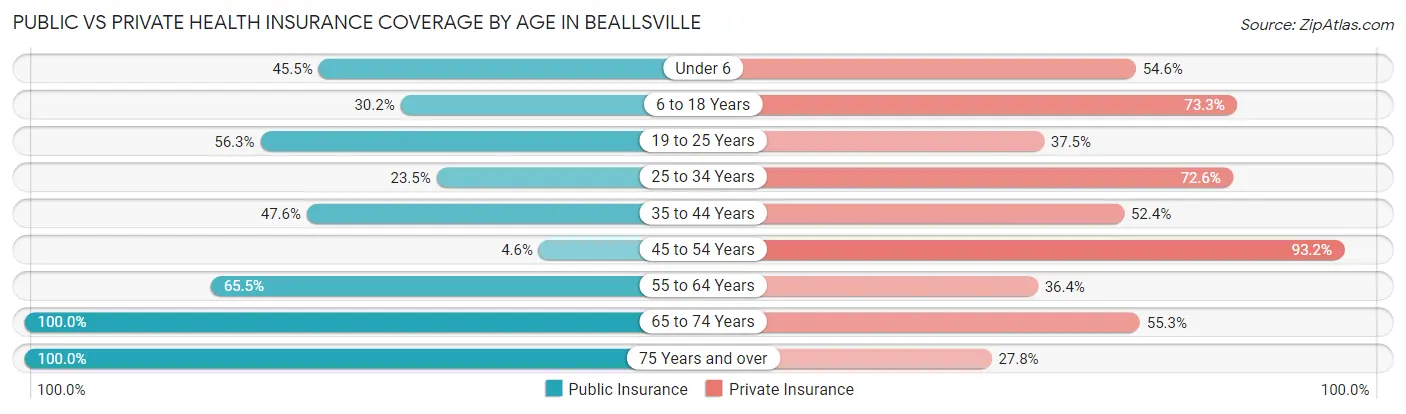
| Age Bracket | Public Insurance | Private Insurance |
| Under 6 | 10 (45.5%) | 12 (54.5%) |
| 6 to 18 Years | 26 (30.2%) | 63 (73.3%) |
| 19 to 25 Years | 27 (56.2%) | 18 (37.5%) |
| 25 to 34 Years | 12 (23.5%) | 37 (72.6%) |
| 35 to 44 Years | 10 (47.6%) | 11 (52.4%) |
| 45 to 54 Years | 2 (4.5%) | 41 (93.2%) |
| 55 to 64 Years | 36 (65.4%) | 20 (36.4%) |
| 65 to 74 Years | 47 (100.0%) | 26 (55.3%) |
| 75 Years and over | 18 (100.0%) | 5 (27.8%) |
| Total | 188 (48.0%) | 233 (59.4%) |
Disability Status by Sex by Age in Beallsville
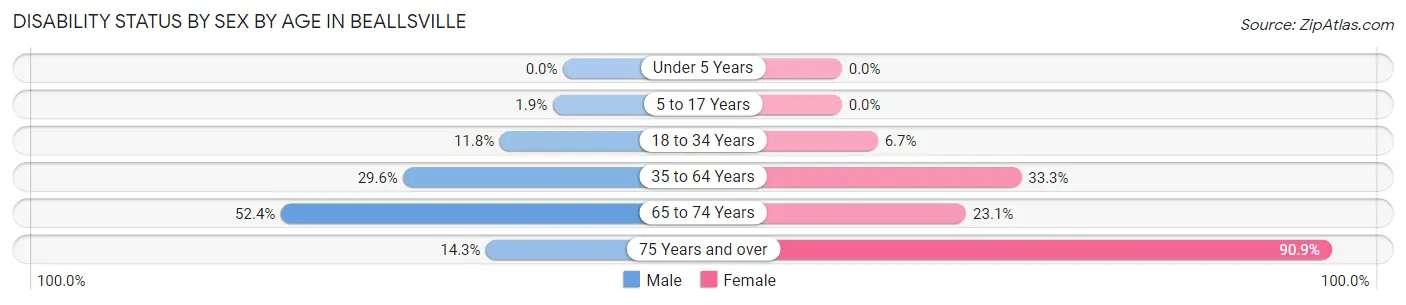
| Age Bracket | Male | Female |
| Under 5 Years | 0 (0.0%) | 0 (0.0%) |
| 5 to 17 Years | 1 (1.9%) | 0 (0.0%) |
| 18 to 34 Years | 6 (11.8%) | 4 (6.7%) |
| 35 to 64 Years | 16 (29.6%) | 22 (33.3%) |
| 65 to 74 Years | 11 (52.4%) | 6 (23.1%) |
| 75 Years and over | 1 (14.3%) | 10 (90.9%) |
Disability Class by Sex by Age in Beallsville
Disability Class: Hearing Difficulty
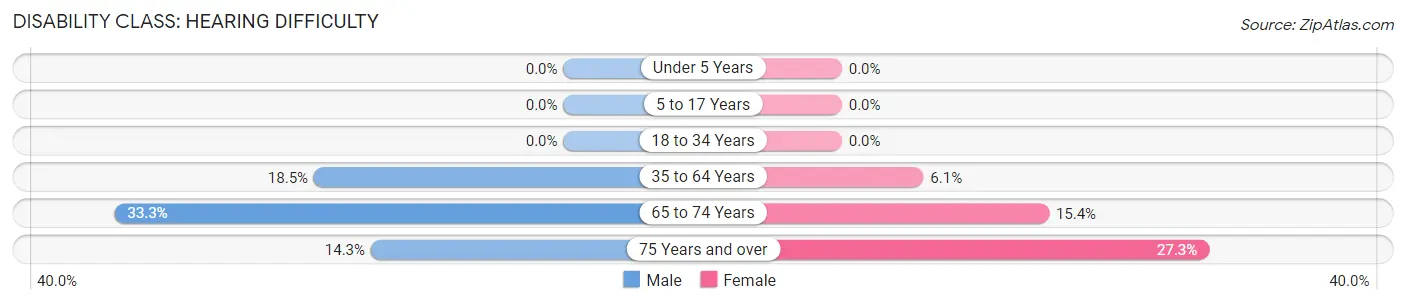
| Age Bracket | Male | Female |
| Under 5 Years | 0 (0.0%) | 0 (0.0%) |
| 5 to 17 Years | 0 (0.0%) | 0 (0.0%) |
| 18 to 34 Years | 0 (0.0%) | 0 (0.0%) |
| 35 to 64 Years | 10 (18.5%) | 4 (6.1%) |
| 65 to 74 Years | 7 (33.3%) | 4 (15.4%) |
| 75 Years and over | 1 (14.3%) | 3 (27.3%) |
Disability Class: Vision Difficulty
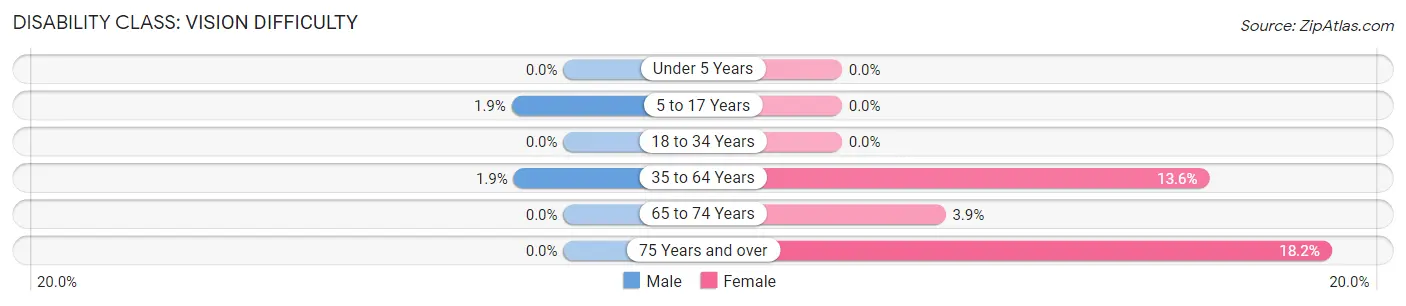
| Age Bracket | Male | Female |
| Under 5 Years | 0 (0.0%) | 0 (0.0%) |
| 5 to 17 Years | 1 (1.9%) | 0 (0.0%) |
| 18 to 34 Years | 0 (0.0%) | 0 (0.0%) |
| 35 to 64 Years | 1 (1.8%) | 9 (13.6%) |
| 65 to 74 Years | 0 (0.0%) | 1 (3.8%) |
| 75 Years and over | 0 (0.0%) | 2 (18.2%) |
Disability Class: Cognitive Difficulty
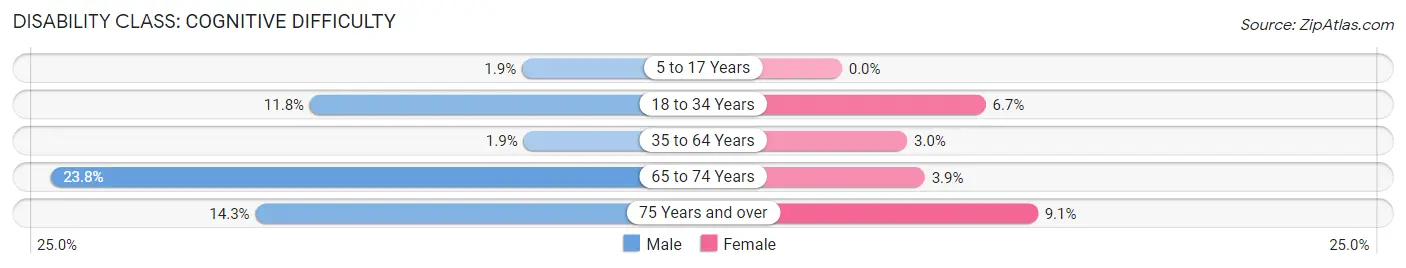
| Age Bracket | Male | Female |
| 5 to 17 Years | 1 (1.9%) | 0 (0.0%) |
| 18 to 34 Years | 6 (11.8%) | 4 (6.7%) |
| 35 to 64 Years | 1 (1.8%) | 2 (3.0%) |
| 65 to 74 Years | 5 (23.8%) | 1 (3.8%) |
| 75 Years and over | 1 (14.3%) | 1 (9.1%) |
Disability Class: Ambulatory Difficulty
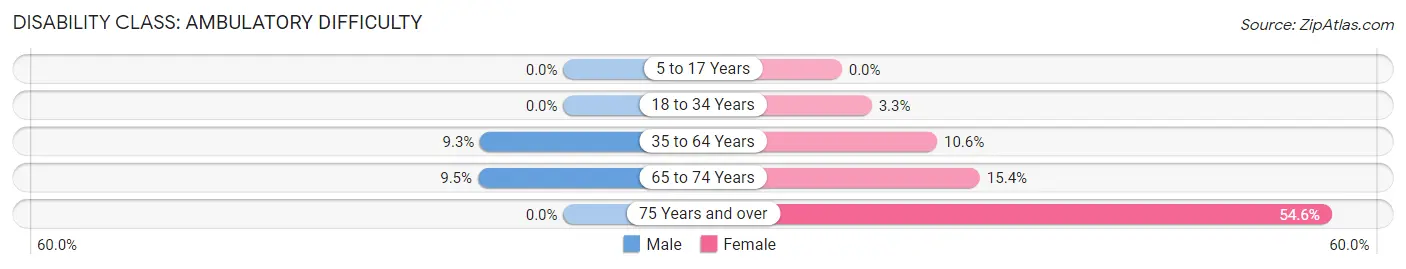
| Age Bracket | Male | Female |
| 5 to 17 Years | 0 (0.0%) | 0 (0.0%) |
| 18 to 34 Years | 0 (0.0%) | 2 (3.3%) |
| 35 to 64 Years | 5 (9.3%) | 7 (10.6%) |
| 65 to 74 Years | 2 (9.5%) | 4 (15.4%) |
| 75 Years and over | 0 (0.0%) | 6 (54.5%) |
Disability Class: Self-Care Difficulty
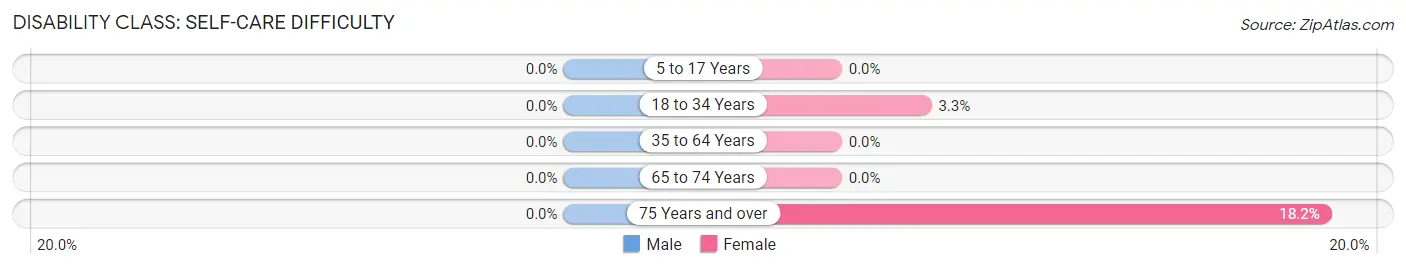
| Age Bracket | Male | Female |
| 5 to 17 Years | 0 (0.0%) | 0 (0.0%) |
| 18 to 34 Years | 0 (0.0%) | 2 (3.3%) |
| 35 to 64 Years | 0 (0.0%) | 0 (0.0%) |
| 65 to 74 Years | 0 (0.0%) | 0 (0.0%) |
| 75 Years and over | 0 (0.0%) | 2 (18.2%) |
Technology Access in Beallsville
Computing Device Access in Beallsville
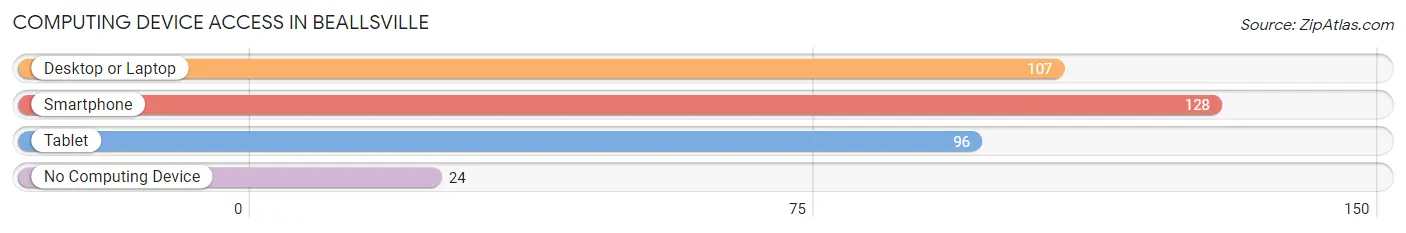
| Device Type | # Households | % Households |
| Desktop or Laptop | 107 | 65.6% |
| Smartphone | 128 | 78.5% |
| Tablet | 96 | 58.9% |
| No Computing Device | 24 | 14.7% |
| Total | 163 | 100.0% |
Internet Access in Beallsville
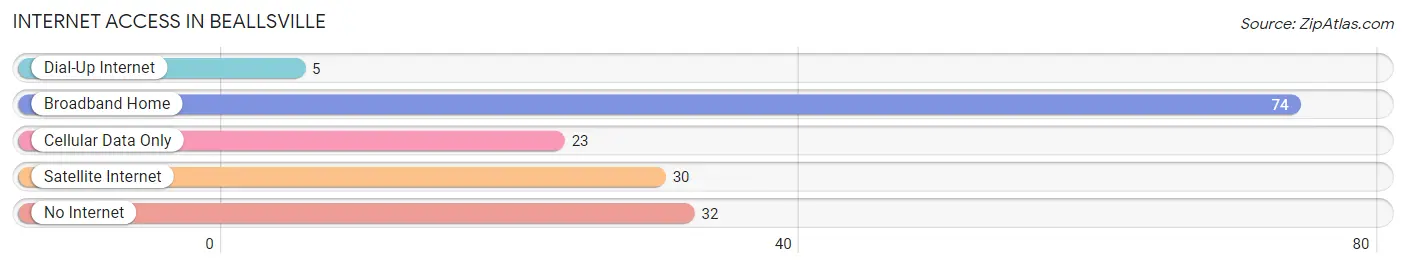
| Internet Type | # Households | % Households |
| Dial-Up Internet | 5 | 3.1% |
| Broadband Home | 74 | 45.4% |
| Cellular Data Only | 23 | 14.1% |
| Satellite Internet | 30 | 18.4% |
| No Internet | 32 | 19.6% |
| Total | 163 | 100.0% |
Beallsville Summary
Beallsville, Ohio is a small village located in Monroe County, Ohio. It is situated along the Ohio River, approximately 30 miles south of Marietta. The village has a population of approximately 500 people and is part of the Marietta-Belpre Metropolitan Statistical Area.
History
Beallsville was founded in 1817 by William Beall, a Revolutionary War veteran. Beall purchased the land from the United States government and named the village after himself. The village was incorporated in 1837 and has remained a small, rural community ever since.
The village was an important stop on the Underground Railroad, with many slaves escaping to freedom in Canada. The village was also home to a number of prominent abolitionists, including John Rankin and Levi Coffin.
Geography
Beallsville is located in the Appalachian Plateau region of Ohio. The village is situated along the Ohio River, approximately 30 miles south of Marietta. The village is surrounded by rolling hills and forests, with the Ohio River providing a scenic backdrop.
The village is located in the Appalachian Plateau region of Ohio, which is characterized by its rugged terrain and steep hills. The village is located in the Appalachian Plateau region of Ohio, which is characterized by its rugged terrain and steep hills.
Economy
Beallsville’s economy is largely based on agriculture and tourism. The village is home to a number of small farms, which produce a variety of crops, including corn, soybeans, and wheat. The village is also home to a number of small businesses, including restaurants, shops, and a bed and breakfast.
The village is also a popular tourist destination, with many visitors coming to enjoy the scenic views of the Ohio River and the surrounding hills. The village is home to a number of historic sites, including the Rankin House, which was a stop on the Underground Railroad.
Demographics
As of the 2010 census, Beallsville had a population of 498 people. The racial makeup of the village was 97.2% White, 0.6% African American, 0.2% Native American, 0.2% Asian, 0.2% from other races, and 1.8% from two or more races. Hispanic or Latino of any race were 0.6% of the population.
The median income for a household in the village was $37,500, and the median income for a family was $41,250. The per capita income for the village was $17,845. About 11.2% of families and 13.2% of the population were below the poverty line, including 16.7% of those under age 18 and 8.3% of those age 65 or over.
Beallsville is a small, rural village with a rich history and a strong sense of community. The village is home to a number of small businesses and farms, and is a popular tourist destination. The village is also home to a number of historic sites, including the Rankin House, which was a stop on the Underground Railroad. The village has a population of approximately 500 people and is part of the Marietta-Belpre Metropolitan Statistical Area.
Common Questions
What is Per Capita Income in Beallsville?
Per Capita income in Beallsville is $20,080.
What is the Median Family Income in Beallsville?
Median Family Income in Beallsville is $54,583.
What is the Median Household income in Beallsville?
Median Household Income in Beallsville is $33,125.
What is Income or Wage Gap in Beallsville?
Income or Wage Gap in Beallsville is 31.7%.
Women in Beallsville earn 68.3 cents for every dollar earned by a man.
What is Inequality or Gini Index in Beallsville?
Inequality or Gini Index in Beallsville is 0.41.
What is the Total Population of Beallsville?
Total Population of Beallsville is 392.
What is the Total Male Population of Beallsville?
Total Male Population of Beallsville is 201.
What is the Total Female Population of Beallsville?
Total Female Population of Beallsville is 191.
What is the Ratio of Males per 100 Females in Beallsville?
There are 105.24 Males per 100 Females in Beallsville.
What is the Ratio of Females per 100 Males in Beallsville?
There are 95.02 Females per 100 Males in Beallsville.
What is the Median Population Age in Beallsville?
Median Population Age in Beallsville is 34.6 Years.
What is the Average Family Size in Beallsville
Average Family Size in Beallsville is 2.9 People.
What is the Average Household Size in Beallsville
Average Household Size in Beallsville is 2.4 People.
How Large is the Labor Force in Beallsville?
There are 155 People in the Labor Forcein in Beallsville.
What is the Percentage of People in the Labor Force in Beallsville?
51.0% of People are in the Labor Force in Beallsville.
What is the Unemployment Rate in Beallsville?
Unemployment Rate in Beallsville is 4.5%.