Barnesville, OH Map & Demographics
Barnesville Map
Barnesville Overview
$25,856
PER CAPITA INCOME
$64,005
AVG FAMILY INCOME
$59,265
AVG HOUSEHOLD INCOME
66.3%
WAGE / INCOME GAP [ % ]
33.7¢/ $1
WAGE / INCOME GAP [ $ ]
0.42
INEQUALITY / GINI INDEX
3,713
TOTAL POPULATION
1,727
MALE POPULATION
1,986
FEMALE POPULATION
86.96
MALES / 100 FEMALES
115.00
FEMALES / 100 MALES
41.6
MEDIAN AGE
3.4
AVG FAMILY SIZE
2.5
AVG HOUSEHOLD SIZE
1,666
LABOR FORCE [ PEOPLE ]
56.3%
PERCENT IN LABOR FORCE
2.5%
UNEMPLOYMENT RATE
Barnesville Zip Codes
Barnesville Area Codes
Income in Barnesville
Income Overview in Barnesville
Per Capita Income in Barnesville is $25,856, while median incomes of families and households are $64,005 and $59,265 respectively.
| Characteristic | Number | Measure |
| Per Capita Income | 3,713 | $25,856 |
| Median Family Income | 833 | $64,005 |
| Mean Family Income | 833 | $68,835 |
| Median Household Income | 1,440 | $59,265 |
| Mean Household Income | 1,440 | $59,650 |
| Income Deficit | 833 | $0 |
| Wage / Income Gap (%) | 3,713 | 66.30% |
| Wage / Income Gap ($) | 3,713 | 33.70¢ per $1 |
| Gini / Inequality Index | 3,713 | 0.42 |
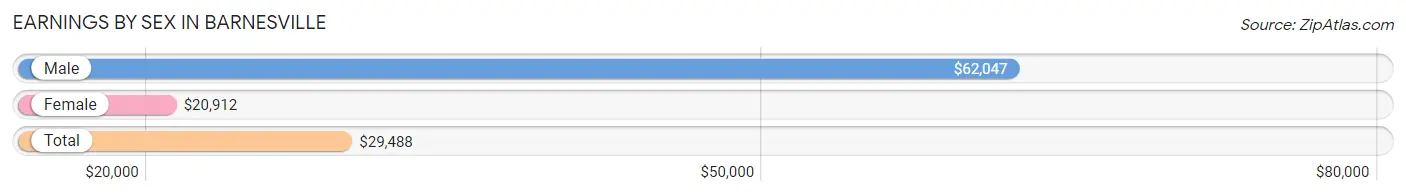
Earnings by Sex in Barnesville
Average Earnings in Barnesville are $29,488, $62,047 for men and $20,912 for women, a difference of 66.3%.
| Sex | Number | Average Earnings |
| Male | 853 (48.4%) | $62,047 |
| Female | 910 (51.6%) | $20,912 |
| Total | 1,763 (100.0%) | $29,488 |
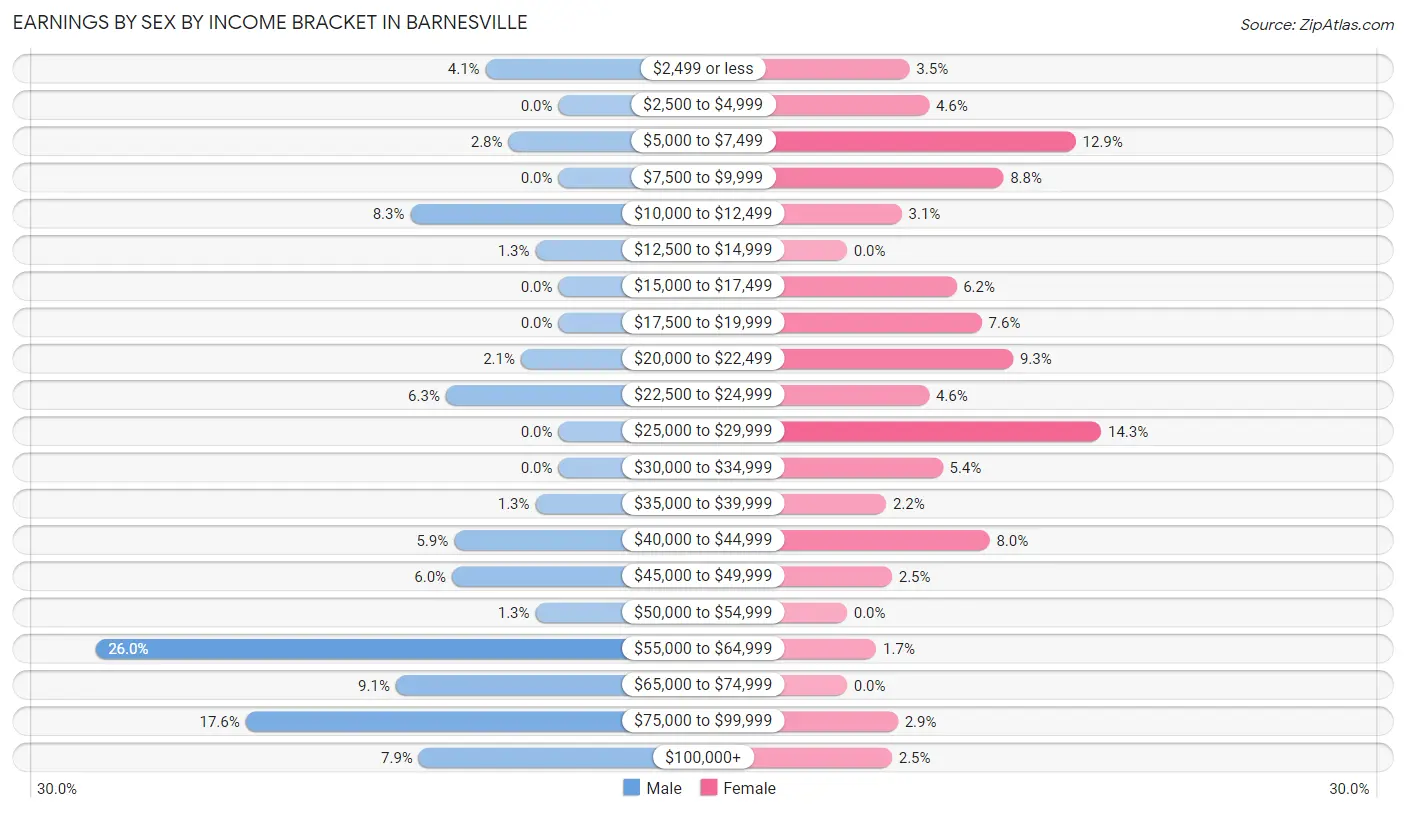
Earnings by Sex by Income Bracket in Barnesville
The most common earnings brackets in Barnesville are $55,000 to $64,999 for men (222 | 26.0%) and $25,000 to $29,999 for women (130 | 14.3%).
| Income | Male | Female |
| $2,499 or less | 35 (4.1%) | 32 (3.5%) |
| $2,500 to $4,999 | 0 (0.0%) | 42 (4.6%) |
| $5,000 to $7,499 | 24 (2.8%) | 117 (12.9%) |
| $7,500 to $9,999 | 0 (0.0%) | 80 (8.8%) |
| $10,000 to $12,499 | 71 (8.3%) | 28 (3.1%) |
| $12,500 to $14,999 | 11 (1.3%) | 0 (0.0%) |
| $15,000 to $17,499 | 0 (0.0%) | 56 (6.1%) |
| $17,500 to $19,999 | 0 (0.0%) | 69 (7.6%) |
| $20,000 to $22,499 | 18 (2.1%) | 85 (9.3%) |
| $22,500 to $24,999 | 54 (6.3%) | 42 (4.6%) |
| $25,000 to $29,999 | 0 (0.0%) | 130 (14.3%) |
| $30,000 to $34,999 | 0 (0.0%) | 49 (5.4%) |
| $35,000 to $39,999 | 11 (1.3%) | 20 (2.2%) |
| $40,000 to $44,999 | 50 (5.9%) | 73 (8.0%) |
| $45,000 to $49,999 | 51 (6.0%) | 23 (2.5%) |
| $50,000 to $54,999 | 11 (1.3%) | 0 (0.0%) |
| $55,000 to $64,999 | 222 (26.0%) | 15 (1.7%) |
| $65,000 to $74,999 | 78 (9.1%) | 0 (0.0%) |
| $75,000 to $99,999 | 150 (17.6%) | 26 (2.9%) |
| $100,000+ | 67 (7.9%) | 23 (2.5%) |
| Total | 853 (100.0%) | 910 (100.0%) |
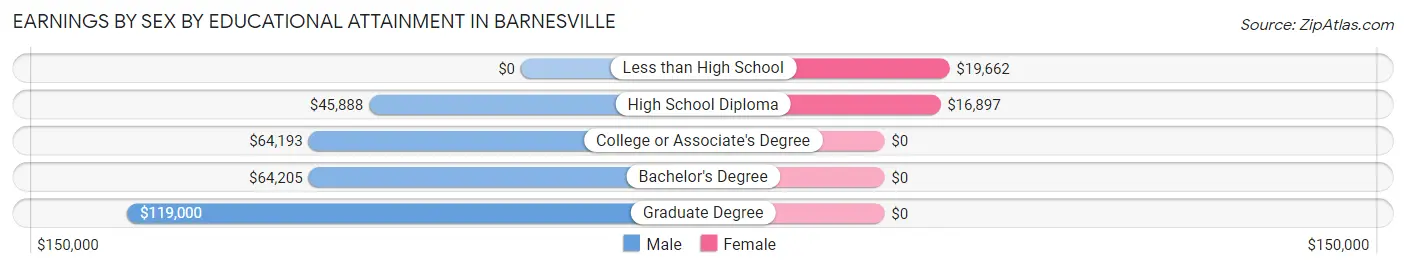
Earnings by Sex by Educational Attainment in Barnesville
Average earnings in Barnesville are $63,079 for men and $21,632 for women, a difference of 65.7%. Men with an educational attainment of graduate degree enjoy the highest average annual earnings of $119,000, while those with high school diploma education earn the least with $45,888. Women with an educational attainment of less than high school earn the most with the average annual earnings of $19,662, while those with high school diploma education have the smallest earnings of $16,897.
| Educational Attainment | Male Income | Female Income |
| Less than High School | - | - |
| High School Diploma | $45,888 | $16,897 |
| College or Associate's Degree | $64,193 | $0 |
| Bachelor's Degree | $64,205 | $0 |
| Graduate Degree | $119,000 | $0 |
| Total | $63,079 | $21,632 |
Family Income in Barnesville
Family Income Brackets in Barnesville
According to the Barnesville family income data, there are 202 families falling into the $50,000 to $74,999 income range, which is the most common income bracket and makes up 24.2% of all families.
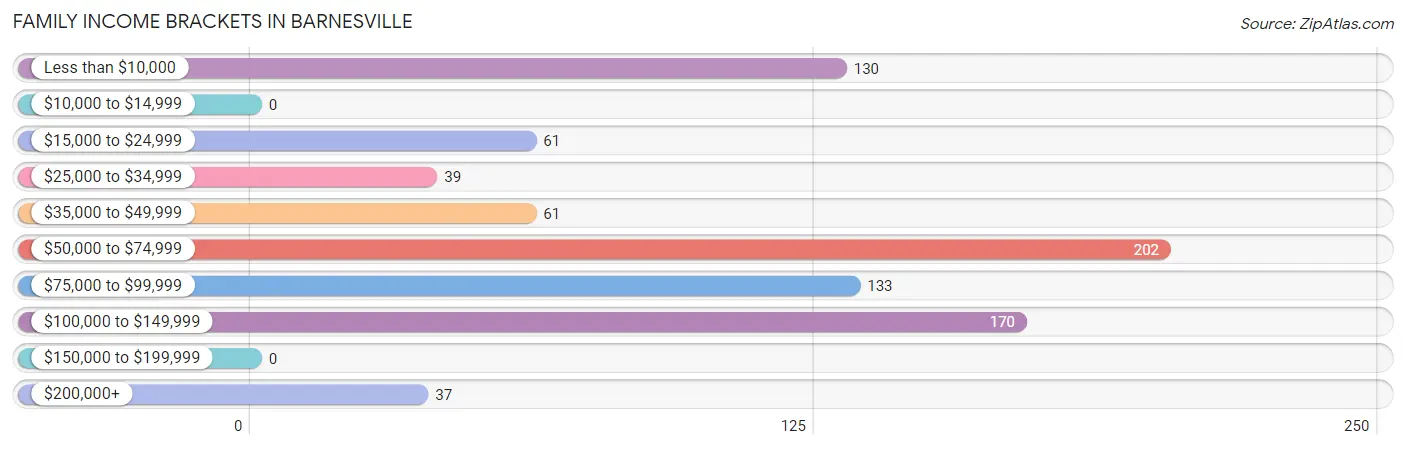
| Income Bracket | # Families | % Families |
| Less than $10,000 | 130 | 15.6% |
| $10,000 to $14,999 | 0 | 0.0% |
| $15,000 to $24,999 | 61 | 7.3% |
| $25,000 to $34,999 | 39 | 4.7% |
| $35,000 to $49,999 | 61 | 7.3% |
| $50,000 to $74,999 | 202 | 24.2% |
| $75,000 to $99,999 | 133 | 16.0% |
| $100,000 to $149,999 | 170 | 20.4% |
| $150,000 to $199,999 | 0 | 0.0% |
| $200,000+ | 37 | 4.4% |
Family Income by Famaliy Size in Barnesville
3-person families (207 | 24.8%) account for the highest median family income in Barnesville with $79,205 per family, while 2-person families (371 | 44.5%) have the highest median income of $31,287 per family member.
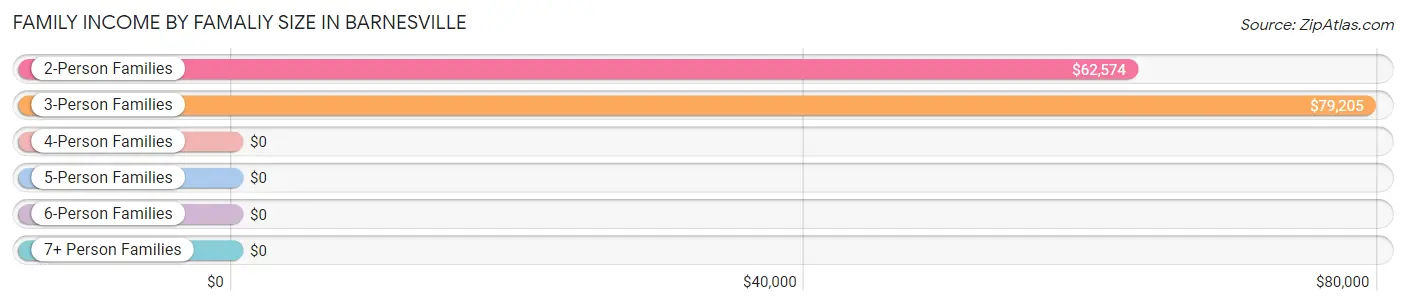
| Income Bracket | # Families | Median Income |
| 2-Person Families | 371 (44.5%) | $62,574 |
| 3-Person Families | 207 (24.8%) | $79,205 |
| 4-Person Families | 123 (14.8%) | $0 |
| 5-Person Families | 46 (5.5%) | $0 |
| 6-Person Families | 61 (7.3%) | $0 |
| 7+ Person Families | 25 (3.0%) | $0 |
| Total | 833 (100.0%) | $64,005 |
Family Income by Number of Earners in Barnesville
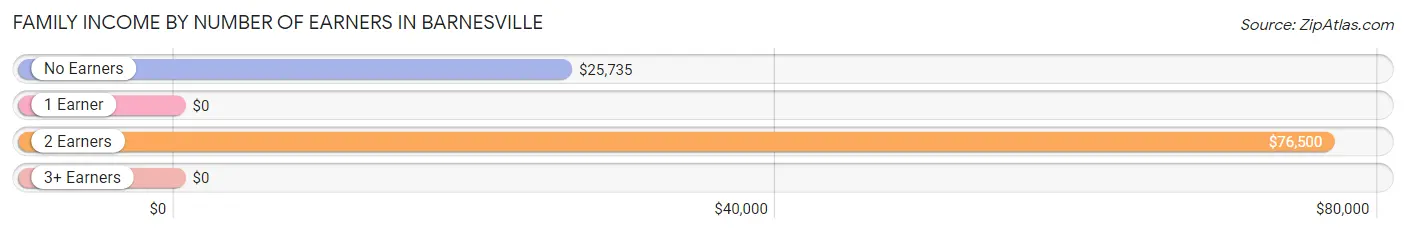
| Number of Earners | # Families | Median Income |
| No Earners | 148 (17.8%) | $25,735 |
| 1 Earner | 305 (36.6%) | $0 |
| 2 Earners | 294 (35.3%) | $76,500 |
| 3+ Earners | 86 (10.3%) | $0 |
| Total | 833 (100.0%) | $64,005 |
Household Income in Barnesville
Household Income Brackets in Barnesville
With 356 households falling in the category, the $50,000 to $74,999 income range is the most frequent in Barnesville, accounting for 24.7% of all households. In contrast, only 17 households (1.2%) fall into the $150,000 to $199,999 income bracket, making it the least populous group.
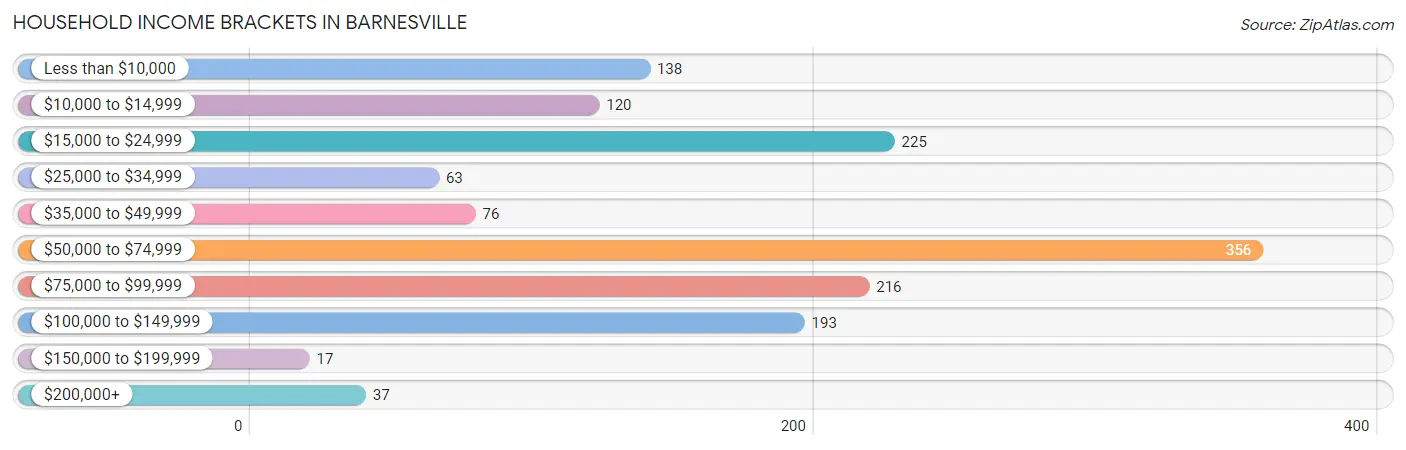
| Income Bracket | # Households | % Households |
| Less than $10,000 | 138 | 9.6% |
| $10,000 to $14,999 | 120 | 8.3% |
| $15,000 to $24,999 | 225 | 15.6% |
| $25,000 to $34,999 | 63 | 4.4% |
| $35,000 to $49,999 | 76 | 5.3% |
| $50,000 to $74,999 | 356 | 24.7% |
| $75,000 to $99,999 | 216 | 15.0% |
| $100,000 to $149,999 | 193 | 13.4% |
| $150,000 to $199,999 | 17 | 1.2% |
| $200,000+ | 37 | 2.6% |
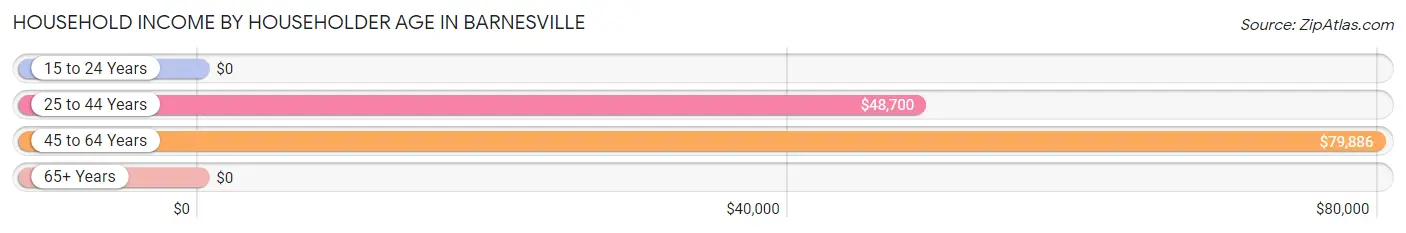
Household Income by Householder Age in Barnesville
The median household income in Barnesville is $59,265, with the highest median household income of $79,886 found in the 45 to 64 years age bracket for the primary householder. A total of 521 households (36.2%) fall into this category.
| Income Bracket | # Households | Median Income |
| 15 to 24 Years | 0 (0.0%) | $0 |
| 25 to 44 Years | 416 (28.9%) | $48,700 |
| 45 to 64 Years | 521 (36.2%) | $79,886 |
| 65+ Years | 503 (34.9%) | $0 |
| Total | 1,440 (100.0%) | $59,265 |
Poverty in Barnesville
Income Below Poverty by Sex and Age in Barnesville
With 15.7% poverty level for males and 22.6% for females among the residents of Barnesville, 16 and 17 year old males and 15 year old females are the most vulnerable to poverty, with 71 males (55.5%) and 36 females (100.0%) in their respective age groups living below the poverty level.
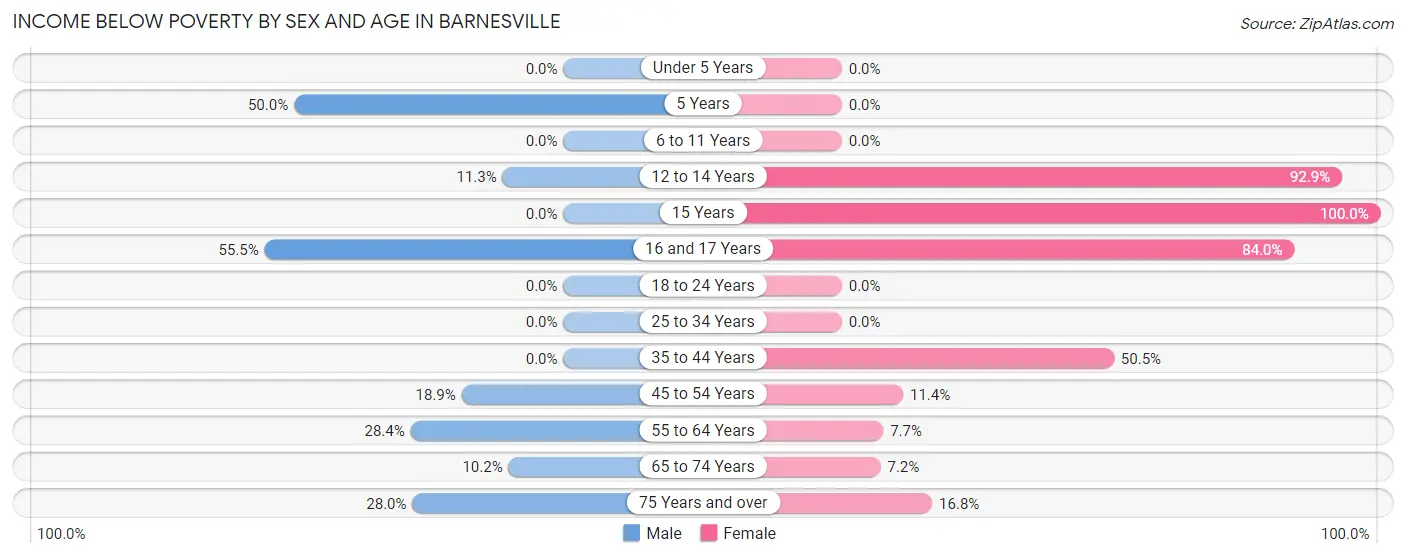
| Age Bracket | Male | Female |
| Under 5 Years | 0 (0.0%) | 0 (0.0%) |
| 5 Years | 18 (50.0%) | 0 (0.0%) |
| 6 to 11 Years | 0 (0.0%) | 0 (0.0%) |
| 12 to 14 Years | 14 (11.3%) | 104 (92.9%) |
| 15 Years | 0 (0.0%) | 36 (100.0%) |
| 16 and 17 Years | 71 (55.5%) | 42 (84.0%) |
| 18 to 24 Years | 0 (0.0%) | 0 (0.0%) |
| 25 to 34 Years | 0 (0.0%) | 0 (0.0%) |
| 35 to 44 Years | 0 (0.0%) | 148 (50.5%) |
| 45 to 54 Years | 48 (18.9%) | 34 (11.4%) |
| 55 to 64 Years | 61 (28.4%) | 18 (7.7%) |
| 65 to 74 Years | 17 (10.2%) | 12 (7.2%) |
| 75 Years and over | 37 (28.0%) | 27 (16.8%) |
| Total | 266 (15.7%) | 421 (22.6%) |
Income Above Poverty by Sex and Age in Barnesville
According to the poverty statistics in Barnesville, males aged under 5 years and females aged under 5 years are the age groups that are most secure financially, with 100.0% of males and 100.0% of females in these age groups living above the poverty line.
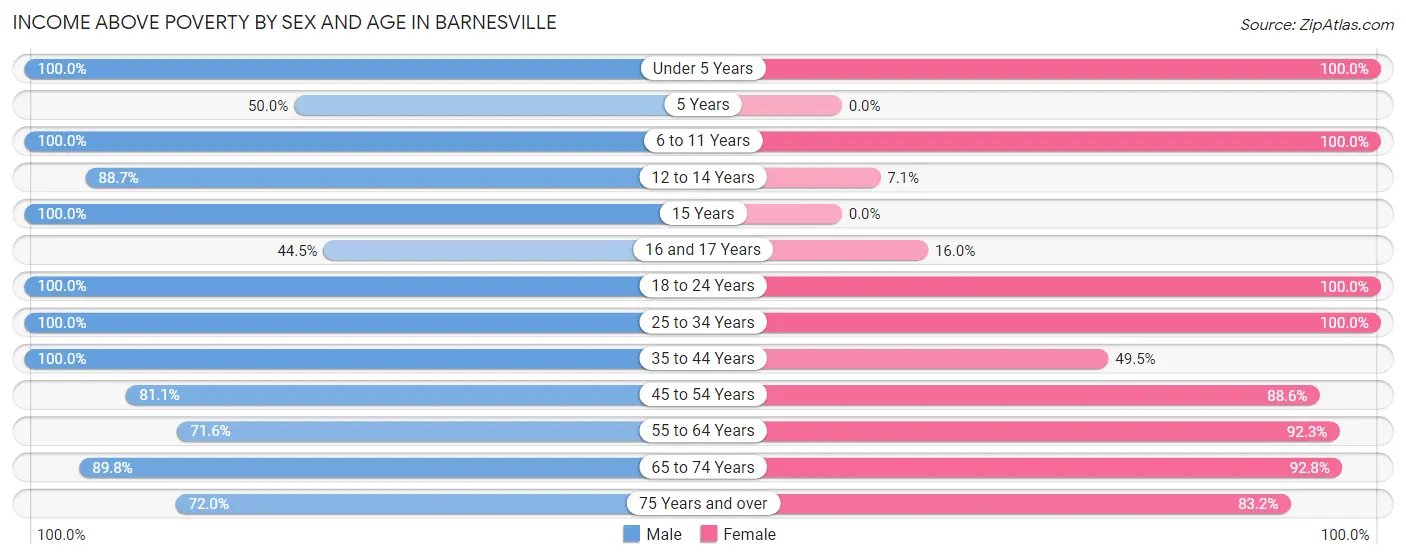
| Age Bracket | Male | Female |
| Under 5 Years | 90 (100.0%) | 106 (100.0%) |
| 5 Years | 18 (50.0%) | 0 (0.0%) |
| 6 to 11 Years | 96 (100.0%) | 119 (100.0%) |
| 12 to 14 Years | 110 (88.7%) | 8 (7.1%) |
| 15 Years | 35 (100.0%) | 0 (0.0%) |
| 16 and 17 Years | 57 (44.5%) | 8 (16.0%) |
| 18 to 24 Years | 51 (100.0%) | 164 (100.0%) |
| 25 to 34 Years | 245 (100.0%) | 125 (100.0%) |
| 35 to 44 Years | 127 (100.0%) | 145 (49.5%) |
| 45 to 54 Years | 206 (81.1%) | 265 (88.6%) |
| 55 to 64 Years | 154 (71.6%) | 216 (92.3%) |
| 65 to 74 Years | 150 (89.8%) | 155 (92.8%) |
| 75 Years and over | 95 (72.0%) | 134 (83.2%) |
| Total | 1,434 (84.4%) | 1,445 (77.4%) |
Income Below Poverty Among Married-Couple Families in Barnesville
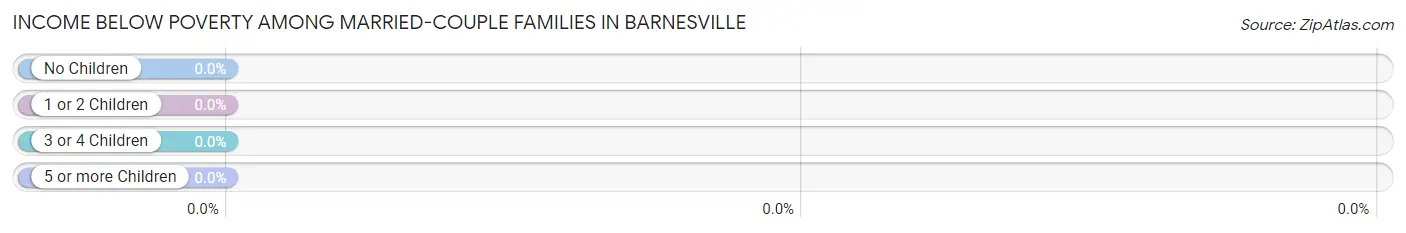
| Children | Above Poverty | Below Poverty |
| No Children | 292 (100.0%) | 0 (0.0%) |
| 1 or 2 Children | 131 (100.0%) | 0 (0.0%) |
| 3 or 4 Children | 108 (100.0%) | 0 (0.0%) |
| 5 or more Children | 0 (0.0%) | 0 (0.0%) |
| Total | 531 (100.0%) | 0 (0.0%) |
Income Below Poverty Among Single-Parent Households in Barnesville
According to the poverty data in Barnesville, 20.4% or 9 single-father households and 57.4% or 148 single-mother households are living below the poverty line. Among single-father households, those with no children have the highest poverty rate, with 9 households (39.1%) experiencing poverty. Likewise, among single-mother households, those with 3 or 4 children have the highest poverty rate, with 60 households (100.0%) falling below the poverty line.
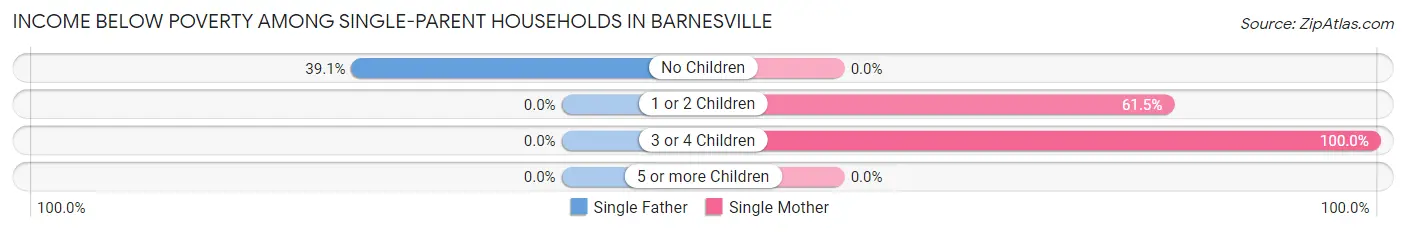
| Children | Single Father | Single Mother |
| No Children | 9 (39.1%) | 0 (0.0%) |
| 1 or 2 Children | 0 (0.0%) | 88 (61.5%) |
| 3 or 4 Children | 0 (0.0%) | 60 (100.0%) |
| 5 or more Children | 0 (0.0%) | 0 (0.0%) |
| Total | 9 (20.4%) | 148 (57.4%) |
Income Below Poverty Among Married-Couple vs Single-Parent Households in Barnesville
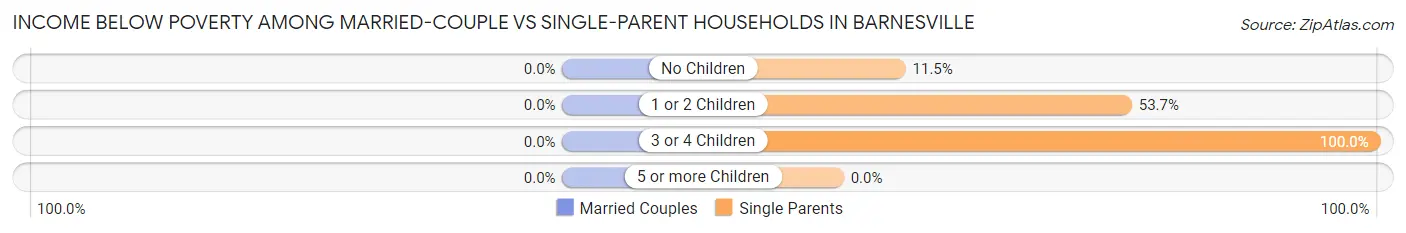
| Children | Married-Couple Families | Single-Parent Households |
| No Children | 0 (0.0%) | 9 (11.5%) |
| 1 or 2 Children | 0 (0.0%) | 88 (53.7%) |
| 3 or 4 Children | 0 (0.0%) | 60 (100.0%) |
| 5 or more Children | 0 (0.0%) | 0 (0.0%) |
| Total | 0 (0.0%) | 157 (52.0%) |
Race in Barnesville
The most populous races in Barnesville are White / Caucasian (3,390 | 91.3%), Two or more Races (187 | 5.0%), and Asian (121 | 3.3%).
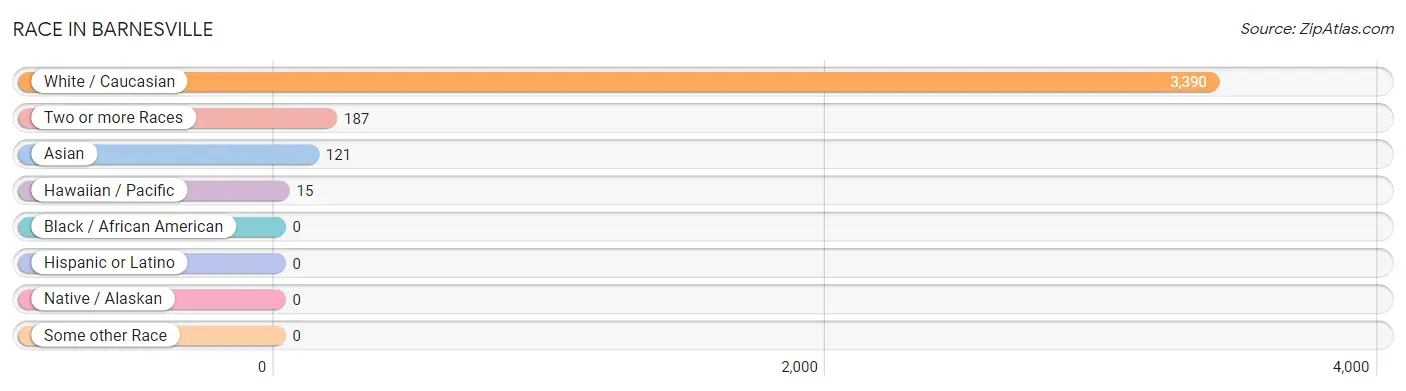
| Race | # Population | % Population |
| Asian | 121 | 3.3% |
| Black / African American | 0 | 0.0% |
| Hawaiian / Pacific | 15 | 0.4% |
| Hispanic or Latino | 0 | 0.0% |
| Native / Alaskan | 0 | 0.0% |
| White / Caucasian | 3,390 | 91.3% |
| Two or more Races | 187 | 5.0% |
| Some other Race | 0 | 0.0% |
| Total | 3,713 | 100.0% |
Ancestry in Barnesville
The most populous ancestries reported in Barnesville are German (527 | 14.2%), Irish (241 | 6.5%), American (215 | 5.8%), English (209 | 5.6%), and Polish (148 | 4.0%), together accounting for 36.1% of all Barnesville residents.
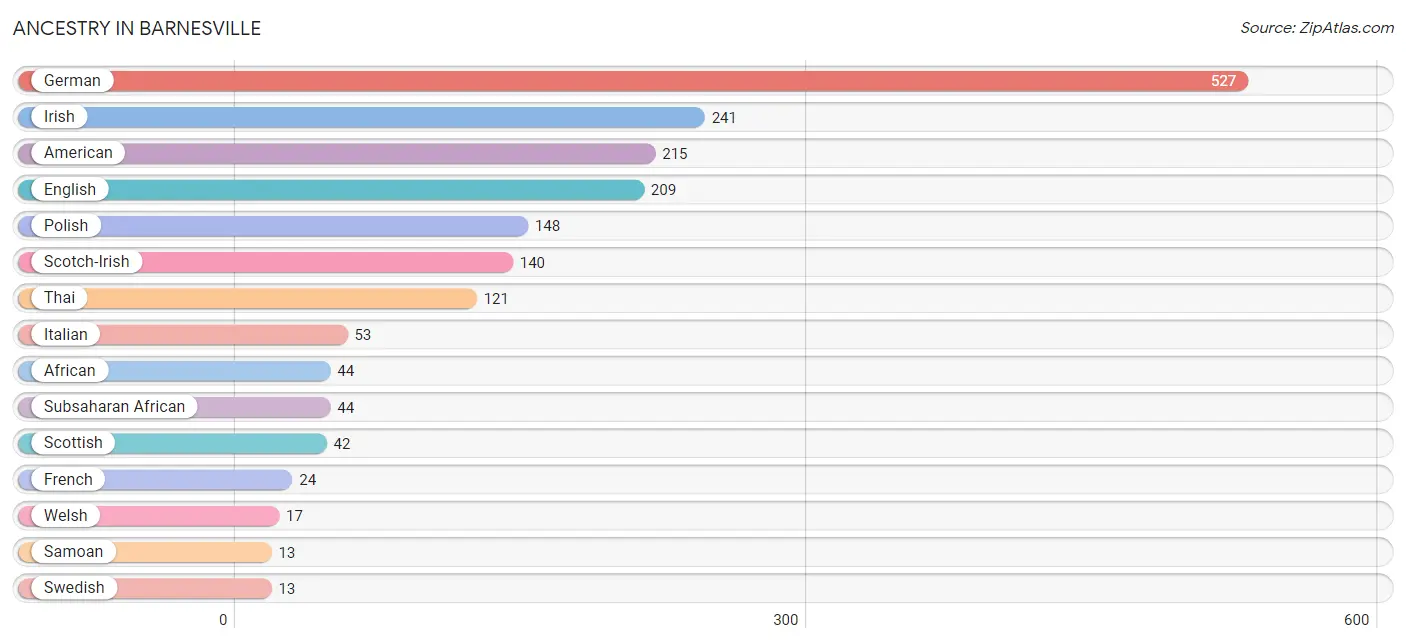
| Ancestry | # Population | % Population |
| African | 44 | 1.2% |
| American | 215 | 5.8% |
| English | 209 | 5.6% |
| French | 24 | 0.6% |
| German | 527 | 14.2% |
| Hungarian | 6 | 0.2% |
| Irish | 241 | 6.5% |
| Italian | 53 | 1.4% |
| Native Hawaiian | 2 | 0.1% |
| Polish | 148 | 4.0% |
| Samoan | 13 | 0.4% |
| Scotch-Irish | 140 | 3.8% |
| Scottish | 42 | 1.1% |
| Subsaharan African | 44 | 1.2% |
| Swedish | 13 | 0.4% |
| Thai | 121 | 3.3% |
| Welsh | 17 | 0.5% | View All 17 Rows |
Immigrants in Barnesville
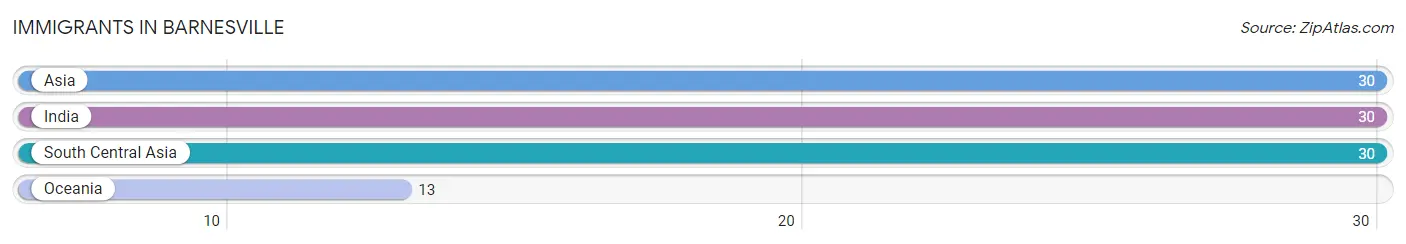
The most numerous immigrant groups reported in Barnesville came from Asia (30 | 0.8%), India (30 | 0.8%), South Central Asia (30 | 0.8%), and Oceania (13 | 0.4%), together accounting for 2.8% of all Barnesville residents.
| Immigration Origin | # Population | % Population |
| Asia | 30 | 0.8% |
| India | 30 | 0.8% |
| Oceania | 13 | 0.4% |
| South Central Asia | 30 | 0.8% | View All 4 Rows |
Sex and Age in Barnesville
Sex and Age in Barnesville
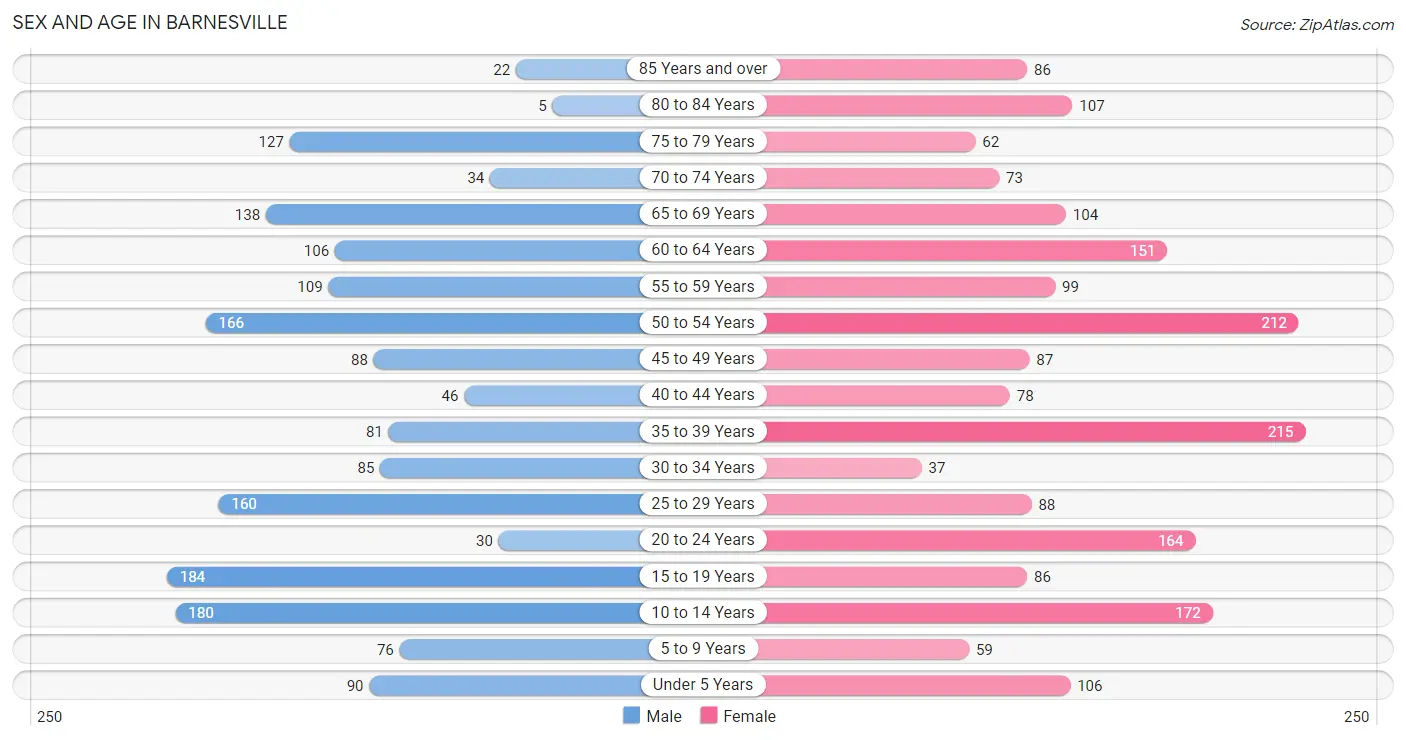
The most populous age groups in Barnesville are 15 to 19 Years (184 | 10.6%) for men and 35 to 39 Years (215 | 10.8%) for women.
| Age Bracket | Male | Female |
| Under 5 Years | 90 (5.2%) | 106 (5.3%) |
| 5 to 9 Years | 76 (4.4%) | 59 (3.0%) |
| 10 to 14 Years | 180 (10.4%) | 172 (8.7%) |
| 15 to 19 Years | 184 (10.6%) | 86 (4.3%) |
| 20 to 24 Years | 30 (1.7%) | 164 (8.3%) |
| 25 to 29 Years | 160 (9.3%) | 88 (4.4%) |
| 30 to 34 Years | 85 (4.9%) | 37 (1.9%) |
| 35 to 39 Years | 81 (4.7%) | 215 (10.8%) |
| 40 to 44 Years | 46 (2.7%) | 78 (3.9%) |
| 45 to 49 Years | 88 (5.1%) | 87 (4.4%) |
| 50 to 54 Years | 166 (9.6%) | 212 (10.7%) |
| 55 to 59 Years | 109 (6.3%) | 99 (5.0%) |
| 60 to 64 Years | 106 (6.1%) | 151 (7.6%) |
| 65 to 69 Years | 138 (8.0%) | 104 (5.2%) |
| 70 to 74 Years | 34 (2.0%) | 73 (3.7%) |
| 75 to 79 Years | 127 (7.3%) | 62 (3.1%) |
| 80 to 84 Years | 5 (0.3%) | 107 (5.4%) |
| 85 Years and over | 22 (1.3%) | 86 (4.3%) |
| Total | 1,727 (100.0%) | 1,986 (100.0%) |
Families and Households in Barnesville
Median Family Size in Barnesville
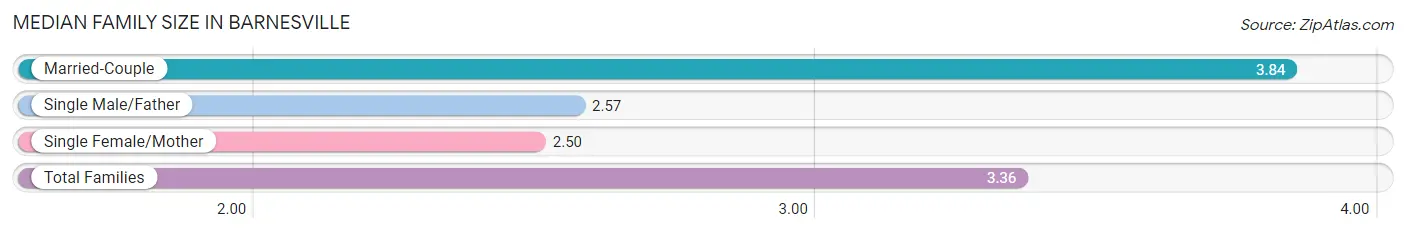
The median family size in Barnesville is 3.36 persons per family, with married-couple families (531 | 63.7%) accounting for the largest median family size of 3.84 persons per family. On the other hand, single female/mother families (258 | 31.0%) represent the smallest median family size with 2.50 persons per family.
| Family Type | # Families | Family Size |
| Married-Couple | 531 (63.7%) | 3.84 |
| Single Male/Father | 44 (5.3%) | 2.57 |
| Single Female/Mother | 258 (31.0%) | 2.50 |
| Total Families | 833 (100.0%) | 3.36 |
Median Household Size in Barnesville
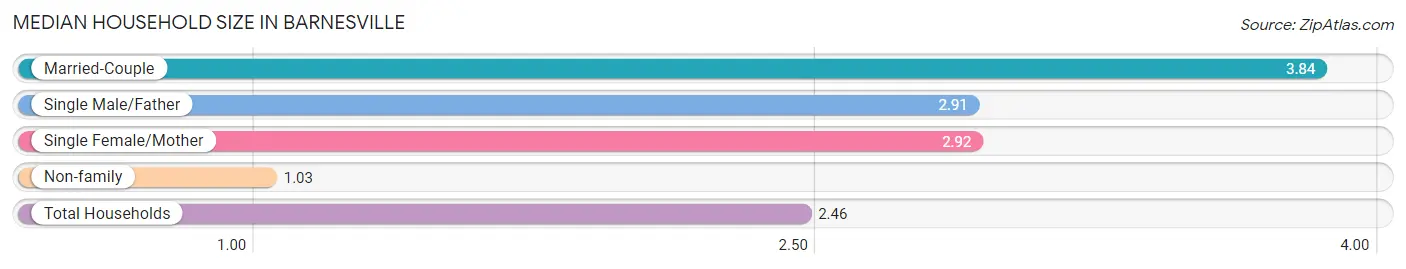
The median household size in Barnesville is 2.46 persons per household, with married-couple households (531 | 36.9%) accounting for the largest median household size of 3.84 persons per household. non-family households (607 | 42.1%) represent the smallest median household size with 1.03 persons per household.
| Household Type | # Households | Household Size |
| Married-Couple | 531 (36.9%) | 3.84 |
| Single Male/Father | 44 (3.1%) | 2.91 |
| Single Female/Mother | 258 (17.9%) | 2.92 |
| Non-family | 607 (42.1%) | 1.03 |
| Total Households | 1,440 (100.0%) | 2.46 |
Household Size by Marriage Status in Barnesville
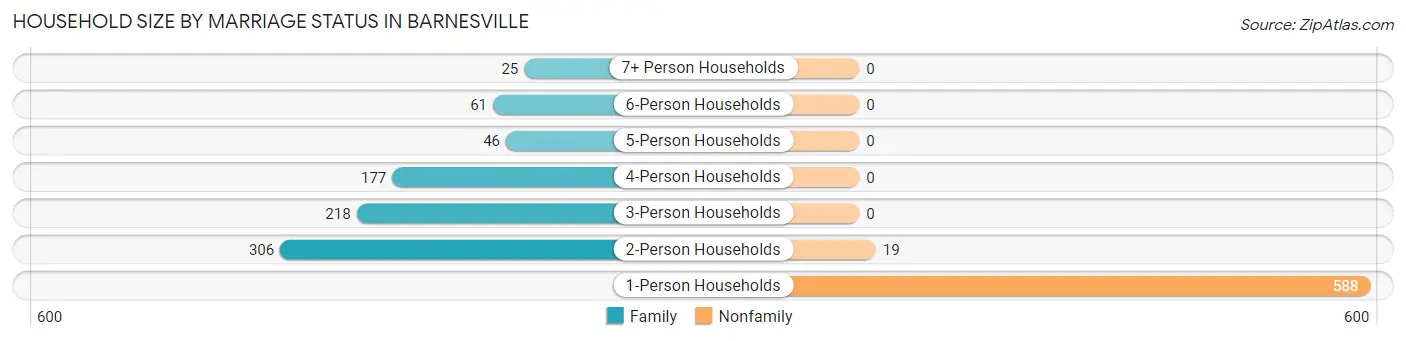
Out of a total of 1,440 households in Barnesville, 833 (57.9%) are family households, while 607 (42.1%) are nonfamily households. The most numerous type of family households are 2-person households, comprising 306, and the most common type of nonfamily households are 1-person households, comprising 588.
| Household Size | Family Households | Nonfamily Households |
| 1-Person Households | - | 588 (40.8%) |
| 2-Person Households | 306 (21.2%) | 19 (1.3%) |
| 3-Person Households | 218 (15.1%) | 0 (0.0%) |
| 4-Person Households | 177 (12.3%) | 0 (0.0%) |
| 5-Person Households | 46 (3.2%) | 0 (0.0%) |
| 6-Person Households | 61 (4.2%) | 0 (0.0%) |
| 7+ Person Households | 25 (1.7%) | 0 (0.0%) |
| Total | 833 (57.9%) | 607 (42.1%) |
Female Fertility in Barnesville
Fertility by Age in Barnesville
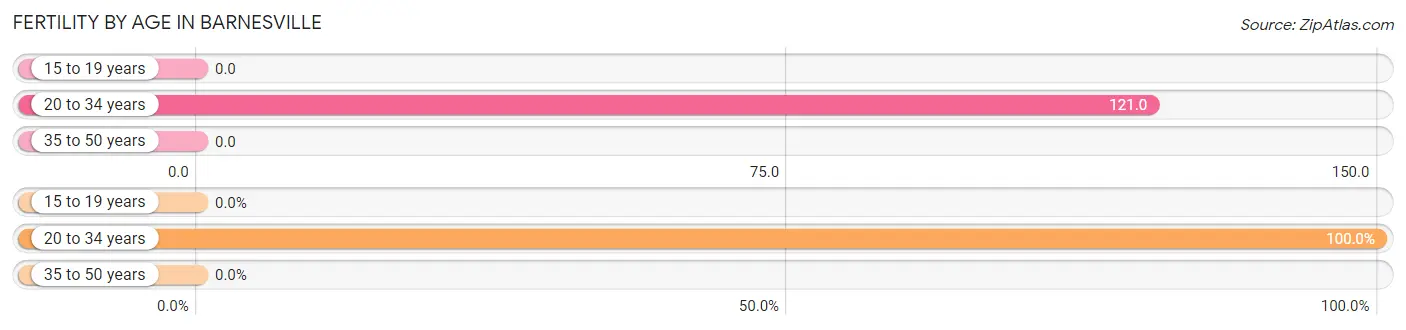
Average fertility rate in Barnesville is 42.0 births per 1,000 women. Women in the age bracket of 20 to 34 years have the highest fertility rate with 121.0 births per 1,000 women. Women in the age bracket of 20 to 34 years acount for 100.0% of all women with births.
| Age Bracket | Women with Births | Births / 1,000 Women |
| 15 to 19 years | 0 (0.0%) | 0.0 |
| 20 to 34 years | 35 (100.0%) | 121.0 |
| 35 to 50 years | 0 (0.0%) | 0.0 |
| Total | 35 (100.0%) | 42.0 |
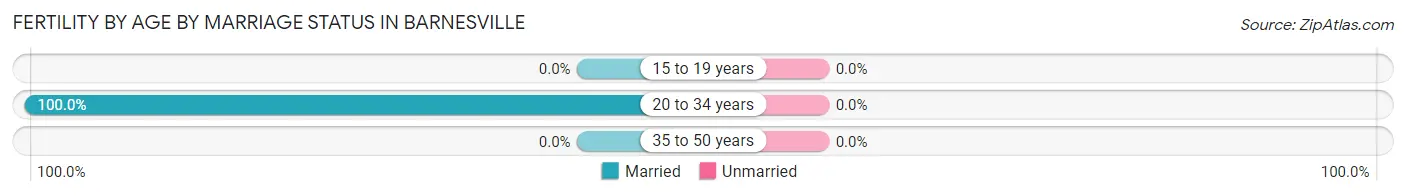
Fertility by Age by Marriage Status in Barnesville
| Age Bracket | Married | Unmarried |
| 15 to 19 years | 0 (0.0%) | 0 (0.0%) |
| 20 to 34 years | 35 (100.0%) | 0 (0.0%) |
| 35 to 50 years | 0 (0.0%) | 0 (0.0%) |
| Total | 35 (100.0%) | 0 (0.0%) |
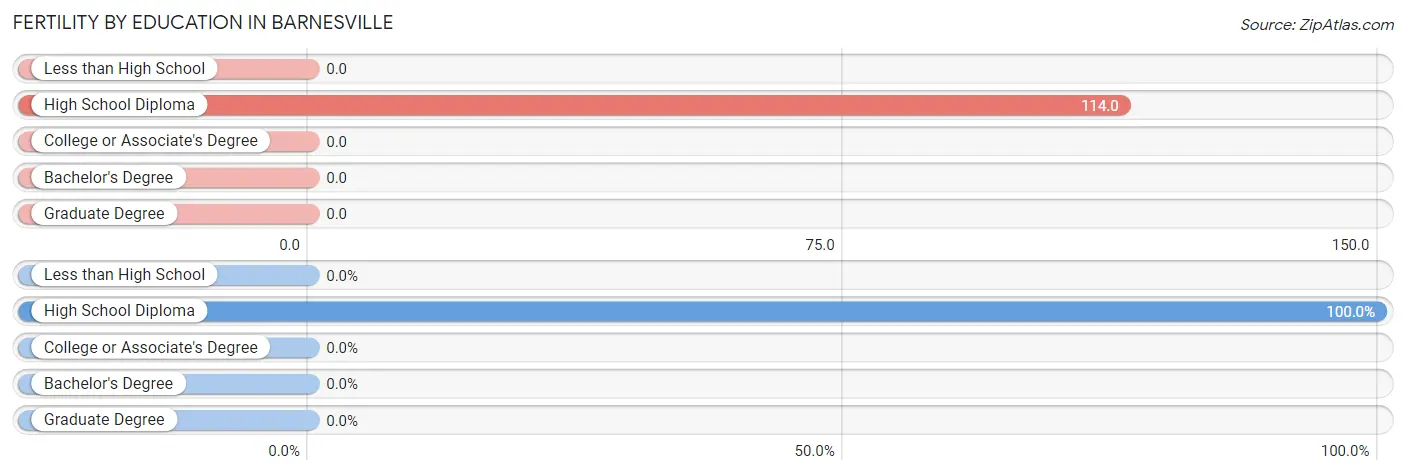
Fertility by Education in Barnesville
| Educational Attainment | Women with Births | Births / 1,000 Women |
| Less than High School | 0 (0.0%) | 0.0 |
| High School Diploma | 35 (100.0%) | 114.0 |
| College or Associate's Degree | 0 (0.0%) | 0.0 |
| Bachelor's Degree | 0 (0.0%) | 0.0 |
| Graduate Degree | 0 (0.0%) | 0.0 |
| Total | 35 (100.0%) | 42.0 |
Fertility by Education by Marriage Status in Barnesville
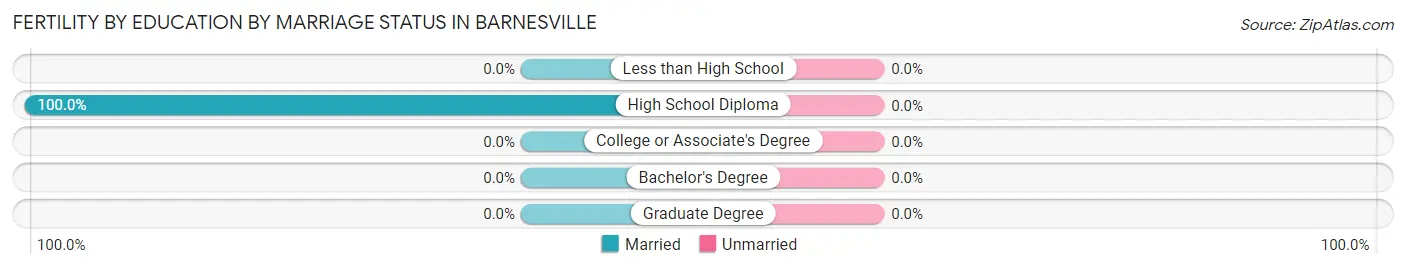
| Educational Attainment | Married | Unmarried |
| Less than High School | 0 (0.0%) | 0 (0.0%) |
| High School Diploma | 35 (100.0%) | 0 (0.0%) |
| College or Associate's Degree | 0 (0.0%) | 0 (0.0%) |
| Bachelor's Degree | 0 (0.0%) | 0 (0.0%) |
| Graduate Degree | 0 (0.0%) | 0 (0.0%) |
| Total | 35 (100.0%) | 0 (0.0%) |
Employment Characteristics in Barnesville
Employment by Class of Employer in Barnesville
Among the 1,579 employed individuals in Barnesville, private company employees (1,047 | 66.3%), not-for-profit organizations (255 | 16.2%), and local government employees (131 | 8.3%) make up the most common classes of employment.
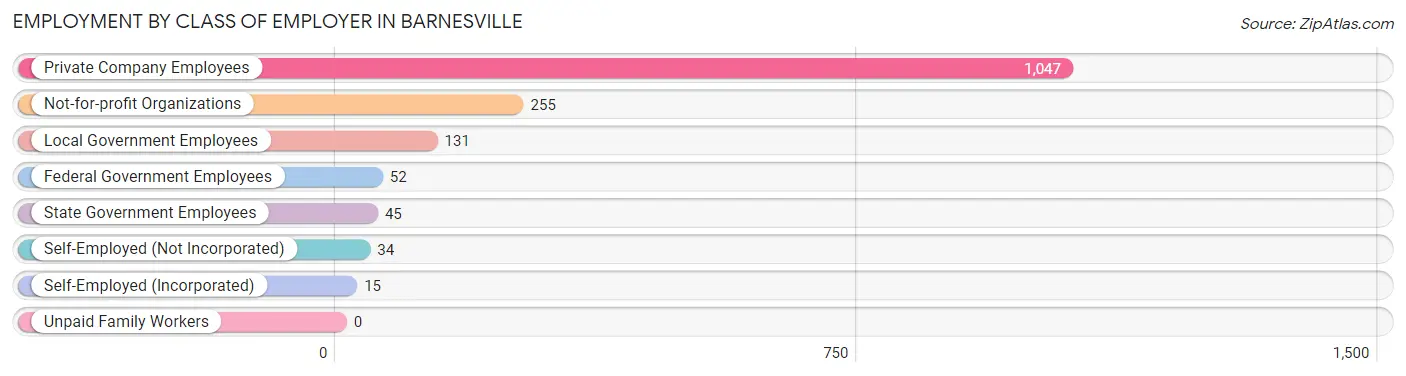
| Employer Class | # Employees | % Employees |
| Private Company Employees | 1,047 | 66.3% |
| Self-Employed (Incorporated) | 15 | 0.9% |
| Self-Employed (Not Incorporated) | 34 | 2.1% |
| Not-for-profit Organizations | 255 | 16.2% |
| Local Government Employees | 131 | 8.3% |
| State Government Employees | 45 | 2.9% |
| Federal Government Employees | 52 | 3.3% |
| Unpaid Family Workers | 0 | 0.0% |
| Total | 1,579 | 100.0% |
Employment Status by Age in Barnesville
According to the labor force statistics for Barnesville, out of the total population over 16 years of age (2,959), 56.3% or 1,666 individuals are in the labor force, with 2.5% or 42 of them unemployed. The age group with the highest labor force participation rate is 30 to 34 years, with 100.0% or 122 individuals in the labor force. Within the labor force, the 35 to 44 years age range has the highest percentage of unemployed individuals, with 12.0% or 41 of them being unemployed.
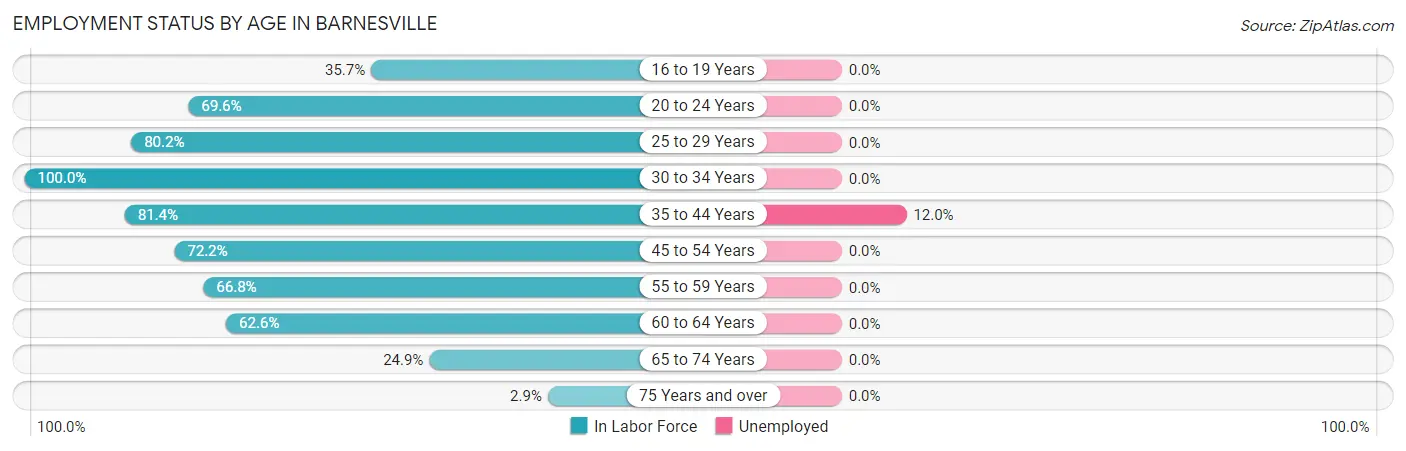
| Age Bracket | In Labor Force | Unemployed |
| 16 to 19 Years | 71 (35.7%) | 0 (0.0%) |
| 20 to 24 Years | 135 (69.6%) | 0 (0.0%) |
| 25 to 29 Years | 199 (80.2%) | 0 (0.0%) |
| 30 to 34 Years | 122 (100.0%) | 0 (0.0%) |
| 35 to 44 Years | 342 (81.4%) | 41 (12.0%) |
| 45 to 54 Years | 399 (72.2%) | 0 (0.0%) |
| 55 to 59 Years | 139 (66.8%) | 0 (0.0%) |
| 60 to 64 Years | 161 (62.6%) | 0 (0.0%) |
| 65 to 74 Years | 87 (24.9%) | 0 (0.0%) |
| 75 Years and over | 12 (2.9%) | 0 (0.0%) |
| Total | 1,666 (56.3%) | 42 (2.5%) |
Employment Status by Educational Attainment in Barnesville
According to labor force statistics for Barnesville, 75.3% of individuals (1,361) out of the total population between 25 and 64 years of age (1,808) are in the labor force, with 3.0% or 41 of them being unemployed. The group with the highest labor force participation rate are those with the educational attainment of bachelor's degree or higher, with 90.8% or 216 individuals in the labor force. Within the labor force, individuals with high school diploma education have the highest percentage of unemployment, with 4.4% or 23 of them being unemployed.
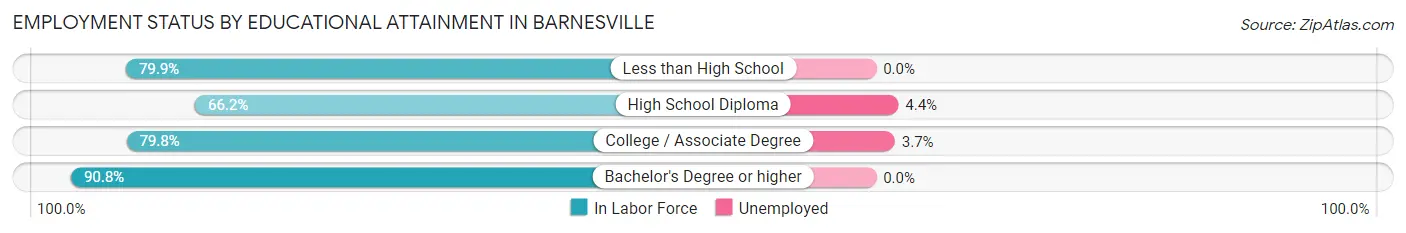
| Educational Attainment | In Labor Force | Unemployed |
| Less than High School | 135 (79.9%) | 0 (0.0%) |
| High School Diploma | 518 (66.2%) | 34 (4.4%) |
| College / Associate Degree | 493 (79.8%) | 23 (3.7%) |
| Bachelor's Degree or higher | 216 (90.8%) | 0 (0.0%) |
| Total | 1,361 (75.3%) | 54 (3.0%) |
Employment Occupations by Sex in Barnesville
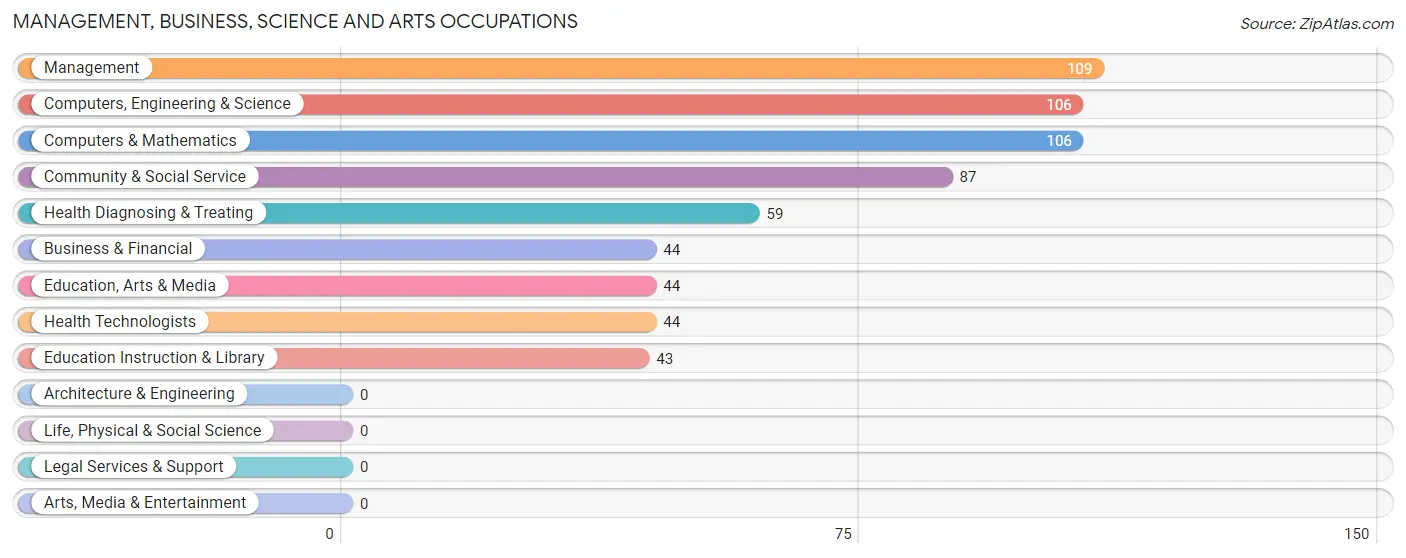
Management, Business, Science and Arts Occupations
The most common Management, Business, Science and Arts occupations in Barnesville are Management (109 | 6.7%), Computers, Engineering & Science (106 | 6.5%), Computers & Mathematics (106 | 6.5%), Community & Social Service (87 | 5.3%), and Health Diagnosing & Treating (59 | 3.6%).
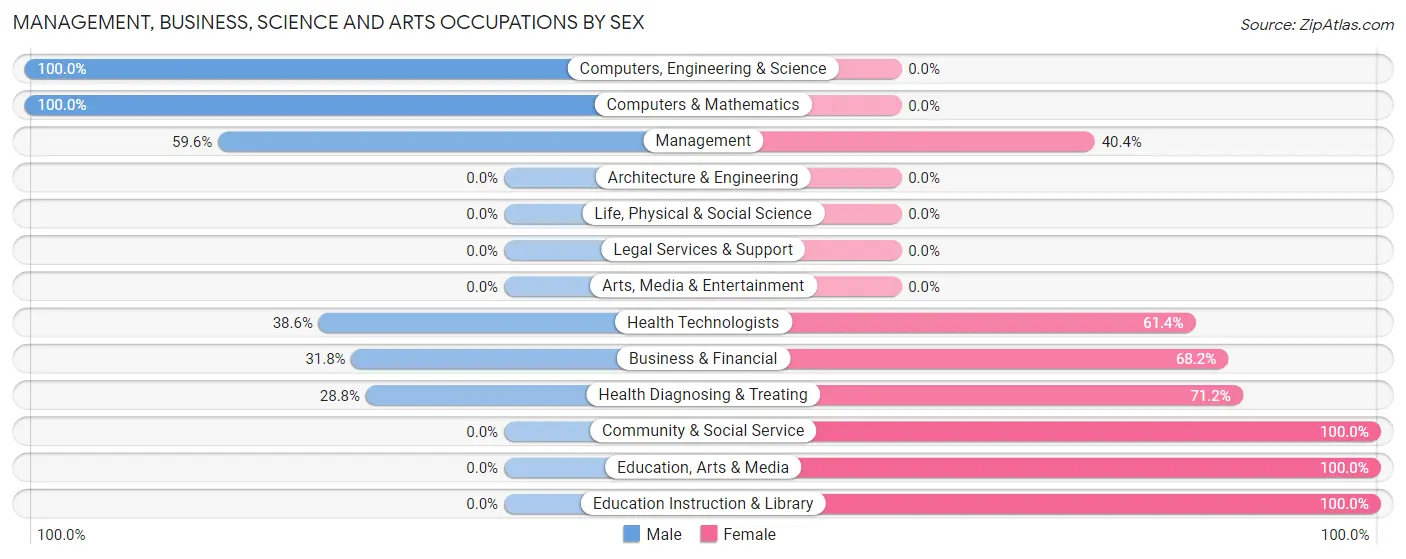
Management, Business, Science and Arts Occupations by Sex
Within the Management, Business, Science and Arts occupations in Barnesville, the most male-oriented occupations are Computers, Engineering & Science (100.0%), Computers & Mathematics (100.0%), and Management (59.6%), while the most female-oriented occupations are Community & Social Service (100.0%), Education, Arts & Media (100.0%), and Education Instruction & Library (100.0%).
| Occupation | Male | Female |
| Management | 65 (59.6%) | 44 (40.4%) |
| Business & Financial | 14 (31.8%) | 30 (68.2%) |
| Computers, Engineering & Science | 106 (100.0%) | 0 (0.0%) |
| Computers & Mathematics | 106 (100.0%) | 0 (0.0%) |
| Architecture & Engineering | 0 (0.0%) | 0 (0.0%) |
| Life, Physical & Social Science | 0 (0.0%) | 0 (0.0%) |
| Community & Social Service | 0 (0.0%) | 87 (100.0%) |
| Education, Arts & Media | 0 (0.0%) | 44 (100.0%) |
| Legal Services & Support | 0 (0.0%) | 0 (0.0%) |
| Education Instruction & Library | 0 (0.0%) | 43 (100.0%) |
| Arts, Media & Entertainment | 0 (0.0%) | 0 (0.0%) |
| Health Diagnosing & Treating | 17 (28.8%) | 42 (71.2%) |
| Health Technologists | 17 (38.6%) | 27 (61.4%) |
| Total (Category) | 202 (49.9%) | 203 (50.1%) |
| Total (Overall) | 738 (45.4%) | 888 (54.6%) |
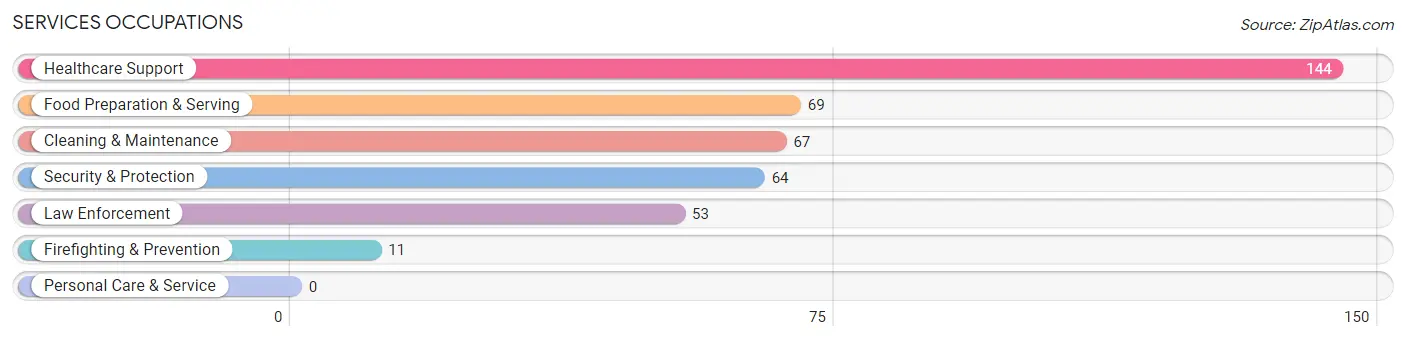
Services Occupations
The most common Services occupations in Barnesville are Healthcare Support (144 | 8.9%), Food Preparation & Serving (69 | 4.2%), Cleaning & Maintenance (67 | 4.1%), Security & Protection (64 | 3.9%), and Law Enforcement (53 | 3.3%).
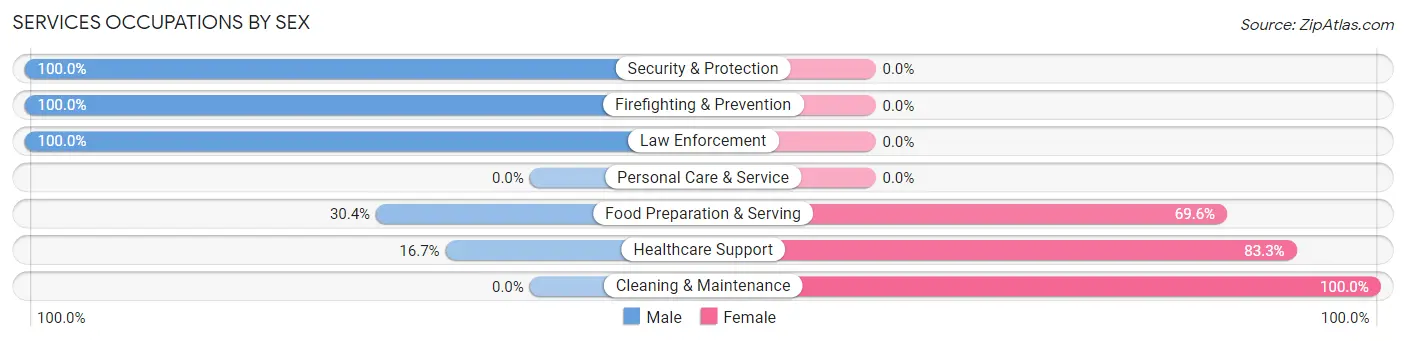
Services Occupations by Sex
Within the Services occupations in Barnesville, the most male-oriented occupations are Security & Protection (100.0%), Firefighting & Prevention (100.0%), and Law Enforcement (100.0%), while the most female-oriented occupations are Cleaning & Maintenance (100.0%), Healthcare Support (83.3%), and Food Preparation & Serving (69.6%).
| Occupation | Male | Female |
| Healthcare Support | 24 (16.7%) | 120 (83.3%) |
| Security & Protection | 64 (100.0%) | 0 (0.0%) |
| Firefighting & Prevention | 11 (100.0%) | 0 (0.0%) |
| Law Enforcement | 53 (100.0%) | 0 (0.0%) |
| Food Preparation & Serving | 21 (30.4%) | 48 (69.6%) |
| Cleaning & Maintenance | 0 (0.0%) | 67 (100.0%) |
| Personal Care & Service | 0 (0.0%) | 0 (0.0%) |
| Total (Category) | 109 (31.7%) | 235 (68.3%) |
| Total (Overall) | 738 (45.4%) | 888 (54.6%) |
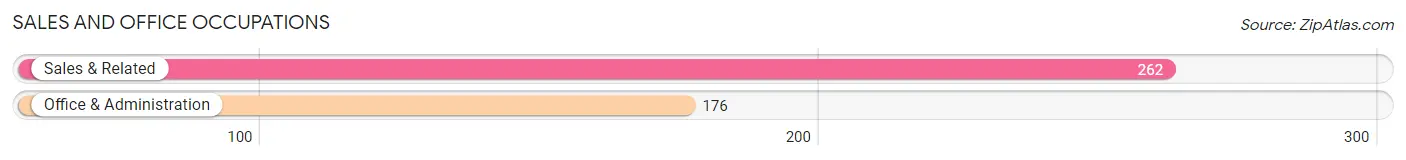
Sales and Office Occupations
The most common Sales and Office occupations in Barnesville are Sales & Related (262 | 16.1%), and Office & Administration (176 | 10.8%).
Sales and Office Occupations by Sex
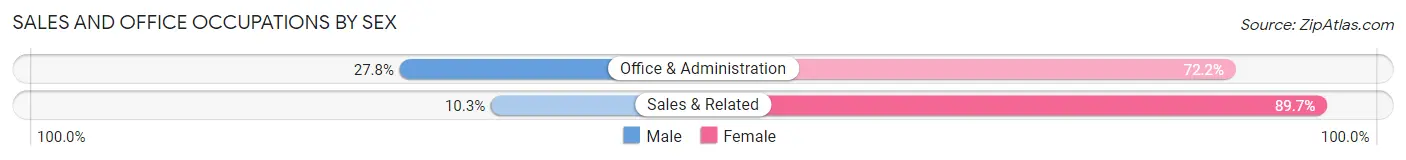
| Occupation | Male | Female |
| Sales & Related | 27 (10.3%) | 235 (89.7%) |
| Office & Administration | 49 (27.8%) | 127 (72.2%) |
| Total (Category) | 76 (17.3%) | 362 (82.7%) |
| Total (Overall) | 738 (45.4%) | 888 (54.6%) |
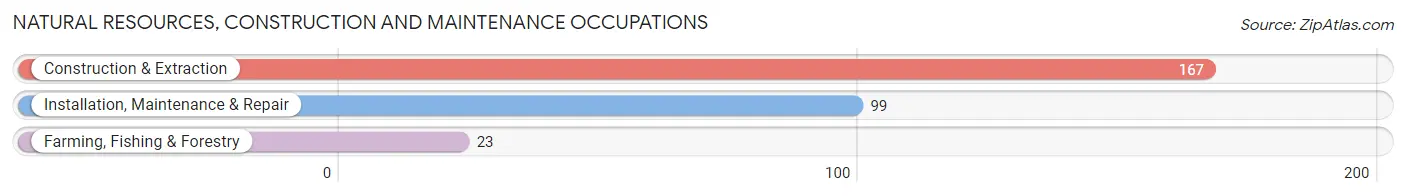
Natural Resources, Construction and Maintenance Occupations
The most common Natural Resources, Construction and Maintenance occupations in Barnesville are Construction & Extraction (167 | 10.3%), Installation, Maintenance & Repair (99 | 6.1%), and Farming, Fishing & Forestry (23 | 1.4%).
Natural Resources, Construction and Maintenance Occupations by Sex
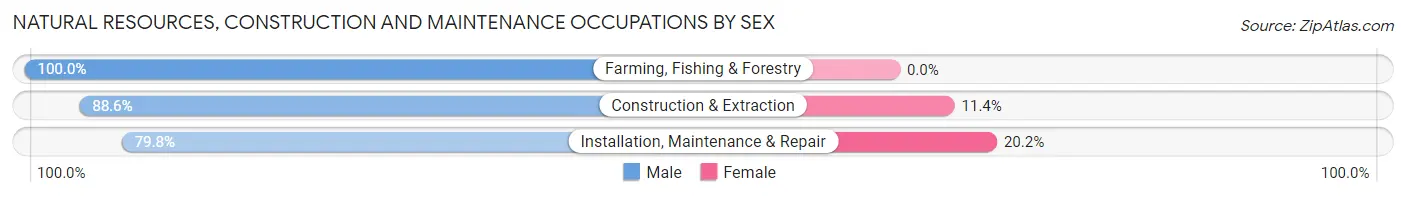
| Occupation | Male | Female |
| Farming, Fishing & Forestry | 23 (100.0%) | 0 (0.0%) |
| Construction & Extraction | 148 (88.6%) | 19 (11.4%) |
| Installation, Maintenance & Repair | 79 (79.8%) | 20 (20.2%) |
| Total (Category) | 250 (86.5%) | 39 (13.5%) |
| Total (Overall) | 738 (45.4%) | 888 (54.6%) |
Production, Transportation and Moving Occupations
The most common Production, Transportation and Moving occupations in Barnesville are Production (86 | 5.3%), and Transportation (64 | 3.9%).
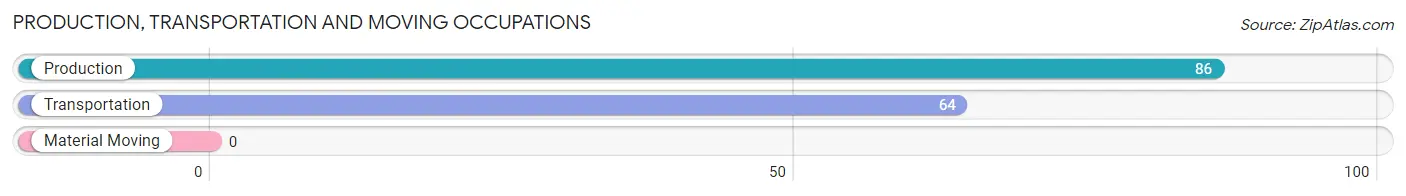
Production, Transportation and Moving Occupations by Sex
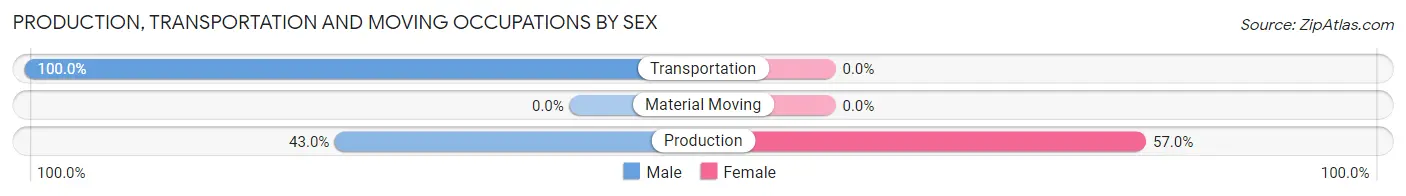
| Occupation | Male | Female |
| Production | 37 (43.0%) | 49 (57.0%) |
| Transportation | 64 (100.0%) | 0 (0.0%) |
| Material Moving | 0 (0.0%) | 0 (0.0%) |
| Total (Category) | 101 (67.3%) | 49 (32.7%) |
| Total (Overall) | 738 (45.4%) | 888 (54.6%) |
Employment Industries by Sex in Barnesville
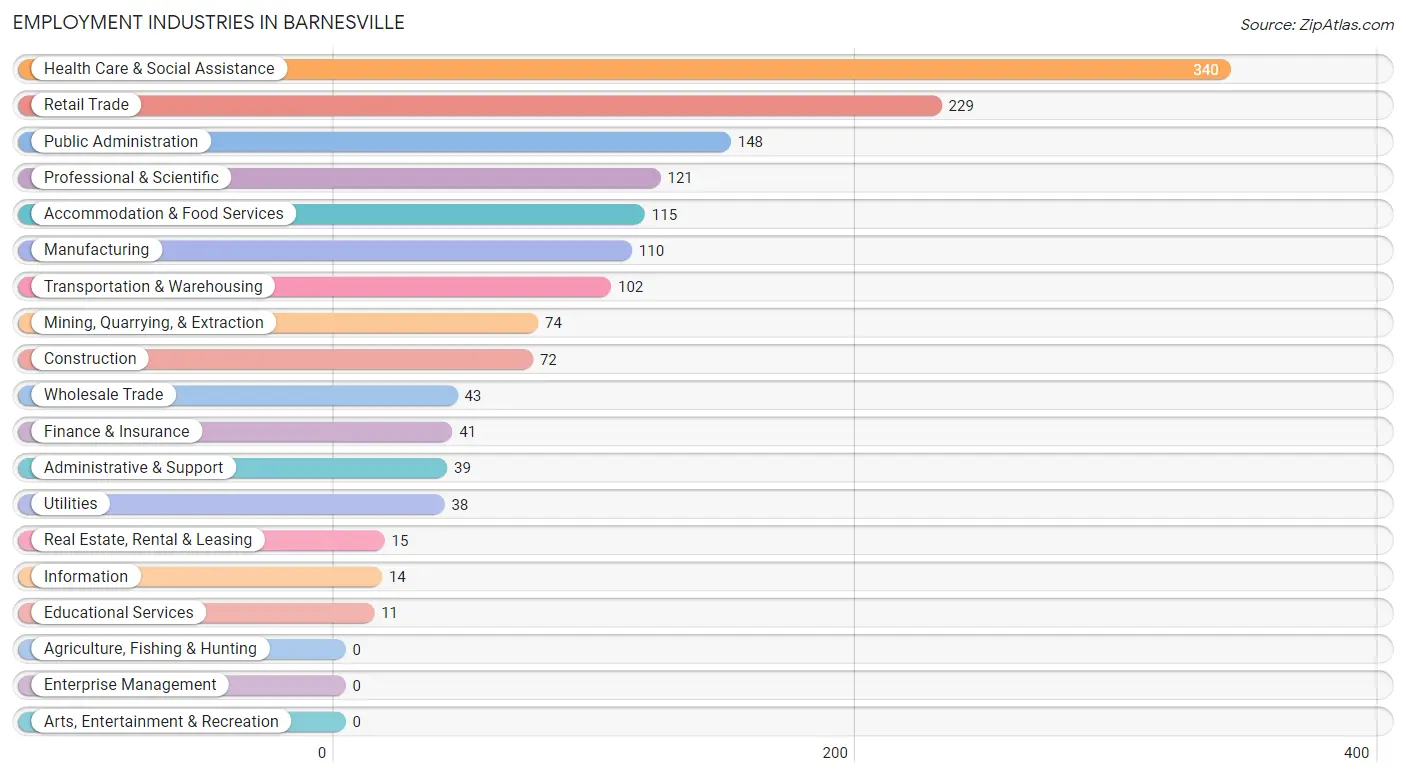
Employment Industries in Barnesville
The major employment industries in Barnesville include Health Care & Social Assistance (340 | 20.9%), Retail Trade (229 | 14.1%), Public Administration (148 | 9.1%), Professional & Scientific (121 | 7.4%), and Accommodation & Food Services (115 | 7.1%).
Employment Industries by Sex in Barnesville
The Barnesville industries that see more men than women are Mining, Quarrying, & Extraction (100.0%), Transportation & Warehousing (100.0%), and Utilities (100.0%), whereas the industries that tend to have a higher number of women are Finance & Insurance (100.0%), Administrative & Support (100.0%), and Educational Services (100.0%).
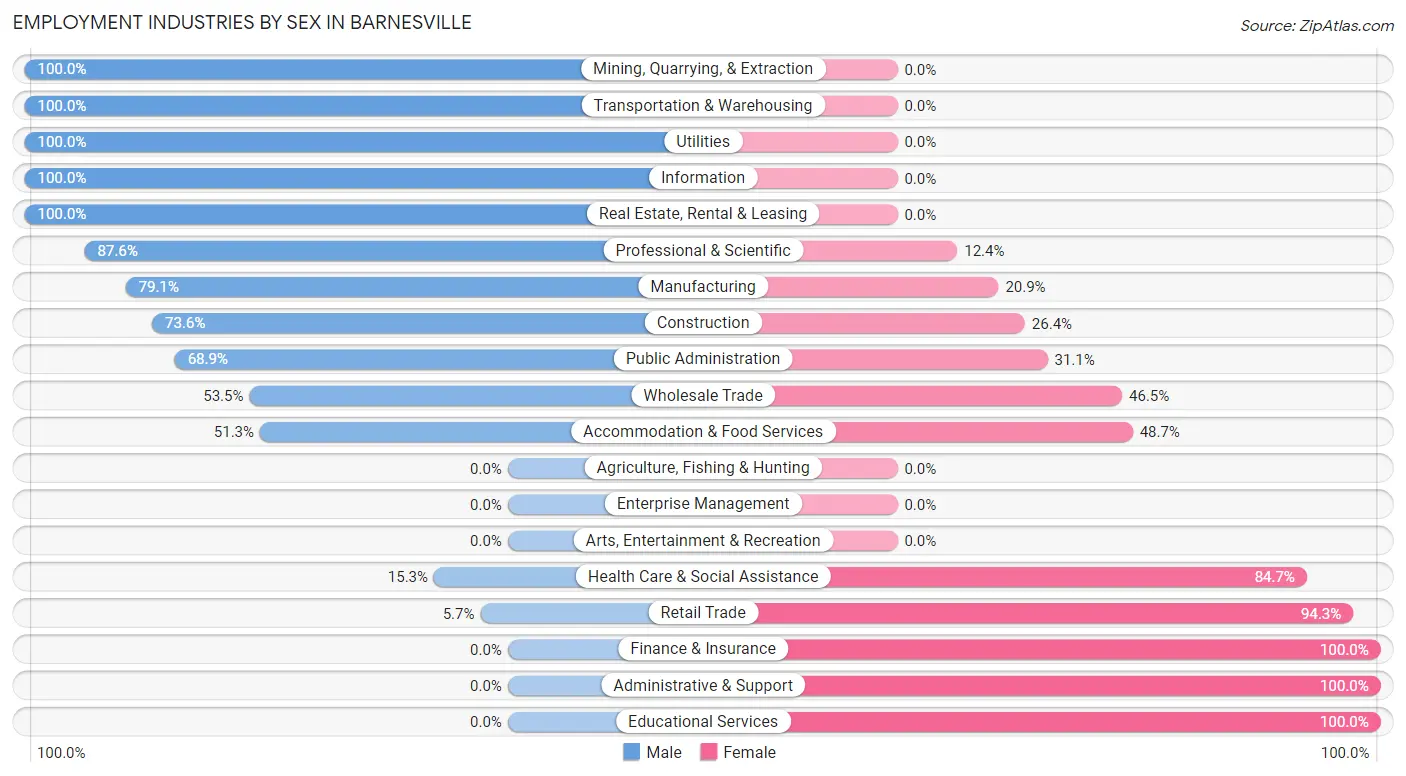
| Industry | Male | Female |
| Agriculture, Fishing & Hunting | 0 (0.0%) | 0 (0.0%) |
| Mining, Quarrying, & Extraction | 74 (100.0%) | 0 (0.0%) |
| Construction | 53 (73.6%) | 19 (26.4%) |
| Manufacturing | 87 (79.1%) | 23 (20.9%) |
| Wholesale Trade | 23 (53.5%) | 20 (46.5%) |
| Retail Trade | 13 (5.7%) | 216 (94.3%) |
| Transportation & Warehousing | 102 (100.0%) | 0 (0.0%) |
| Utilities | 38 (100.0%) | 0 (0.0%) |
| Information | 14 (100.0%) | 0 (0.0%) |
| Finance & Insurance | 0 (0.0%) | 41 (100.0%) |
| Real Estate, Rental & Leasing | 15 (100.0%) | 0 (0.0%) |
| Professional & Scientific | 106 (87.6%) | 15 (12.4%) |
| Enterprise Management | 0 (0.0%) | 0 (0.0%) |
| Administrative & Support | 0 (0.0%) | 39 (100.0%) |
| Educational Services | 0 (0.0%) | 11 (100.0%) |
| Health Care & Social Assistance | 52 (15.3%) | 288 (84.7%) |
| Arts, Entertainment & Recreation | 0 (0.0%) | 0 (0.0%) |
| Accommodation & Food Services | 59 (51.3%) | 56 (48.7%) |
| Public Administration | 102 (68.9%) | 46 (31.1%) |
| Total | 738 (45.4%) | 888 (54.6%) |
Education in Barnesville
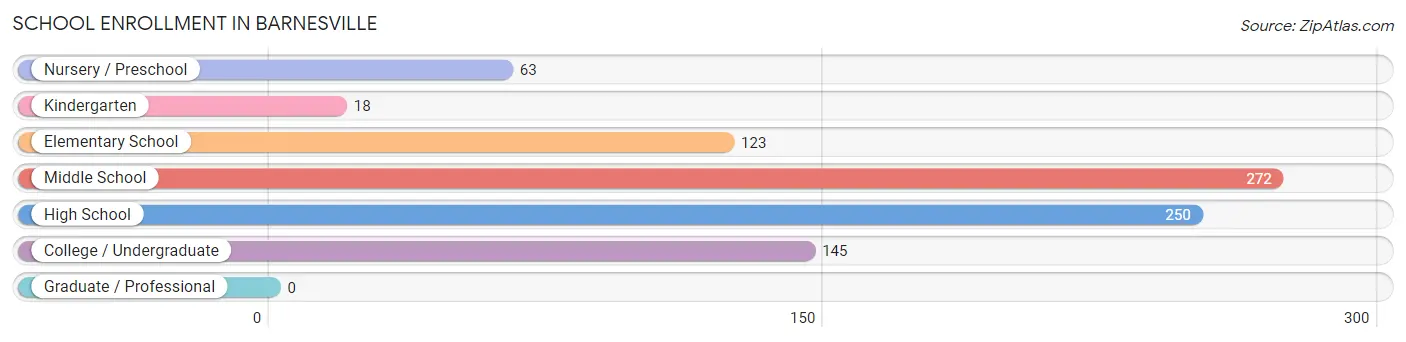
School Enrollment in Barnesville
The most common levels of schooling among the 871 students in Barnesville are middle school (272 | 31.2%), high school (250 | 28.7%), and college / undergraduate (145 | 16.7%).
| School Level | # Students | % Students |
| Nursery / Preschool | 63 | 7.2% |
| Kindergarten | 18 | 2.1% |
| Elementary School | 123 | 14.1% |
| Middle School | 272 | 31.2% |
| High School | 250 | 28.7% |
| College / Undergraduate | 145 | 16.7% |
| Graduate / Professional | 0 | 0.0% |
| Total | 871 | 100.0% |
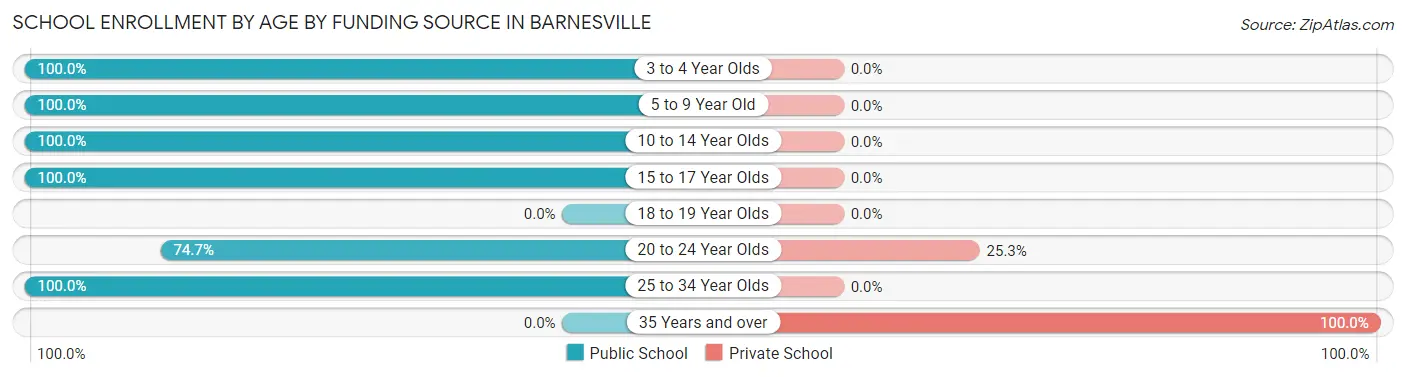
School Enrollment by Age by Funding Source in Barnesville
Out of a total of 871 students who are enrolled in schools in Barnesville, 62 (7.1%) attend a private institution, while the remaining 809 (92.9%) are enrolled in public schools. The age group of 35 years and over has the highest likelihood of being enrolled in private schools, with 42 (100.0% in the age bracket) enrolled. Conversely, the age group of 3 to 4 year olds has the lowest likelihood of being enrolled in a private school, with 45 (100.0% in the age bracket) attending a public institution.
| Age Bracket | Public School | Private School |
| 3 to 4 Year Olds | 45 (100.0%) | 0 (0.0%) |
| 5 to 9 Year Old | 135 (100.0%) | 0 (0.0%) |
| 10 to 14 Year Olds | 352 (100.0%) | 0 (0.0%) |
| 15 to 17 Year Olds | 194 (100.0%) | 0 (0.0%) |
| 18 to 19 Year Olds | 0 (0.0%) | 0 (0.0%) |
| 20 to 24 Year Olds | 59 (74.7%) | 20 (25.3%) |
| 25 to 34 Year Olds | 24 (100.0%) | 0 (0.0%) |
| 35 Years and over | 0 (0.0%) | 42 (100.0%) |
| Total | 809 (92.9%) | 62 (7.1%) |
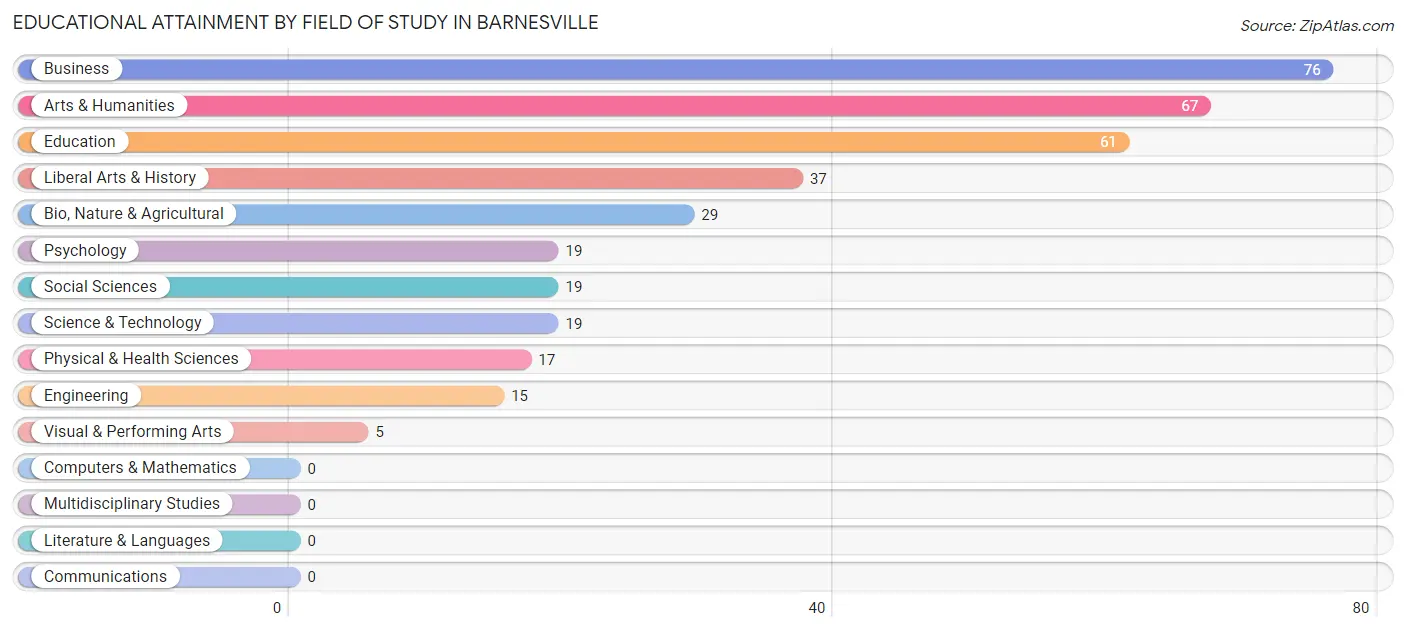
Educational Attainment by Field of Study in Barnesville
Business (76 | 20.9%), arts & humanities (67 | 18.4%), education (61 | 16.8%), liberal arts & history (37 | 10.2%), and bio, nature & agricultural (29 | 8.0%) are the most common fields of study among 364 individuals in Barnesville who have obtained a bachelor's degree or higher.
| Field of Study | # Graduates | % Graduates |
| Computers & Mathematics | 0 | 0.0% |
| Bio, Nature & Agricultural | 29 | 8.0% |
| Physical & Health Sciences | 17 | 4.7% |
| Psychology | 19 | 5.2% |
| Social Sciences | 19 | 5.2% |
| Engineering | 15 | 4.1% |
| Multidisciplinary Studies | 0 | 0.0% |
| Science & Technology | 19 | 5.2% |
| Business | 76 | 20.9% |
| Education | 61 | 16.8% |
| Literature & Languages | 0 | 0.0% |
| Liberal Arts & History | 37 | 10.2% |
| Visual & Performing Arts | 5 | 1.4% |
| Communications | 0 | 0.0% |
| Arts & Humanities | 67 | 18.4% |
| Total | 364 | 100.0% |
Transportation & Commute in Barnesville
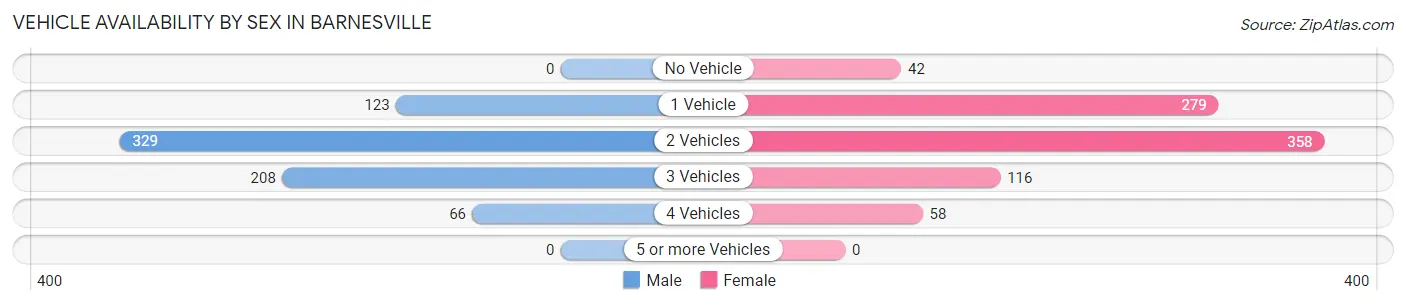
Vehicle Availability by Sex in Barnesville
The most prevalent vehicle ownership categories in Barnesville are males with 2 vehicles (329, accounting for 45.3%) and females with 2 vehicles (358, making up 38.6%).
| Vehicles Available | Male | Female |
| No Vehicle | 0 (0.0%) | 42 (4.9%) |
| 1 Vehicle | 123 (16.9%) | 279 (32.7%) |
| 2 Vehicles | 329 (45.3%) | 358 (42.0%) |
| 3 Vehicles | 208 (28.6%) | 116 (13.6%) |
| 4 Vehicles | 66 (9.1%) | 58 (6.8%) |
| 5 or more Vehicles | 0 (0.0%) | 0 (0.0%) |
| Total | 726 (100.0%) | 853 (100.0%) |
Commute Time in Barnesville
The most frequently occuring commute durations in Barnesville are 5 to 9 minutes (437 commuters, 28.2%), 30 to 34 minutes (434 commuters, 28.1%), and 15 to 19 minutes (140 commuters, 9.0%).
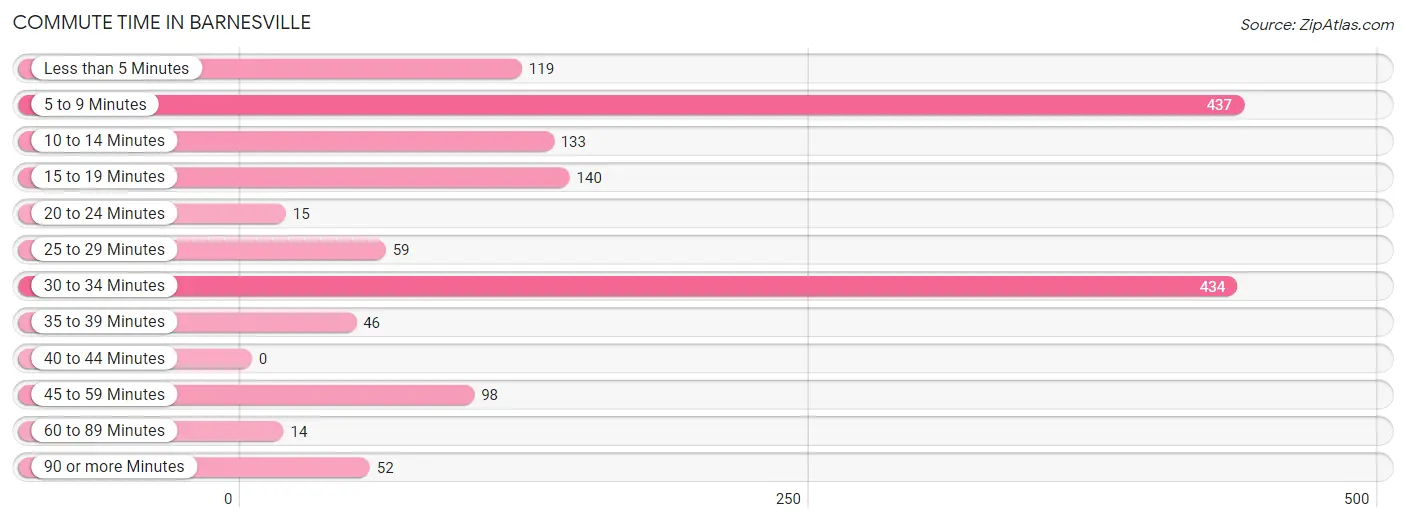
| Commute Time | # Commuters | % Commuters |
| Less than 5 Minutes | 119 | 7.7% |
| 5 to 9 Minutes | 437 | 28.2% |
| 10 to 14 Minutes | 133 | 8.6% |
| 15 to 19 Minutes | 140 | 9.0% |
| 20 to 24 Minutes | 15 | 1.0% |
| 25 to 29 Minutes | 59 | 3.8% |
| 30 to 34 Minutes | 434 | 28.1% |
| 35 to 39 Minutes | 46 | 3.0% |
| 40 to 44 Minutes | 0 | 0.0% |
| 45 to 59 Minutes | 98 | 6.3% |
| 60 to 89 Minutes | 14 | 0.9% |
| 90 or more Minutes | 52 | 3.4% |
Commute Time by Sex in Barnesville
The most common commute times in Barnesville are 30 to 34 minutes (341 commuters, 47.0%) for males and 5 to 9 minutes (315 commuters, 38.4%) for females.
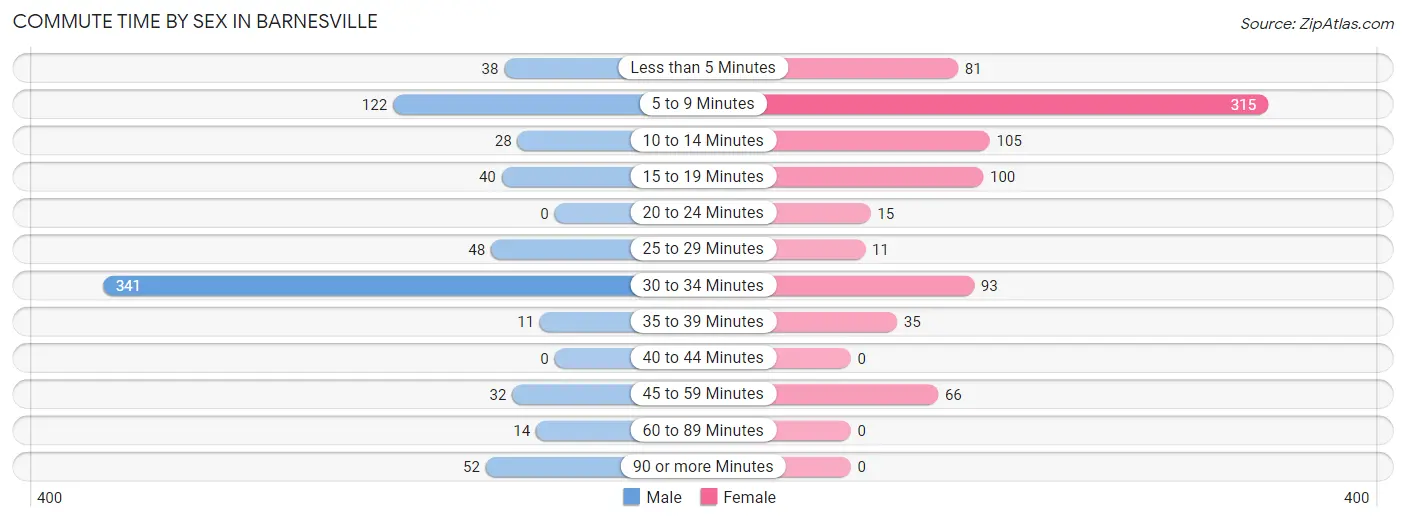
| Commute Time | Male | Female |
| Less than 5 Minutes | 38 (5.2%) | 81 (9.9%) |
| 5 to 9 Minutes | 122 (16.8%) | 315 (38.4%) |
| 10 to 14 Minutes | 28 (3.9%) | 105 (12.8%) |
| 15 to 19 Minutes | 40 (5.5%) | 100 (12.2%) |
| 20 to 24 Minutes | 0 (0.0%) | 15 (1.8%) |
| 25 to 29 Minutes | 48 (6.6%) | 11 (1.3%) |
| 30 to 34 Minutes | 341 (47.0%) | 93 (11.3%) |
| 35 to 39 Minutes | 11 (1.5%) | 35 (4.3%) |
| 40 to 44 Minutes | 0 (0.0%) | 0 (0.0%) |
| 45 to 59 Minutes | 32 (4.4%) | 66 (8.0%) |
| 60 to 89 Minutes | 14 (1.9%) | 0 (0.0%) |
| 90 or more Minutes | 52 (7.2%) | 0 (0.0%) |
Time of Departure to Work by Sex in Barnesville
The most frequent times of departure to work in Barnesville are 5:30 AM to 5:59 AM (145, 20.0%) for males and 6:30 AM to 6:59 AM (104, 12.7%) for females.
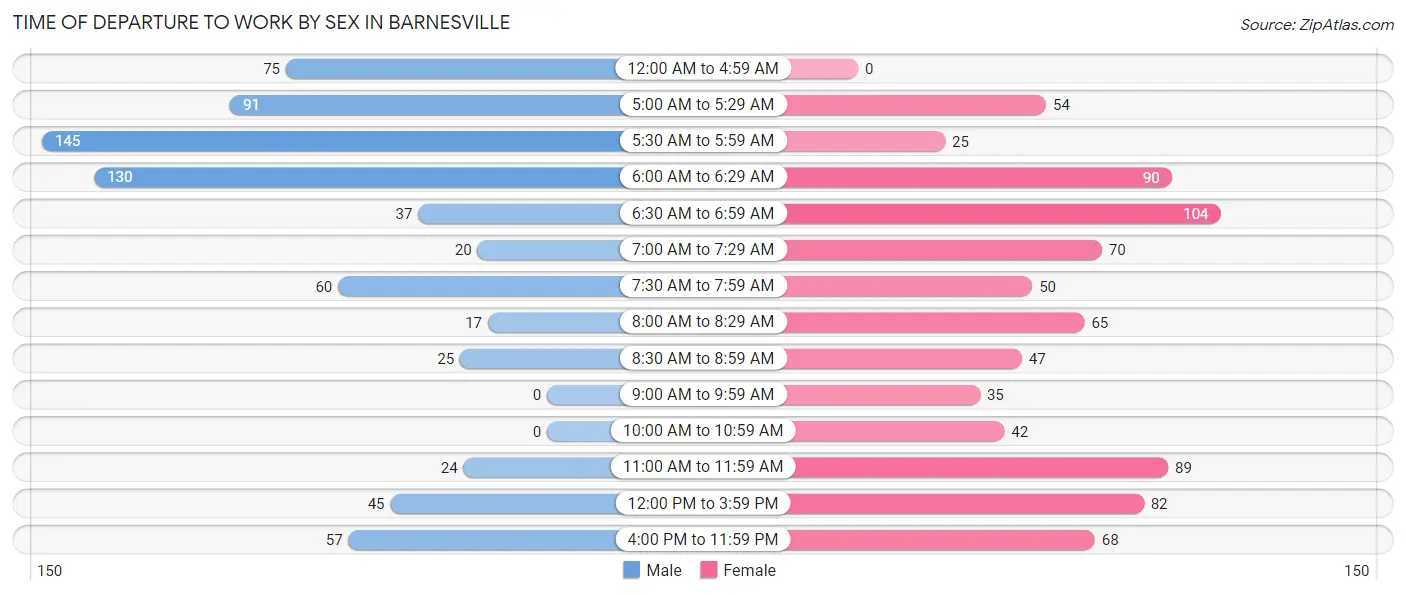
| Time of Departure | Male | Female |
| 12:00 AM to 4:59 AM | 75 (10.3%) | 0 (0.0%) |
| 5:00 AM to 5:29 AM | 91 (12.5%) | 54 (6.6%) |
| 5:30 AM to 5:59 AM | 145 (20.0%) | 25 (3.0%) |
| 6:00 AM to 6:29 AM | 130 (17.9%) | 90 (11.0%) |
| 6:30 AM to 6:59 AM | 37 (5.1%) | 104 (12.7%) |
| 7:00 AM to 7:29 AM | 20 (2.8%) | 70 (8.5%) |
| 7:30 AM to 7:59 AM | 60 (8.3%) | 50 (6.1%) |
| 8:00 AM to 8:29 AM | 17 (2.3%) | 65 (7.9%) |
| 8:30 AM to 8:59 AM | 25 (3.4%) | 47 (5.7%) |
| 9:00 AM to 9:59 AM | 0 (0.0%) | 35 (4.3%) |
| 10:00 AM to 10:59 AM | 0 (0.0%) | 42 (5.1%) |
| 11:00 AM to 11:59 AM | 24 (3.3%) | 89 (10.8%) |
| 12:00 PM to 3:59 PM | 45 (6.2%) | 82 (10.0%) |
| 4:00 PM to 11:59 PM | 57 (7.9%) | 68 (8.3%) |
| Total | 726 (100.0%) | 821 (100.0%) |
Housing Occupancy in Barnesville
Occupancy by Ownership in Barnesville
Of the total 1,440 dwellings in Barnesville, owner-occupied units account for 943 (65.5%), while renter-occupied units make up 497 (34.5%).
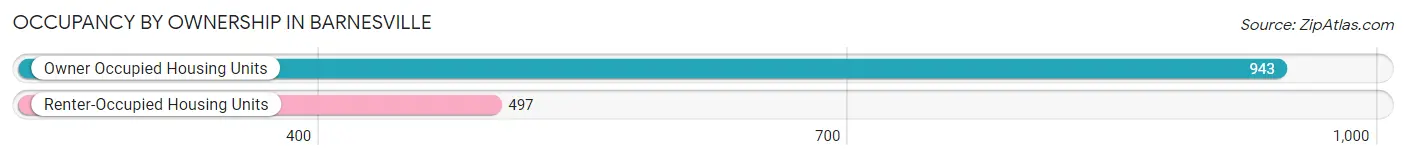
| Occupancy | # Housing Units | % Housing Units |
| Owner Occupied Housing Units | 943 | 65.5% |
| Renter-Occupied Housing Units | 497 | 34.5% |
| Total Occupied Housing Units | 1,440 | 100.0% |
Occupancy by Household Size in Barnesville
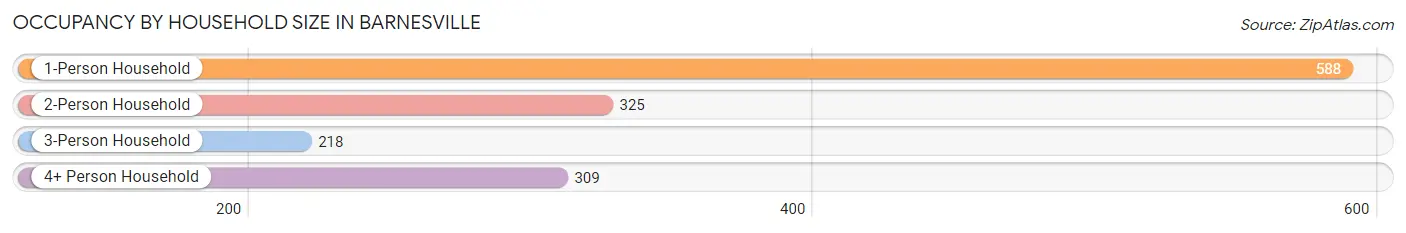
| Household Size | # Housing Units | % Housing Units |
| 1-Person Household | 588 | 40.8% |
| 2-Person Household | 325 | 22.6% |
| 3-Person Household | 218 | 15.1% |
| 4+ Person Household | 309 | 21.5% |
| Total Housing Units | 1,440 | 100.0% |
Occupancy by Ownership by Household Size in Barnesville
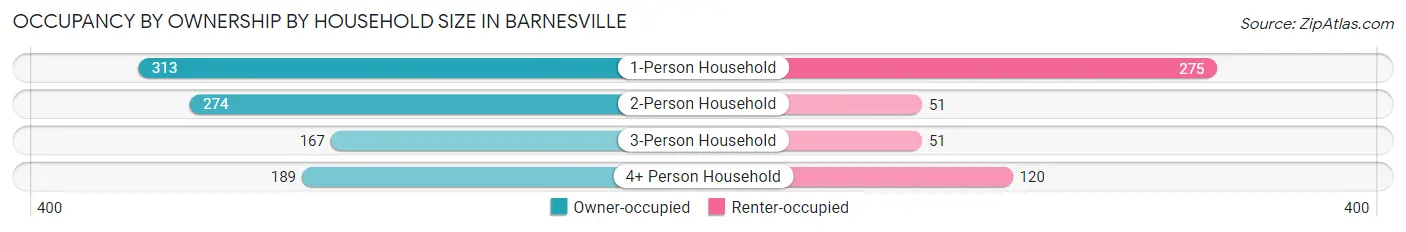
| Household Size | Owner-occupied | Renter-occupied |
| 1-Person Household | 313 (53.2%) | 275 (46.8%) |
| 2-Person Household | 274 (84.3%) | 51 (15.7%) |
| 3-Person Household | 167 (76.6%) | 51 (23.4%) |
| 4+ Person Household | 189 (61.2%) | 120 (38.8%) |
| Total Housing Units | 943 (65.5%) | 497 (34.5%) |
Occupancy by Educational Attainment in Barnesville
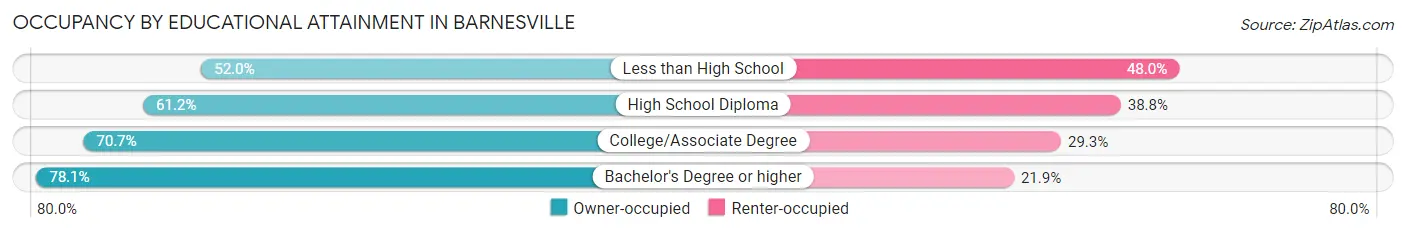
| Household Size | Owner-occupied | Renter-occupied |
| Less than High School | 79 (52.0%) | 73 (48.0%) |
| High School Diploma | 418 (61.2%) | 265 (38.8%) |
| College/Associate Degree | 253 (70.7%) | 105 (29.3%) |
| Bachelor's Degree or higher | 193 (78.1%) | 54 (21.9%) |
Occupancy by Age of Householder in Barnesville
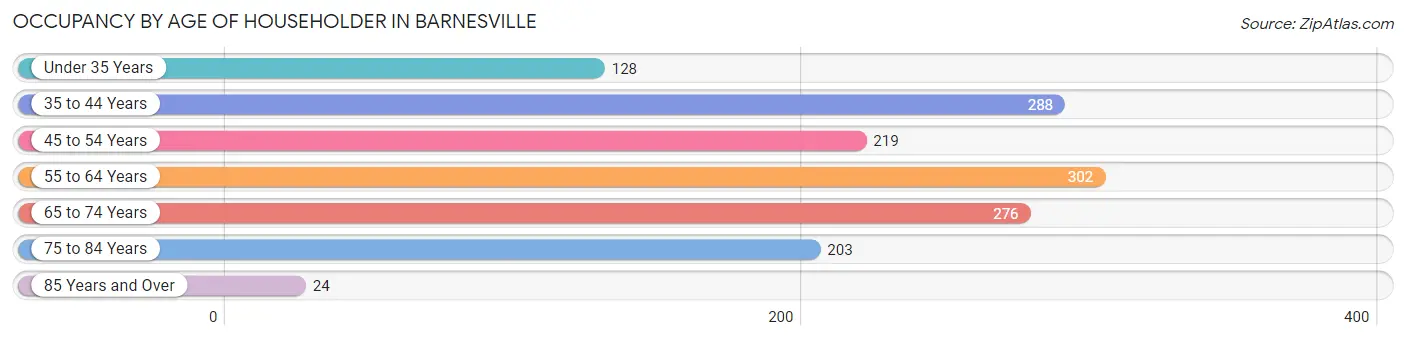
| Age Bracket | # Households | % Households |
| Under 35 Years | 128 | 8.9% |
| 35 to 44 Years | 288 | 20.0% |
| 45 to 54 Years | 219 | 15.2% |
| 55 to 64 Years | 302 | 21.0% |
| 65 to 74 Years | 276 | 19.2% |
| 75 to 84 Years | 203 | 14.1% |
| 85 Years and Over | 24 | 1.7% |
| Total | 1,440 | 100.0% |
Housing Finances in Barnesville
Median Income by Occupancy in Barnesville
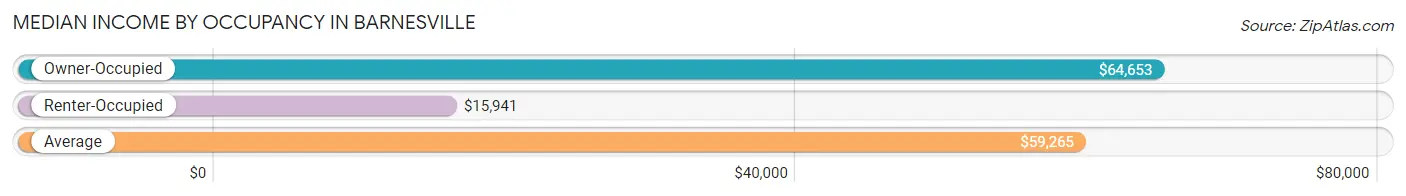
| Occupancy Type | # Households | Median Income |
| Owner-Occupied | 943 (65.5%) | $64,653 |
| Renter-Occupied | 497 (34.5%) | $15,941 |
| Average | 1,440 (100.0%) | $59,265 |
Occupancy by Householder Income Bracket in Barnesville
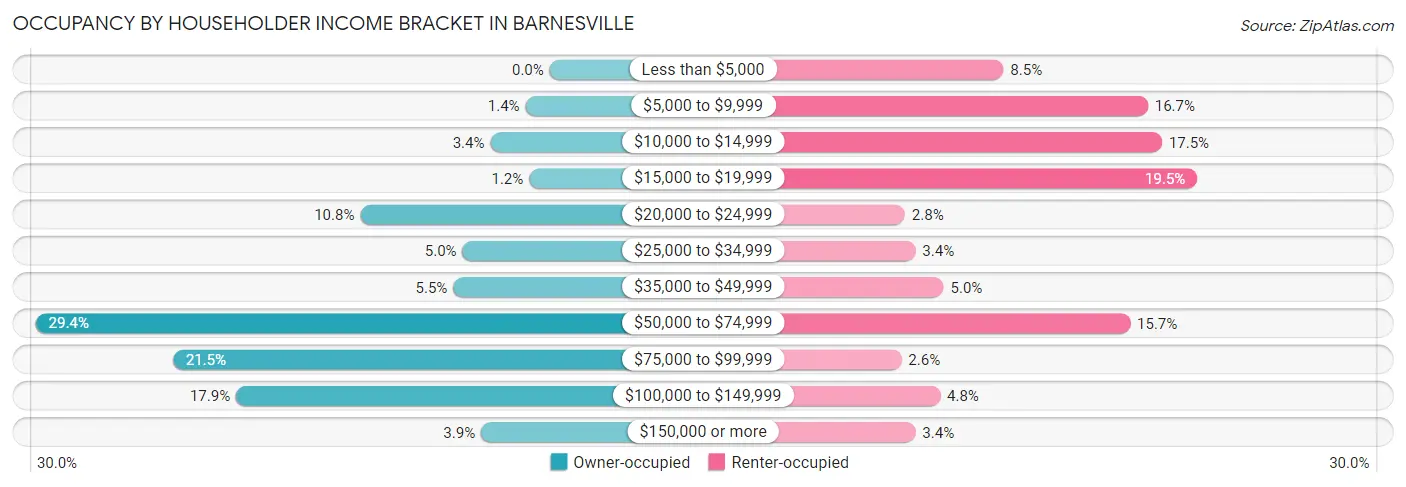
| Income Bracket | Owner-occupied | Renter-occupied |
| Less than $5,000 | 0 (0.0%) | 42 (8.5%) |
| $5,000 to $9,999 | 13 (1.4%) | 83 (16.7%) |
| $10,000 to $14,999 | 32 (3.4%) | 87 (17.5%) |
| $15,000 to $19,999 | 11 (1.2%) | 97 (19.5%) |
| $20,000 to $24,999 | 102 (10.8%) | 14 (2.8%) |
| $25,000 to $34,999 | 47 (5.0%) | 17 (3.4%) |
| $35,000 to $49,999 | 52 (5.5%) | 25 (5.0%) |
| $50,000 to $74,999 | 277 (29.4%) | 78 (15.7%) |
| $75,000 to $99,999 | 203 (21.5%) | 13 (2.6%) |
| $100,000 to $149,999 | 169 (17.9%) | 24 (4.8%) |
| $150,000 or more | 37 (3.9%) | 17 (3.4%) |
| Total | 943 (100.0%) | 497 (100.0%) |
Monthly Housing Cost Tiers in Barnesville
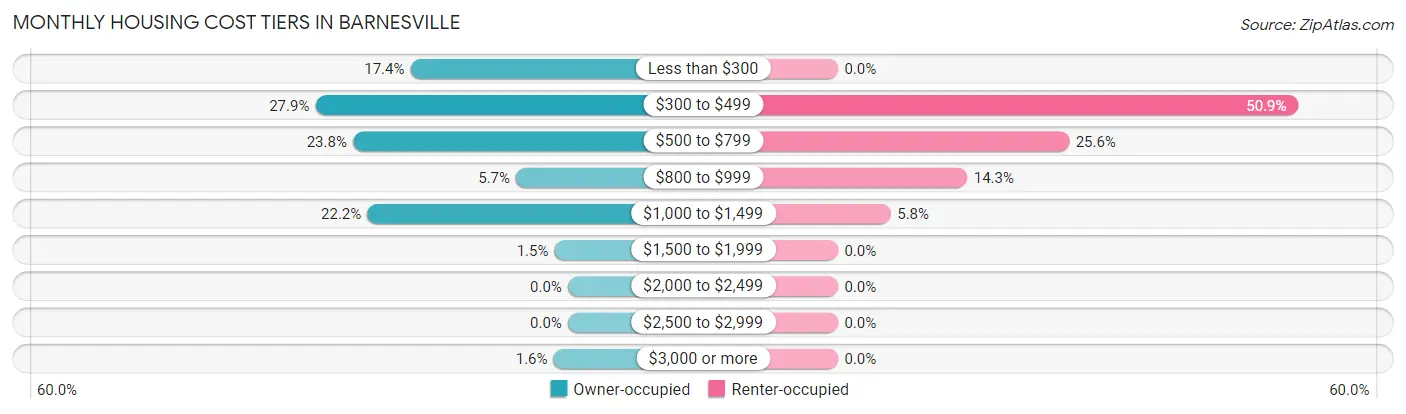
| Monthly Cost | Owner-occupied | Renter-occupied |
| Less than $300 | 164 (17.4%) | 0 (0.0%) |
| $300 to $499 | 263 (27.9%) | 253 (50.9%) |
| $500 to $799 | 224 (23.7%) | 127 (25.6%) |
| $800 to $999 | 54 (5.7%) | 71 (14.3%) |
| $1,000 to $1,499 | 209 (22.2%) | 29 (5.8%) |
| $1,500 to $1,999 | 14 (1.5%) | 0 (0.0%) |
| $2,000 to $2,499 | 0 (0.0%) | 0 (0.0%) |
| $2,500 to $2,999 | 0 (0.0%) | 0 (0.0%) |
| $3,000 or more | 15 (1.6%) | 0 (0.0%) |
| Total | 943 (100.0%) | 497 (100.0%) |
Physical Housing Characteristics in Barnesville
Housing Structures in Barnesville
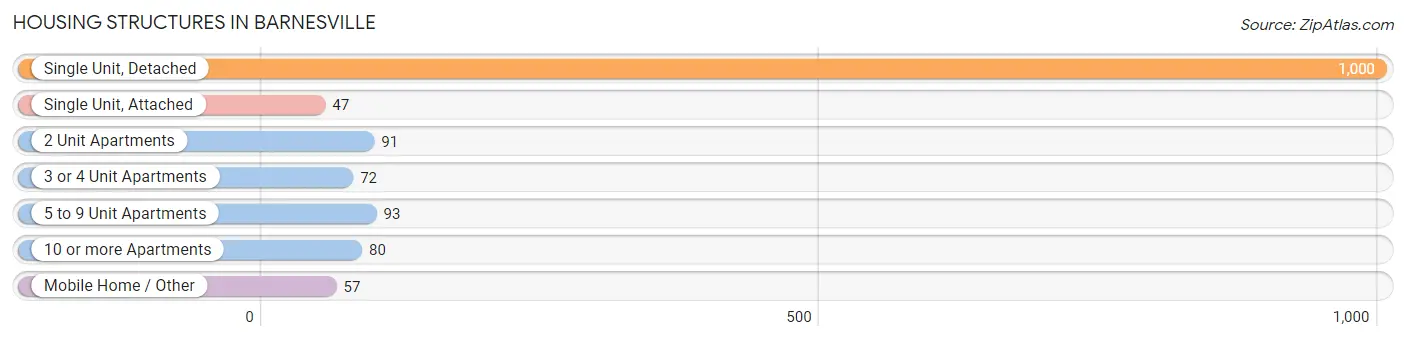
| Structure Type | # Housing Units | % Housing Units |
| Single Unit, Detached | 1,000 | 69.4% |
| Single Unit, Attached | 47 | 3.3% |
| 2 Unit Apartments | 91 | 6.3% |
| 3 or 4 Unit Apartments | 72 | 5.0% |
| 5 to 9 Unit Apartments | 93 | 6.5% |
| 10 or more Apartments | 80 | 5.6% |
| Mobile Home / Other | 57 | 4.0% |
| Total | 1,440 | 100.0% |
Housing Structures by Occupancy in Barnesville
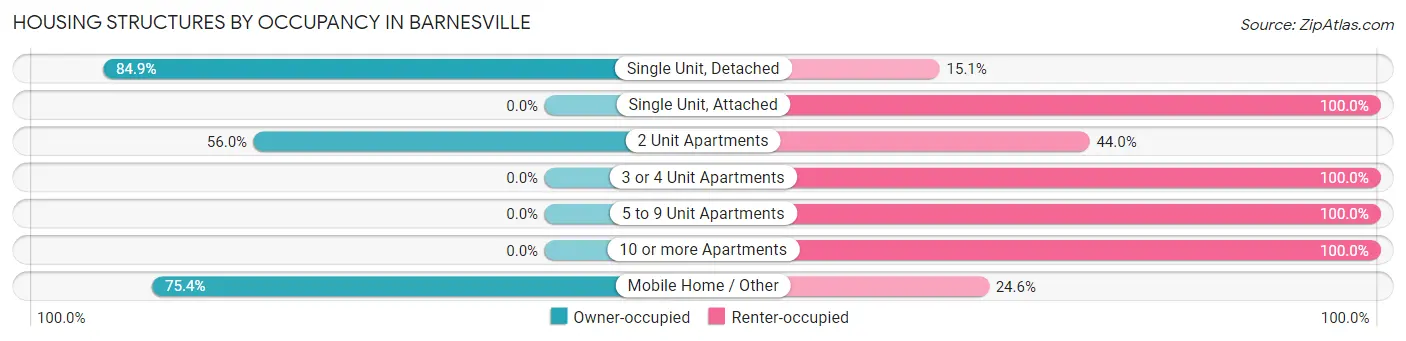
| Structure Type | Owner-occupied | Renter-occupied |
| Single Unit, Detached | 849 (84.9%) | 151 (15.1%) |
| Single Unit, Attached | 0 (0.0%) | 47 (100.0%) |
| 2 Unit Apartments | 51 (56.0%) | 40 (44.0%) |
| 3 or 4 Unit Apartments | 0 (0.0%) | 72 (100.0%) |
| 5 to 9 Unit Apartments | 0 (0.0%) | 93 (100.0%) |
| 10 or more Apartments | 0 (0.0%) | 80 (100.0%) |
| Mobile Home / Other | 43 (75.4%) | 14 (24.6%) |
| Total | 943 (65.5%) | 497 (34.5%) |
Housing Structures by Number of Rooms in Barnesville
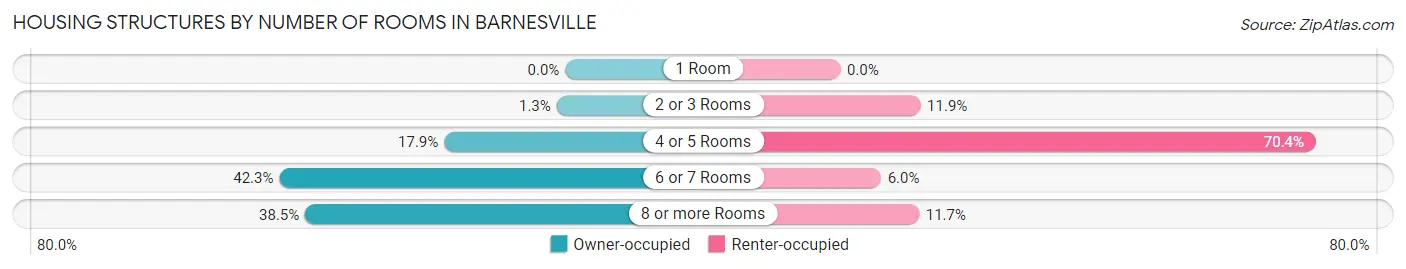
| Number of Rooms | Owner-occupied | Renter-occupied |
| 1 Room | 0 (0.0%) | 0 (0.0%) |
| 2 or 3 Rooms | 12 (1.3%) | 59 (11.9%) |
| 4 or 5 Rooms | 169 (17.9%) | 350 (70.4%) |
| 6 or 7 Rooms | 399 (42.3%) | 30 (6.0%) |
| 8 or more Rooms | 363 (38.5%) | 58 (11.7%) |
| Total | 943 (100.0%) | 497 (100.0%) |
Housing Structure by Heating Type in Barnesville
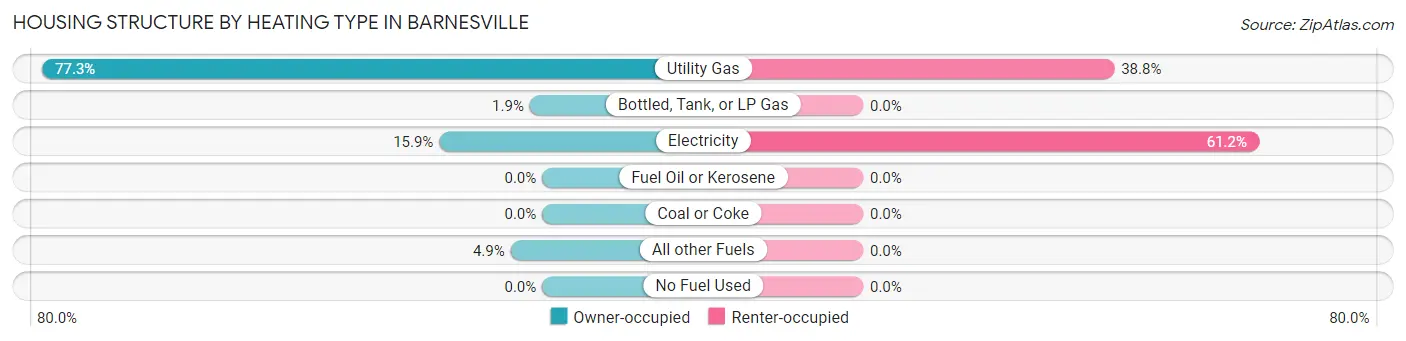
| Heating Type | Owner-occupied | Renter-occupied |
| Utility Gas | 729 (77.3%) | 193 (38.8%) |
| Bottled, Tank, or LP Gas | 18 (1.9%) | 0 (0.0%) |
| Electricity | 150 (15.9%) | 304 (61.2%) |
| Fuel Oil or Kerosene | 0 (0.0%) | 0 (0.0%) |
| Coal or Coke | 0 (0.0%) | 0 (0.0%) |
| All other Fuels | 46 (4.9%) | 0 (0.0%) |
| No Fuel Used | 0 (0.0%) | 0 (0.0%) |
| Total | 943 (100.0%) | 497 (100.0%) |
Household Vehicle Usage in Barnesville
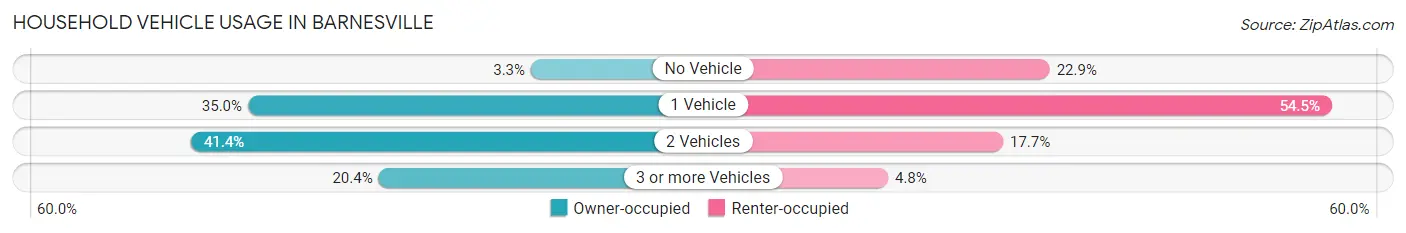
| Vehicles per Household | Owner-occupied | Renter-occupied |
| No Vehicle | 31 (3.3%) | 114 (22.9%) |
| 1 Vehicle | 330 (35.0%) | 271 (54.5%) |
| 2 Vehicles | 390 (41.4%) | 88 (17.7%) |
| 3 or more Vehicles | 192 (20.4%) | 24 (4.8%) |
| Total | 943 (100.0%) | 497 (100.0%) |
Real Estate & Mortgages in Barnesville
Real Estate and Mortgage Overview in Barnesville
| Characteristic | Without Mortgage | With Mortgage |
| Housing Units | 511 | 432 |
| Median Property Value | $87,700 | $108,500 |
| Median Household Income | $60,154 | $15 |
| Monthly Housing Costs | $381 | $15 |
| Real Estate Taxes | $880 | $16 |
Property Value by Mortgage Status in Barnesville
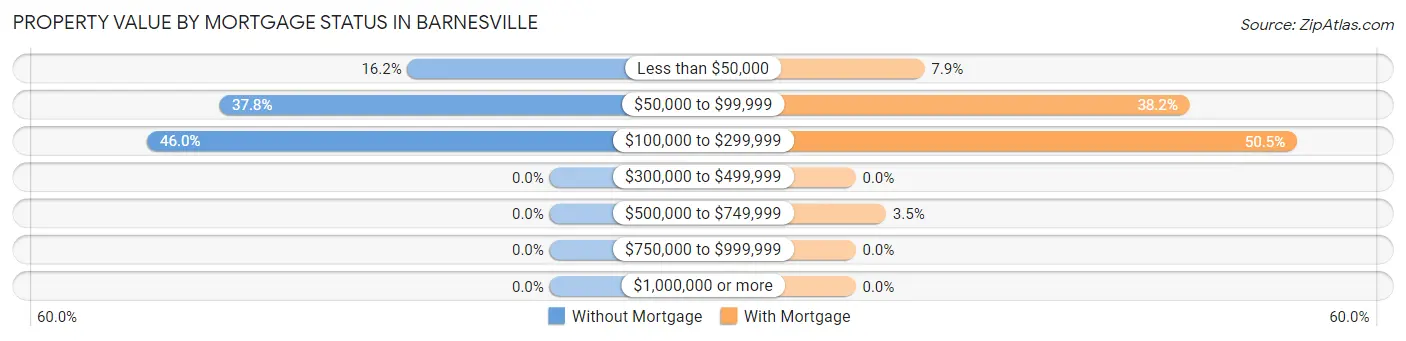
| Property Value | Without Mortgage | With Mortgage |
| Less than $50,000 | 83 (16.2%) | 34 (7.9%) |
| $50,000 to $99,999 | 193 (37.8%) | 165 (38.2%) |
| $100,000 to $299,999 | 235 (46.0%) | 218 (50.5%) |
| $300,000 to $499,999 | 0 (0.0%) | 0 (0.0%) |
| $500,000 to $749,999 | 0 (0.0%) | 15 (3.5%) |
| $750,000 to $999,999 | 0 (0.0%) | 0 (0.0%) |
| $1,000,000 or more | 0 (0.0%) | 0 (0.0%) |
| Total | 511 (100.0%) | 432 (100.0%) |
Household Income by Mortgage Status in Barnesville
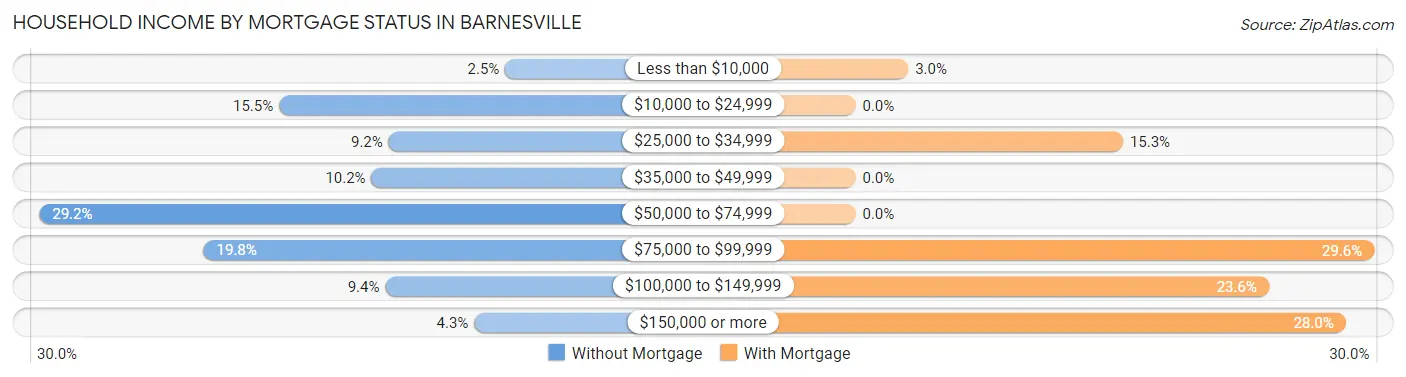
| Household Income | Without Mortgage | With Mortgage |
| Less than $10,000 | 13 (2.5%) | 13 (3.0%) |
| $10,000 to $24,999 | 79 (15.5%) | 0 (0.0%) |
| $25,000 to $34,999 | 47 (9.2%) | 66 (15.3%) |
| $35,000 to $49,999 | 52 (10.2%) | 0 (0.0%) |
| $50,000 to $74,999 | 149 (29.2%) | 0 (0.0%) |
| $75,000 to $99,999 | 101 (19.8%) | 128 (29.6%) |
| $100,000 to $149,999 | 48 (9.4%) | 102 (23.6%) |
| $150,000 or more | 22 (4.3%) | 121 (28.0%) |
| Total | 511 (100.0%) | 432 (100.0%) |
Property Value to Household Income Ratio in Barnesville
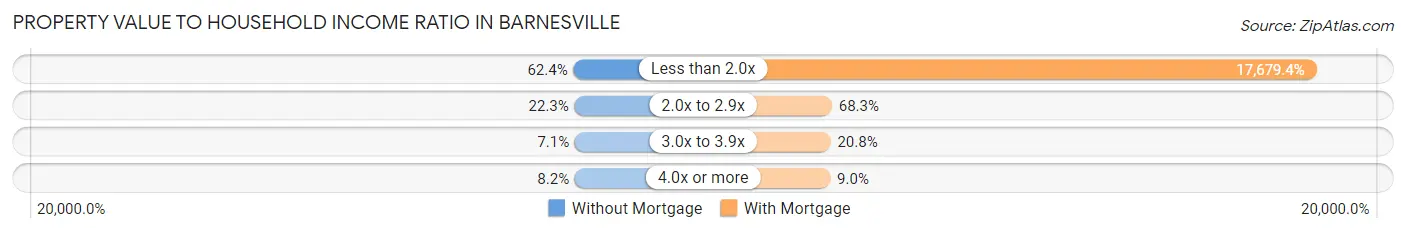
| Value-to-Income Ratio | Without Mortgage | With Mortgage |
| Less than 2.0x | 319 (62.4%) | 76,375 (17,679.4%) |
| 2.0x to 2.9x | 114 (22.3%) | 295 (68.3%) |
| 3.0x to 3.9x | 36 (7.0%) | 90 (20.8%) |
| 4.0x or more | 42 (8.2%) | 39 (9.0%) |
| Total | 511 (100.0%) | 432 (100.0%) |
Real Estate Taxes by Mortgage Status in Barnesville
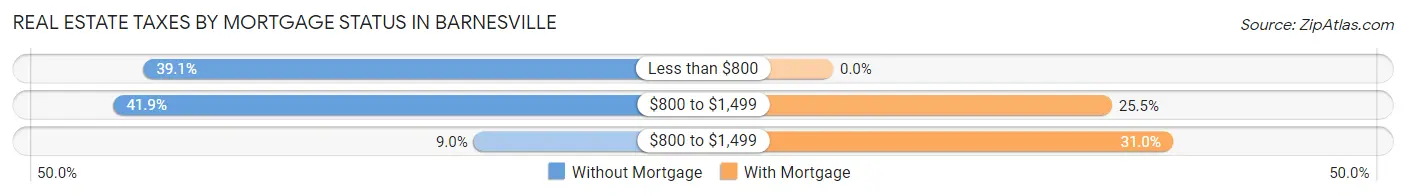
| Property Taxes | Without Mortgage | With Mortgage |
| Less than $800 | 200 (39.1%) | 0 (0.0%) |
| $800 to $1,499 | 214 (41.9%) | 110 (25.5%) |
| $800 to $1,499 | 46 (9.0%) | 134 (31.0%) |
| Total | 511 (100.0%) | 432 (100.0%) |
Health & Disability in Barnesville
Health Insurance Coverage by Age in Barnesville
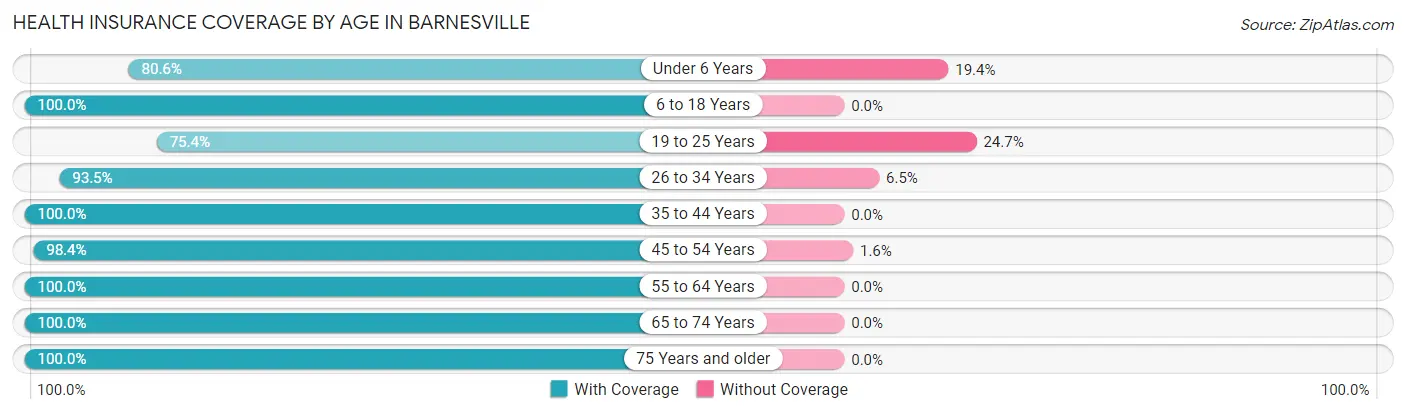
| Age Bracket | With Coverage | Without Coverage |
| Under 6 Years | 187 (80.6%) | 45 (19.4%) |
| 6 to 18 Years | 700 (100.0%) | 0 (0.0%) |
| 19 to 25 Years | 162 (75.3%) | 53 (24.6%) |
| 26 to 34 Years | 346 (93.5%) | 24 (6.5%) |
| 35 to 44 Years | 420 (100.0%) | 0 (0.0%) |
| 45 to 54 Years | 544 (98.4%) | 9 (1.6%) |
| 55 to 64 Years | 449 (100.0%) | 0 (0.0%) |
| 65 to 74 Years | 334 (100.0%) | 0 (0.0%) |
| 75 Years and older | 293 (100.0%) | 0 (0.0%) |
| Total | 3,435 (96.3%) | 131 (3.7%) |
Health Insurance Coverage by Citizenship Status in Barnesville
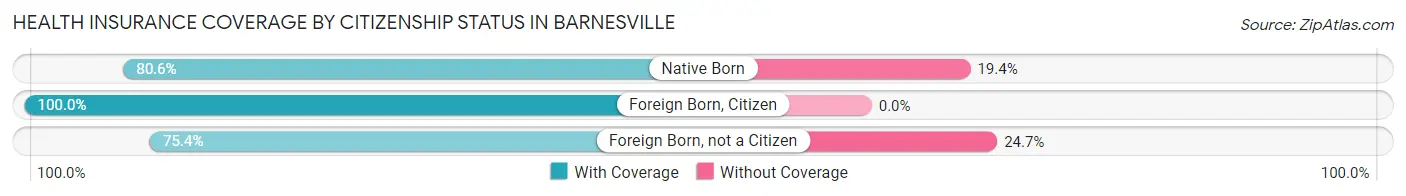
| Citizenship Status | With Coverage | Without Coverage |
| Native Born | 187 (80.6%) | 45 (19.4%) |
| Foreign Born, Citizen | 700 (100.0%) | 0 (0.0%) |
| Foreign Born, not a Citizen | 162 (75.3%) | 53 (24.6%) |
Health Insurance Coverage by Household Income in Barnesville
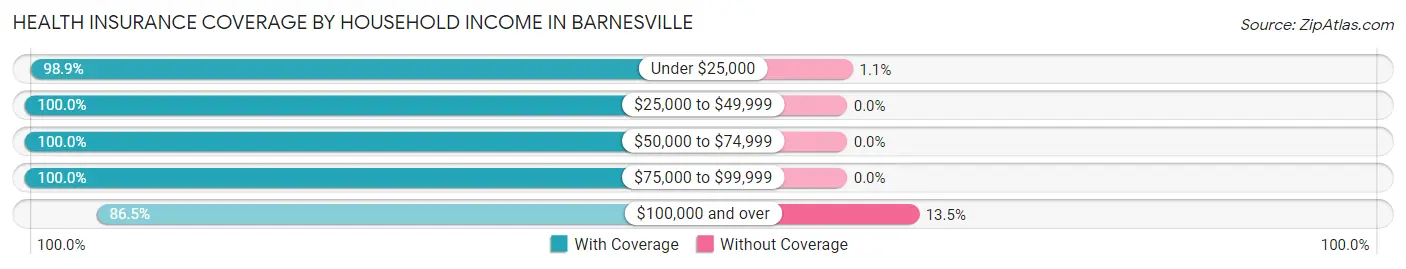
| Household Income | With Coverage | Without Coverage |
| Under $25,000 | 834 (98.9%) | 9 (1.1%) |
| $25,000 to $49,999 | 318 (100.0%) | 0 (0.0%) |
| $50,000 to $74,999 | 895 (100.0%) | 0 (0.0%) |
| $75,000 to $99,999 | 583 (100.0%) | 0 (0.0%) |
| $100,000 and over | 783 (86.5%) | 122 (13.5%) |
Public vs Private Health Insurance Coverage by Age in Barnesville
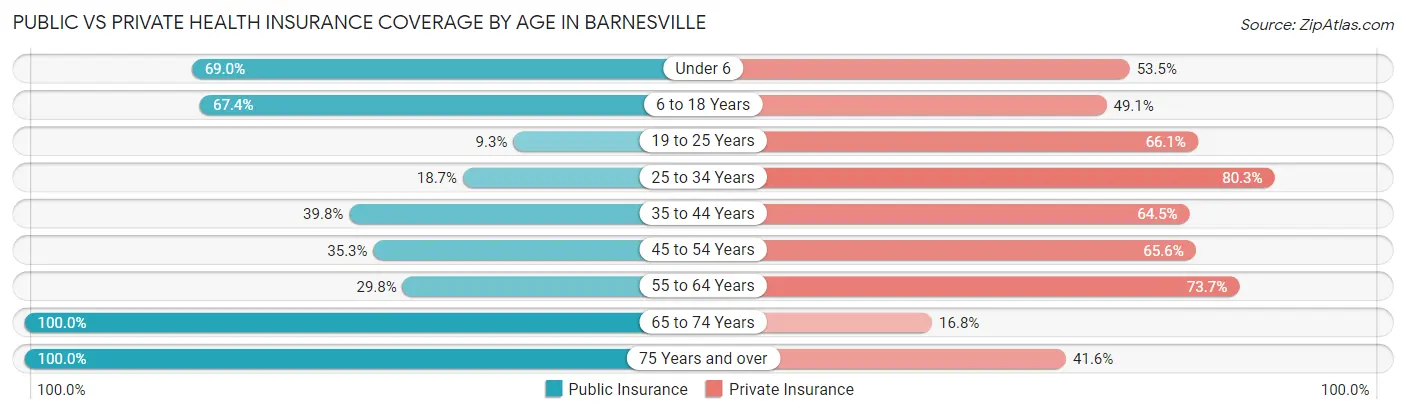
| Age Bracket | Public Insurance | Private Insurance |
| Under 6 | 160 (69.0%) | 124 (53.4%) |
| 6 to 18 Years | 472 (67.4%) | 344 (49.1%) |
| 19 to 25 Years | 20 (9.3%) | 142 (66.0%) |
| 25 to 34 Years | 69 (18.6%) | 297 (80.3%) |
| 35 to 44 Years | 167 (39.8%) | 271 (64.5%) |
| 45 to 54 Years | 195 (35.3%) | 363 (65.6%) |
| 55 to 64 Years | 134 (29.8%) | 331 (73.7%) |
| 65 to 74 Years | 334 (100.0%) | 56 (16.8%) |
| 75 Years and over | 293 (100.0%) | 122 (41.6%) |
| Total | 1,844 (51.7%) | 2,050 (57.5%) |
Disability Status by Sex by Age in Barnesville
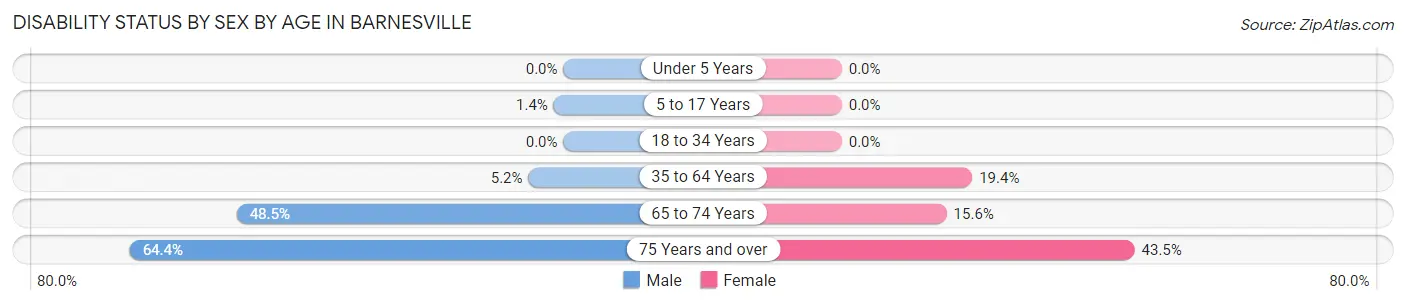
| Age Bracket | Male | Female |
| Under 5 Years | 0 (0.0%) | 0 (0.0%) |
| 5 to 17 Years | 6 (1.4%) | 0 (0.0%) |
| 18 to 34 Years | 0 (0.0%) | 0 (0.0%) |
| 35 to 64 Years | 31 (5.2%) | 160 (19.4%) |
| 65 to 74 Years | 81 (48.5%) | 26 (15.6%) |
| 75 Years and over | 85 (64.4%) | 70 (43.5%) |
Disability Class by Sex by Age in Barnesville
Disability Class: Hearing Difficulty
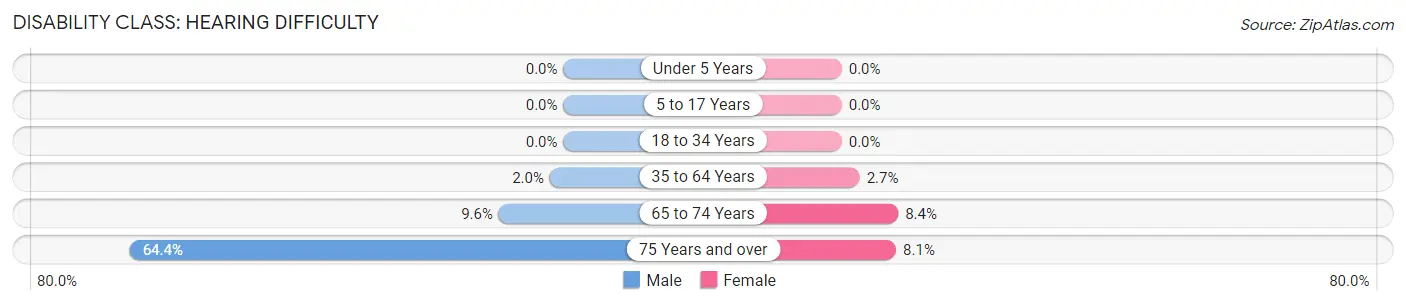
| Age Bracket | Male | Female |
| Under 5 Years | 0 (0.0%) | 0 (0.0%) |
| 5 to 17 Years | 0 (0.0%) | 0 (0.0%) |
| 18 to 34 Years | 0 (0.0%) | 0 (0.0%) |
| 35 to 64 Years | 12 (2.0%) | 22 (2.7%) |
| 65 to 74 Years | 16 (9.6%) | 14 (8.4%) |
| 75 Years and over | 85 (64.4%) | 13 (8.1%) |
Disability Class: Vision Difficulty
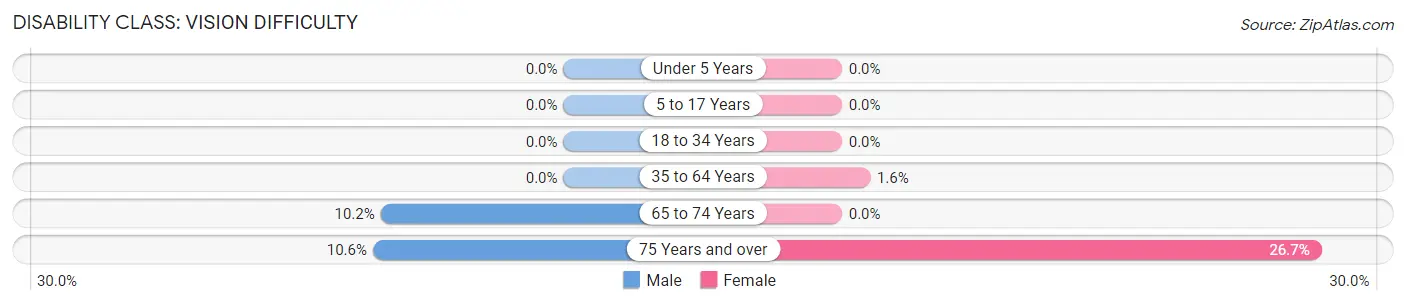
| Age Bracket | Male | Female |
| Under 5 Years | 0 (0.0%) | 0 (0.0%) |
| 5 to 17 Years | 0 (0.0%) | 0 (0.0%) |
| 18 to 34 Years | 0 (0.0%) | 0 (0.0%) |
| 35 to 64 Years | 0 (0.0%) | 13 (1.6%) |
| 65 to 74 Years | 17 (10.2%) | 0 (0.0%) |
| 75 Years and over | 14 (10.6%) | 43 (26.7%) |
Disability Class: Cognitive Difficulty
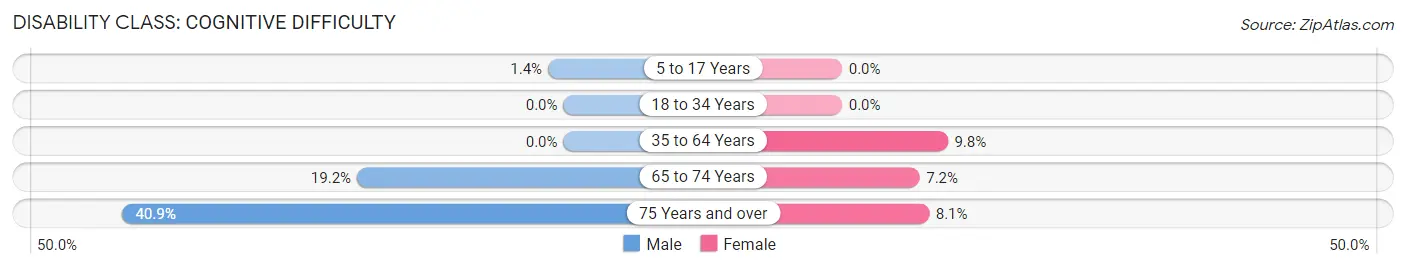
| Age Bracket | Male | Female |
| 5 to 17 Years | 6 (1.4%) | 0 (0.0%) |
| 18 to 34 Years | 0 (0.0%) | 0 (0.0%) |
| 35 to 64 Years | 0 (0.0%) | 81 (9.8%) |
| 65 to 74 Years | 32 (19.2%) | 12 (7.2%) |
| 75 Years and over | 54 (40.9%) | 13 (8.1%) |
Disability Class: Ambulatory Difficulty
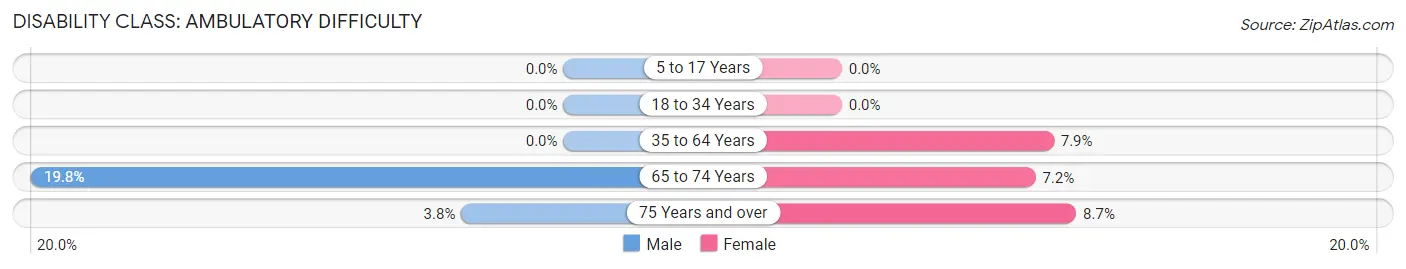
| Age Bracket | Male | Female |
| 5 to 17 Years | 0 (0.0%) | 0 (0.0%) |
| 18 to 34 Years | 0 (0.0%) | 0 (0.0%) |
| 35 to 64 Years | 0 (0.0%) | 65 (7.9%) |
| 65 to 74 Years | 33 (19.8%) | 12 (7.2%) |
| 75 Years and over | 5 (3.8%) | 14 (8.7%) |
Disability Class: Self-Care Difficulty
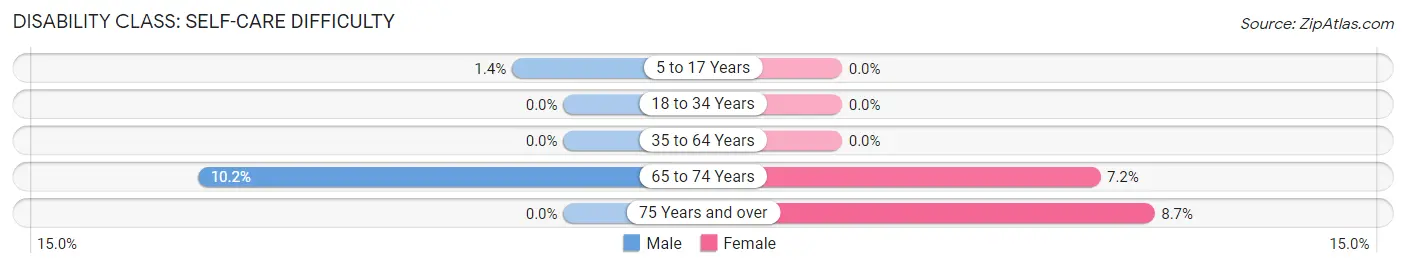
| Age Bracket | Male | Female |
| 5 to 17 Years | 6 (1.4%) | 0 (0.0%) |
| 18 to 34 Years | 0 (0.0%) | 0 (0.0%) |
| 35 to 64 Years | 0 (0.0%) | 0 (0.0%) |
| 65 to 74 Years | 17 (10.2%) | 12 (7.2%) |
| 75 Years and over | 0 (0.0%) | 14 (8.7%) |
Technology Access in Barnesville
Computing Device Access in Barnesville
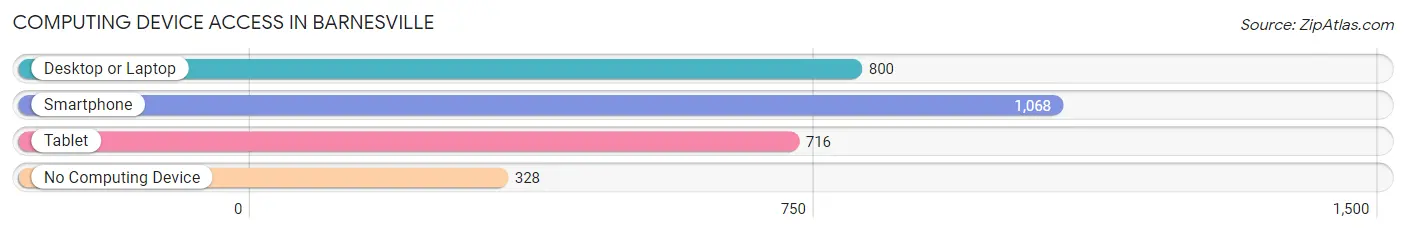
| Device Type | # Households | % Households |
| Desktop or Laptop | 800 | 55.6% |
| Smartphone | 1,068 | 74.2% |
| Tablet | 716 | 49.7% |
| No Computing Device | 328 | 22.8% |
| Total | 1,440 | 100.0% |
Internet Access in Barnesville
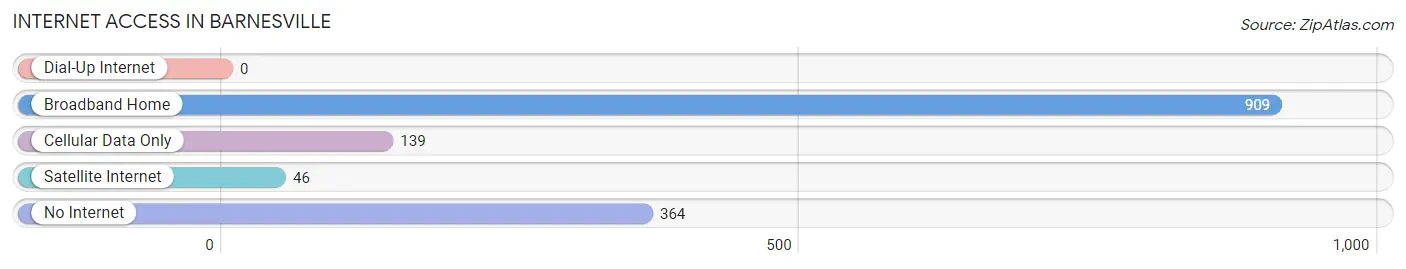
| Internet Type | # Households | % Households |
| Dial-Up Internet | 0 | 0.0% |
| Broadband Home | 909 | 63.1% |
| Cellular Data Only | 139 | 9.7% |
| Satellite Internet | 46 | 3.2% |
| No Internet | 364 | 25.3% |
| Total | 1,440 | 100.0% |
Barnesville Summary
Barnesville, Ohio is a small village located in Belmont County, Ohio. It is situated in the Appalachian foothills of eastern Ohio, approximately 50 miles east of the state capital of Columbus. The village has a population of approximately 3,000 people and is part of the larger Barnesville-St. Clairsville metropolitan area.
History
Barnesville was founded in 1817 by a group of settlers from Pennsylvania. The village was named after the nearby Barnesville Creek, which was named after the family of William Barns, one of the original settlers. The village was incorporated in 1832 and has remained a small, rural community ever since.
The village was an important stop on the Underground Railroad, with many of the local residents helping to hide and transport escaped slaves. During the Civil War, the village was the site of a major battle between Union and Confederate forces.
Geography
Barnesville is located in the Appalachian foothills of eastern Ohio, approximately 50 miles east of the state capital of Columbus. The village is situated in a valley between two hills, with the Barnesville Creek running through the center of the village. The village is surrounded by rolling hills and farmland, with the nearby Ohio River providing a scenic backdrop.
The village is located in a humid continental climate zone, with hot summers and cold winters. The average annual temperature is around 50 degrees Fahrenheit, with an average annual precipitation of around 40 inches.
Economy
The economy of Barnesville is largely based on agriculture and manufacturing. The village is home to several small businesses, including a number of farms, a lumber mill, and a few small manufacturing plants. The village also has a number of retail stores, restaurants, and other services.
The village is also home to a number of educational institutions, including a community college, a technical college, and a number of public and private schools.
Demographics
As of the 2010 census, the population of Barnesville was 3,000 people. The racial makeup of the village was 97.3% White, 0.7% African American, 0.3% Native American, 0.3% Asian, and 1.4% from other races. The median household income was $37,500, and the median family income was $45,000.
The village is home to a number of churches, including the First United Methodist Church, the First Presbyterian Church, and the Church of the Nazarene. The village also has a number of civic organizations, including the Barnesville Lions Club, the Barnesville Rotary Club, and the Barnesville Historical Society.
Conclusion
Barnesville, Ohio is a small village located in Belmont County, Ohio. It is situated in the Appalachian foothills of eastern Ohio, approximately 50 miles east of the state capital of Columbus. The village has a population of approximately 3,000 people and is part of the larger Barnesville-St. Clairsville metropolitan area. The village was founded in 1817 and has remained a small, rural community ever since. The economy of Barnesville is largely based on agriculture and manufacturing, and the village is home to a number of educational institutions, churches, and civic organizations. The racial makeup of the village is 97.3% White, 0.7% African American, 0.3% Native American, 0.3% Asian, and 1.4% from other races. The median household income was $37,500, and the median family income was $45,000. Barnesville is a small, rural community with a rich history and a vibrant economy.
Common Questions
What is Per Capita Income in Barnesville?
Per Capita income in Barnesville is $25,856.
What is the Median Family Income in Barnesville?
Median Family Income in Barnesville is $64,005.
What is the Median Household income in Barnesville?
Median Household Income in Barnesville is $59,265.
What is Income or Wage Gap in Barnesville?
Income or Wage Gap in Barnesville is 66.3%.
Women in Barnesville earn 33.7 cents for every dollar earned by a man.
What is Inequality or Gini Index in Barnesville?
Inequality or Gini Index in Barnesville is 0.42.
What is the Total Population of Barnesville?
Total Population of Barnesville is 3,713.
What is the Total Male Population of Barnesville?
Total Male Population of Barnesville is 1,727.
What is the Total Female Population of Barnesville?
Total Female Population of Barnesville is 1,986.
What is the Ratio of Males per 100 Females in Barnesville?
There are 86.96 Males per 100 Females in Barnesville.
What is the Ratio of Females per 100 Males in Barnesville?
There are 115.00 Females per 100 Males in Barnesville.
What is the Median Population Age in Barnesville?
Median Population Age in Barnesville is 41.6 Years.
What is the Average Family Size in Barnesville
Average Family Size in Barnesville is 3.4 People.
What is the Average Household Size in Barnesville
Average Household Size in Barnesville is 2.5 People.
How Large is the Labor Force in Barnesville?
There are 1,666 People in the Labor Forcein in Barnesville.
What is the Percentage of People in the Labor Force in Barnesville?
56.3% of People are in the Labor Force in Barnesville.
What is the Unemployment Rate in Barnesville?
Unemployment Rate in Barnesville is 2.5%.