Baltimore, OH Map & Demographics
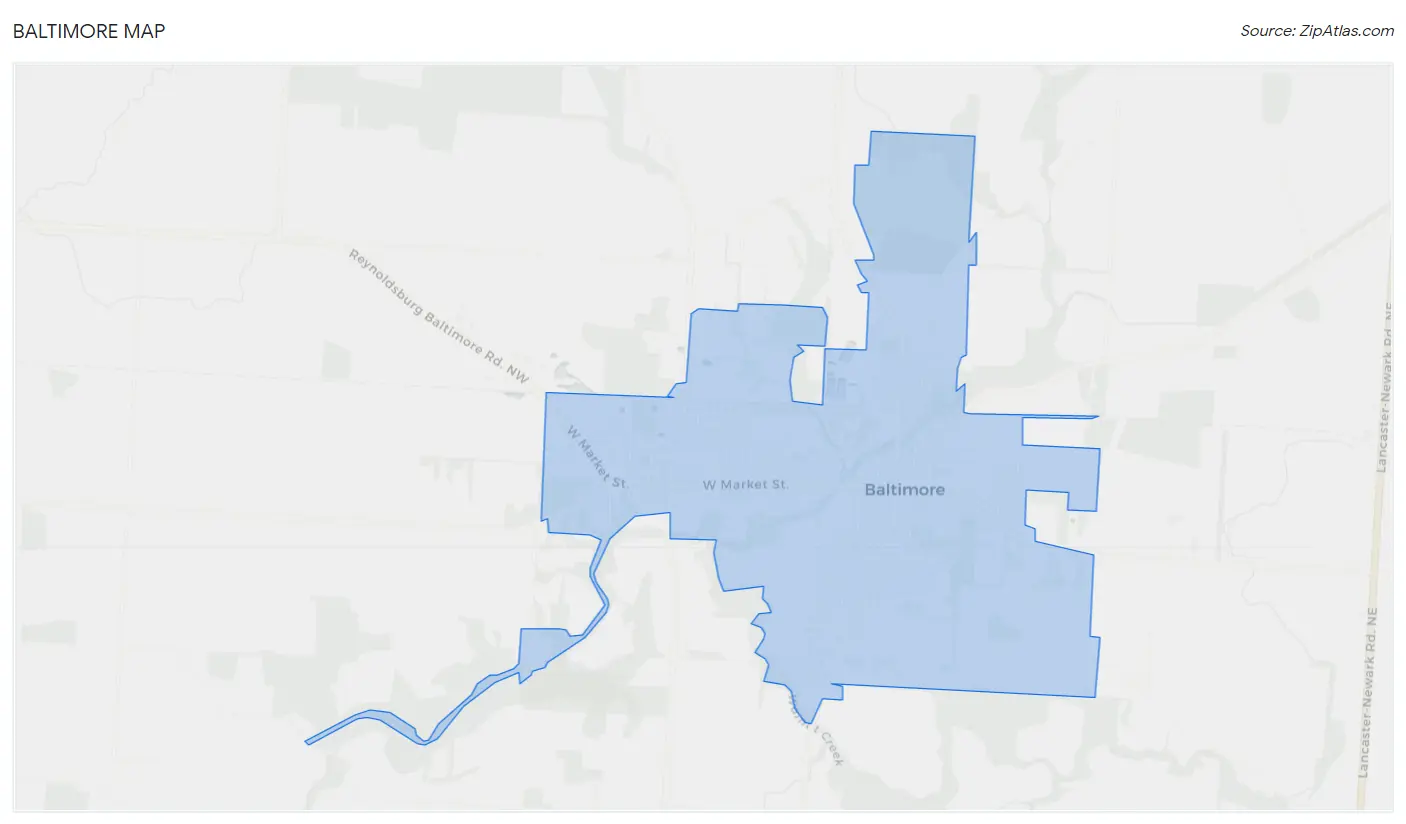
Baltimore Map
Baltimore Overview
$28,294
PER CAPITA INCOME
$74,375
AVG FAMILY INCOME
$55,121
AVG HOUSEHOLD INCOME
18.2%
WAGE / INCOME GAP [ % ]
81.8¢/ $1
WAGE / INCOME GAP [ $ ]
0.46
INEQUALITY / GINI INDEX
2,968
TOTAL POPULATION
1,495
MALE POPULATION
1,473
FEMALE POPULATION
101.49
MALES / 100 FEMALES
98.53
FEMALES / 100 MALES
33.4
MEDIAN AGE
3.0
AVG FAMILY SIZE
2.3
AVG HOUSEHOLD SIZE
1,394
LABOR FORCE [ PEOPLE ]
60.4%
PERCENT IN LABOR FORCE
6.5%
UNEMPLOYMENT RATE
Baltimore Zip Codes
Baltimore Area Codes
Income in Baltimore
Income Overview in Baltimore
Per Capita Income in Baltimore is $28,294, while median incomes of families and households are $74,375 and $55,121 respectively.
| Characteristic | Number | Measure |
| Per Capita Income | 2,968 | $28,294 |
| Median Family Income | 667 | $74,375 |
| Mean Family Income | 667 | $86,168 |
| Median Household Income | 1,316 | $55,121 |
| Mean Household Income | 1,316 | $63,225 |
| Income Deficit | 667 | $0 |
| Wage / Income Gap (%) | 2,968 | 18.18% |
| Wage / Income Gap ($) | 2,968 | 81.82¢ per $1 |
| Gini / Inequality Index | 2,968 | 0.46 |
Earnings by Sex in Baltimore
Average Earnings in Baltimore are $34,773, $40,642 for men and $33,254 for women, a difference of 18.2%.
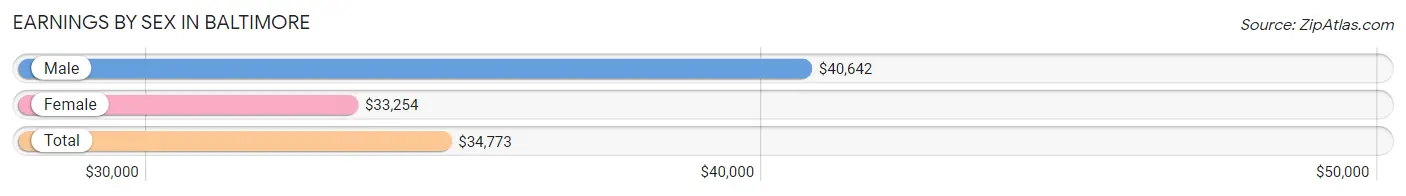
| Sex | Number | Average Earnings |
| Male | 735 (46.9%) | $40,642 |
| Female | 831 (53.1%) | $33,254 |
| Total | 1,566 (100.0%) | $34,773 |
Earnings by Sex by Income Bracket in Baltimore
The most common earnings brackets in Baltimore are $40,000 to $44,999 for men (97 | 13.2%) and $2,499 or less for women (135 | 16.3%).
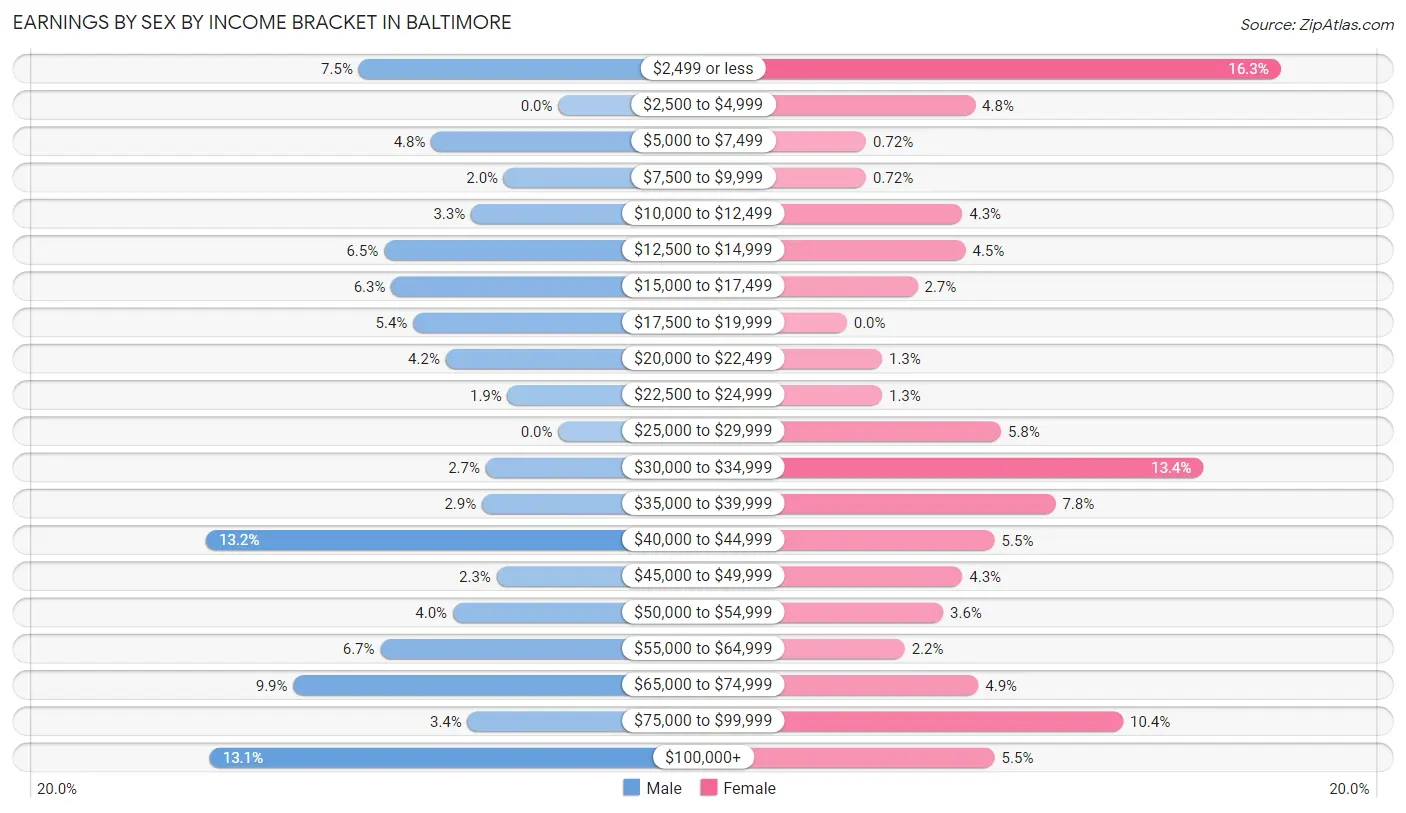
| Income | Male | Female |
| $2,499 or less | 55 (7.5%) | 135 (16.3%) |
| $2,500 to $4,999 | 0 (0.0%) | 40 (4.8%) |
| $5,000 to $7,499 | 35 (4.8%) | 6 (0.7%) |
| $7,500 to $9,999 | 15 (2.0%) | 6 (0.7%) |
| $10,000 to $12,499 | 24 (3.3%) | 36 (4.3%) |
| $12,500 to $14,999 | 48 (6.5%) | 37 (4.4%) |
| $15,000 to $17,499 | 46 (6.3%) | 22 (2.6%) |
| $17,500 to $19,999 | 40 (5.4%) | 0 (0.0%) |
| $20,000 to $22,499 | 31 (4.2%) | 11 (1.3%) |
| $22,500 to $24,999 | 14 (1.9%) | 11 (1.3%) |
| $25,000 to $29,999 | 0 (0.0%) | 48 (5.8%) |
| $30,000 to $34,999 | 20 (2.7%) | 111 (13.4%) |
| $35,000 to $39,999 | 21 (2.9%) | 65 (7.8%) |
| $40,000 to $44,999 | 97 (13.2%) | 46 (5.5%) |
| $45,000 to $49,999 | 17 (2.3%) | 36 (4.3%) |
| $50,000 to $54,999 | 29 (4.0%) | 30 (3.6%) |
| $55,000 to $64,999 | 49 (6.7%) | 18 (2.2%) |
| $65,000 to $74,999 | 73 (9.9%) | 41 (4.9%) |
| $75,000 to $99,999 | 25 (3.4%) | 86 (10.3%) |
| $100,000+ | 96 (13.1%) | 46 (5.5%) |
| Total | 735 (100.0%) | 831 (100.0%) |
Earnings by Sex by Educational Attainment in Baltimore
Average earnings in Baltimore are $42,188 for men and $38,519 for women, a difference of 8.7%. Men with an educational attainment of bachelor's degree enjoy the highest average annual earnings of $63,750, while those with college or associate's degree education earn the least with $40,000. Women with an educational attainment of graduate degree earn the most with the average annual earnings of $91,250, while those with high school diploma education have the smallest earnings of $33,008.
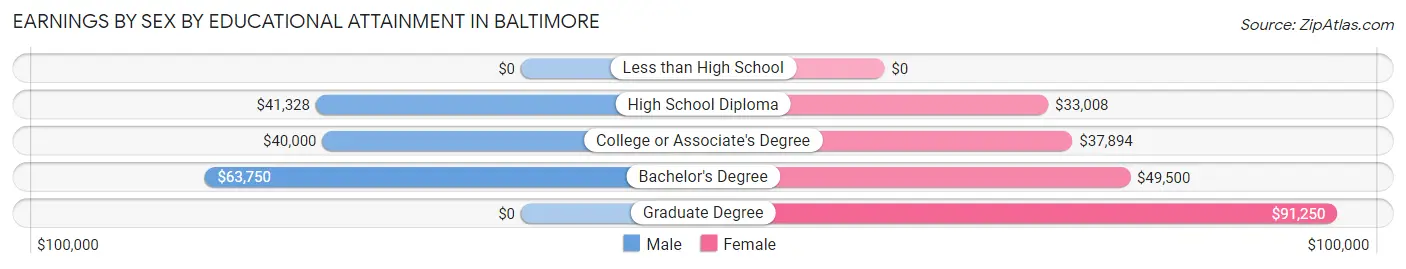
| Educational Attainment | Male Income | Female Income |
| Less than High School | - | - |
| High School Diploma | $41,328 | $33,008 |
| College or Associate's Degree | $40,000 | $37,894 |
| Bachelor's Degree | $63,750 | $49,500 |
| Graduate Degree | - | - |
| Total | $42,188 | $38,519 |
Family Income in Baltimore
Family Income Brackets in Baltimore
According to the Baltimore family income data, there are 162 families falling into the $50,000 to $74,999 income range, which is the most common income bracket and makes up 24.3% of all families. Conversely, the $15,000 to $24,999 income bracket is the least frequent group with only 16 families (2.4%) belonging to this category.
| Income Bracket | # Families | % Families |
| Less than $10,000 | 48 | 7.2% |
| $10,000 to $14,999 | 27 | 4.0% |
| $15,000 to $24,999 | 16 | 2.4% |
| $25,000 to $34,999 | 52 | 7.8% |
| $35,000 to $49,999 | 32 | 4.8% |
| $50,000 to $74,999 | 162 | 24.3% |
| $75,000 to $99,999 | 89 | 13.3% |
| $100,000 to $149,999 | 79 | 11.8% |
| $150,000 to $199,999 | 139 | 20.8% |
| $200,000+ | 23 | 3.4% |
Family Income by Famaliy Size in Baltimore
6-person families (32 | 4.8%) account for the highest median family income in Baltimore with $129,853 per family, while 3-person families (187 | 28.0%) have the highest median income of $42,313 per family member.
| Income Bracket | # Families | Median Income |
| 2-Person Families | 304 (45.6%) | $56,413 |
| 3-Person Families | 187 (28.0%) | $126,938 |
| 4-Person Families | 99 (14.8%) | $94,732 |
| 5-Person Families | 35 (5.2%) | $0 |
| 6-Person Families | 32 (4.8%) | $129,853 |
| 7+ Person Families | 10 (1.5%) | $0 |
| Total | 667 (100.0%) | $74,375 |
Family Income by Number of Earners in Baltimore
| Number of Earners | # Families | Median Income |
| No Earners | 101 (15.1%) | $0 |
| 1 Earner | 148 (22.2%) | $67,368 |
| 2 Earners | 364 (54.6%) | $100,333 |
| 3+ Earners | 54 (8.1%) | $77,381 |
| Total | 667 (100.0%) | $74,375 |
Household Income in Baltimore
Household Income Brackets in Baltimore
With 251 households falling in the category, the $50,000 to $74,999 income range is the most frequent in Baltimore, accounting for 19.1% of all households. In contrast, only 22 households (1.7%) fall into the $200,000+ income bracket, making it the least populous group.
| Income Bracket | # Households | % Households |
| Less than $10,000 | 120 | 9.1% |
| $10,000 to $14,999 | 122 | 9.3% |
| $15,000 to $24,999 | 204 | 15.5% |
| $25,000 to $34,999 | 58 | 4.4% |
| $35,000 to $49,999 | 118 | 9.0% |
| $50,000 to $74,999 | 251 | 19.1% |
| $75,000 to $99,999 | 143 | 10.9% |
| $100,000 to $149,999 | 130 | 9.9% |
| $150,000 to $199,999 | 147 | 11.2% |
| $200,000+ | 22 | 1.7% |
Household Income by Householder Age in Baltimore
The median household income in Baltimore is $55,121, with the highest median household income of $94,107 found in the 25 to 44 years age bracket for the primary householder. A total of 346 households (26.3%) fall into this category. Meanwhile, the 15 to 24 years age bracket for the primary householder has the lowest median household income of $0, with 74 households (5.6%) in this group.
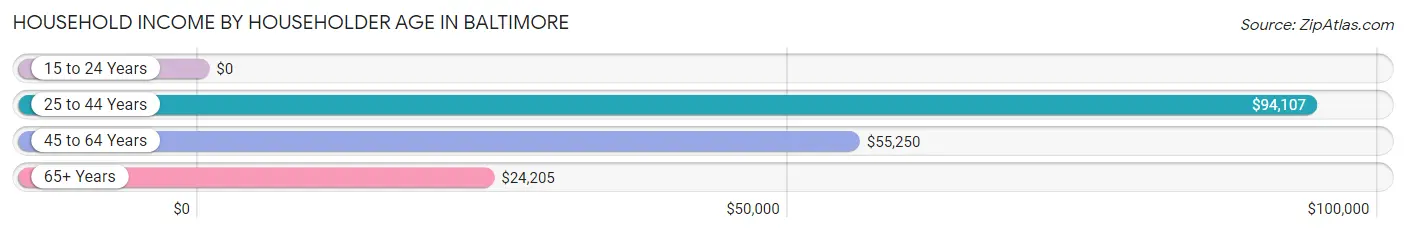
| Income Bracket | # Households | Median Income |
| 15 to 24 Years | 74 (5.6%) | $0 |
| 25 to 44 Years | 346 (26.3%) | $94,107 |
| 45 to 64 Years | 456 (34.6%) | $55,250 |
| 65+ Years | 440 (33.4%) | $24,205 |
| Total | 1,316 (100.0%) | $55,121 |
Poverty in Baltimore
Income Below Poverty by Sex and Age in Baltimore
With 19.7% poverty level for males and 18.5% for females among the residents of Baltimore, 12 to 14 year old males and 5 year old females are the most vulnerable to poverty, with 19 males (40.4%) and 15 females (65.2%) in their respective age groups living below the poverty level.
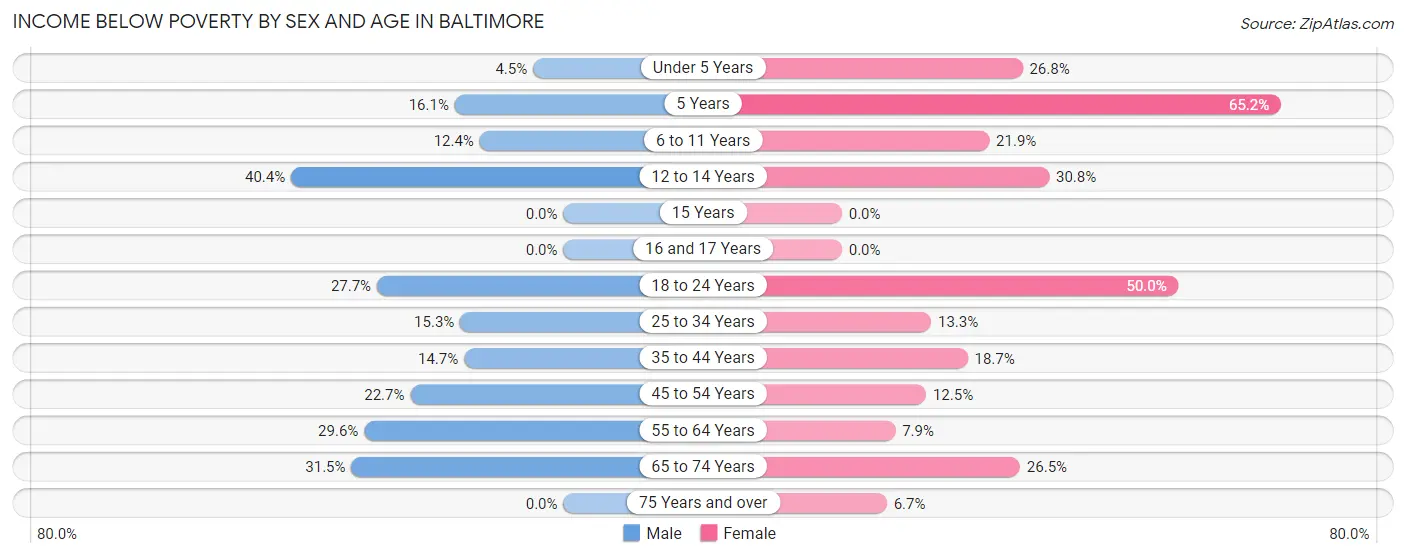
| Age Bracket | Male | Female |
| Under 5 Years | 5 (4.5%) | 11 (26.8%) |
| 5 Years | 5 (16.1%) | 15 (65.2%) |
| 6 to 11 Years | 20 (12.4%) | 21 (21.9%) |
| 12 to 14 Years | 19 (40.4%) | 16 (30.8%) |
| 15 Years | 0 (0.0%) | 0 (0.0%) |
| 16 and 17 Years | 0 (0.0%) | 0 (0.0%) |
| 18 to 24 Years | 49 (27.7%) | 67 (50.0%) |
| 25 to 34 Years | 36 (15.3%) | 33 (13.3%) |
| 35 to 44 Years | 14 (14.7%) | 28 (18.7%) |
| 45 to 54 Years | 20 (22.7%) | 15 (12.5%) |
| 55 to 64 Years | 63 (29.6%) | 18 (7.9%) |
| 65 to 74 Years | 51 (31.5%) | 32 (26.5%) |
| 75 Years and over | 0 (0.0%) | 11 (6.7%) |
| Total | 282 (19.7%) | 267 (18.5%) |
Income Above Poverty by Sex and Age in Baltimore
According to the poverty statistics in Baltimore, males aged 15 years and females aged 16 and 17 years are the age groups that are most secure financially, with 100.0% of males and 100.0% of females in these age groups living above the poverty line.
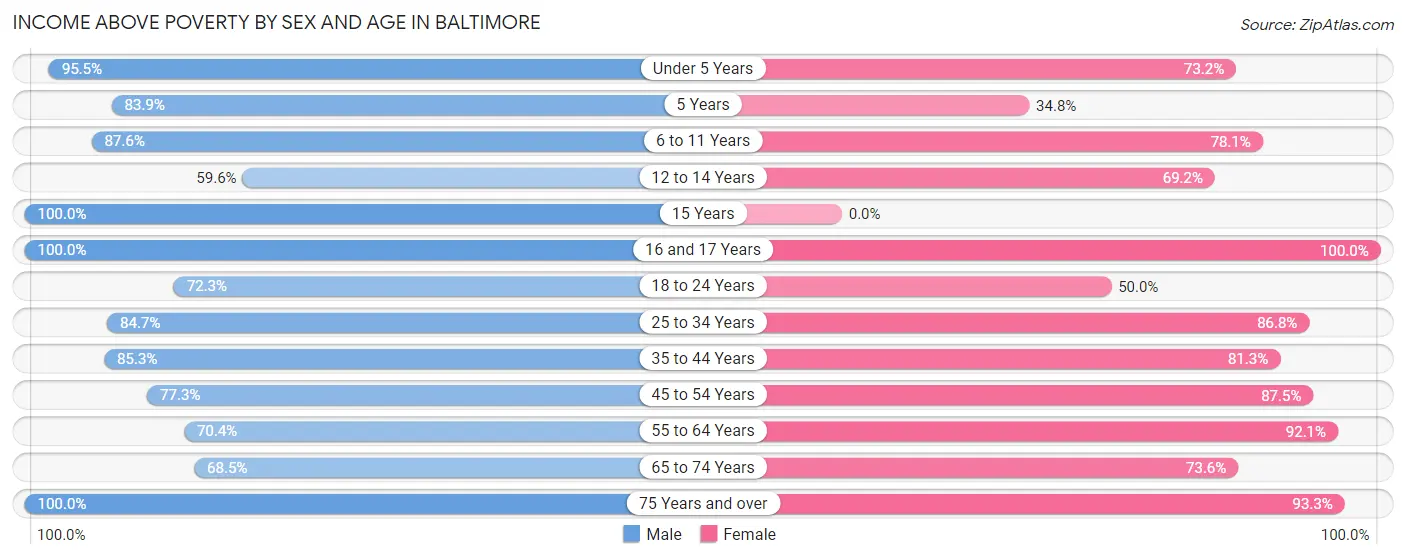
| Age Bracket | Male | Female |
| Under 5 Years | 106 (95.5%) | 30 (73.2%) |
| 5 Years | 26 (83.9%) | 8 (34.8%) |
| 6 to 11 Years | 141 (87.6%) | 75 (78.1%) |
| 12 to 14 Years | 28 (59.6%) | 36 (69.2%) |
| 15 Years | 6 (100.0%) | 0 (0.0%) |
| 16 and 17 Years | 28 (100.0%) | 63 (100.0%) |
| 18 to 24 Years | 128 (72.3%) | 67 (50.0%) |
| 25 to 34 Years | 199 (84.7%) | 216 (86.8%) |
| 35 to 44 Years | 81 (85.3%) | 122 (81.3%) |
| 45 to 54 Years | 68 (77.3%) | 105 (87.5%) |
| 55 to 64 Years | 150 (70.4%) | 209 (92.1%) |
| 65 to 74 Years | 111 (68.5%) | 89 (73.6%) |
| 75 Years and over | 81 (100.0%) | 154 (93.3%) |
| Total | 1,153 (80.3%) | 1,174 (81.5%) |
Income Below Poverty Among Married-Couple Families in Baltimore
The poverty statistics for married-couple families in Baltimore show that 6.0% or 30 of the total 502 families live below the poverty line. Families with 3 or 4 children have the highest poverty rate of 31.9%, comprising of 15 families. On the other hand, families with 5 or more children have the lowest poverty rate of 0.0%, which includes 0 families.
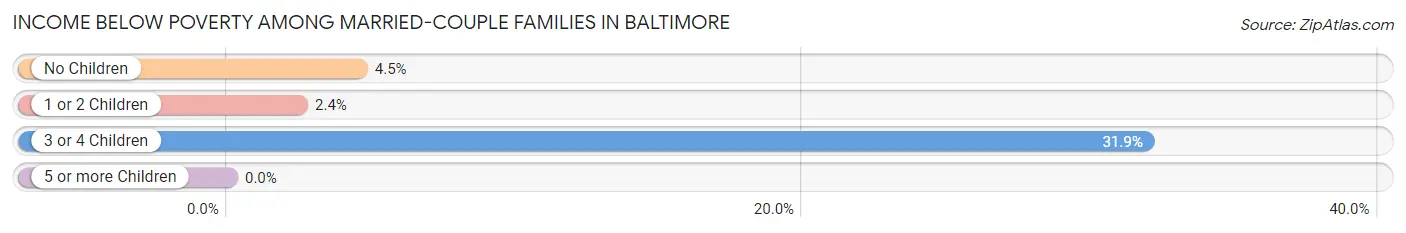
| Children | Above Poverty | Below Poverty |
| No Children | 190 (95.5%) | 9 (4.5%) |
| 1 or 2 Children | 240 (97.6%) | 6 (2.4%) |
| 3 or 4 Children | 32 (68.1%) | 15 (31.9%) |
| 5 or more Children | 10 (100.0%) | 0 (0.0%) |
| Total | 472 (94.0%) | 30 (6.0%) |
Income Below Poverty Among Single-Parent Households in Baltimore
According to the poverty data in Baltimore, 50.0% or 42 single-father households and 29.6% or 24 single-mother households are living below the poverty line. Among single-father households, those with 1 or 2 children have the highest poverty rate, with 42 households (79.2%) experiencing poverty. Likewise, among single-mother households, those with 1 or 2 children have the highest poverty rate, with 24 households (29.6%) falling below the poverty line.
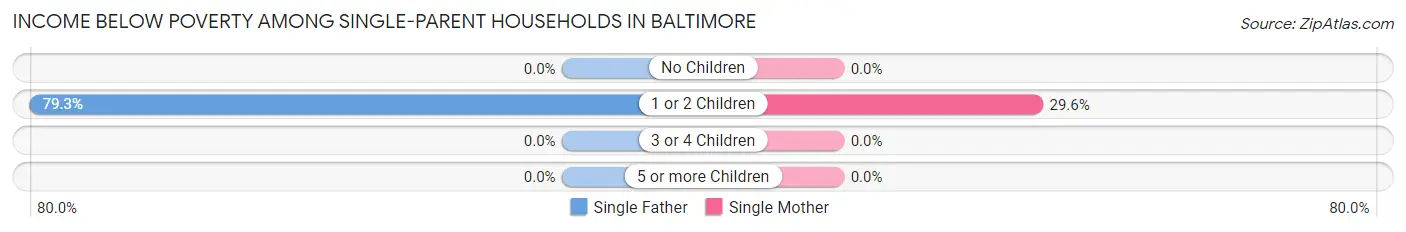
| Children | Single Father | Single Mother |
| No Children | 0 (0.0%) | 0 (0.0%) |
| 1 or 2 Children | 42 (79.2%) | 24 (29.6%) |
| 3 or 4 Children | 0 (0.0%) | 0 (0.0%) |
| 5 or more Children | 0 (0.0%) | 0 (0.0%) |
| Total | 42 (50.0%) | 24 (29.6%) |
Income Below Poverty Among Married-Couple vs Single-Parent Households in Baltimore
The poverty data for Baltimore shows that 30 of the married-couple family households (6.0%) and 66 of the single-parent households (40.0%) are living below the poverty level. Within the married-couple family households, those with 3 or 4 children have the highest poverty rate, with 15 households (31.9%) falling below the poverty line. Among the single-parent households, those with 1 or 2 children have the highest poverty rate, with 66 household (49.2%) living below poverty.
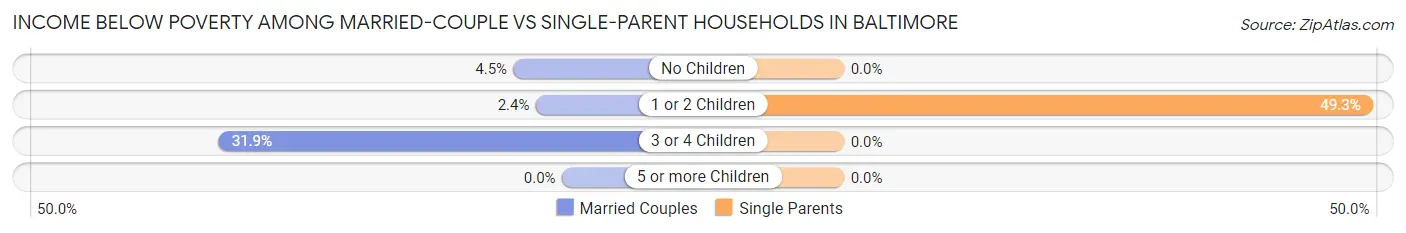
| Children | Married-Couple Families | Single-Parent Households |
| No Children | 9 (4.5%) | 0 (0.0%) |
| 1 or 2 Children | 6 (2.4%) | 66 (49.2%) |
| 3 or 4 Children | 15 (31.9%) | 0 (0.0%) |
| 5 or more Children | 0 (0.0%) | 0 (0.0%) |
| Total | 30 (6.0%) | 66 (40.0%) |
Race in Baltimore
The most populous races in Baltimore are White / Caucasian (2,838 | 95.6%), Two or more Races (75 | 2.5%), and Black / African American (29 | 1.0%).
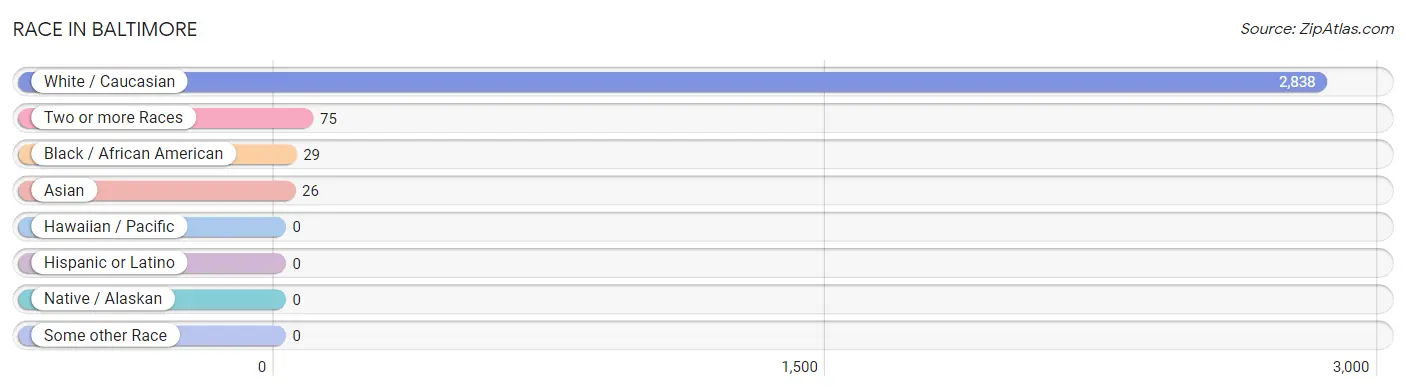
| Race | # Population | % Population |
| Asian | 26 | 0.9% |
| Black / African American | 29 | 1.0% |
| Hawaiian / Pacific | 0 | 0.0% |
| Hispanic or Latino | 0 | 0.0% |
| Native / Alaskan | 0 | 0.0% |
| White / Caucasian | 2,838 | 95.6% |
| Two or more Races | 75 | 2.5% |
| Some other Race | 0 | 0.0% |
| Total | 2,968 | 100.0% |
Ancestry in Baltimore
The most populous ancestries reported in Baltimore are German (631 | 21.3%), American (581 | 19.6%), Irish (318 | 10.7%), English (150 | 5.1%), and Polish (98 | 3.3%), together accounting for 59.9% of all Baltimore residents.
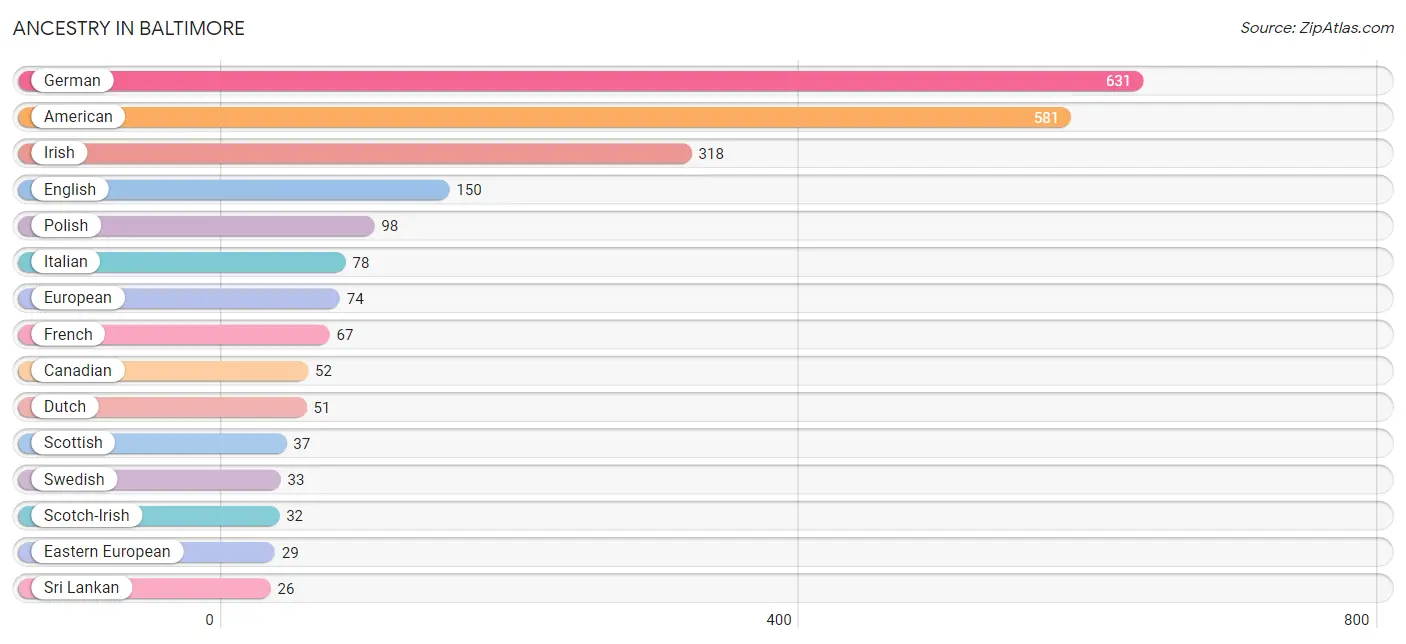
| Ancestry | # Population | % Population |
| American | 581 | 19.6% |
| Canadian | 52 | 1.8% |
| Dutch | 51 | 1.7% |
| Eastern European | 29 | 1.0% |
| English | 150 | 5.1% |
| European | 74 | 2.5% |
| French | 67 | 2.3% |
| German | 631 | 21.3% |
| Hungarian | 23 | 0.8% |
| Indian (Asian) | 13 | 0.4% |
| Irish | 318 | 10.7% |
| Italian | 78 | 2.6% |
| Polish | 98 | 3.3% |
| Scotch-Irish | 32 | 1.1% |
| Scottish | 37 | 1.3% |
| Sri Lankan | 26 | 0.9% |
| Swedish | 33 | 1.1% |
| Swiss | 25 | 0.8% | View All 18 Rows |
Immigrants in Baltimore
The most numerous immigrant groups reported in Baltimore came from Asia (26 | 0.9%), South Eastern Asia (26 | 0.9%), Vietnam (26 | 0.9%), and Canada (10 | 0.3%), together accounting for 3.0% of all Baltimore residents.
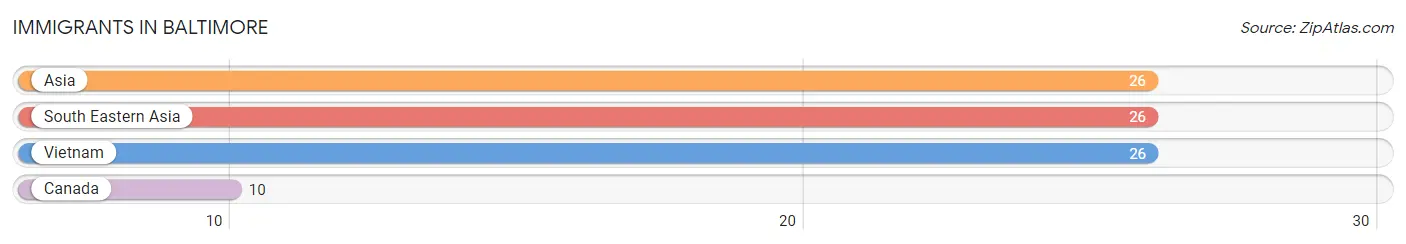
| Immigration Origin | # Population | % Population |
| Asia | 26 | 0.9% |
| Canada | 10 | 0.3% |
| South Eastern Asia | 26 | 0.9% |
| Vietnam | 26 | 0.9% | View All 4 Rows |
Sex and Age in Baltimore
Sex and Age in Baltimore
The most populous age groups in Baltimore are Under 5 Years (158 | 10.6%) for men and 10 to 14 Years (143 | 9.7%) for women.
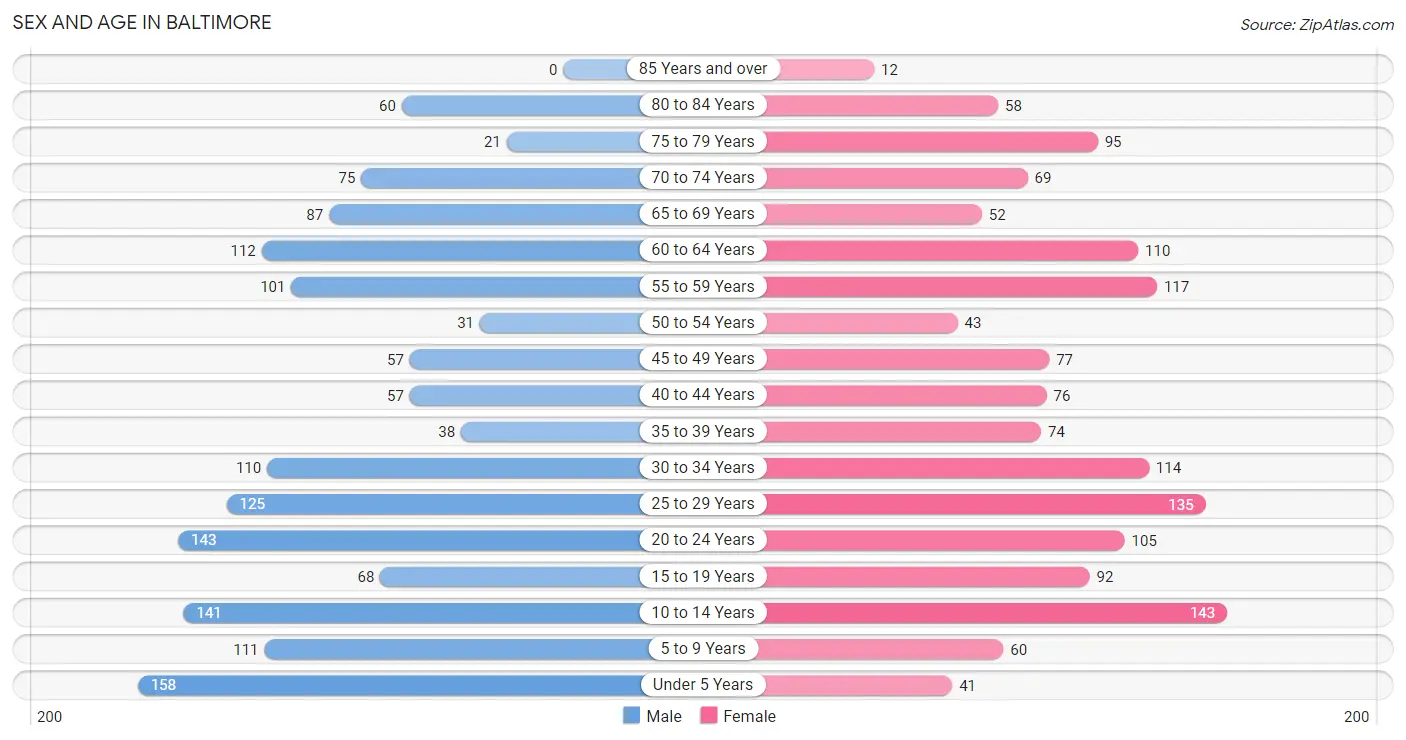
| Age Bracket | Male | Female |
| Under 5 Years | 158 (10.6%) | 41 (2.8%) |
| 5 to 9 Years | 111 (7.4%) | 60 (4.1%) |
| 10 to 14 Years | 141 (9.4%) | 143 (9.7%) |
| 15 to 19 Years | 68 (4.5%) | 92 (6.2%) |
| 20 to 24 Years | 143 (9.6%) | 105 (7.1%) |
| 25 to 29 Years | 125 (8.4%) | 135 (9.2%) |
| 30 to 34 Years | 110 (7.4%) | 114 (7.7%) |
| 35 to 39 Years | 38 (2.5%) | 74 (5.0%) |
| 40 to 44 Years | 57 (3.8%) | 76 (5.2%) |
| 45 to 49 Years | 57 (3.8%) | 77 (5.2%) |
| 50 to 54 Years | 31 (2.1%) | 43 (2.9%) |
| 55 to 59 Years | 101 (6.8%) | 117 (7.9%) |
| 60 to 64 Years | 112 (7.5%) | 110 (7.5%) |
| 65 to 69 Years | 87 (5.8%) | 52 (3.5%) |
| 70 to 74 Years | 75 (5.0%) | 69 (4.7%) |
| 75 to 79 Years | 21 (1.4%) | 95 (6.5%) |
| 80 to 84 Years | 60 (4.0%) | 58 (3.9%) |
| 85 Years and over | 0 (0.0%) | 12 (0.8%) |
| Total | 1,495 (100.0%) | 1,473 (100.0%) |
Families and Households in Baltimore
Median Family Size in Baltimore
The median family size in Baltimore is 3.03 persons per family, with married-couple families (502 | 75.3%) accounting for the largest median family size of 3.28 persons per family. On the other hand, single male/father families (84 | 12.6%) represent the smallest median family size with 2.15 persons per family.
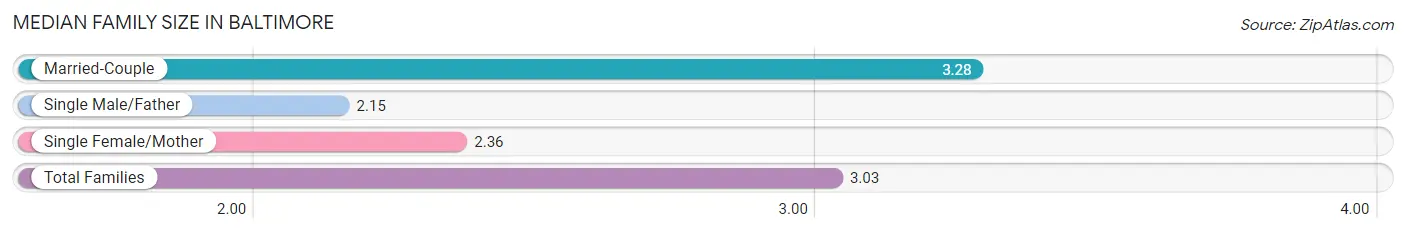
| Family Type | # Families | Family Size |
| Married-Couple | 502 (75.3%) | 3.28 |
| Single Male/Father | 84 (12.6%) | 2.15 |
| Single Female/Mother | 81 (12.1%) | 2.36 |
| Total Families | 667 (100.0%) | 3.03 |
Median Household Size in Baltimore
The median household size in Baltimore is 2.26 persons per household, with married-couple households (502 | 38.2%) accounting for the largest median household size of 3.45 persons per household. non-family households (649 | 49.3%) represent the smallest median household size with 1.25 persons per household.
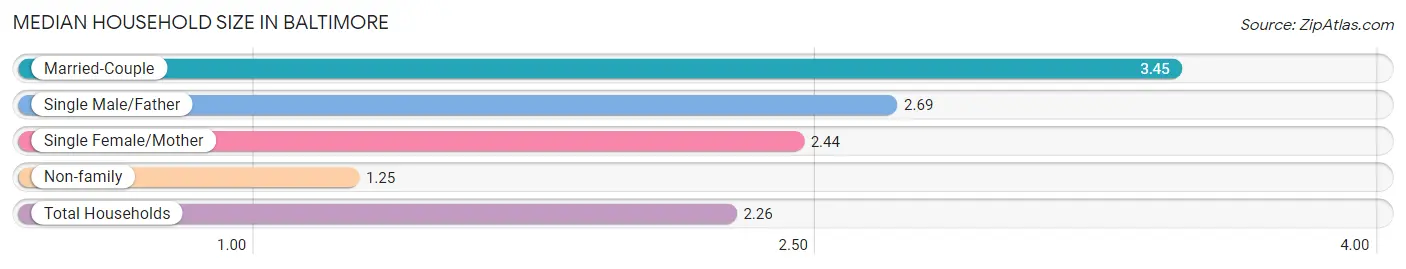
| Household Type | # Households | Household Size |
| Married-Couple | 502 (38.2%) | 3.45 |
| Single Male/Father | 84 (6.4%) | 2.69 |
| Single Female/Mother | 81 (6.2%) | 2.44 |
| Non-family | 649 (49.3%) | 1.25 |
| Total Households | 1,316 (100.0%) | 2.26 |
Household Size by Marriage Status in Baltimore
Out of a total of 1,316 households in Baltimore, 667 (50.7%) are family households, while 649 (49.3%) are nonfamily households. The most numerous type of family households are 2-person households, comprising 259, and the most common type of nonfamily households are 1-person households, comprising 558.
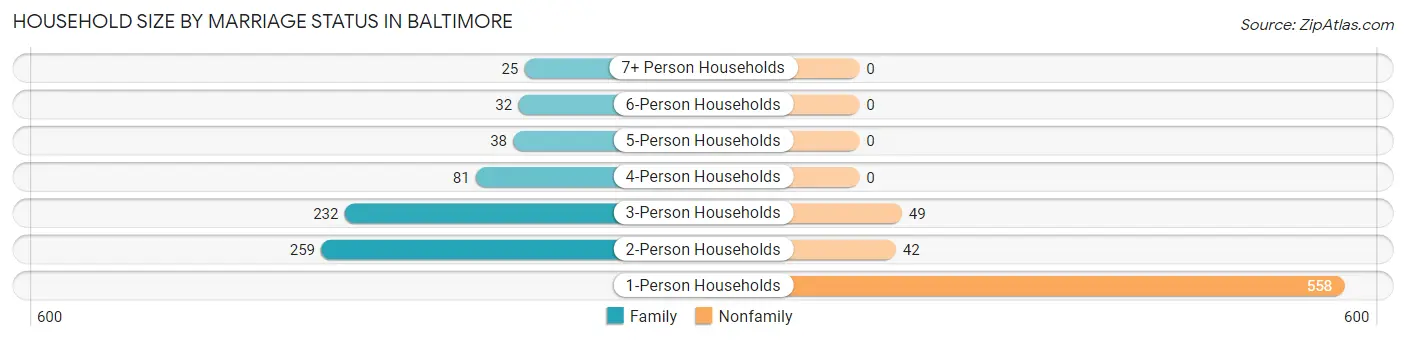
| Household Size | Family Households | Nonfamily Households |
| 1-Person Households | - | 558 (42.4%) |
| 2-Person Households | 259 (19.7%) | 42 (3.2%) |
| 3-Person Households | 232 (17.6%) | 49 (3.7%) |
| 4-Person Households | 81 (6.2%) | 0 (0.0%) |
| 5-Person Households | 38 (2.9%) | 0 (0.0%) |
| 6-Person Households | 32 (2.4%) | 0 (0.0%) |
| 7+ Person Households | 25 (1.9%) | 0 (0.0%) |
| Total | 667 (50.7%) | 649 (49.3%) |
Female Fertility in Baltimore
Fertility by Age in Baltimore
Average fertility rate in Baltimore is 92.0 births per 1,000 women. Women in the age bracket of 20 to 34 years have the highest fertility rate with 178.0 births per 1,000 women. Women in the age bracket of 20 to 34 years acount for 100.0% of all women with births.
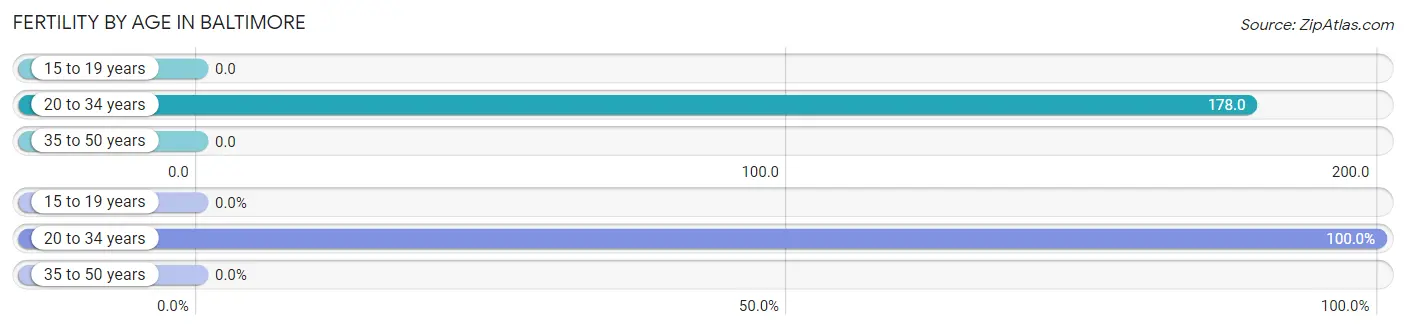
| Age Bracket | Women with Births | Births / 1,000 Women |
| 15 to 19 years | 0 (0.0%) | 0.0 |
| 20 to 34 years | 63 (100.0%) | 178.0 |
| 35 to 50 years | 0 (0.0%) | 0.0 |
| Total | 63 (100.0%) | 92.0 |
Fertility by Age by Marriage Status in Baltimore
50.8% of women with births (63) in Baltimore are married. The highest percentage of unmarried women with births falls into 20 to 34 years age bracket with 49.2% of them unmarried at the time of birth, while the lowest percentage of unmarried women with births belong to 20 to 34 years age bracket with 49.2% of them unmarried.
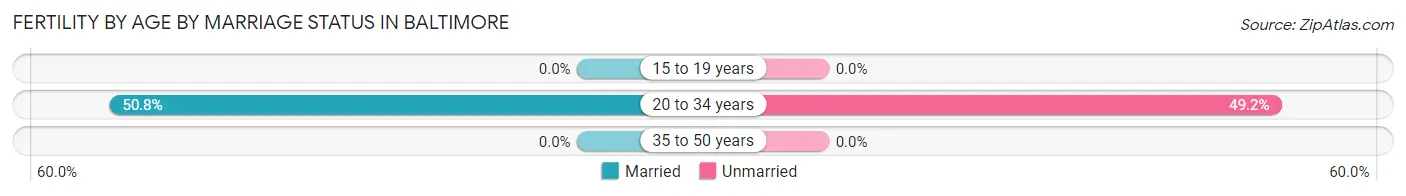
| Age Bracket | Married | Unmarried |
| 15 to 19 years | 0 (0.0%) | 0 (0.0%) |
| 20 to 34 years | 32 (50.8%) | 31 (49.2%) |
| 35 to 50 years | 0 (0.0%) | 0 (0.0%) |
| Total | 32 (50.8%) | 31 (49.2%) |
Fertility by Education in Baltimore
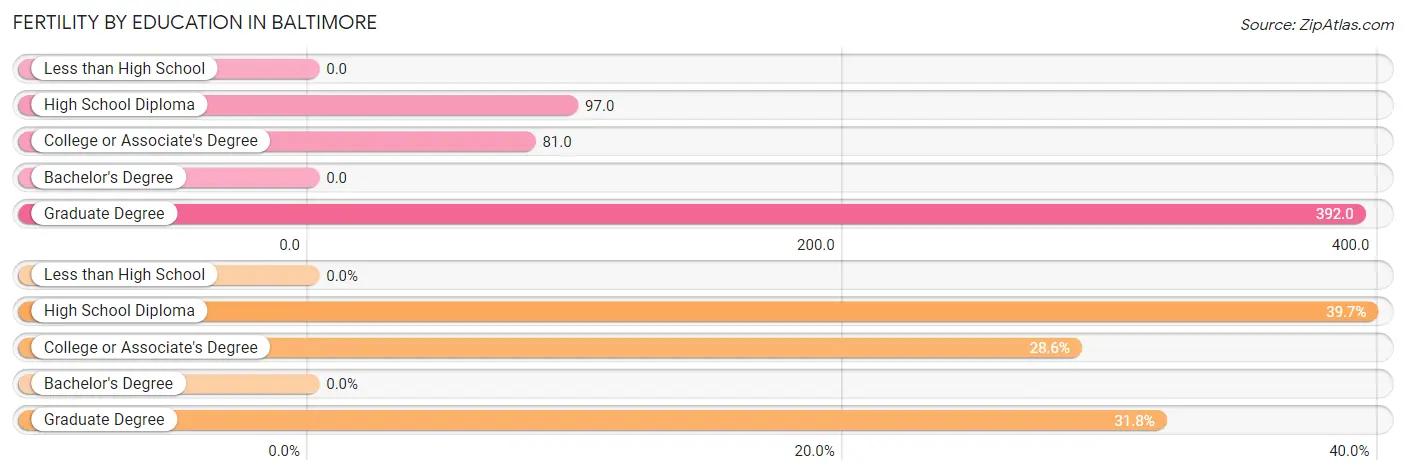
| Educational Attainment | Women with Births | Births / 1,000 Women |
| Less than High School | 0 (0.0%) | 0.0 |
| High School Diploma | 25 (39.7%) | 97.0 |
| College or Associate's Degree | 18 (28.6%) | 81.0 |
| Bachelor's Degree | 0 (0.0%) | 0.0 |
| Graduate Degree | 20 (31.8%) | 392.0 |
| Total | 63 (100.0%) | 92.0 |
Fertility by Education by Marriage Status in Baltimore
49.2% of women with births in Baltimore are unmarried. Women with the educational attainment of graduate degree are most likely to be married with 100.0% of them married at childbirth, while women with the educational attainment of college or associate's degree are least likely to be married with 100.0% of them unmarried at childbirth.
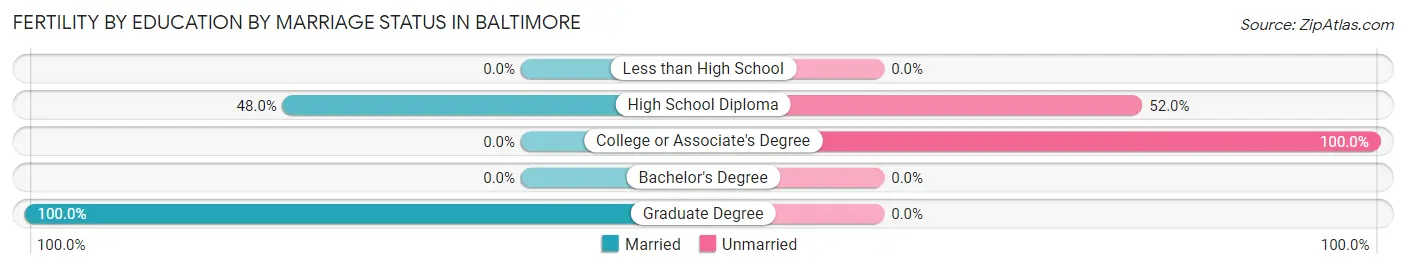
| Educational Attainment | Married | Unmarried |
| Less than High School | 0 (0.0%) | 0 (0.0%) |
| High School Diploma | 12 (48.0%) | 13 (52.0%) |
| College or Associate's Degree | 0 (0.0%) | 18 (100.0%) |
| Bachelor's Degree | 0 (0.0%) | 0 (0.0%) |
| Graduate Degree | 20 (100.0%) | 0 (0.0%) |
| Total | 32 (50.8%) | 31 (49.2%) |
Employment Characteristics in Baltimore
Employment by Class of Employer in Baltimore
Among the 1,270 employed individuals in Baltimore, private company employees (790 | 62.2%), self-employed (not incorporated) (147 | 11.6%), and local government employees (132 | 10.4%) make up the most common classes of employment.
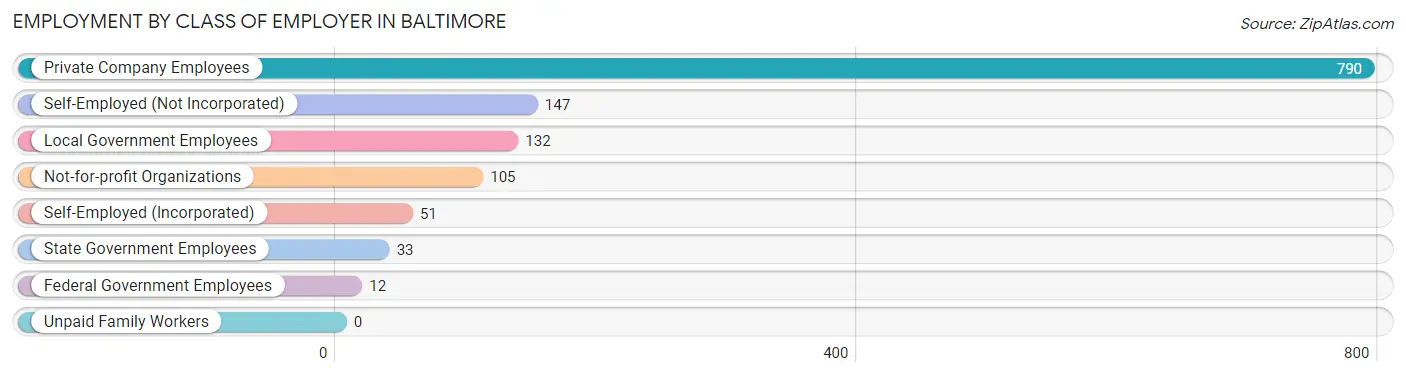
| Employer Class | # Employees | % Employees |
| Private Company Employees | 790 | 62.2% |
| Self-Employed (Incorporated) | 51 | 4.0% |
| Self-Employed (Not Incorporated) | 147 | 11.6% |
| Not-for-profit Organizations | 105 | 8.3% |
| Local Government Employees | 132 | 10.4% |
| State Government Employees | 33 | 2.6% |
| Federal Government Employees | 12 | 0.9% |
| Unpaid Family Workers | 0 | 0.0% |
| Total | 1,270 | 100.0% |
Employment Status by Age in Baltimore
According to the labor force statistics for Baltimore, out of the total population over 16 years of age (2,308), 60.4% or 1,394 individuals are in the labor force, with 6.5% or 91 of them unemployed. The age group with the highest labor force participation rate is 30 to 34 years, with 95.5% or 214 individuals in the labor force. Within the labor force, the 55 to 59 years age range has the highest percentage of unemployed individuals, with 20.0% or 30 of them being unemployed.
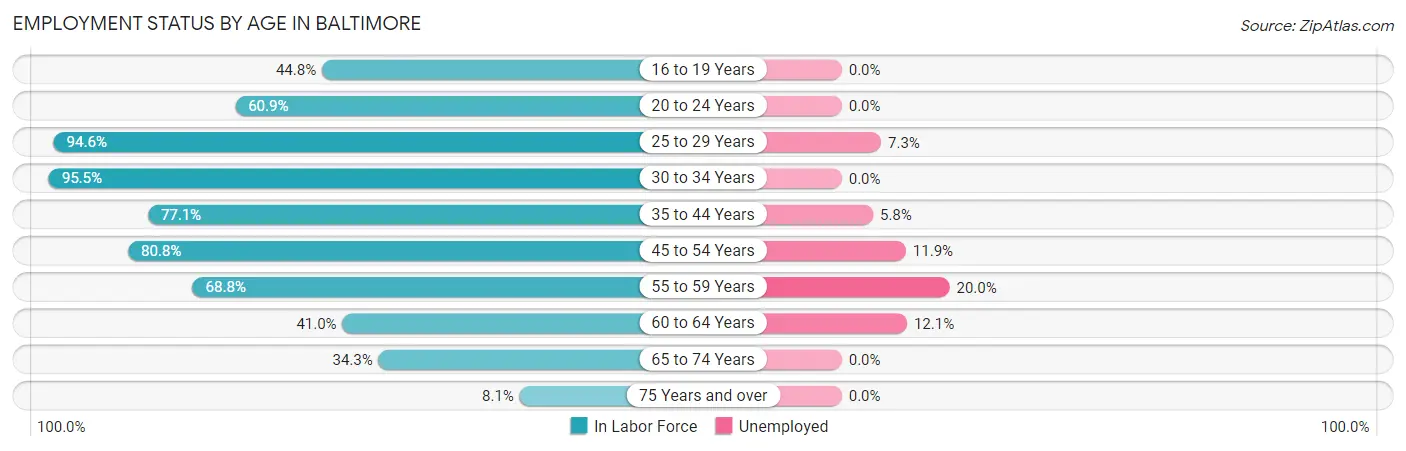
| Age Bracket | In Labor Force | Unemployed |
| 16 to 19 Years | 69 (44.8%) | 0 (0.0%) |
| 20 to 24 Years | 151 (60.9%) | 0 (0.0%) |
| 25 to 29 Years | 246 (94.6%) | 18 (7.3%) |
| 30 to 34 Years | 214 (95.5%) | 0 (0.0%) |
| 35 to 44 Years | 189 (77.1%) | 11 (5.8%) |
| 45 to 54 Years | 168 (80.8%) | 20 (11.9%) |
| 55 to 59 Years | 150 (68.8%) | 30 (20.0%) |
| 60 to 64 Years | 91 (41.0%) | 11 (12.1%) |
| 65 to 74 Years | 97 (34.3%) | 0 (0.0%) |
| 75 Years and over | 20 (8.1%) | 0 (0.0%) |
| Total | 1,394 (60.4%) | 91 (6.5%) |
Employment Status by Educational Attainment in Baltimore
According to labor force statistics for Baltimore, 76.8% of individuals (1,058) out of the total population between 25 and 64 years of age (1,377) are in the labor force, with 8.5% or 90 of them being unemployed. The group with the highest labor force participation rate are those with the educational attainment of bachelor's degree or higher, with 89.6% or 275 individuals in the labor force. Within the labor force, individuals with high school diploma education have the highest percentage of unemployment, with 14.1% or 50 of them being unemployed.
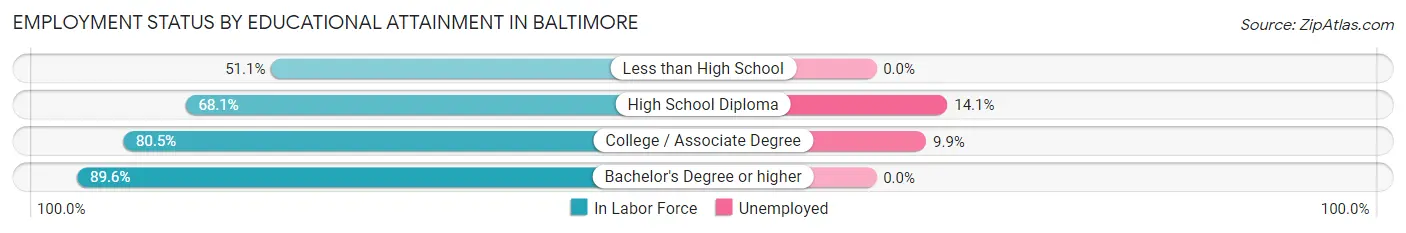
| Educational Attainment | In Labor Force | Unemployed |
| Less than High School | 24 (51.1%) | 0 (0.0%) |
| High School Diploma | 354 (68.1%) | 73 (14.1%) |
| College / Associate Degree | 405 (80.5%) | 50 (9.9%) |
| Bachelor's Degree or higher | 275 (89.6%) | 0 (0.0%) |
| Total | 1,058 (76.8%) | 117 (8.5%) |
Employment Occupations by Sex in Baltimore
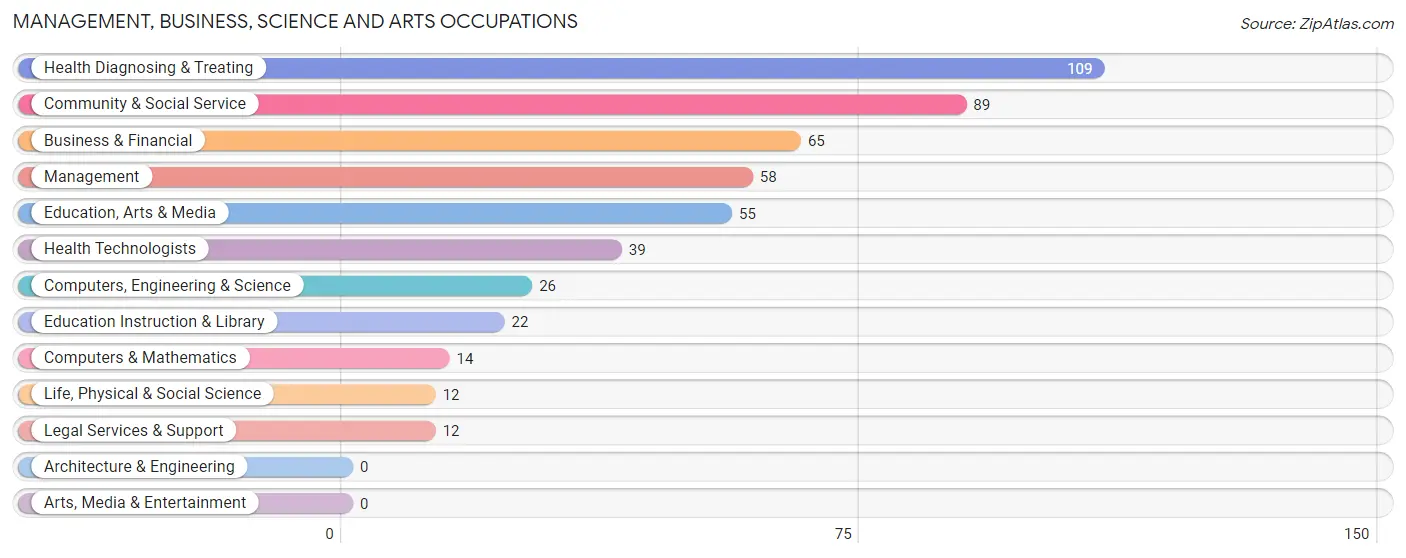
Management, Business, Science and Arts Occupations
The most common Management, Business, Science and Arts occupations in Baltimore are Health Diagnosing & Treating (109 | 8.4%), Community & Social Service (89 | 6.8%), Business & Financial (65 | 5.0%), Management (58 | 4.4%), and Education, Arts & Media (55 | 4.2%).
Management, Business, Science and Arts Occupations by Sex
Within the Management, Business, Science and Arts occupations in Baltimore, the most male-oriented occupations are Computers & Mathematics (100.0%), Management (70.7%), and Business & Financial (58.5%), while the most female-oriented occupations are Life, Physical & Social Science (100.0%), Legal Services & Support (100.0%), and Education Instruction & Library (100.0%).
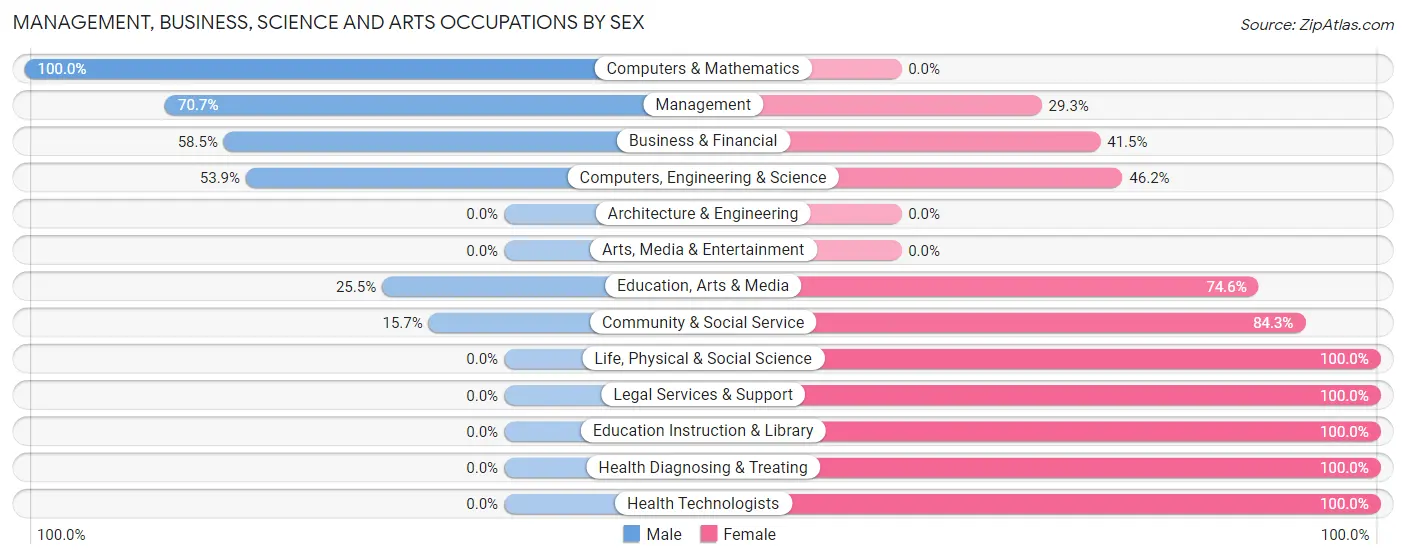
| Occupation | Male | Female |
| Management | 41 (70.7%) | 17 (29.3%) |
| Business & Financial | 38 (58.5%) | 27 (41.5%) |
| Computers, Engineering & Science | 14 (53.8%) | 12 (46.2%) |
| Computers & Mathematics | 14 (100.0%) | 0 (0.0%) |
| Architecture & Engineering | 0 (0.0%) | 0 (0.0%) |
| Life, Physical & Social Science | 0 (0.0%) | 12 (100.0%) |
| Community & Social Service | 14 (15.7%) | 75 (84.3%) |
| Education, Arts & Media | 14 (25.5%) | 41 (74.6%) |
| Legal Services & Support | 0 (0.0%) | 12 (100.0%) |
| Education Instruction & Library | 0 (0.0%) | 22 (100.0%) |
| Arts, Media & Entertainment | 0 (0.0%) | 0 (0.0%) |
| Health Diagnosing & Treating | 0 (0.0%) | 109 (100.0%) |
| Health Technologists | 0 (0.0%) | 39 (100.0%) |
| Total (Category) | 107 (30.8%) | 240 (69.2%) |
| Total (Overall) | 699 (53.6%) | 606 (46.4%) |
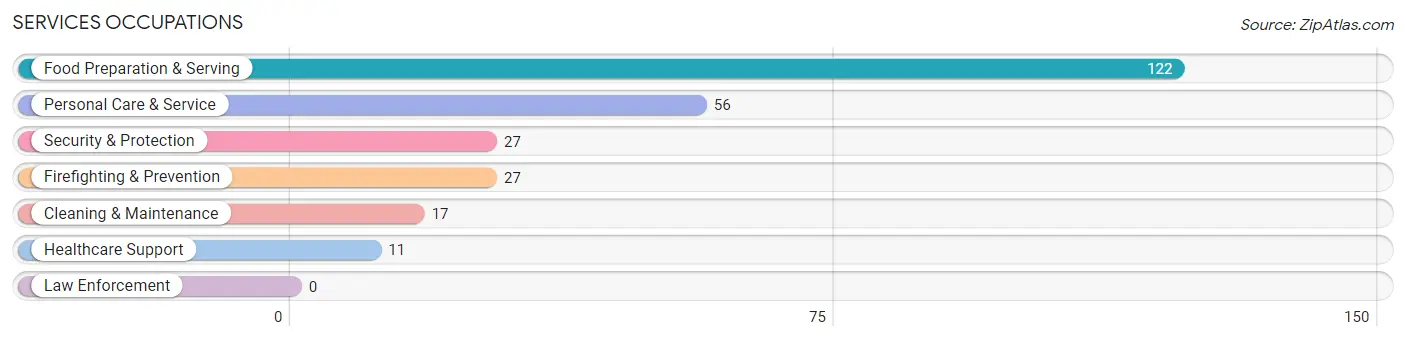
Services Occupations
The most common Services occupations in Baltimore are Food Preparation & Serving (122 | 9.3%), Personal Care & Service (56 | 4.3%), Security & Protection (27 | 2.1%), Firefighting & Prevention (27 | 2.1%), and Cleaning & Maintenance (17 | 1.3%).
Services Occupations by Sex
Within the Services occupations in Baltimore, the most male-oriented occupations are Security & Protection (100.0%), Firefighting & Prevention (100.0%), and Cleaning & Maintenance (100.0%), while the most female-oriented occupations are Healthcare Support (100.0%), Personal Care & Service (75.0%), and Food Preparation & Serving (50.0%).
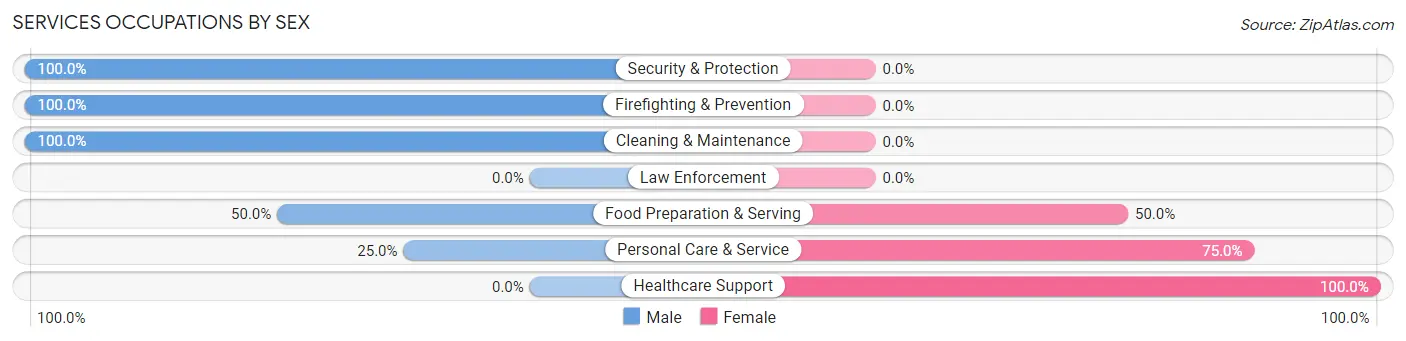
| Occupation | Male | Female |
| Healthcare Support | 0 (0.0%) | 11 (100.0%) |
| Security & Protection | 27 (100.0%) | 0 (0.0%) |
| Firefighting & Prevention | 27 (100.0%) | 0 (0.0%) |
| Law Enforcement | 0 (0.0%) | 0 (0.0%) |
| Food Preparation & Serving | 61 (50.0%) | 61 (50.0%) |
| Cleaning & Maintenance | 17 (100.0%) | 0 (0.0%) |
| Personal Care & Service | 14 (25.0%) | 42 (75.0%) |
| Total (Category) | 119 (51.1%) | 114 (48.9%) |
| Total (Overall) | 699 (53.6%) | 606 (46.4%) |
Sales and Office Occupations
The most common Sales and Office occupations in Baltimore are Sales & Related (98 | 7.5%), and Office & Administration (75 | 5.8%).
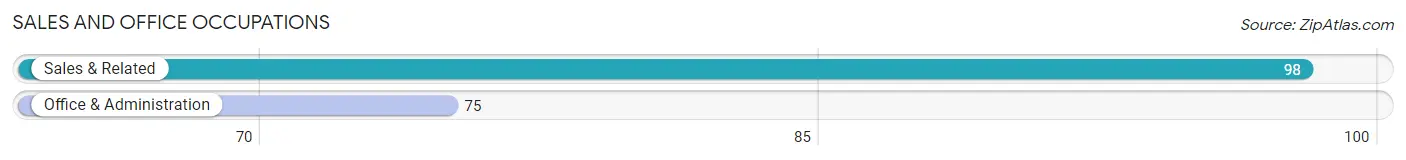
Sales and Office Occupations by Sex
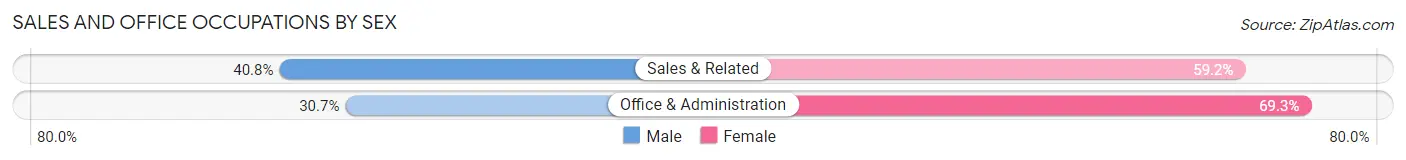
| Occupation | Male | Female |
| Sales & Related | 40 (40.8%) | 58 (59.2%) |
| Office & Administration | 23 (30.7%) | 52 (69.3%) |
| Total (Category) | 63 (36.4%) | 110 (63.6%) |
| Total (Overall) | 699 (53.6%) | 606 (46.4%) |
Natural Resources, Construction and Maintenance Occupations
The most common Natural Resources, Construction and Maintenance occupations in Baltimore are Construction & Extraction (190 | 14.6%), and Installation, Maintenance & Repair (80 | 6.1%).
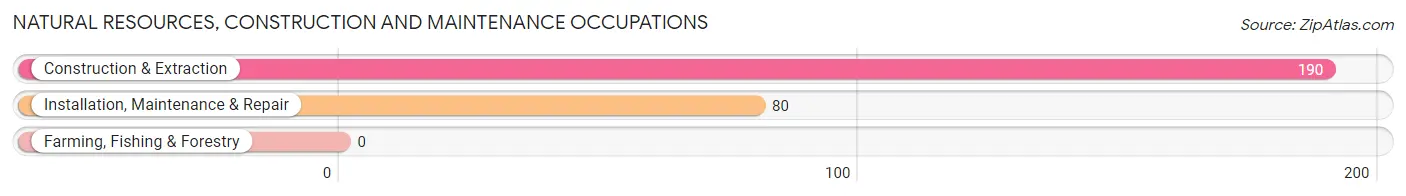
Natural Resources, Construction and Maintenance Occupations by Sex
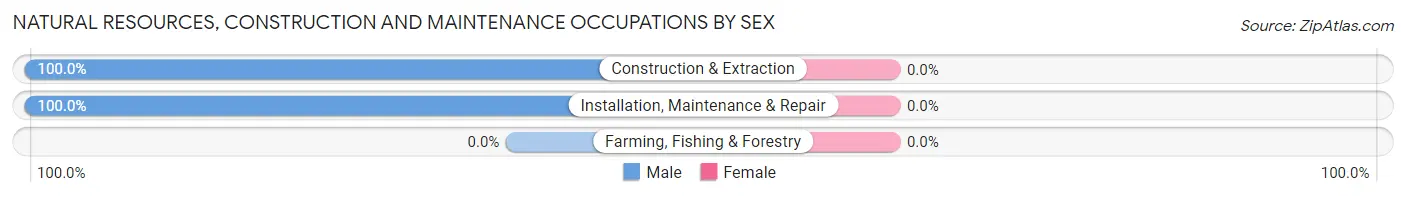
| Occupation | Male | Female |
| Farming, Fishing & Forestry | 0 (0.0%) | 0 (0.0%) |
| Construction & Extraction | 190 (100.0%) | 0 (0.0%) |
| Installation, Maintenance & Repair | 80 (100.0%) | 0 (0.0%) |
| Total (Category) | 270 (100.0%) | 0 (0.0%) |
| Total (Overall) | 699 (53.6%) | 606 (46.4%) |
Production, Transportation and Moving Occupations
The most common Production, Transportation and Moving occupations in Baltimore are Production (178 | 13.6%), Material Moving (71 | 5.4%), and Transportation (33 | 2.5%).
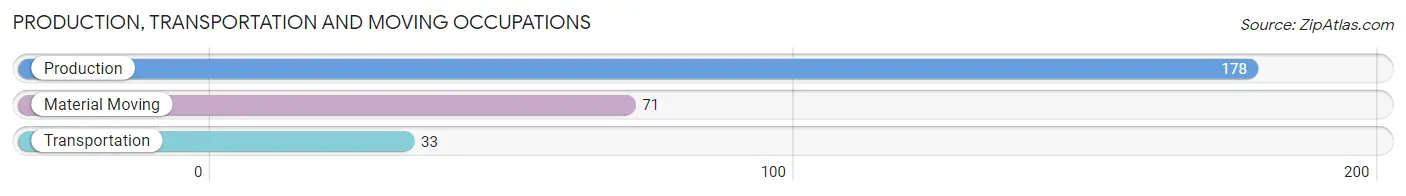
Production, Transportation and Moving Occupations by Sex
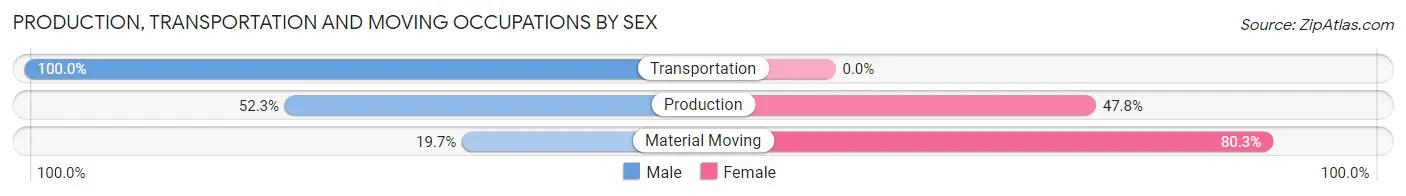
| Occupation | Male | Female |
| Production | 93 (52.2%) | 85 (47.7%) |
| Transportation | 33 (100.0%) | 0 (0.0%) |
| Material Moving | 14 (19.7%) | 57 (80.3%) |
| Total (Category) | 140 (49.6%) | 142 (50.3%) |
| Total (Overall) | 699 (53.6%) | 606 (46.4%) |
Employment Industries by Sex in Baltimore
Employment Industries in Baltimore
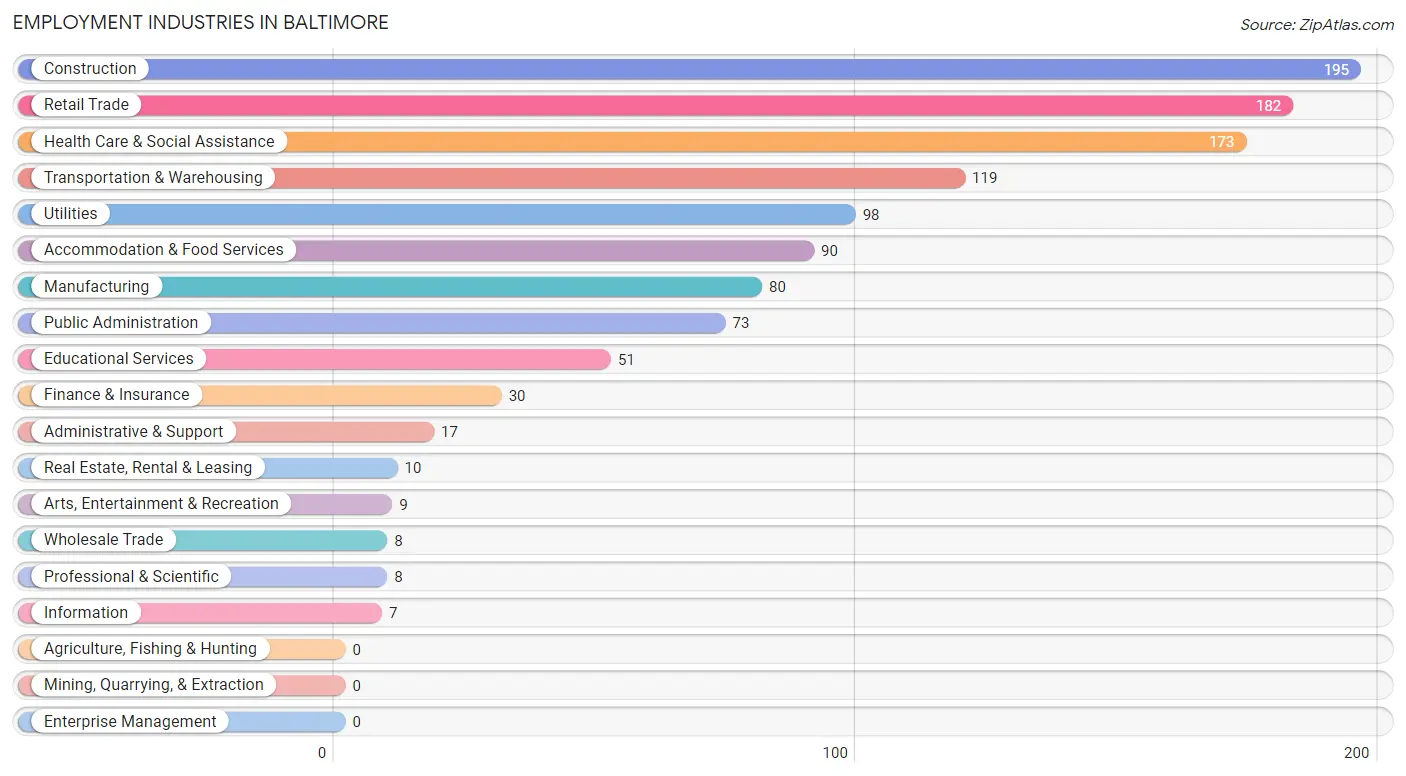
The major employment industries in Baltimore include Construction (195 | 14.9%), Retail Trade (182 | 14.0%), Health Care & Social Assistance (173 | 13.3%), Transportation & Warehousing (119 | 9.1%), and Utilities (98 | 7.5%).
Employment Industries by Sex in Baltimore
The Baltimore industries that see more men than women are Construction (100.0%), Information (100.0%), and Real Estate, Rental & Leasing (100.0%), whereas the industries that tend to have a higher number of women are Wholesale Trade (100.0%), Health Care & Social Assistance (100.0%), and Arts, Entertainment & Recreation (100.0%).
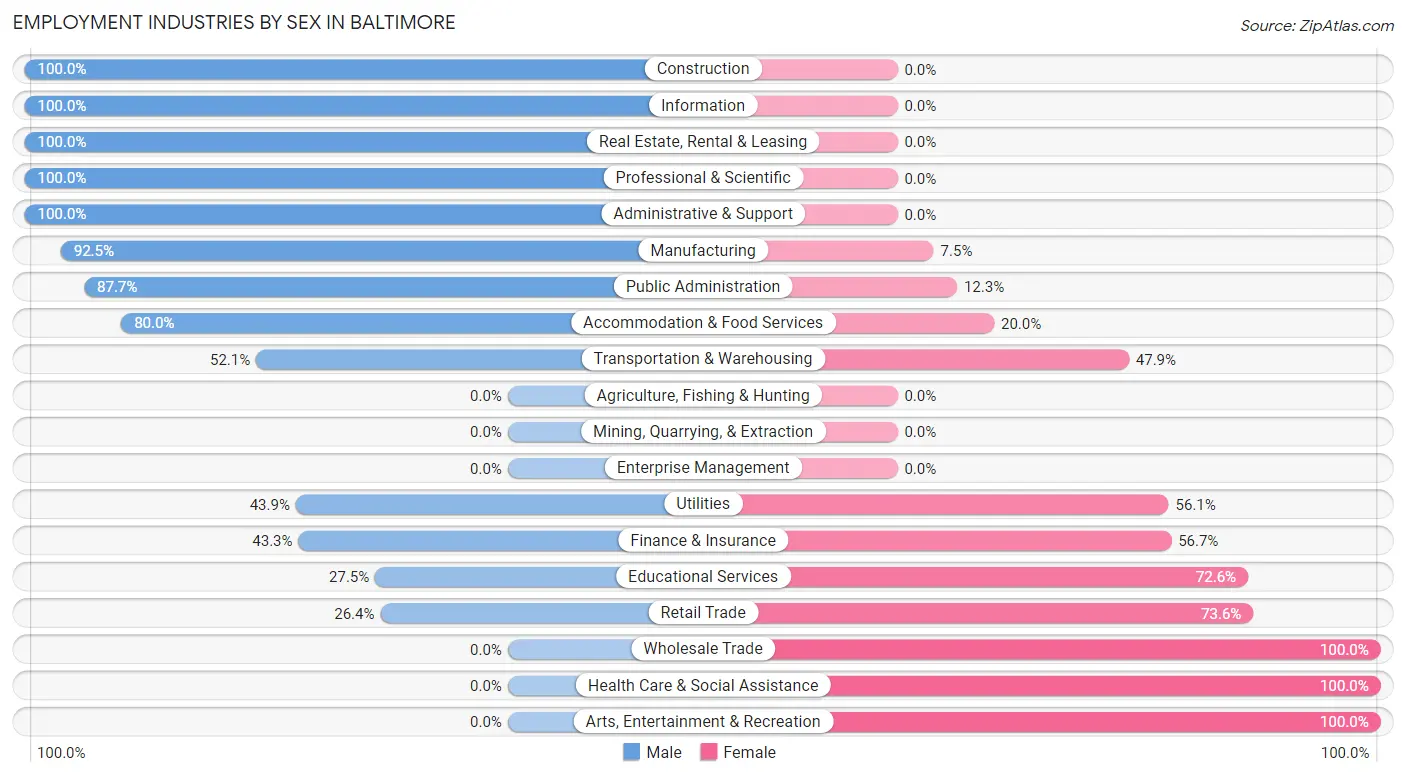
| Industry | Male | Female |
| Agriculture, Fishing & Hunting | 0 (0.0%) | 0 (0.0%) |
| Mining, Quarrying, & Extraction | 0 (0.0%) | 0 (0.0%) |
| Construction | 195 (100.0%) | 0 (0.0%) |
| Manufacturing | 74 (92.5%) | 6 (7.5%) |
| Wholesale Trade | 0 (0.0%) | 8 (100.0%) |
| Retail Trade | 48 (26.4%) | 134 (73.6%) |
| Transportation & Warehousing | 62 (52.1%) | 57 (47.9%) |
| Utilities | 43 (43.9%) | 55 (56.1%) |
| Information | 7 (100.0%) | 0 (0.0%) |
| Finance & Insurance | 13 (43.3%) | 17 (56.7%) |
| Real Estate, Rental & Leasing | 10 (100.0%) | 0 (0.0%) |
| Professional & Scientific | 8 (100.0%) | 0 (0.0%) |
| Enterprise Management | 0 (0.0%) | 0 (0.0%) |
| Administrative & Support | 17 (100.0%) | 0 (0.0%) |
| Educational Services | 14 (27.5%) | 37 (72.6%) |
| Health Care & Social Assistance | 0 (0.0%) | 173 (100.0%) |
| Arts, Entertainment & Recreation | 0 (0.0%) | 9 (100.0%) |
| Accommodation & Food Services | 72 (80.0%) | 18 (20.0%) |
| Public Administration | 64 (87.7%) | 9 (12.3%) |
| Total | 699 (53.6%) | 606 (46.4%) |
Education in Baltimore
School Enrollment in Baltimore
The most common levels of schooling among the 640 students in Baltimore are middle school (182 | 28.4%), elementary school (169 | 26.4%), and high school (148 | 23.1%).
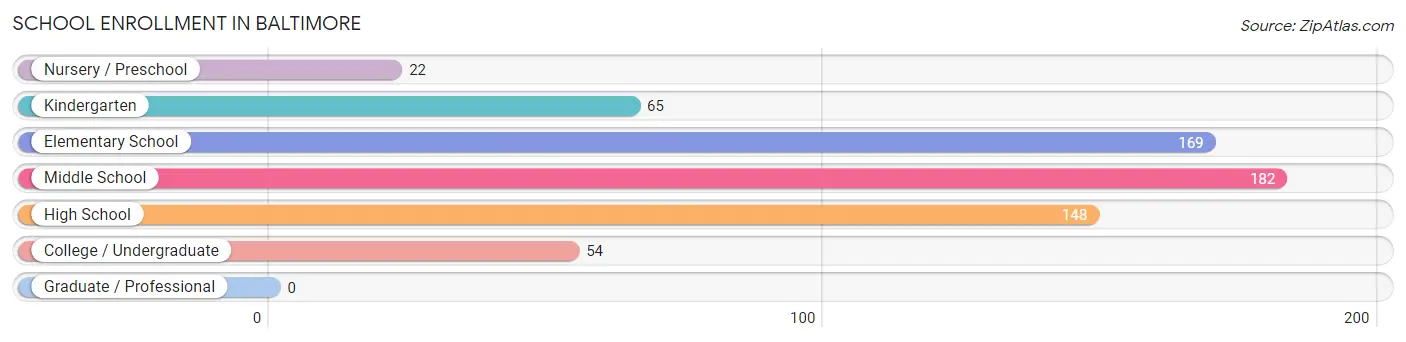
| School Level | # Students | % Students |
| Nursery / Preschool | 22 | 3.4% |
| Kindergarten | 65 | 10.2% |
| Elementary School | 169 | 26.4% |
| Middle School | 182 | 28.4% |
| High School | 148 | 23.1% |
| College / Undergraduate | 54 | 8.4% |
| Graduate / Professional | 0 | 0.0% |
| Total | 640 | 100.0% |
School Enrollment by Age by Funding Source in Baltimore
Out of a total of 640 students who are enrolled in schools in Baltimore, 115 (18.0%) attend a private institution, while the remaining 525 (82.0%) are enrolled in public schools. The age group of 25 to 34 year olds has the highest likelihood of being enrolled in private schools, with 8 (44.4% in the age bracket) enrolled. Conversely, the age group of 3 to 4 year olds has the lowest likelihood of being enrolled in a private school, with 5 (100.0% in the age bracket) attending a public institution.
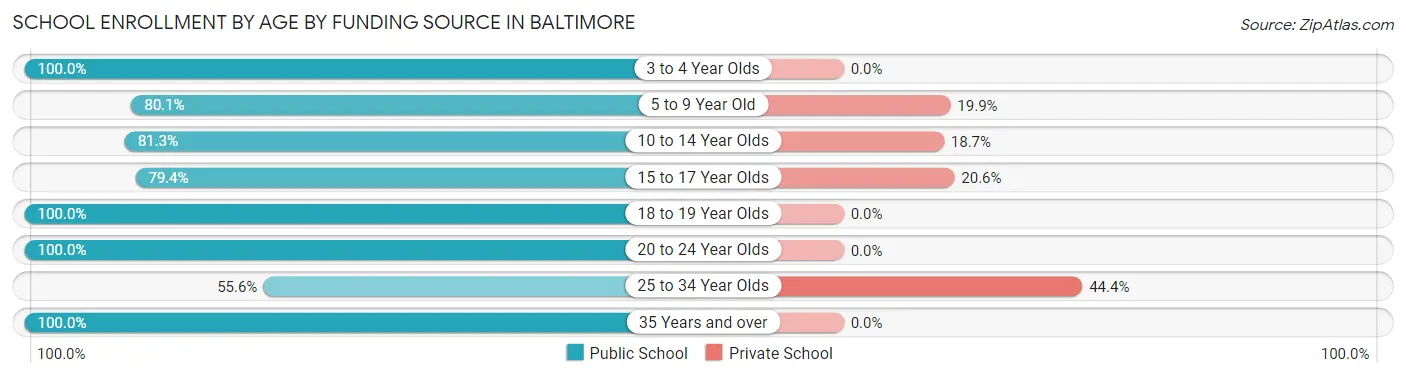
| Age Bracket | Public School | Private School |
| 3 to 4 Year Olds | 5 (100.0%) | 0 (0.0%) |
| 5 to 9 Year Old | 137 (80.1%) | 34 (19.9%) |
| 10 to 14 Year Olds | 231 (81.3%) | 53 (18.7%) |
| 15 to 17 Year Olds | 77 (79.4%) | 20 (20.6%) |
| 18 to 19 Year Olds | 16 (100.0%) | 0 (0.0%) |
| 20 to 24 Year Olds | 36 (100.0%) | 0 (0.0%) |
| 25 to 34 Year Olds | 10 (55.6%) | 8 (44.4%) |
| 35 Years and over | 13 (100.0%) | 0 (0.0%) |
| Total | 525 (82.0%) | 115 (18.0%) |
Educational Attainment by Field of Study in Baltimore
Education (79 | 22.4%), business (67 | 19.0%), arts & humanities (43 | 12.2%), science & technology (41 | 11.6%), and bio, nature & agricultural (31 | 8.8%) are the most common fields of study among 353 individuals in Baltimore who have obtained a bachelor's degree or higher.
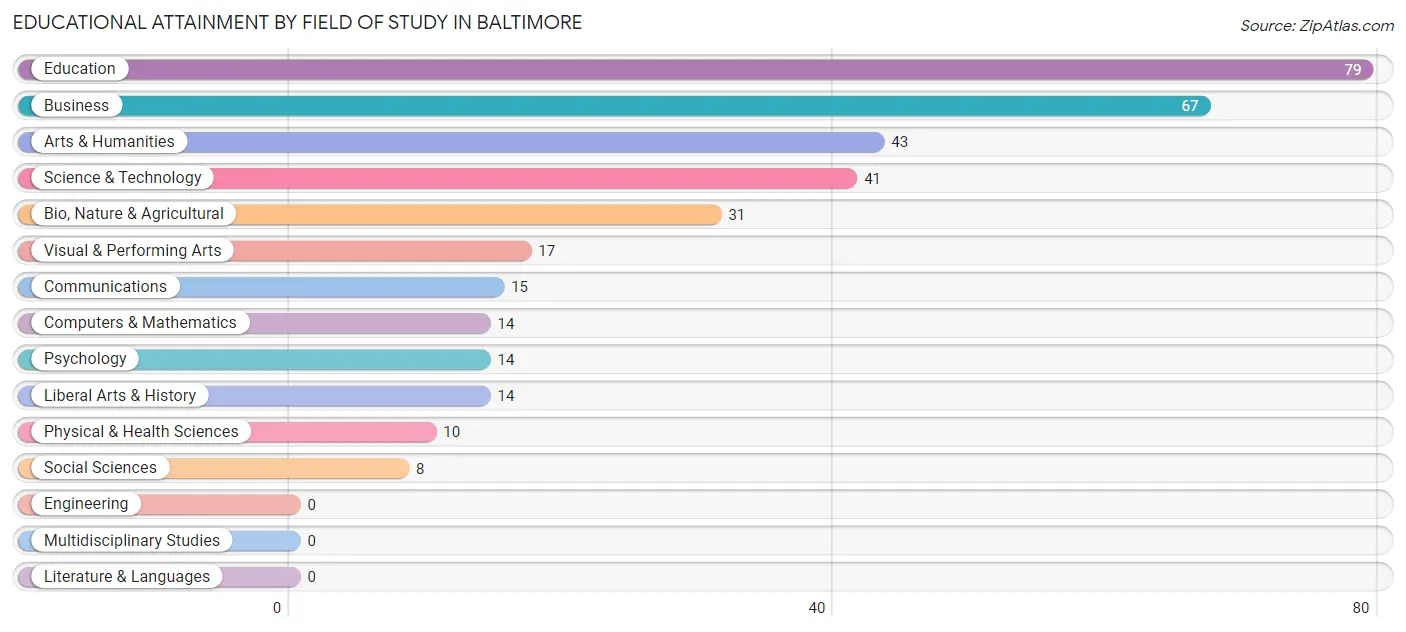
| Field of Study | # Graduates | % Graduates |
| Computers & Mathematics | 14 | 4.0% |
| Bio, Nature & Agricultural | 31 | 8.8% |
| Physical & Health Sciences | 10 | 2.8% |
| Psychology | 14 | 4.0% |
| Social Sciences | 8 | 2.3% |
| Engineering | 0 | 0.0% |
| Multidisciplinary Studies | 0 | 0.0% |
| Science & Technology | 41 | 11.6% |
| Business | 67 | 19.0% |
| Education | 79 | 22.4% |
| Literature & Languages | 0 | 0.0% |
| Liberal Arts & History | 14 | 4.0% |
| Visual & Performing Arts | 17 | 4.8% |
| Communications | 15 | 4.3% |
| Arts & Humanities | 43 | 12.2% |
| Total | 353 | 100.0% |
Transportation & Commute in Baltimore
Vehicle Availability by Sex in Baltimore
The most prevalent vehicle ownership categories in Baltimore are males with 2 vehicles (391, accounting for 57.8%) and females with 2 vehicles (283, making up 65.9%).
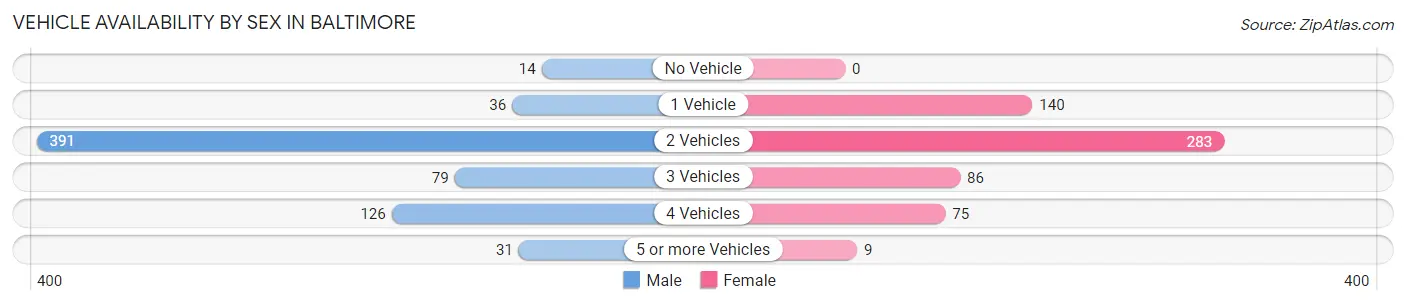
| Vehicles Available | Male | Female |
| No Vehicle | 14 (2.1%) | 0 (0.0%) |
| 1 Vehicle | 36 (5.3%) | 140 (23.6%) |
| 2 Vehicles | 391 (57.8%) | 283 (47.7%) |
| 3 Vehicles | 79 (11.7%) | 86 (14.5%) |
| 4 Vehicles | 126 (18.6%) | 75 (12.7%) |
| 5 or more Vehicles | 31 (4.6%) | 9 (1.5%) |
| Total | 677 (100.0%) | 593 (100.0%) |
Commute Time in Baltimore
The most frequently occuring commute durations in Baltimore are 30 to 34 minutes (196 commuters, 16.6%), 15 to 19 minutes (183 commuters, 15.5%), and 20 to 24 minutes (176 commuters, 14.9%).
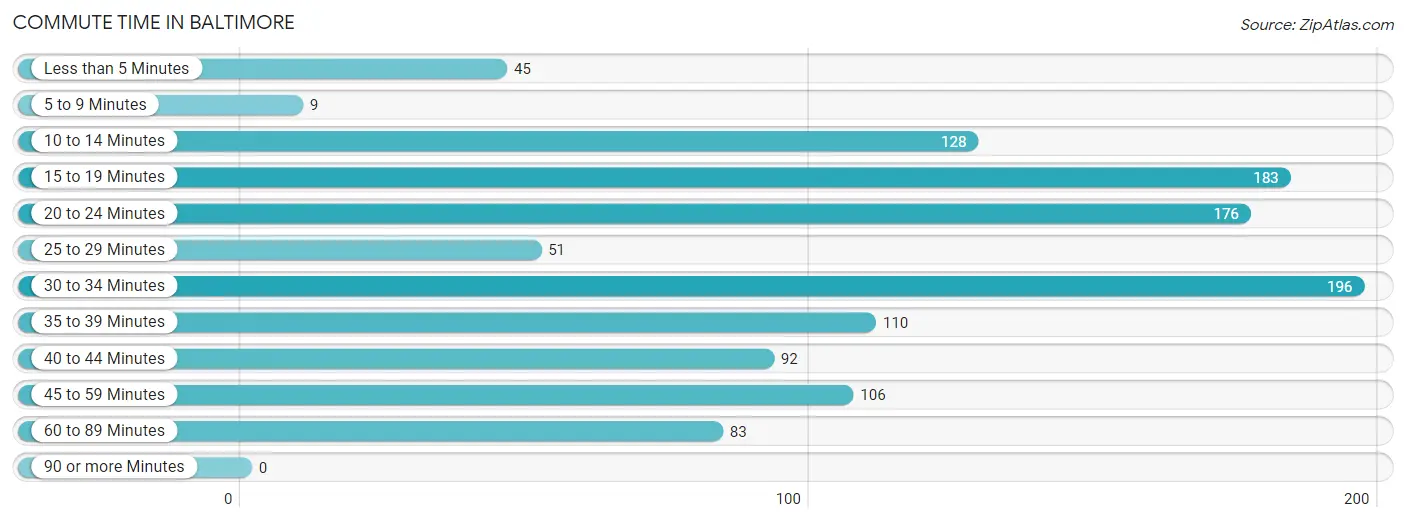
| Commute Time | # Commuters | % Commuters |
| Less than 5 Minutes | 45 | 3.8% |
| 5 to 9 Minutes | 9 | 0.8% |
| 10 to 14 Minutes | 128 | 10.9% |
| 15 to 19 Minutes | 183 | 15.5% |
| 20 to 24 Minutes | 176 | 14.9% |
| 25 to 29 Minutes | 51 | 4.3% |
| 30 to 34 Minutes | 196 | 16.6% |
| 35 to 39 Minutes | 110 | 9.3% |
| 40 to 44 Minutes | 92 | 7.8% |
| 45 to 59 Minutes | 106 | 9.0% |
| 60 to 89 Minutes | 83 | 7.0% |
| 90 or more Minutes | 0 | 0.0% |
Commute Time by Sex in Baltimore
The most common commute times in Baltimore are 15 to 19 minutes (117 commuters, 18.6%) for males and 30 to 34 minutes (169 commuters, 30.7%) for females.
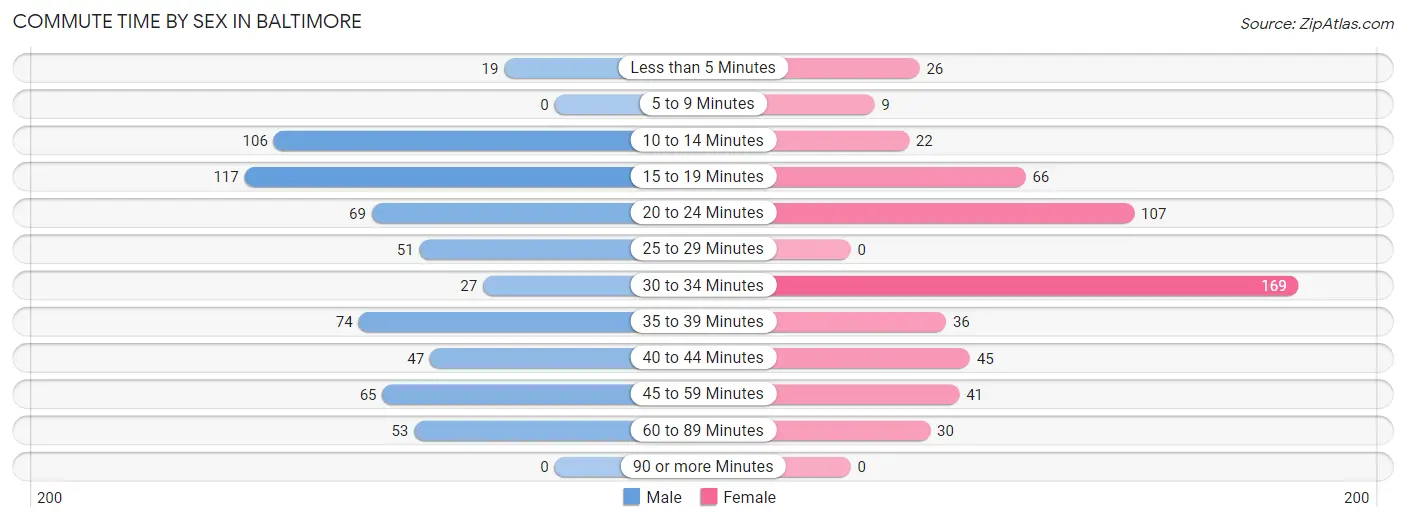
| Commute Time | Male | Female |
| Less than 5 Minutes | 19 (3.0%) | 26 (4.7%) |
| 5 to 9 Minutes | 0 (0.0%) | 9 (1.6%) |
| 10 to 14 Minutes | 106 (16.9%) | 22 (4.0%) |
| 15 to 19 Minutes | 117 (18.6%) | 66 (12.0%) |
| 20 to 24 Minutes | 69 (11.0%) | 107 (19.4%) |
| 25 to 29 Minutes | 51 (8.1%) | 0 (0.0%) |
| 30 to 34 Minutes | 27 (4.3%) | 169 (30.7%) |
| 35 to 39 Minutes | 74 (11.8%) | 36 (6.5%) |
| 40 to 44 Minutes | 47 (7.5%) | 45 (8.2%) |
| 45 to 59 Minutes | 65 (10.3%) | 41 (7.4%) |
| 60 to 89 Minutes | 53 (8.4%) | 30 (5.4%) |
| 90 or more Minutes | 0 (0.0%) | 0 (0.0%) |
Time of Departure to Work by Sex in Baltimore
The most frequent times of departure to work in Baltimore are 8:00 AM to 8:29 AM (99, 15.8%) for males and 6:30 AM to 6:59 AM (116, 21.0%) for females.
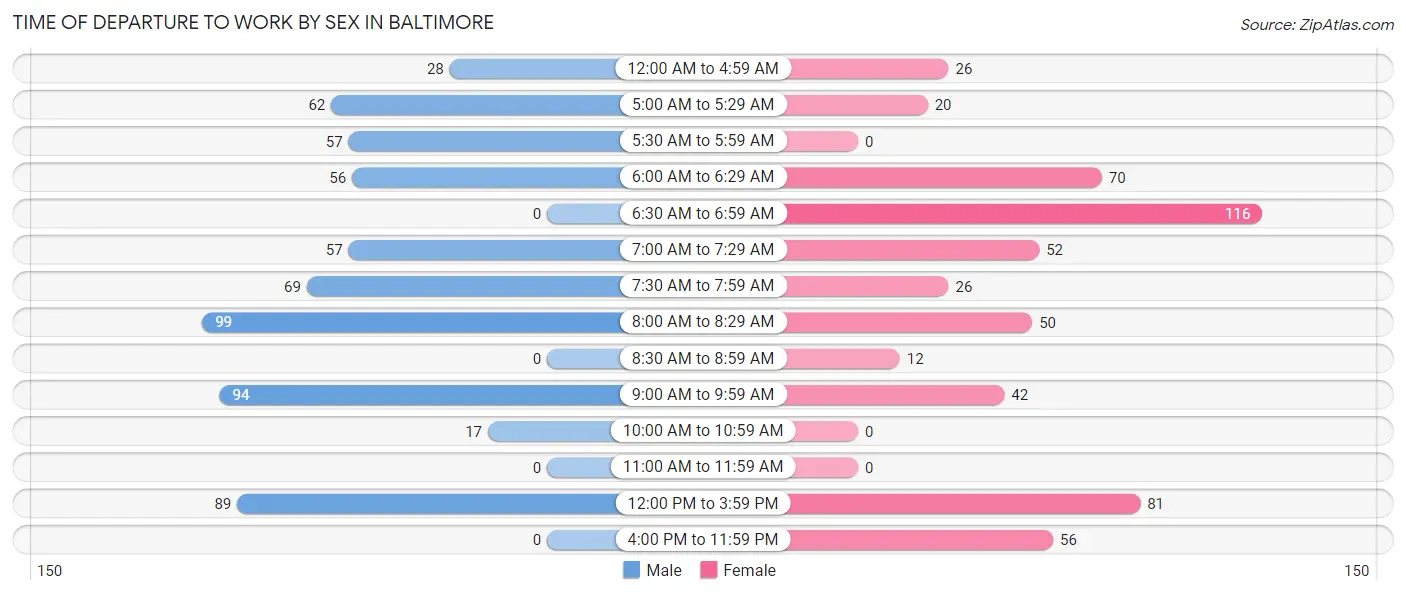
| Time of Departure | Male | Female |
| 12:00 AM to 4:59 AM | 28 (4.5%) | 26 (4.7%) |
| 5:00 AM to 5:29 AM | 62 (9.9%) | 20 (3.6%) |
| 5:30 AM to 5:59 AM | 57 (9.1%) | 0 (0.0%) |
| 6:00 AM to 6:29 AM | 56 (8.9%) | 70 (12.7%) |
| 6:30 AM to 6:59 AM | 0 (0.0%) | 116 (21.0%) |
| 7:00 AM to 7:29 AM | 57 (9.1%) | 52 (9.4%) |
| 7:30 AM to 7:59 AM | 69 (11.0%) | 26 (4.7%) |
| 8:00 AM to 8:29 AM | 99 (15.8%) | 50 (9.1%) |
| 8:30 AM to 8:59 AM | 0 (0.0%) | 12 (2.2%) |
| 9:00 AM to 9:59 AM | 94 (15.0%) | 42 (7.6%) |
| 10:00 AM to 10:59 AM | 17 (2.7%) | 0 (0.0%) |
| 11:00 AM to 11:59 AM | 0 (0.0%) | 0 (0.0%) |
| 12:00 PM to 3:59 PM | 89 (14.2%) | 81 (14.7%) |
| 4:00 PM to 11:59 PM | 0 (0.0%) | 56 (10.2%) |
| Total | 628 (100.0%) | 551 (100.0%) |
Housing Occupancy in Baltimore
Occupancy by Ownership in Baltimore
Of the total 1,316 dwellings in Baltimore, owner-occupied units account for 725 (55.1%), while renter-occupied units make up 591 (44.9%).
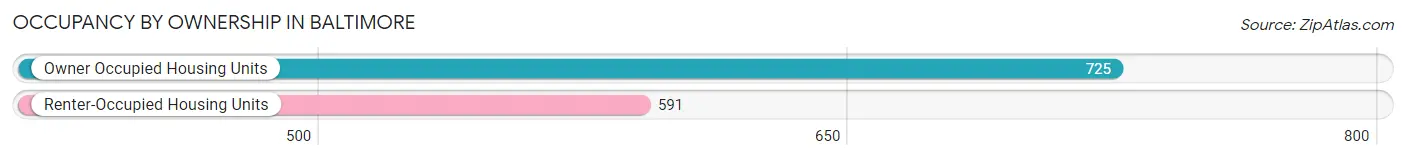
| Occupancy | # Housing Units | % Housing Units |
| Owner Occupied Housing Units | 725 | 55.1% |
| Renter-Occupied Housing Units | 591 | 44.9% |
| Total Occupied Housing Units | 1,316 | 100.0% |
Occupancy by Household Size in Baltimore
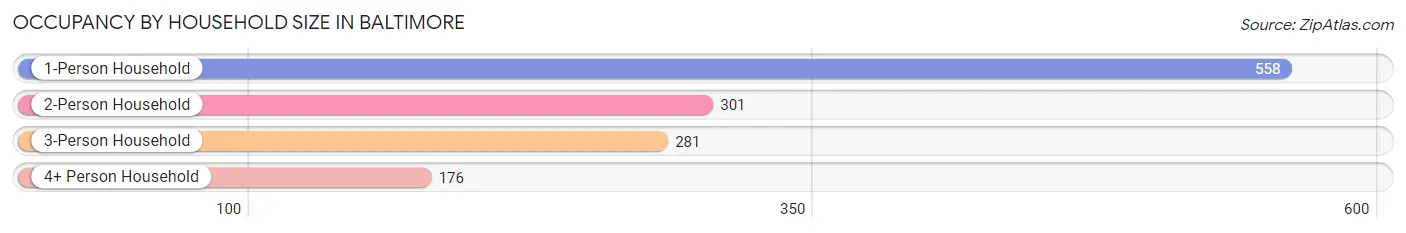
| Household Size | # Housing Units | % Housing Units |
| 1-Person Household | 558 | 42.4% |
| 2-Person Household | 301 | 22.9% |
| 3-Person Household | 281 | 21.3% |
| 4+ Person Household | 176 | 13.4% |
| Total Housing Units | 1,316 | 100.0% |
Occupancy by Ownership by Household Size in Baltimore
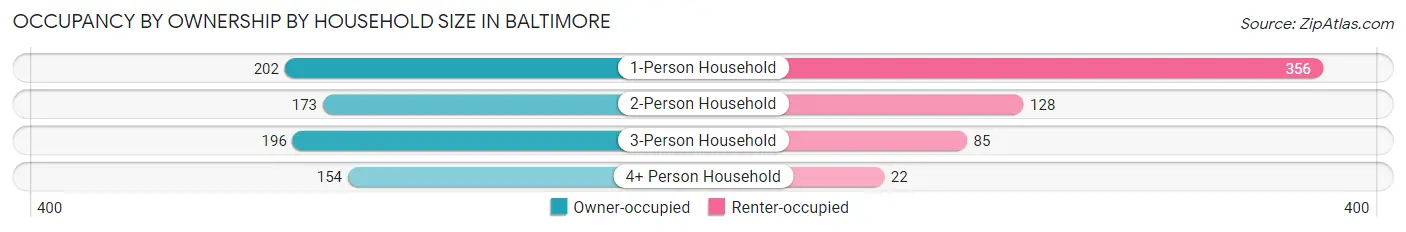
| Household Size | Owner-occupied | Renter-occupied |
| 1-Person Household | 202 (36.2%) | 356 (63.8%) |
| 2-Person Household | 173 (57.5%) | 128 (42.5%) |
| 3-Person Household | 196 (69.8%) | 85 (30.2%) |
| 4+ Person Household | 154 (87.5%) | 22 (12.5%) |
| Total Housing Units | 725 (55.1%) | 591 (44.9%) |
Occupancy by Educational Attainment in Baltimore
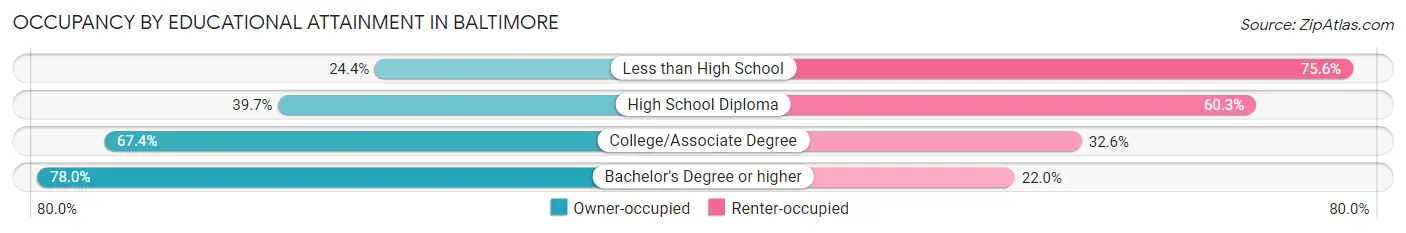
| Household Size | Owner-occupied | Renter-occupied |
| Less than High School | 10 (24.4%) | 31 (75.6%) |
| High School Diploma | 244 (39.7%) | 370 (60.3%) |
| College/Associate Degree | 283 (67.4%) | 137 (32.6%) |
| Bachelor's Degree or higher | 188 (78.0%) | 53 (22.0%) |
Occupancy by Age of Householder in Baltimore
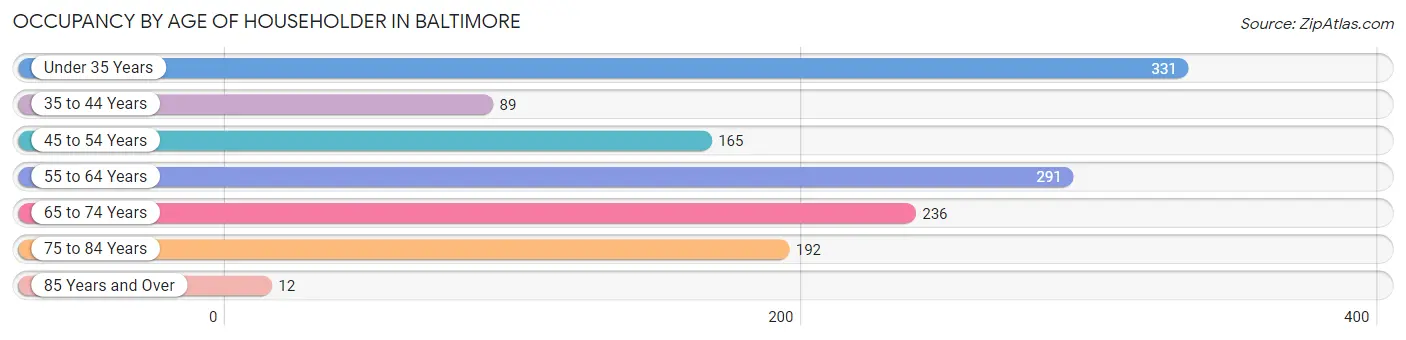
| Age Bracket | # Households | % Households |
| Under 35 Years | 331 | 25.2% |
| 35 to 44 Years | 89 | 6.8% |
| 45 to 54 Years | 165 | 12.5% |
| 55 to 64 Years | 291 | 22.1% |
| 65 to 74 Years | 236 | 17.9% |
| 75 to 84 Years | 192 | 14.6% |
| 85 Years and Over | 12 | 0.9% |
| Total | 1,316 | 100.0% |
Housing Finances in Baltimore
Median Income by Occupancy in Baltimore
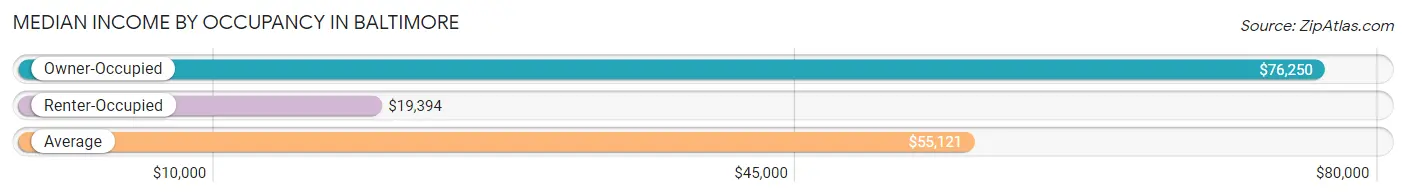
| Occupancy Type | # Households | Median Income |
| Owner-Occupied | 725 (55.1%) | $76,250 |
| Renter-Occupied | 591 (44.9%) | $19,394 |
| Average | 1,316 (100.0%) | $55,121 |
Occupancy by Householder Income Bracket in Baltimore
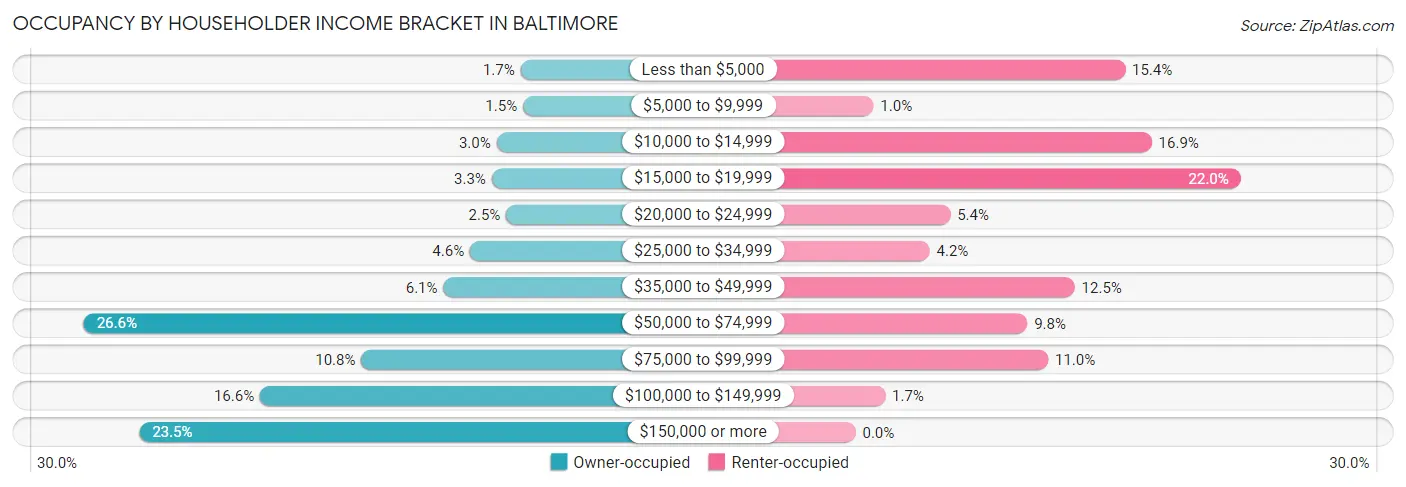
| Income Bracket | Owner-occupied | Renter-occupied |
| Less than $5,000 | 12 (1.7%) | 91 (15.4%) |
| $5,000 to $9,999 | 11 (1.5%) | 6 (1.0%) |
| $10,000 to $14,999 | 22 (3.0%) | 100 (16.9%) |
| $15,000 to $19,999 | 24 (3.3%) | 130 (22.0%) |
| $20,000 to $24,999 | 18 (2.5%) | 32 (5.4%) |
| $25,000 to $34,999 | 33 (4.5%) | 25 (4.2%) |
| $35,000 to $49,999 | 44 (6.1%) | 74 (12.5%) |
| $50,000 to $74,999 | 193 (26.6%) | 58 (9.8%) |
| $75,000 to $99,999 | 78 (10.8%) | 65 (11.0%) |
| $100,000 to $149,999 | 120 (16.6%) | 10 (1.7%) |
| $150,000 or more | 170 (23.4%) | 0 (0.0%) |
| Total | 725 (100.0%) | 591 (100.0%) |
Monthly Housing Cost Tiers in Baltimore
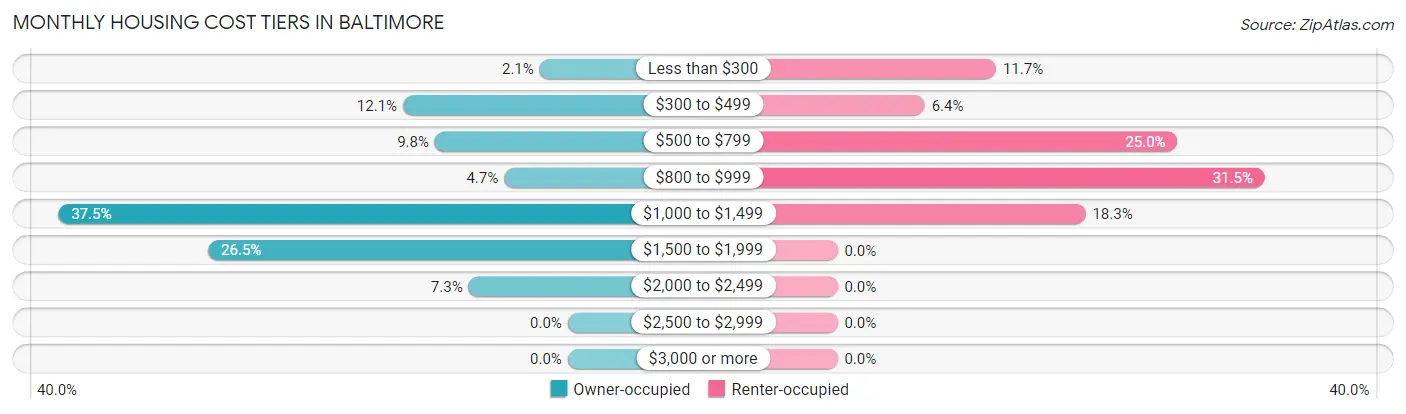
| Monthly Cost | Owner-occupied | Renter-occupied |
| Less than $300 | 15 (2.1%) | 69 (11.7%) |
| $300 to $499 | 88 (12.1%) | 38 (6.4%) |
| $500 to $799 | 71 (9.8%) | 148 (25.0%) |
| $800 to $999 | 34 (4.7%) | 186 (31.5%) |
| $1,000 to $1,499 | 272 (37.5%) | 108 (18.3%) |
| $1,500 to $1,999 | 192 (26.5%) | 0 (0.0%) |
| $2,000 to $2,499 | 53 (7.3%) | 0 (0.0%) |
| $2,500 to $2,999 | 0 (0.0%) | 0 (0.0%) |
| $3,000 or more | 0 (0.0%) | 0 (0.0%) |
| Total | 725 (100.0%) | 591 (100.0%) |
Physical Housing Characteristics in Baltimore
Housing Structures in Baltimore
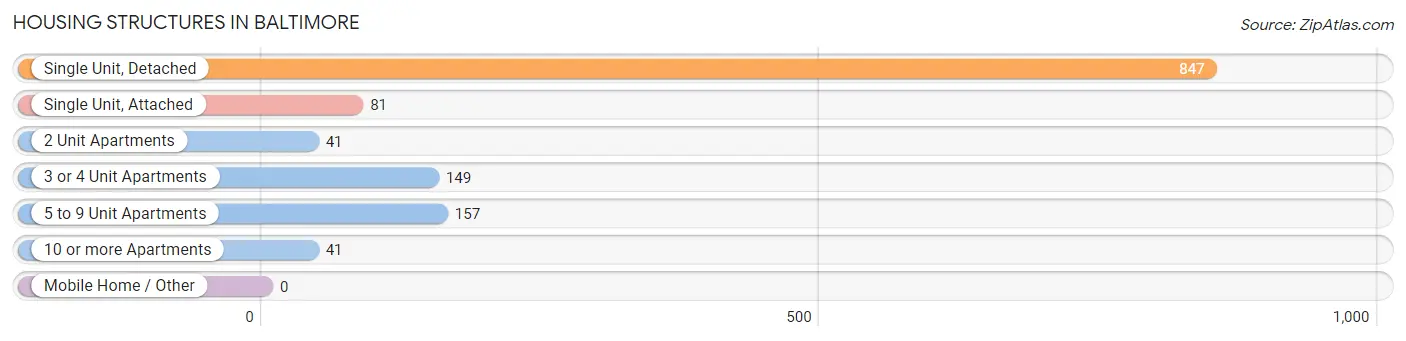
| Structure Type | # Housing Units | % Housing Units |
| Single Unit, Detached | 847 | 64.4% |
| Single Unit, Attached | 81 | 6.2% |
| 2 Unit Apartments | 41 | 3.1% |
| 3 or 4 Unit Apartments | 149 | 11.3% |
| 5 to 9 Unit Apartments | 157 | 11.9% |
| 10 or more Apartments | 41 | 3.1% |
| Mobile Home / Other | 0 | 0.0% |
| Total | 1,316 | 100.0% |
Housing Structures by Occupancy in Baltimore
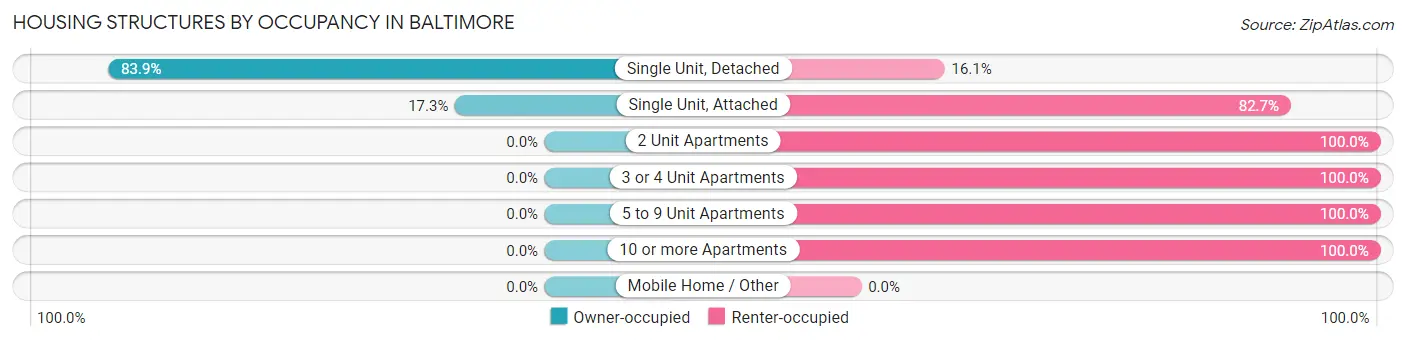
| Structure Type | Owner-occupied | Renter-occupied |
| Single Unit, Detached | 711 (83.9%) | 136 (16.1%) |
| Single Unit, Attached | 14 (17.3%) | 67 (82.7%) |
| 2 Unit Apartments | 0 (0.0%) | 41 (100.0%) |
| 3 or 4 Unit Apartments | 0 (0.0%) | 149 (100.0%) |
| 5 to 9 Unit Apartments | 0 (0.0%) | 157 (100.0%) |
| 10 or more Apartments | 0 (0.0%) | 41 (100.0%) |
| Mobile Home / Other | 0 (0.0%) | 0 (0.0%) |
| Total | 725 (55.1%) | 591 (44.9%) |
Housing Structures by Number of Rooms in Baltimore
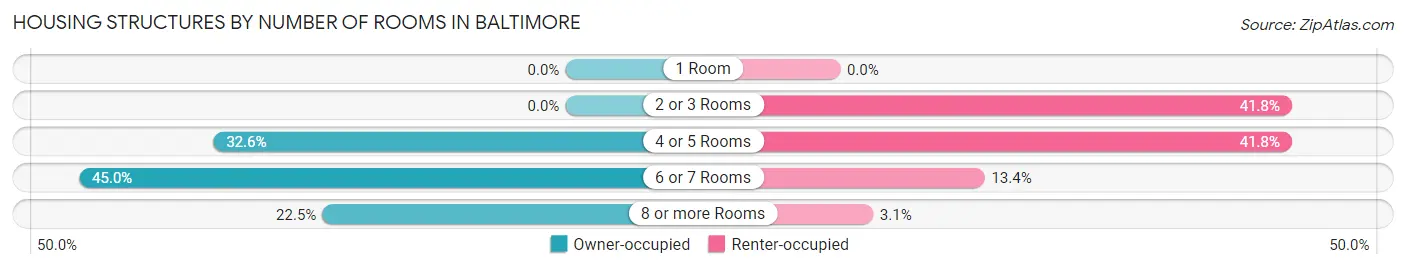
| Number of Rooms | Owner-occupied | Renter-occupied |
| 1 Room | 0 (0.0%) | 0 (0.0%) |
| 2 or 3 Rooms | 0 (0.0%) | 247 (41.8%) |
| 4 or 5 Rooms | 236 (32.6%) | 247 (41.8%) |
| 6 or 7 Rooms | 326 (45.0%) | 79 (13.4%) |
| 8 or more Rooms | 163 (22.5%) | 18 (3.0%) |
| Total | 725 (100.0%) | 591 (100.0%) |
Housing Structure by Heating Type in Baltimore
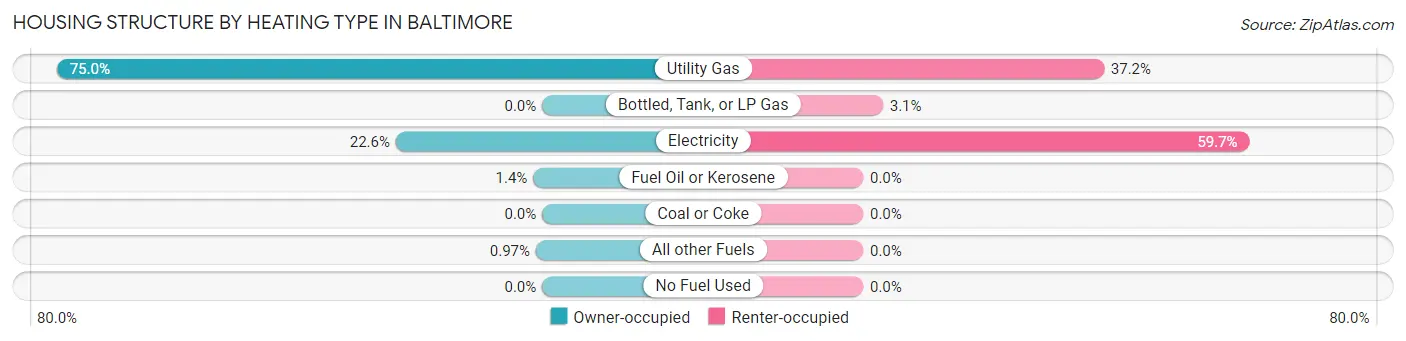
| Heating Type | Owner-occupied | Renter-occupied |
| Utility Gas | 544 (75.0%) | 220 (37.2%) |
| Bottled, Tank, or LP Gas | 0 (0.0%) | 18 (3.0%) |
| Electricity | 164 (22.6%) | 353 (59.7%) |
| Fuel Oil or Kerosene | 10 (1.4%) | 0 (0.0%) |
| Coal or Coke | 0 (0.0%) | 0 (0.0%) |
| All other Fuels | 7 (1.0%) | 0 (0.0%) |
| No Fuel Used | 0 (0.0%) | 0 (0.0%) |
| Total | 725 (100.0%) | 591 (100.0%) |
Household Vehicle Usage in Baltimore
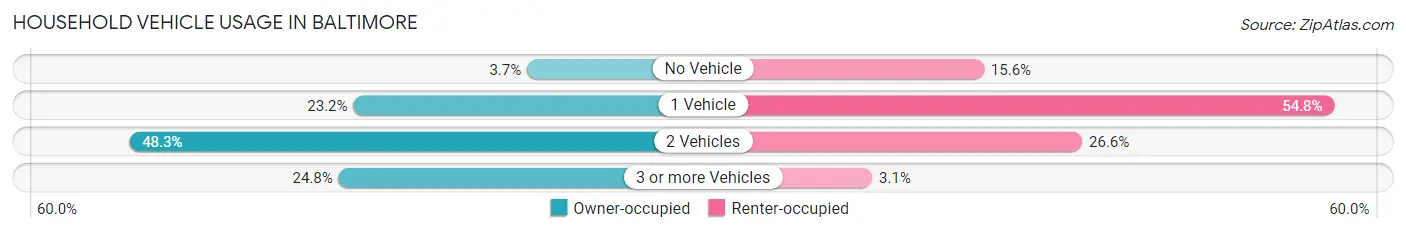
| Vehicles per Household | Owner-occupied | Renter-occupied |
| No Vehicle | 27 (3.7%) | 92 (15.6%) |
| 1 Vehicle | 168 (23.2%) | 324 (54.8%) |
| 2 Vehicles | 350 (48.3%) | 157 (26.6%) |
| 3 or more Vehicles | 180 (24.8%) | 18 (3.0%) |
| Total | 725 (100.0%) | 591 (100.0%) |
Real Estate & Mortgages in Baltimore
Real Estate and Mortgage Overview in Baltimore
| Characteristic | Without Mortgage | With Mortgage |
| Housing Units | 186 | 539 |
| Median Property Value | $169,700 | $184,700 |
| Median Household Income | $67,000 | $133 |
| Monthly Housing Costs | $477 | $0 |
| Real Estate Taxes | $2,293 | $14 |
Property Value by Mortgage Status in Baltimore
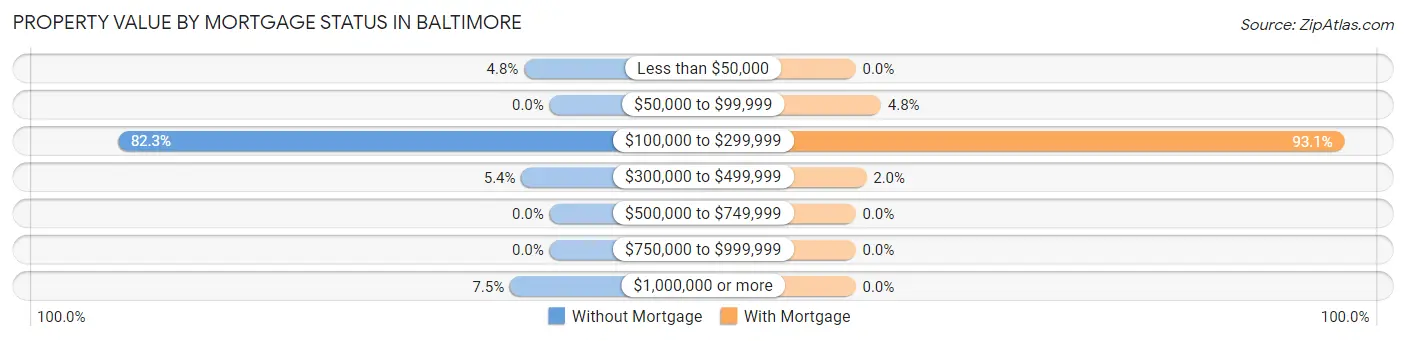
| Property Value | Without Mortgage | With Mortgage |
| Less than $50,000 | 9 (4.8%) | 0 (0.0%) |
| $50,000 to $99,999 | 0 (0.0%) | 26 (4.8%) |
| $100,000 to $299,999 | 153 (82.3%) | 502 (93.1%) |
| $300,000 to $499,999 | 10 (5.4%) | 11 (2.0%) |
| $500,000 to $749,999 | 0 (0.0%) | 0 (0.0%) |
| $750,000 to $999,999 | 0 (0.0%) | 0 (0.0%) |
| $1,000,000 or more | 14 (7.5%) | 0 (0.0%) |
| Total | 186 (100.0%) | 539 (100.0%) |
Household Income by Mortgage Status in Baltimore
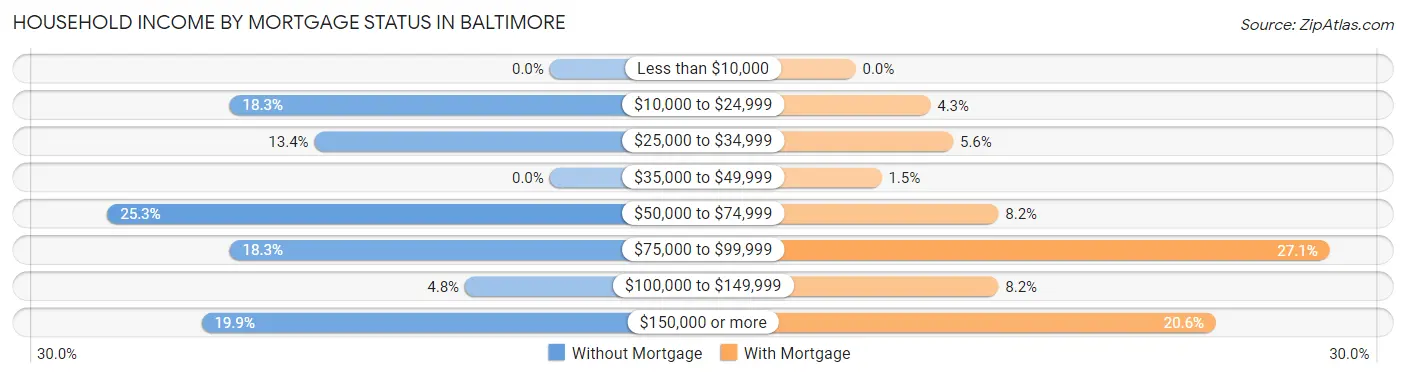
| Household Income | Without Mortgage | With Mortgage |
| Less than $10,000 | 0 (0.0%) | 0 (0.0%) |
| $10,000 to $24,999 | 34 (18.3%) | 23 (4.3%) |
| $25,000 to $34,999 | 25 (13.4%) | 30 (5.6%) |
| $35,000 to $49,999 | 0 (0.0%) | 8 (1.5%) |
| $50,000 to $74,999 | 47 (25.3%) | 44 (8.2%) |
| $75,000 to $99,999 | 34 (18.3%) | 146 (27.1%) |
| $100,000 to $149,999 | 9 (4.8%) | 44 (8.2%) |
| $150,000 or more | 37 (19.9%) | 111 (20.6%) |
| Total | 186 (100.0%) | 539 (100.0%) |
Property Value to Household Income Ratio in Baltimore
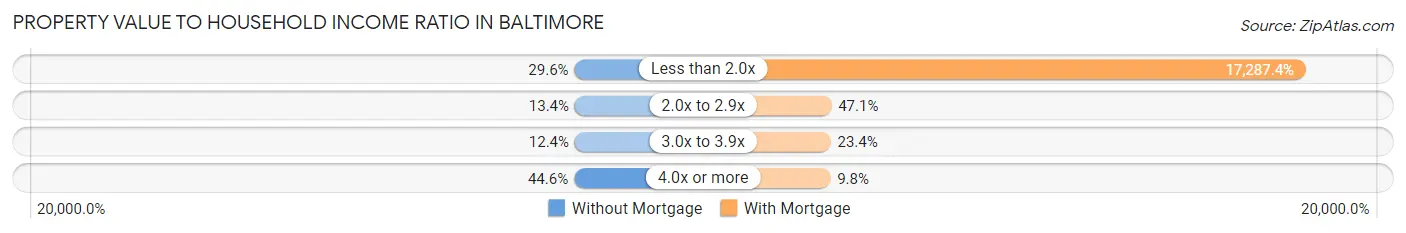
| Value-to-Income Ratio | Without Mortgage | With Mortgage |
| Less than 2.0x | 55 (29.6%) | 93,179 (17,287.4%) |
| 2.0x to 2.9x | 25 (13.4%) | 254 (47.1%) |
| 3.0x to 3.9x | 23 (12.4%) | 126 (23.4%) |
| 4.0x or more | 83 (44.6%) | 53 (9.8%) |
| Total | 186 (100.0%) | 539 (100.0%) |
Real Estate Taxes by Mortgage Status in Baltimore
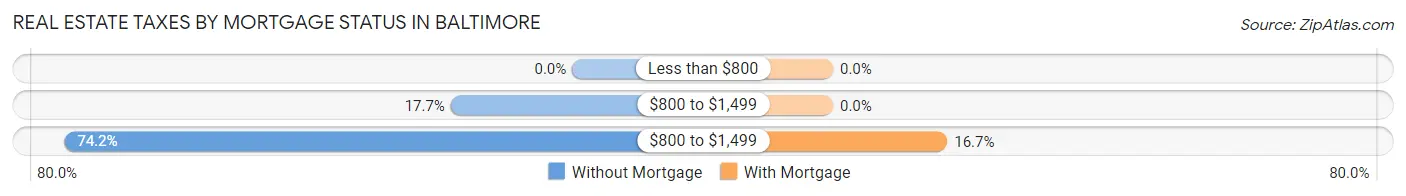
| Property Taxes | Without Mortgage | With Mortgage |
| Less than $800 | 0 (0.0%) | 0 (0.0%) |
| $800 to $1,499 | 33 (17.7%) | 0 (0.0%) |
| $800 to $1,499 | 138 (74.2%) | 90 (16.7%) |
| Total | 186 (100.0%) | 539 (100.0%) |
Health & Disability in Baltimore
Health Insurance Coverage by Age in Baltimore
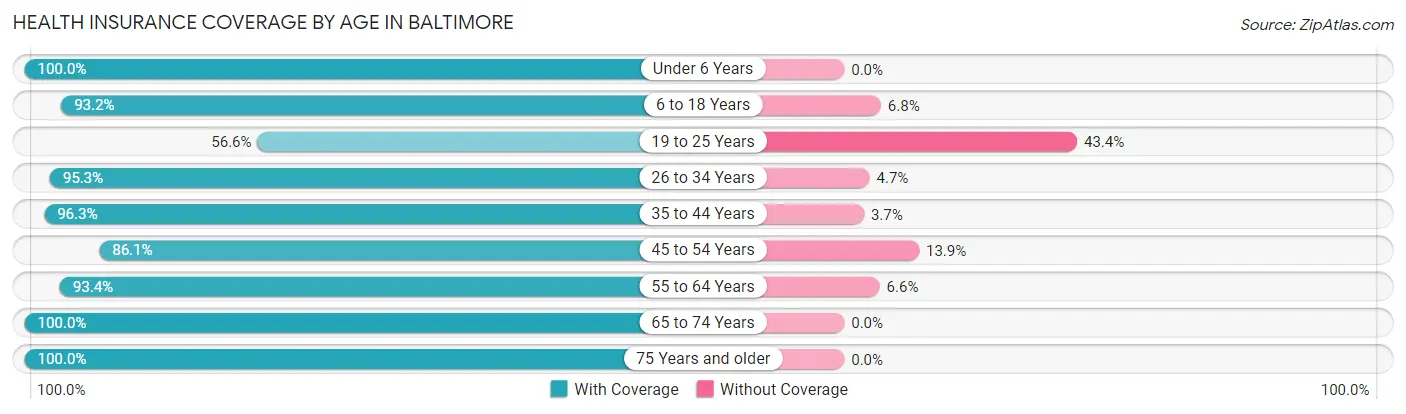
| Age Bracket | With Coverage | Without Coverage |
| Under 6 Years | 269 (100.0%) | 0 (0.0%) |
| 6 to 18 Years | 464 (93.2%) | 34 (6.8%) |
| 19 to 25 Years | 189 (56.6%) | 145 (43.4%) |
| 26 to 34 Years | 424 (95.3%) | 21 (4.7%) |
| 35 to 44 Years | 236 (96.3%) | 9 (3.7%) |
| 45 to 54 Years | 179 (86.1%) | 29 (13.9%) |
| 55 to 64 Years | 411 (93.4%) | 29 (6.6%) |
| 65 to 74 Years | 283 (100.0%) | 0 (0.0%) |
| 75 Years and older | 246 (100.0%) | 0 (0.0%) |
| Total | 2,701 (91.0%) | 267 (9.0%) |
Health Insurance Coverage by Citizenship Status in Baltimore
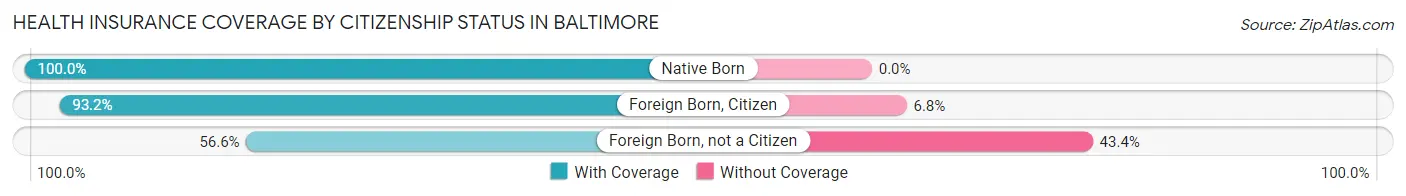
| Citizenship Status | With Coverage | Without Coverage |
| Native Born | 269 (100.0%) | 0 (0.0%) |
| Foreign Born, Citizen | 464 (93.2%) | 34 (6.8%) |
| Foreign Born, not a Citizen | 189 (56.6%) | 145 (43.4%) |
Health Insurance Coverage by Household Income in Baltimore
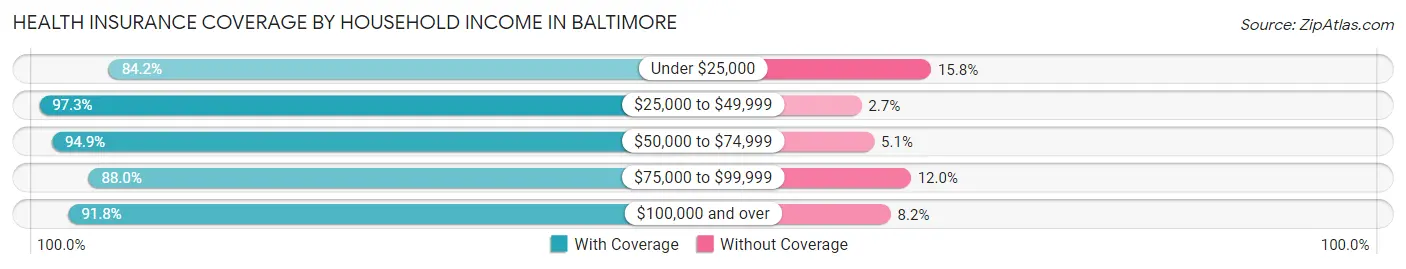
| Household Income | With Coverage | Without Coverage |
| Under $25,000 | 545 (84.2%) | 102 (15.8%) |
| $25,000 to $49,999 | 426 (97.3%) | 12 (2.7%) |
| $50,000 to $74,999 | 499 (94.9%) | 27 (5.1%) |
| $75,000 to $99,999 | 338 (88.0%) | 46 (12.0%) |
| $100,000 and over | 893 (91.8%) | 80 (8.2%) |
Public vs Private Health Insurance Coverage by Age in Baltimore
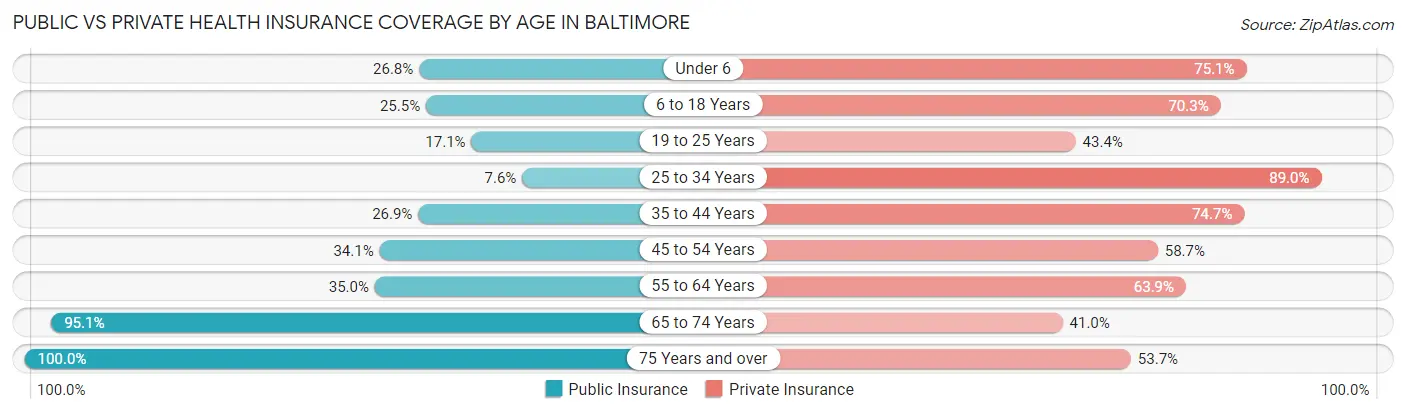
| Age Bracket | Public Insurance | Private Insurance |
| Under 6 | 72 (26.8%) | 202 (75.1%) |
| 6 to 18 Years | 127 (25.5%) | 350 (70.3%) |
| 19 to 25 Years | 57 (17.1%) | 145 (43.4%) |
| 25 to 34 Years | 34 (7.6%) | 396 (89.0%) |
| 35 to 44 Years | 66 (26.9%) | 183 (74.7%) |
| 45 to 54 Years | 71 (34.1%) | 122 (58.7%) |
| 55 to 64 Years | 154 (35.0%) | 281 (63.9%) |
| 65 to 74 Years | 269 (95.1%) | 116 (41.0%) |
| 75 Years and over | 246 (100.0%) | 132 (53.7%) |
| Total | 1,096 (36.9%) | 1,927 (64.9%) |
Disability Status by Sex by Age in Baltimore
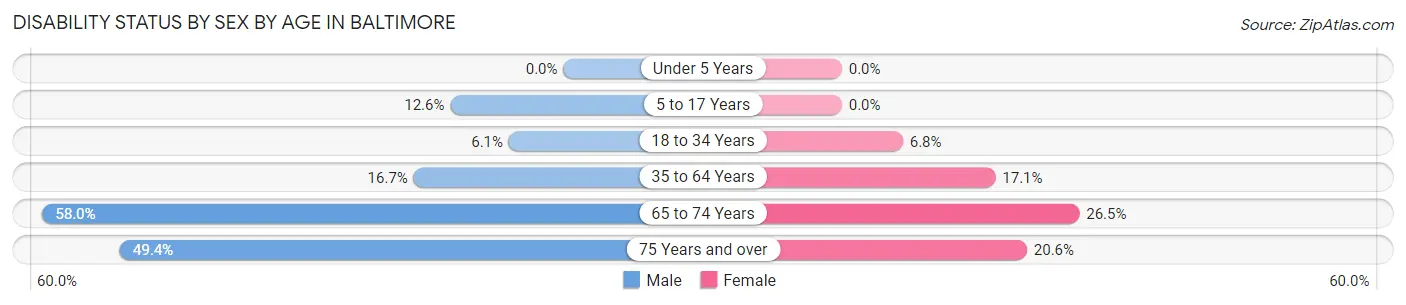
| Age Bracket | Male | Female |
| Under 5 Years | 0 (0.0%) | 0 (0.0%) |
| 5 to 17 Years | 36 (12.6%) | 0 (0.0%) |
| 18 to 34 Years | 25 (6.1%) | 26 (6.8%) |
| 35 to 64 Years | 66 (16.7%) | 85 (17.1%) |
| 65 to 74 Years | 94 (58.0%) | 32 (26.5%) |
| 75 Years and over | 40 (49.4%) | 34 (20.6%) |
Disability Class by Sex by Age in Baltimore
Disability Class: Hearing Difficulty
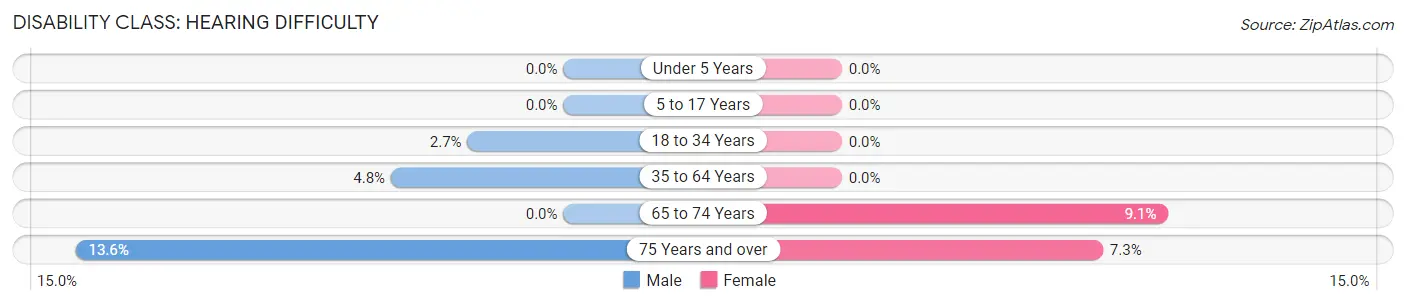
| Age Bracket | Male | Female |
| Under 5 Years | 0 (0.0%) | 0 (0.0%) |
| 5 to 17 Years | 0 (0.0%) | 0 (0.0%) |
| 18 to 34 Years | 11 (2.7%) | 0 (0.0%) |
| 35 to 64 Years | 19 (4.8%) | 0 (0.0%) |
| 65 to 74 Years | 0 (0.0%) | 11 (9.1%) |
| 75 Years and over | 11 (13.6%) | 12 (7.3%) |
Disability Class: Vision Difficulty
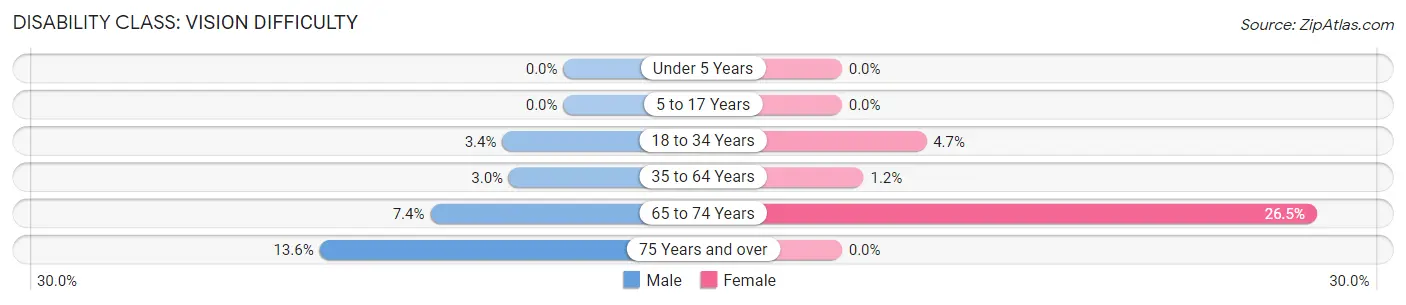
| Age Bracket | Male | Female |
| Under 5 Years | 0 (0.0%) | 0 (0.0%) |
| 5 to 17 Years | 0 (0.0%) | 0 (0.0%) |
| 18 to 34 Years | 14 (3.4%) | 18 (4.7%) |
| 35 to 64 Years | 12 (3.0%) | 6 (1.2%) |
| 65 to 74 Years | 12 (7.4%) | 32 (26.5%) |
| 75 Years and over | 11 (13.6%) | 0 (0.0%) |
Disability Class: Cognitive Difficulty
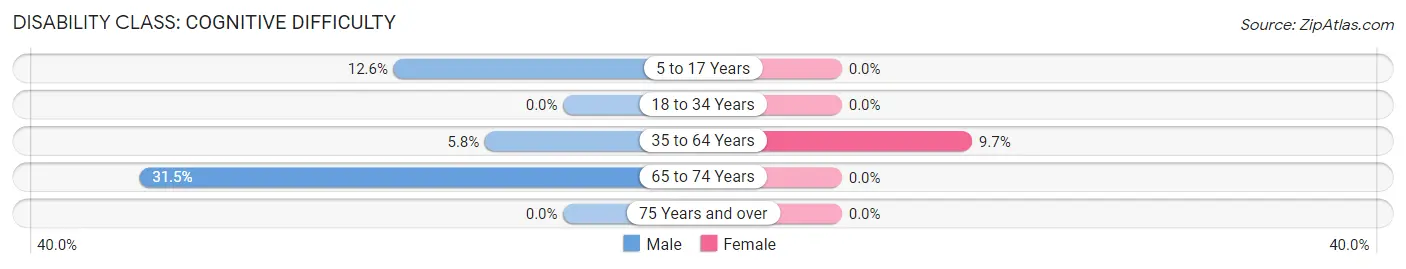
| Age Bracket | Male | Female |
| 5 to 17 Years | 36 (12.6%) | 0 (0.0%) |
| 18 to 34 Years | 0 (0.0%) | 0 (0.0%) |
| 35 to 64 Years | 23 (5.8%) | 48 (9.7%) |
| 65 to 74 Years | 51 (31.5%) | 0 (0.0%) |
| 75 Years and over | 0 (0.0%) | 0 (0.0%) |
Disability Class: Ambulatory Difficulty
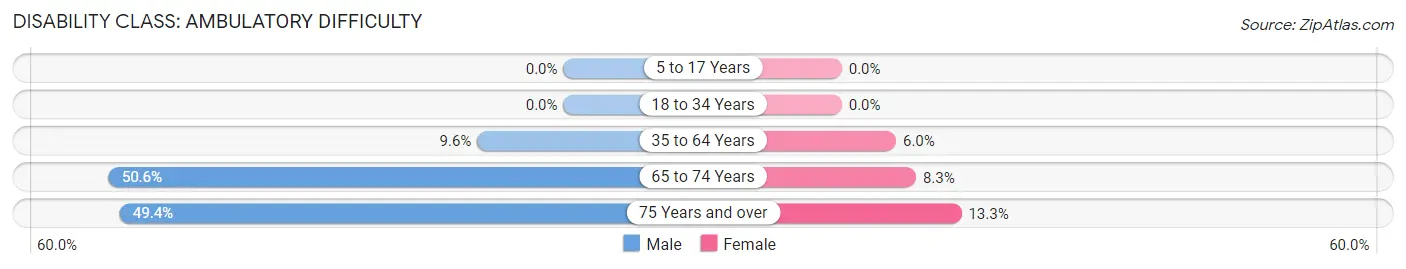
| Age Bracket | Male | Female |
| 5 to 17 Years | 0 (0.0%) | 0 (0.0%) |
| 18 to 34 Years | 0 (0.0%) | 0 (0.0%) |
| 35 to 64 Years | 38 (9.6%) | 30 (6.0%) |
| 65 to 74 Years | 82 (50.6%) | 10 (8.3%) |
| 75 Years and over | 40 (49.4%) | 22 (13.3%) |
Disability Class: Self-Care Difficulty
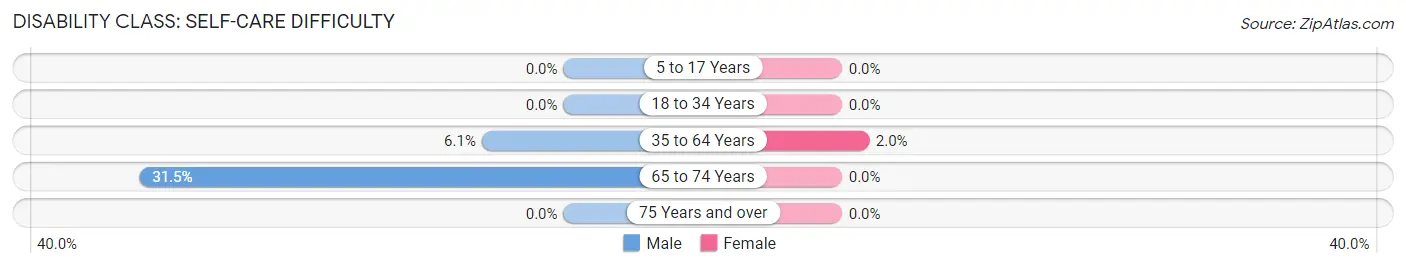
| Age Bracket | Male | Female |
| 5 to 17 Years | 0 (0.0%) | 0 (0.0%) |
| 18 to 34 Years | 0 (0.0%) | 0 (0.0%) |
| 35 to 64 Years | 24 (6.1%) | 10 (2.0%) |
| 65 to 74 Years | 51 (31.5%) | 0 (0.0%) |
| 75 Years and over | 0 (0.0%) | 0 (0.0%) |
Technology Access in Baltimore
Computing Device Access in Baltimore
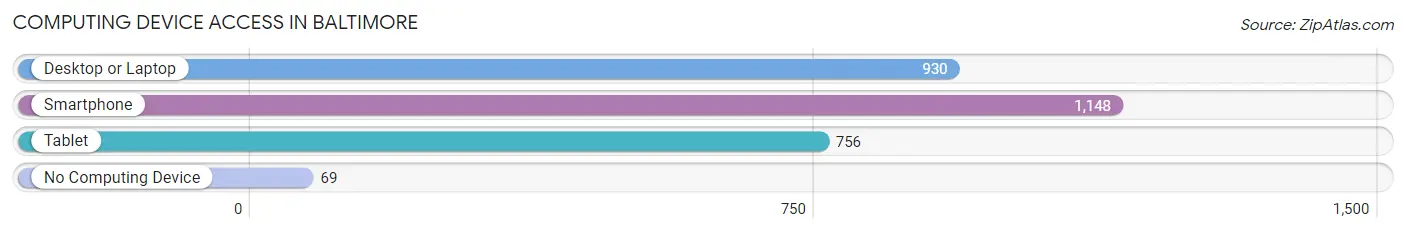
| Device Type | # Households | % Households |
| Desktop or Laptop | 930 | 70.7% |
| Smartphone | 1,148 | 87.2% |
| Tablet | 756 | 57.5% |
| No Computing Device | 69 | 5.2% |
| Total | 1,316 | 100.0% |
Internet Access in Baltimore
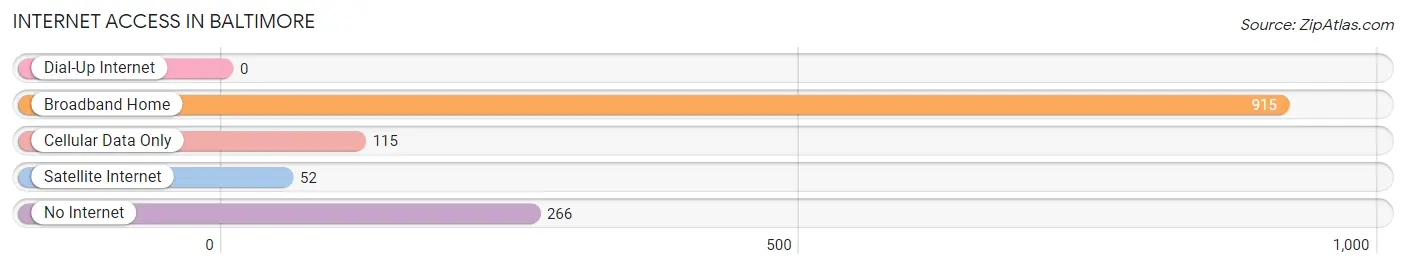
| Internet Type | # Households | % Households |
| Dial-Up Internet | 0 | 0.0% |
| Broadband Home | 915 | 69.5% |
| Cellular Data Only | 115 | 8.7% |
| Satellite Internet | 52 | 4.0% |
| No Internet | 266 | 20.2% |
| Total | 1,316 | 100.0% |
Baltimore Summary
Baltimore, Ohio is a small village located in the southeastern corner of Licking County, Ohio. It is situated on the banks of the Licking River, approximately 25 miles east of Columbus. The village has a population of approximately 1,500 people and is part of the Newark Metropolitan Statistical Area.
History
The area that is now Baltimore was first settled in 1806 by a group of settlers from Pennsylvania. The village was originally known as “Licking” and was later renamed “Baltimore” in 1817. The name was chosen in honor of the city of Baltimore, Maryland. The village was officially incorporated in 1833.
In the early 19th century, Baltimore was a thriving agricultural community. The village was home to several mills, including a grist mill, a saw mill, and a woolen mill. The village also had a blacksmith shop, a tannery, and a brickyard.
In the late 19th century, the village began to experience a period of growth and development. The Baltimore and Ohio Railroad was built through the village in 1851, connecting it to the larger cities of Newark and Columbus. This allowed the village to become a major shipping center for the surrounding area.
Geography
Baltimore is located in the southeastern corner of Licking County, Ohio. It is situated on the banks of the Licking River, approximately 25 miles east of Columbus. The village has a total area of 0.8 square miles, all of which is land.
The village is located in the Appalachian Plateau region of Ohio. The terrain is mostly flat, with some rolling hills. The climate is humid continental, with hot summers and cold winters.
Economy
The economy of Baltimore is largely based on agriculture and manufacturing. The village is home to several small businesses, including a grocery store, a hardware store, and a restaurant. The village also has a post office and a bank.
The village is also home to several industrial plants, including a paper mill, a plastics factory, and a metal fabrication plant. These plants provide employment for many of the village’s residents.
Demographics
As of the 2010 census, the population of Baltimore was 1,500. The racial makeup of the village was 97.3% White, 0.7% African American, 0.3% Native American, 0.3% Asian, and 1.3% from other races. Hispanic or Latino of any race were 1.3% of the population.
The median household income in Baltimore was $41,250, and the median family income was $50,000. The per capita income for the village was $20,945. About 11.3% of families and 14.3% of the population were below the poverty line, including 19.3% of those under age 18 and 8.3% of those age 65 or over.
Common Questions
What is Per Capita Income in Baltimore?
Per Capita income in Baltimore is $28,294.
What is the Median Family Income in Baltimore?
Median Family Income in Baltimore is $74,375.
What is the Median Household income in Baltimore?
Median Household Income in Baltimore is $55,121.
What is Income or Wage Gap in Baltimore?
Income or Wage Gap in Baltimore is 18.2%.
Women in Baltimore earn 81.8 cents for every dollar earned by a man.
What is Inequality or Gini Index in Baltimore?
Inequality or Gini Index in Baltimore is 0.46.
What is the Total Population of Baltimore?
Total Population of Baltimore is 2,968.
What is the Total Male Population of Baltimore?
Total Male Population of Baltimore is 1,495.
What is the Total Female Population of Baltimore?
Total Female Population of Baltimore is 1,473.
What is the Ratio of Males per 100 Females in Baltimore?
There are 101.49 Males per 100 Females in Baltimore.
What is the Ratio of Females per 100 Males in Baltimore?
There are 98.53 Females per 100 Males in Baltimore.
What is the Median Population Age in Baltimore?
Median Population Age in Baltimore is 33.4 Years.
What is the Average Family Size in Baltimore
Average Family Size in Baltimore is 3.0 People.
What is the Average Household Size in Baltimore
Average Household Size in Baltimore is 2.3 People.
How Large is the Labor Force in Baltimore?
There are 1,394 People in the Labor Forcein in Baltimore.
What is the Percentage of People in the Labor Force in Baltimore?
60.4% of People are in the Labor Force in Baltimore.
What is the Unemployment Rate in Baltimore?
Unemployment Rate in Baltimore is 6.5%.