Ashville, OH Map & Demographics
Ashville Map
Ashville Overview
$35,094
PER CAPITA INCOME
$77,083
AVG FAMILY INCOME
$60,293
AVG HOUSEHOLD INCOME
14.9%
WAGE / INCOME GAP [ % ]
85.1¢/ $1
WAGE / INCOME GAP [ $ ]
0.43
INEQUALITY / GINI INDEX
4,581
TOTAL POPULATION
2,170
MALE POPULATION
2,411
FEMALE POPULATION
90.00
MALES / 100 FEMALES
111.11
FEMALES / 100 MALES
35.1
MEDIAN AGE
3.2
AVG FAMILY SIZE
2.6
AVG HOUSEHOLD SIZE
2,266
LABOR FORCE [ PEOPLE ]
62.4%
PERCENT IN LABOR FORCE
4.3%
UNEMPLOYMENT RATE
Ashville Zip Codes
Ashville Area Codes
Income in Ashville
Income Overview in Ashville
Per Capita Income in Ashville is $35,094, while median incomes of families and households are $77,083 and $60,293 respectively.
| Characteristic | Number | Measure |
| Per Capita Income | 4,581 | $35,094 |
| Median Family Income | 1,228 | $77,083 |
| Mean Family Income | 1,228 | $93,641 |
| Median Household Income | 1,776 | $60,293 |
| Mean Household Income | 1,776 | $83,596 |
| Income Deficit | 1,228 | $0 |
| Wage / Income Gap (%) | 4,581 | 14.90% |
| Wage / Income Gap ($) | 4,581 | 85.10¢ per $1 |
| Gini / Inequality Index | 4,581 | 0.43 |
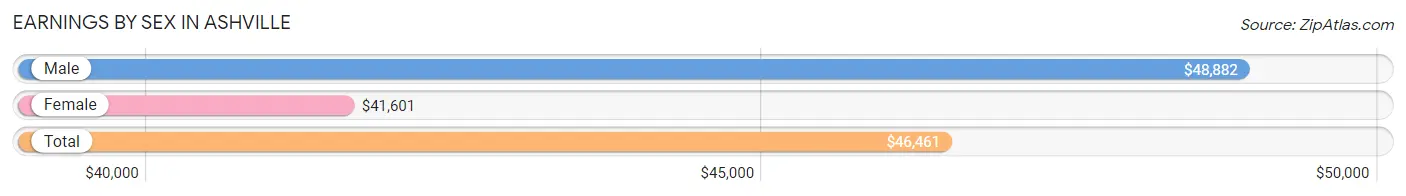
Earnings by Sex in Ashville
Average Earnings in Ashville are $46,461, $48,882 for men and $41,601 for women, a difference of 14.9%.
| Sex | Number | Average Earnings |
| Male | 1,241 (52.9%) | $48,882 |
| Female | 1,105 (47.1%) | $41,601 |
| Total | 2,346 (100.0%) | $46,461 |
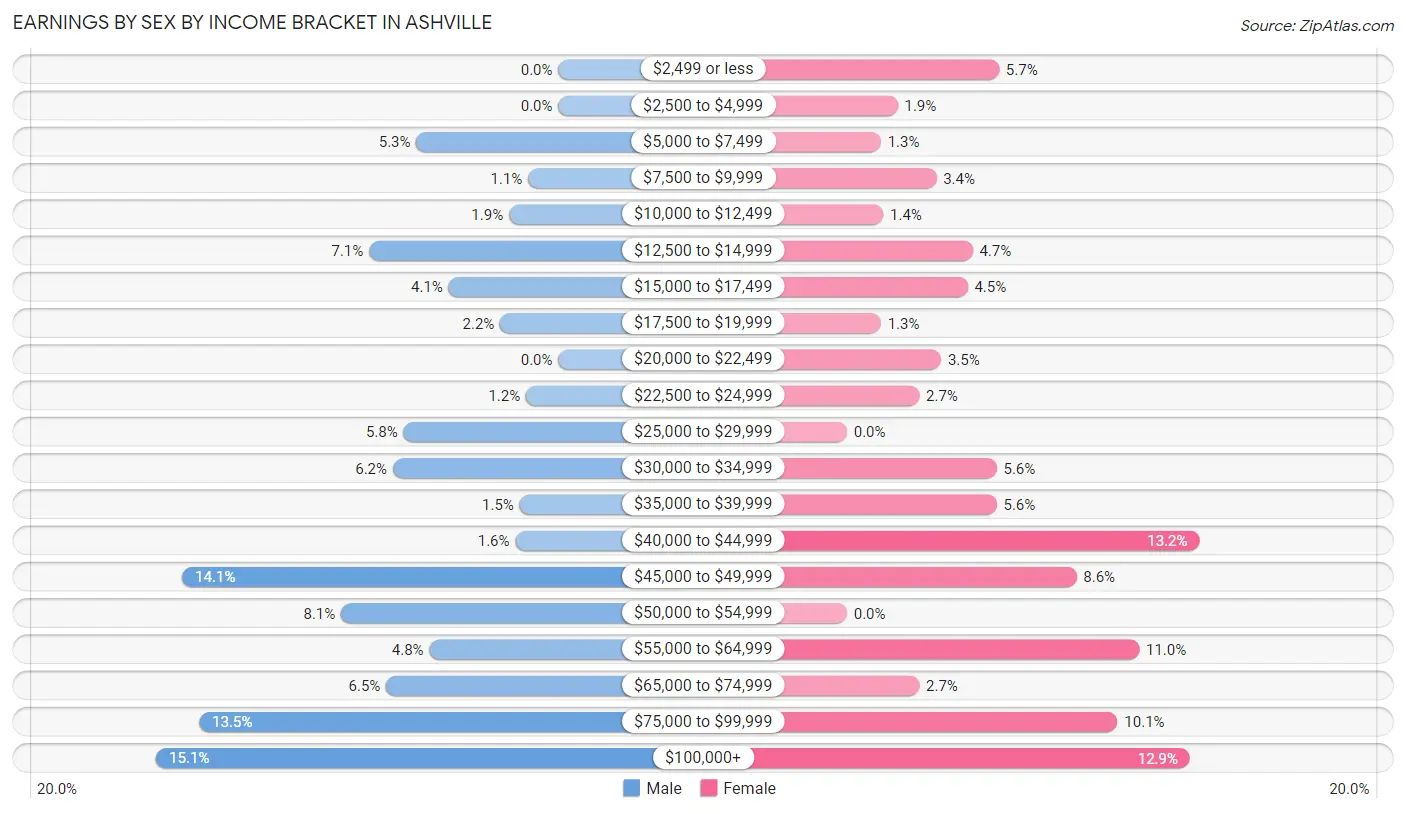
Earnings by Sex by Income Bracket in Ashville
The most common earnings brackets in Ashville are $100,000+ for men (187 | 15.1%) and $40,000 to $44,999 for women (146 | 13.2%).
| Income | Male | Female |
| $2,499 or less | 0 (0.0%) | 63 (5.7%) |
| $2,500 to $4,999 | 0 (0.0%) | 21 (1.9%) |
| $5,000 to $7,499 | 66 (5.3%) | 14 (1.3%) |
| $7,500 to $9,999 | 14 (1.1%) | 37 (3.4%) |
| $10,000 to $12,499 | 23 (1.8%) | 15 (1.4%) |
| $12,500 to $14,999 | 88 (7.1%) | 52 (4.7%) |
| $15,000 to $17,499 | 51 (4.1%) | 50 (4.5%) |
| $17,500 to $19,999 | 27 (2.2%) | 14 (1.3%) |
| $20,000 to $22,499 | 0 (0.0%) | 39 (3.5%) |
| $22,500 to $24,999 | 15 (1.2%) | 30 (2.7%) |
| $25,000 to $29,999 | 72 (5.8%) | 0 (0.0%) |
| $30,000 to $34,999 | 77 (6.2%) | 62 (5.6%) |
| $35,000 to $39,999 | 18 (1.5%) | 62 (5.6%) |
| $40,000 to $44,999 | 20 (1.6%) | 146 (13.2%) |
| $45,000 to $49,999 | 175 (14.1%) | 95 (8.6%) |
| $50,000 to $54,999 | 101 (8.1%) | 0 (0.0%) |
| $55,000 to $64,999 | 60 (4.8%) | 121 (11.0%) |
| $65,000 to $74,999 | 80 (6.5%) | 30 (2.7%) |
| $75,000 to $99,999 | 167 (13.5%) | 112 (10.1%) |
| $100,000+ | 187 (15.1%) | 142 (12.9%) |
| Total | 1,241 (100.0%) | 1,105 (100.0%) |
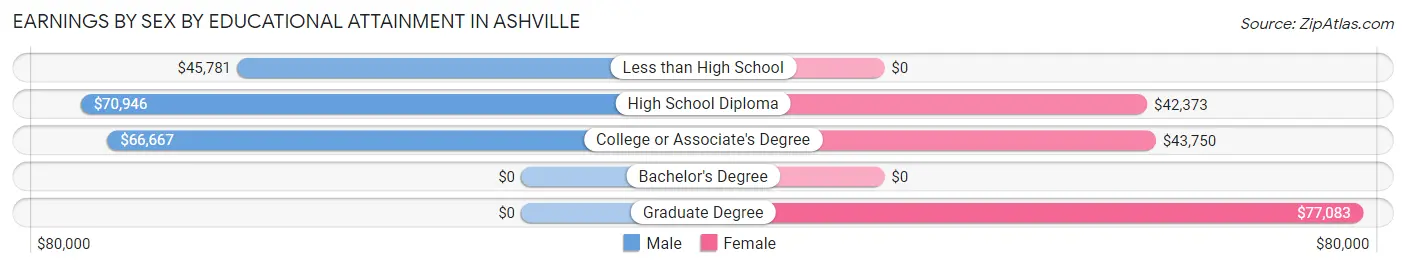
Earnings by Sex by Educational Attainment in Ashville
Average earnings in Ashville are $60,238 for men and $46,289 for women, a difference of 23.2%. Men with an educational attainment of high school diploma enjoy the highest average annual earnings of $70,946, while those with less than high school education earn the least with $45,781. Women with an educational attainment of graduate degree earn the most with the average annual earnings of $77,083, while those with high school diploma education have the smallest earnings of $42,373.
| Educational Attainment | Male Income | Female Income |
| Less than High School | $45,781 | $0 |
| High School Diploma | $70,946 | $42,373 |
| College or Associate's Degree | $66,667 | $43,750 |
| Bachelor's Degree | - | - |
| Graduate Degree | - | - |
| Total | $60,238 | $46,289 |
Family Income in Ashville
Family Income Brackets in Ashville
According to the Ashville family income data, there are 301 families falling into the $35,000 to $49,999 income range, which is the most common income bracket and makes up 24.5% of all families. Conversely, the $10,000 to $14,999 income bracket is the least frequent group with only 14 families (1.1%) belonging to this category.
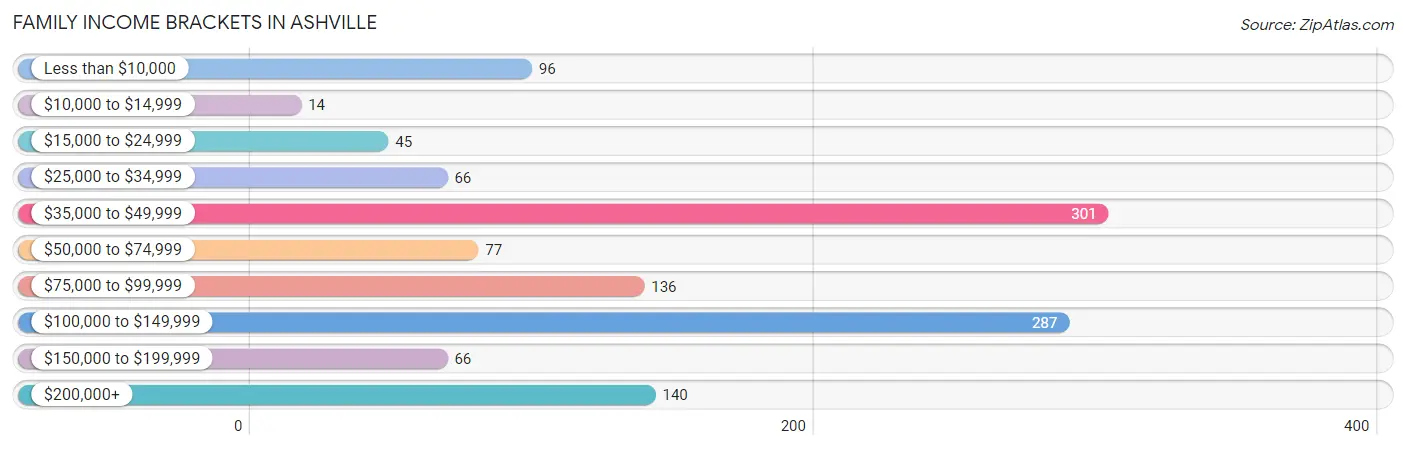
| Income Bracket | # Families | % Families |
| Less than $10,000 | 96 | 7.8% |
| $10,000 to $14,999 | 14 | 1.1% |
| $15,000 to $24,999 | 45 | 3.7% |
| $25,000 to $34,999 | 66 | 5.4% |
| $35,000 to $49,999 | 301 | 24.5% |
| $50,000 to $74,999 | 77 | 6.3% |
| $75,000 to $99,999 | 136 | 11.1% |
| $100,000 to $149,999 | 287 | 23.4% |
| $150,000 to $199,999 | 66 | 5.4% |
| $200,000+ | 140 | 11.4% |
Family Income by Famaliy Size in Ashville
5-person families (62 | 5.1%) account for the highest median family income in Ashville with $169,821 per family, while 5-person families (62 | 5.1%) have the highest median income of $33,964 per family member.
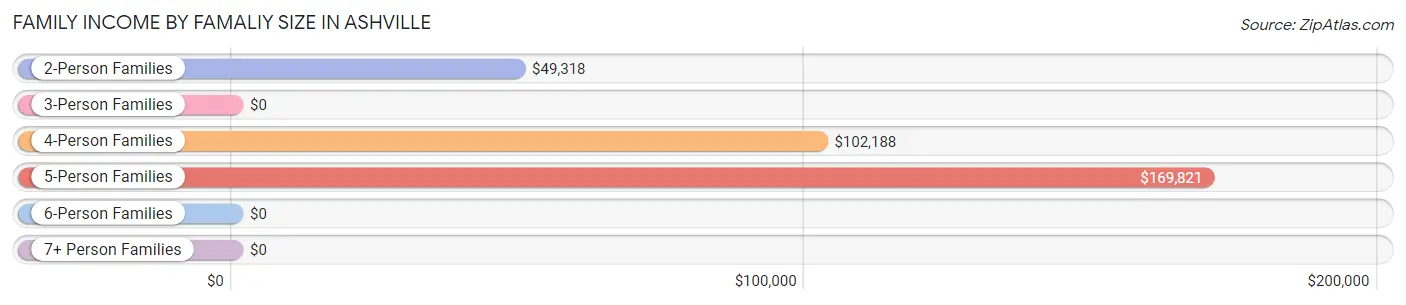
| Income Bracket | # Families | Median Income |
| 2-Person Families | 548 (44.6%) | $49,318 |
| 3-Person Families | 408 (33.2%) | $0 |
| 4-Person Families | 143 (11.6%) | $102,188 |
| 5-Person Families | 62 (5.1%) | $169,821 |
| 6-Person Families | 20 (1.6%) | $0 |
| 7+ Person Families | 47 (3.8%) | $0 |
| Total | 1,228 (100.0%) | $77,083 |
Family Income by Number of Earners in Ashville
The median family income in Ashville is $77,083, with families comprising 3+ earners (101) having the highest median family income of $128,681, while families with no earners (205) have the lowest median family income of $36,958, accounting for 8.2% and 16.7% of families, respectively.
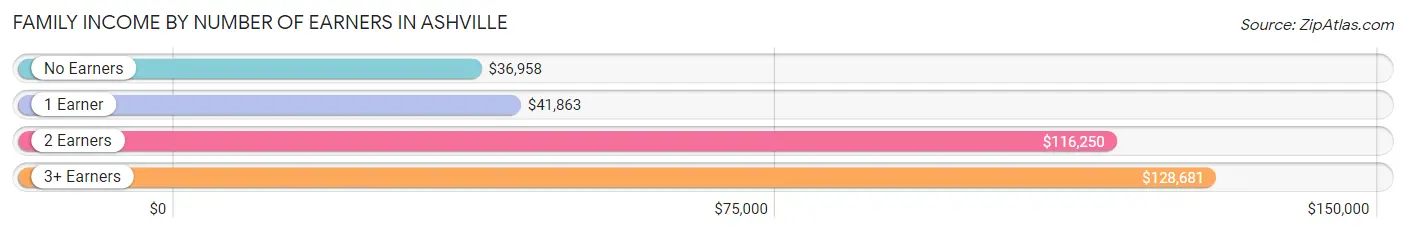
| Number of Earners | # Families | Median Income |
| No Earners | 205 (16.7%) | $36,958 |
| 1 Earner | 373 (30.4%) | $41,863 |
| 2 Earners | 549 (44.7%) | $116,250 |
| 3+ Earners | 101 (8.2%) | $128,681 |
| Total | 1,228 (100.0%) | $77,083 |
Household Income in Ashville
Household Income Brackets in Ashville
With 341 households falling in the category, the $35,000 to $49,999 income range is the most frequent in Ashville, accounting for 19.2% of all households. In contrast, only 67 households (3.8%) fall into the $10,000 to $14,999 income bracket, making it the least populous group.
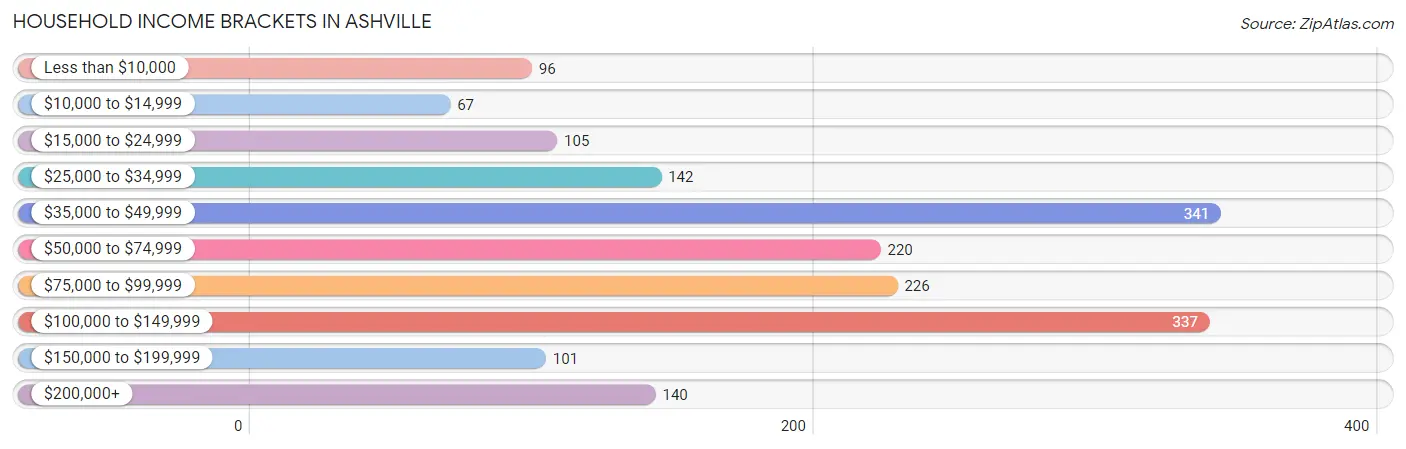
| Income Bracket | # Households | % Households |
| Less than $10,000 | 96 | 5.4% |
| $10,000 to $14,999 | 67 | 3.8% |
| $15,000 to $24,999 | 105 | 5.9% |
| $25,000 to $34,999 | 142 | 8.0% |
| $35,000 to $49,999 | 341 | 19.2% |
| $50,000 to $74,999 | 220 | 12.4% |
| $75,000 to $99,999 | 226 | 12.7% |
| $100,000 to $149,999 | 337 | 19.0% |
| $150,000 to $199,999 | 101 | 5.7% |
| $200,000+ | 140 | 7.9% |
Household Income by Householder Age in Ashville
The median household income in Ashville is $60,293, with the highest median household income of $90,772 found in the 45 to 64 years age bracket for the primary householder. A total of 713 households (40.2%) fall into this category. Meanwhile, the 15 to 24 years age bracket for the primary householder has the lowest median household income of $33,587, with 110 households (6.2%) in this group.
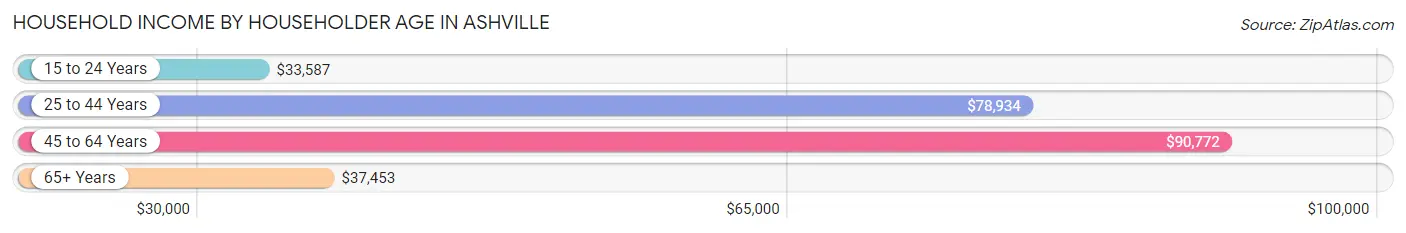
| Income Bracket | # Households | Median Income |
| 15 to 24 Years | 110 (6.2%) | $33,587 |
| 25 to 44 Years | 557 (31.4%) | $78,934 |
| 45 to 64 Years | 713 (40.2%) | $90,772 |
| 65+ Years | 396 (22.3%) | $37,453 |
| Total | 1,776 (100.0%) | $60,293 |
Poverty in Ashville
Income Below Poverty by Sex and Age in Ashville
With 9.1% poverty level for males and 6.7% for females among the residents of Ashville, 55 to 64 year old males and 16 and 17 year old females are the most vulnerable to poverty, with 79 males (29.9%) and 20 females (38.5%) in their respective age groups living below the poverty level.
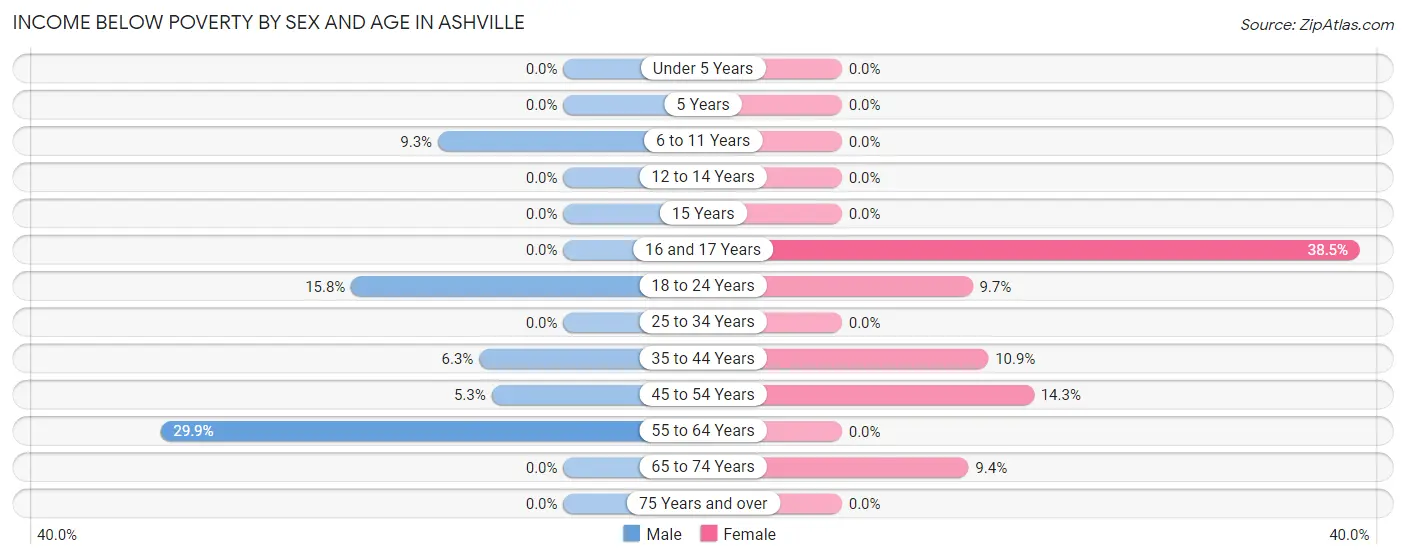
| Age Bracket | Male | Female |
| Under 5 Years | 0 (0.0%) | 0 (0.0%) |
| 5 Years | 0 (0.0%) | 0 (0.0%) |
| 6 to 11 Years | 19 (9.3%) | 0 (0.0%) |
| 12 to 14 Years | 0 (0.0%) | 0 (0.0%) |
| 15 Years | 0 (0.0%) | 0 (0.0%) |
| 16 and 17 Years | 0 (0.0%) | 20 (38.5%) |
| 18 to 24 Years | 66 (15.8%) | 32 (9.7%) |
| 25 to 34 Years | 0 (0.0%) | 0 (0.0%) |
| 35 to 44 Years | 14 (6.2%) | 40 (10.9%) |
| 45 to 54 Years | 20 (5.3%) | 56 (14.2%) |
| 55 to 64 Years | 79 (29.9%) | 0 (0.0%) |
| 65 to 74 Years | 0 (0.0%) | 14 (9.4%) |
| 75 Years and over | 0 (0.0%) | 0 (0.0%) |
| Total | 198 (9.1%) | 162 (6.7%) |
Income Above Poverty by Sex and Age in Ashville
According to the poverty statistics in Ashville, males aged under 5 years and females aged under 5 years are the age groups that are most secure financially, with 100.0% of males and 100.0% of females in these age groups living above the poverty line.
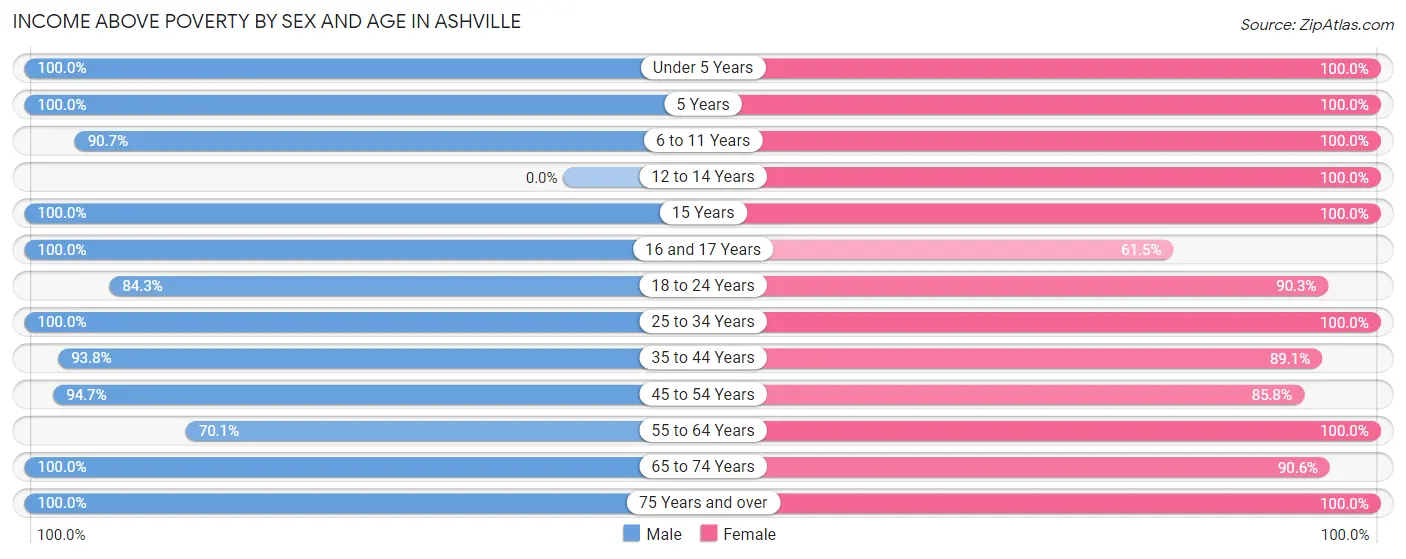
| Age Bracket | Male | Female |
| Under 5 Years | 123 (100.0%) | 53 (100.0%) |
| 5 Years | 10 (100.0%) | 43 (100.0%) |
| 6 to 11 Years | 185 (90.7%) | 384 (100.0%) |
| 12 to 14 Years | 0 (0.0%) | 35 (100.0%) |
| 15 Years | 16 (100.0%) | 82 (100.0%) |
| 16 and 17 Years | 132 (100.0%) | 32 (61.5%) |
| 18 to 24 Years | 353 (84.3%) | 298 (90.3%) |
| 25 to 34 Years | 233 (100.0%) | 166 (100.0%) |
| 35 to 44 Years | 210 (93.8%) | 328 (89.1%) |
| 45 to 54 Years | 355 (94.7%) | 337 (85.8%) |
| 55 to 64 Years | 185 (70.1%) | 186 (100.0%) |
| 65 to 74 Years | 67 (100.0%) | 135 (90.6%) |
| 75 Years and over | 103 (100.0%) | 170 (100.0%) |
| Total | 1,972 (90.9%) | 2,249 (93.3%) |
Income Below Poverty Among Married-Couple Families in Ashville
The poverty statistics for married-couple families in Ashville show that 4.6% or 38 of the total 833 families live below the poverty line. Families with 1 or 2 children have the highest poverty rate of 8.2%, comprising of 22 families. On the other hand, families with 3 or 4 children have the lowest poverty rate of 0.0%, which includes 0 families.
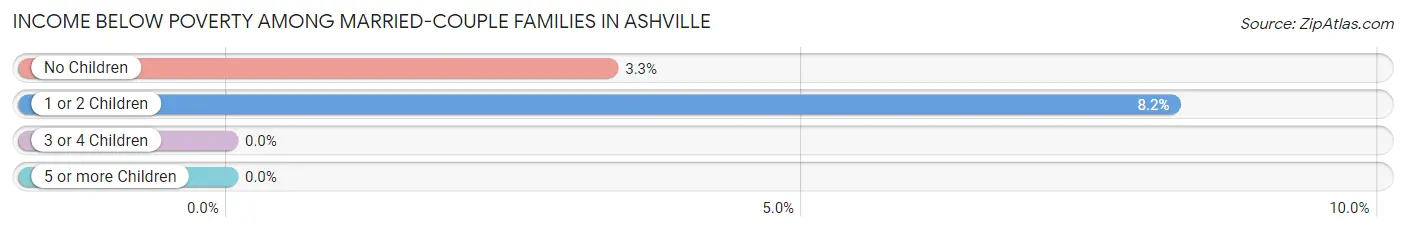
| Children | Above Poverty | Below Poverty |
| No Children | 468 (96.7%) | 16 (3.3%) |
| 1 or 2 Children | 246 (91.8%) | 22 (8.2%) |
| 3 or 4 Children | 34 (100.0%) | 0 (0.0%) |
| 5 or more Children | 47 (100.0%) | 0 (0.0%) |
| Total | 795 (95.4%) | 38 (4.6%) |
Income Below Poverty Among Single-Parent Households in Ashville
According to the poverty data in Ashville, 28.2% or 57 single-father households and 7.8% or 15 single-mother households are living below the poverty line. Among single-father households, those with no children have the highest poverty rate, with 57 households (63.3%) experiencing poverty. Likewise, among single-mother households, those with 1 or 2 children have the highest poverty rate, with 15 households (8.2%) falling below the poverty line.
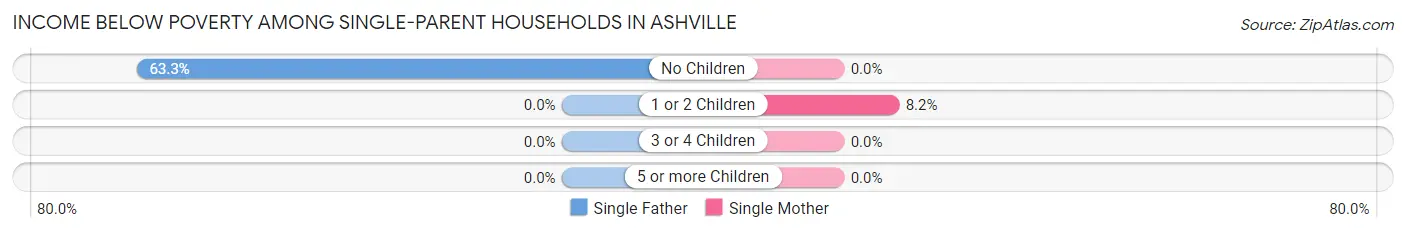
| Children | Single Father | Single Mother |
| No Children | 57 (63.3%) | 0 (0.0%) |
| 1 or 2 Children | 0 (0.0%) | 15 (8.2%) |
| 3 or 4 Children | 0 (0.0%) | 0 (0.0%) |
| 5 or more Children | 0 (0.0%) | 0 (0.0%) |
| Total | 57 (28.2%) | 15 (7.8%) |
Income Below Poverty Among Married-Couple vs Single-Parent Households in Ashville
The poverty data for Ashville shows that 38 of the married-couple family households (4.6%) and 72 of the single-parent households (18.2%) are living below the poverty level. Within the married-couple family households, those with 1 or 2 children have the highest poverty rate, with 22 households (8.2%) falling below the poverty line. Among the single-parent households, those with no children have the highest poverty rate, with 57 household (57.0%) living below poverty.
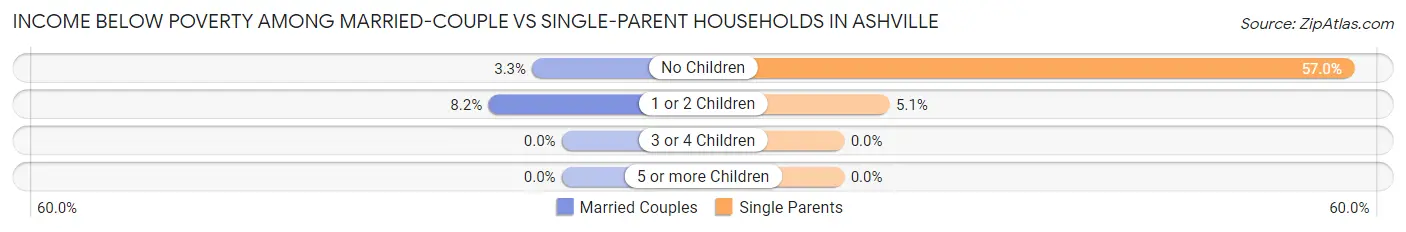
| Children | Married-Couple Families | Single-Parent Households |
| No Children | 16 (3.3%) | 57 (57.0%) |
| 1 or 2 Children | 22 (8.2%) | 15 (5.1%) |
| 3 or 4 Children | 0 (0.0%) | 0 (0.0%) |
| 5 or more Children | 0 (0.0%) | 0 (0.0%) |
| Total | 38 (4.6%) | 72 (18.2%) |
Race in Ashville
The most populous races in Ashville are White / Caucasian (4,323 | 94.4%), Hispanic or Latino (200 | 4.4%), and Black / African American (133 | 2.9%).
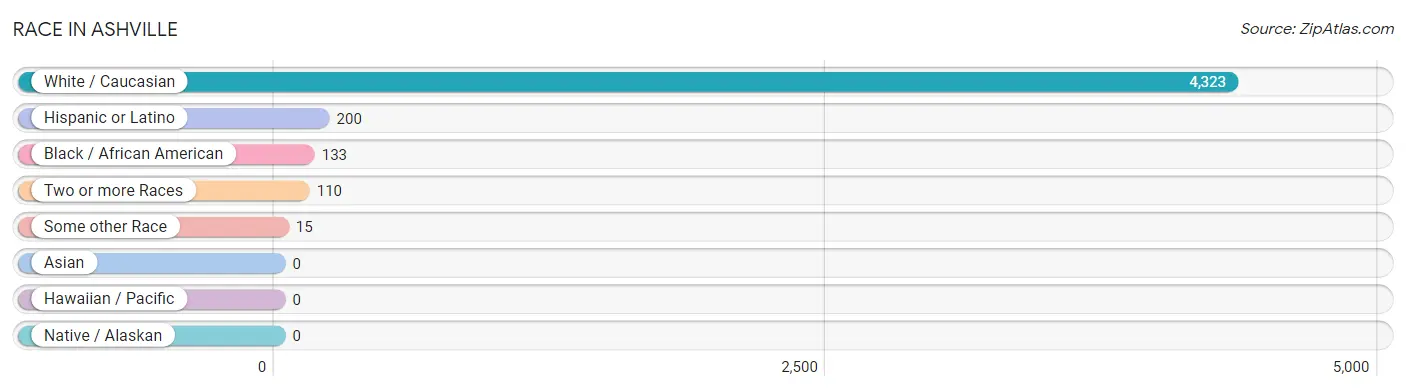
| Race | # Population | % Population |
| Asian | 0 | 0.0% |
| Black / African American | 133 | 2.9% |
| Hawaiian / Pacific | 0 | 0.0% |
| Hispanic or Latino | 200 | 4.4% |
| Native / Alaskan | 0 | 0.0% |
| White / Caucasian | 4,323 | 94.4% |
| Two or more Races | 110 | 2.4% |
| Some other Race | 15 | 0.3% |
| Total | 4,581 | 100.0% |
Ancestry in Ashville
The most populous ancestries reported in Ashville are German (917 | 20.0%), English (359 | 7.8%), American (338 | 7.4%), Scottish (322 | 7.0%), and Irish (251 | 5.5%), together accounting for 47.7% of all Ashville residents.
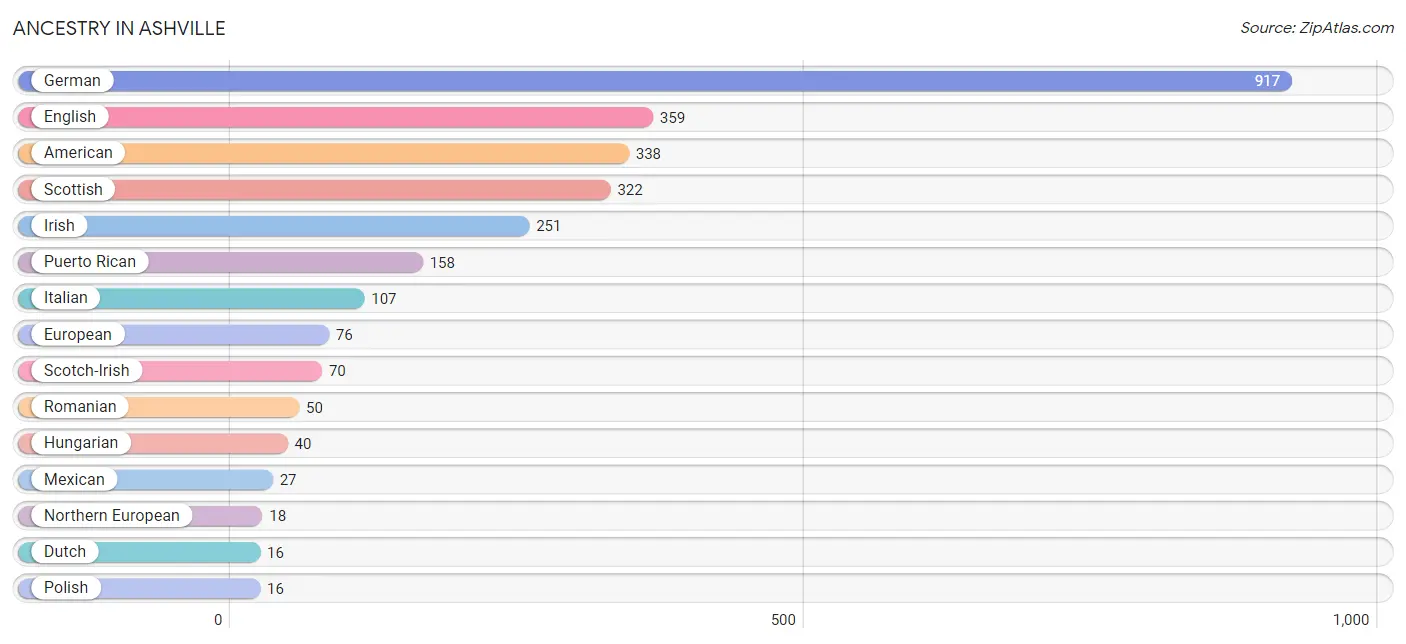
| Ancestry | # Population | % Population |
| American | 338 | 7.4% |
| Central American | 9 | 0.2% |
| Colombian | 6 | 0.1% |
| Dutch | 16 | 0.4% |
| English | 359 | 7.8% |
| European | 76 | 1.7% |
| German | 917 | 20.0% |
| Guatemalan | 9 | 0.2% |
| Hungarian | 40 | 0.9% |
| Irish | 251 | 5.5% |
| Italian | 107 | 2.3% |
| Mexican | 27 | 0.6% |
| Northern European | 18 | 0.4% |
| Norwegian | 13 | 0.3% |
| Polish | 16 | 0.4% |
| Puerto Rican | 158 | 3.5% |
| Romanian | 50 | 1.1% |
| Scotch-Irish | 70 | 1.5% |
| Scottish | 322 | 7.0% |
| Sioux | 3 | 0.1% |
| Slovene | 16 | 0.4% |
| South American | 6 | 0.1% | View All 22 Rows |
Immigrants in Ashville
The most numerous immigrant groups reported in Ashville came from Latin America (26 | 0.6%), Central America (20 | 0.4%), Mexico (11 | 0.2%), Guatemala (9 | 0.2%), and Colombia (6 | 0.1%), together accounting for 1.6% of all Ashville residents.
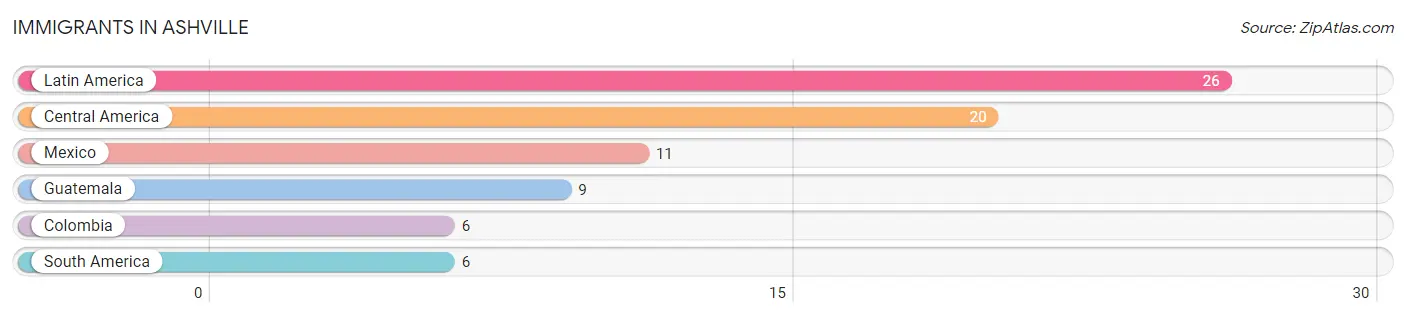
| Immigration Origin | # Population | % Population |
| Central America | 20 | 0.4% |
| Colombia | 6 | 0.1% |
| Guatemala | 9 | 0.2% |
| Latin America | 26 | 0.6% |
| Mexico | 11 | 0.2% |
| South America | 6 | 0.1% | View All 6 Rows |
Sex and Age in Ashville
Sex and Age in Ashville
The most populous age groups in Ashville are 15 to 19 Years (319 | 14.7%) for men and 5 to 9 Years (357 | 14.8%) for women.
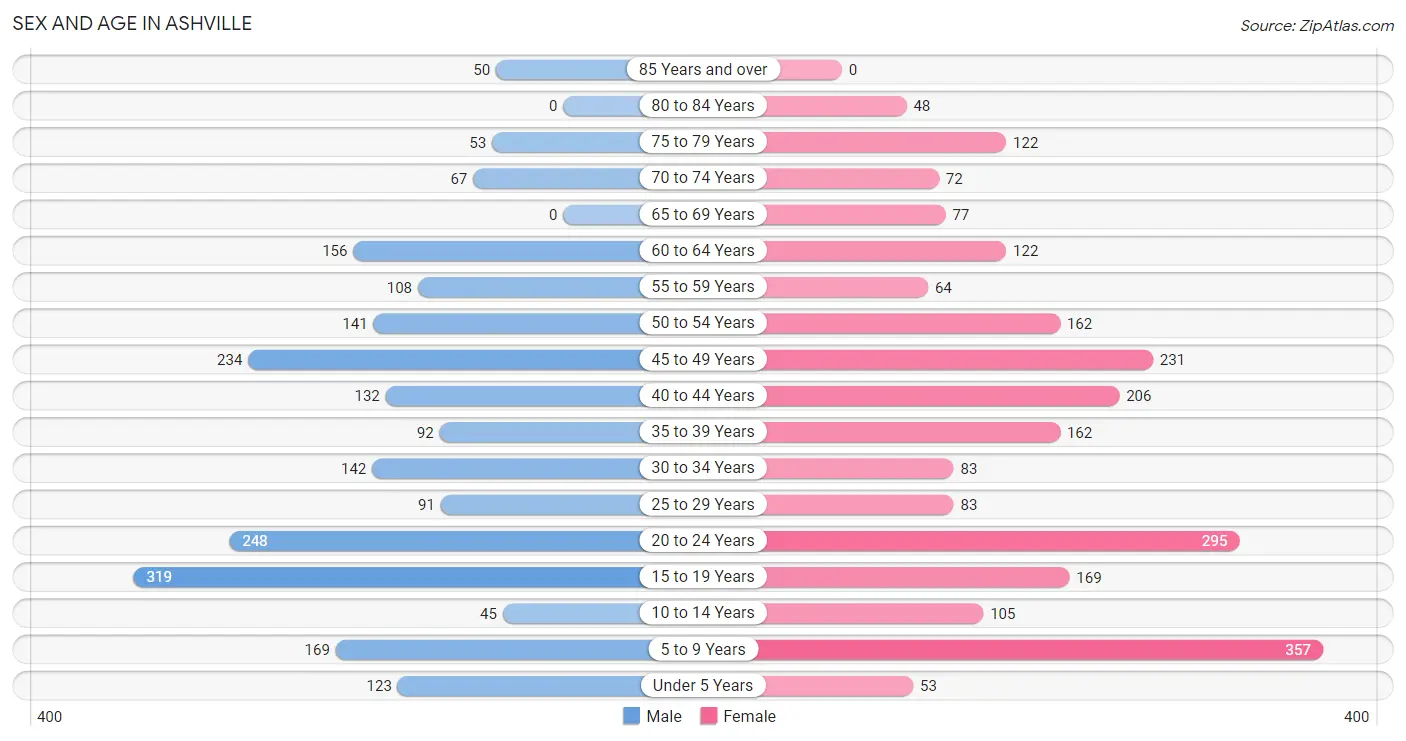
| Age Bracket | Male | Female |
| Under 5 Years | 123 (5.7%) | 53 (2.2%) |
| 5 to 9 Years | 169 (7.8%) | 357 (14.8%) |
| 10 to 14 Years | 45 (2.1%) | 105 (4.4%) |
| 15 to 19 Years | 319 (14.7%) | 169 (7.0%) |
| 20 to 24 Years | 248 (11.4%) | 295 (12.2%) |
| 25 to 29 Years | 91 (4.2%) | 83 (3.4%) |
| 30 to 34 Years | 142 (6.5%) | 83 (3.4%) |
| 35 to 39 Years | 92 (4.2%) | 162 (6.7%) |
| 40 to 44 Years | 132 (6.1%) | 206 (8.5%) |
| 45 to 49 Years | 234 (10.8%) | 231 (9.6%) |
| 50 to 54 Years | 141 (6.5%) | 162 (6.7%) |
| 55 to 59 Years | 108 (5.0%) | 64 (2.6%) |
| 60 to 64 Years | 156 (7.2%) | 122 (5.1%) |
| 65 to 69 Years | 0 (0.0%) | 77 (3.2%) |
| 70 to 74 Years | 67 (3.1%) | 72 (3.0%) |
| 75 to 79 Years | 53 (2.4%) | 122 (5.1%) |
| 80 to 84 Years | 0 (0.0%) | 48 (2.0%) |
| 85 Years and over | 50 (2.3%) | 0 (0.0%) |
| Total | 2,170 (100.0%) | 2,411 (100.0%) |
Families and Households in Ashville
Median Family Size in Ashville
The median family size in Ashville is 3.16 persons per family, with married-couple families (833 | 67.8%) accounting for the largest median family size of 3.45 persons per family. On the other hand, single male/father families (202 | 16.5%) represent the smallest median family size with 2.49 persons per family.
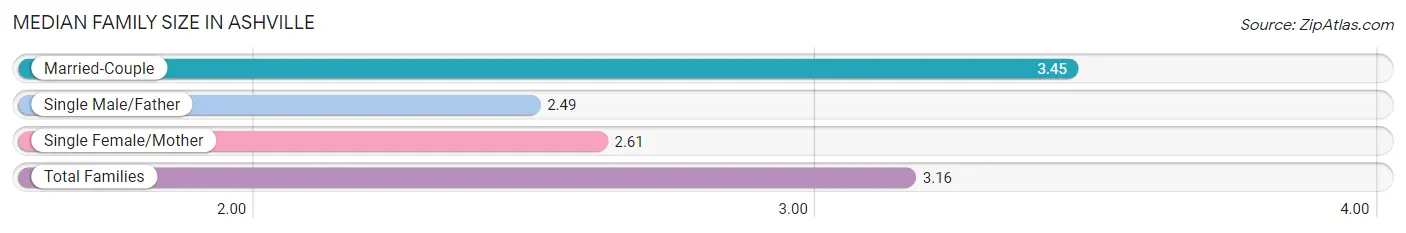
| Family Type | # Families | Family Size |
| Married-Couple | 833 (67.8%) | 3.45 |
| Single Male/Father | 202 (16.5%) | 2.49 |
| Single Female/Mother | 193 (15.7%) | 2.61 |
| Total Families | 1,228 (100.0%) | 3.16 |
Median Household Size in Ashville
The median household size in Ashville is 2.58 persons per household, with married-couple households (833 | 46.9%) accounting for the largest median household size of 3.45 persons per household. non-family households (548 | 30.9%) represent the smallest median household size with 1.16 persons per household.
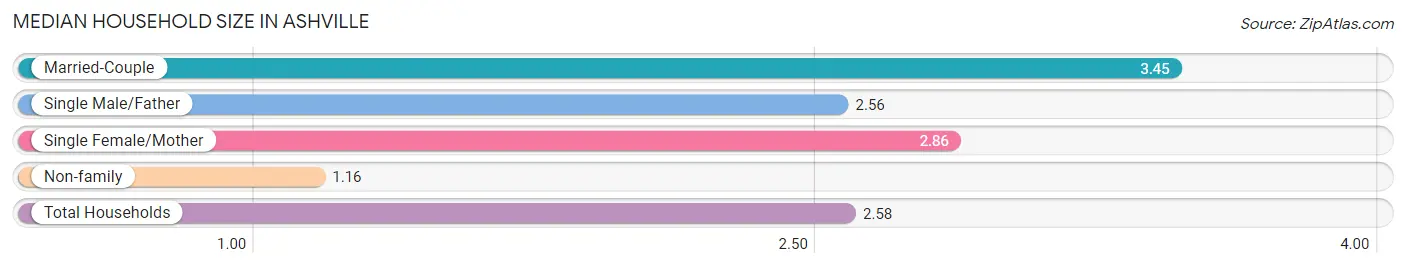
| Household Type | # Households | Household Size |
| Married-Couple | 833 (46.9%) | 3.45 |
| Single Male/Father | 202 (11.4%) | 2.56 |
| Single Female/Mother | 193 (10.9%) | 2.86 |
| Non-family | 548 (30.9%) | 1.16 |
| Total Households | 1,776 (100.0%) | 2.58 |
Household Size by Marriage Status in Ashville
Out of a total of 1,776 households in Ashville, 1,228 (69.1%) are family households, while 548 (30.9%) are nonfamily households. The most numerous type of family households are 2-person households, comprising 545, and the most common type of nonfamily households are 1-person households, comprising 469.
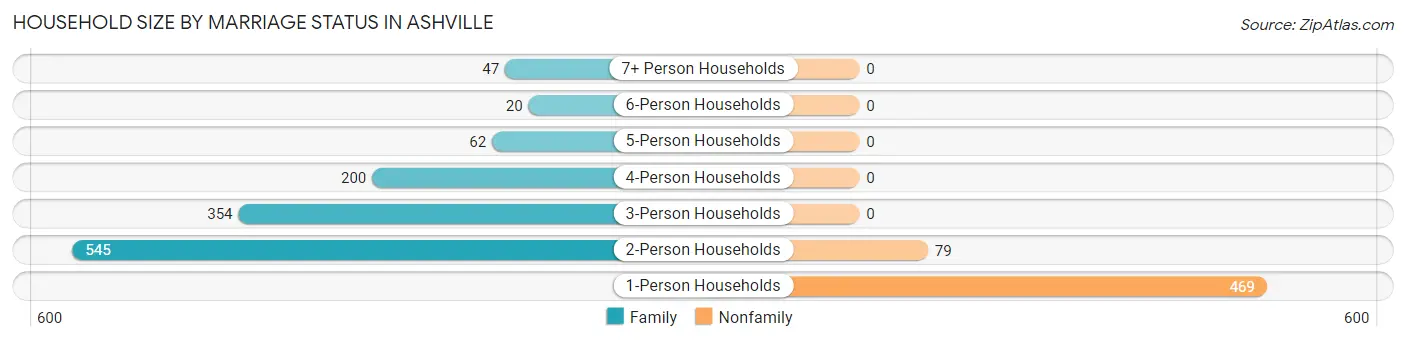
| Household Size | Family Households | Nonfamily Households |
| 1-Person Households | - | 469 (26.4%) |
| 2-Person Households | 545 (30.7%) | 79 (4.4%) |
| 3-Person Households | 354 (19.9%) | 0 (0.0%) |
| 4-Person Households | 200 (11.3%) | 0 (0.0%) |
| 5-Person Households | 62 (3.5%) | 0 (0.0%) |
| 6-Person Households | 20 (1.1%) | 0 (0.0%) |
| 7+ Person Households | 47 (2.6%) | 0 (0.0%) |
| Total | 1,228 (69.1%) | 548 (30.9%) |
Female Fertility in Ashville
Fertility by Age in Ashville
Average fertility rate in Ashville is 36.0 births per 1,000 women. Women in the age bracket of 20 to 34 years have the highest fertility rate with 98.0 births per 1,000 women. Women in the age bracket of 20 to 34 years acount for 100.0% of all women with births.
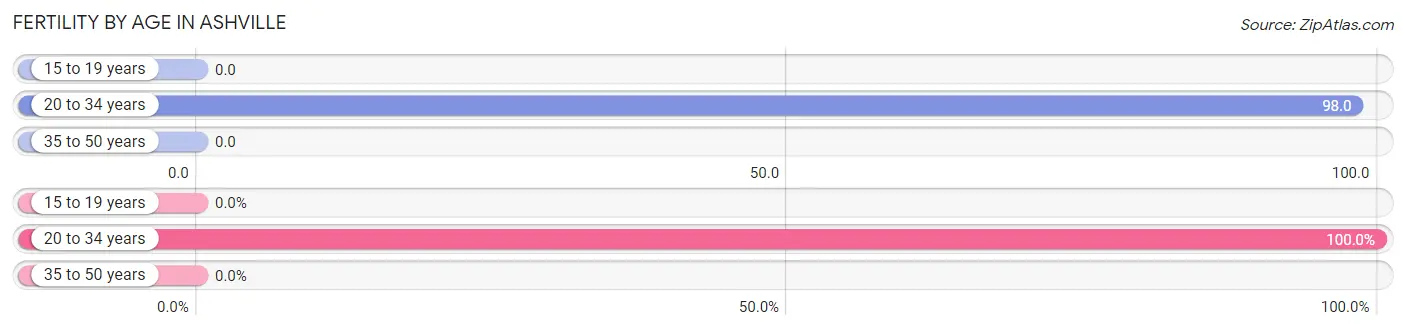
| Age Bracket | Women with Births | Births / 1,000 Women |
| 15 to 19 years | 0 (0.0%) | 0.0 |
| 20 to 34 years | 45 (100.0%) | 98.0 |
| 35 to 50 years | 0 (0.0%) | 0.0 |
| Total | 45 (100.0%) | 36.0 |
Fertility by Age by Marriage Status in Ashville
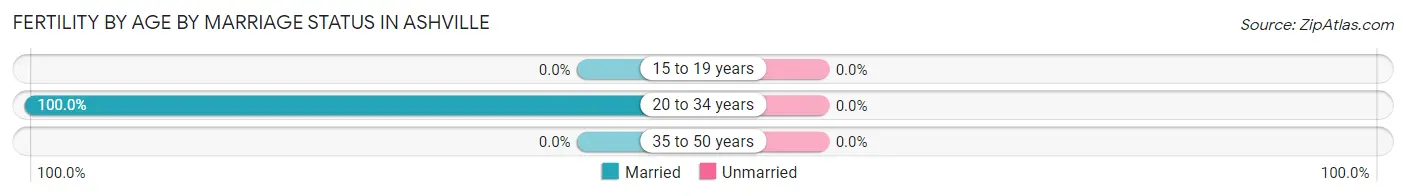
| Age Bracket | Married | Unmarried |
| 15 to 19 years | 0 (0.0%) | 0 (0.0%) |
| 20 to 34 years | 45 (100.0%) | 0 (0.0%) |
| 35 to 50 years | 0 (0.0%) | 0 (0.0%) |
| Total | 45 (100.0%) | 0 (0.0%) |
Fertility by Education in Ashville
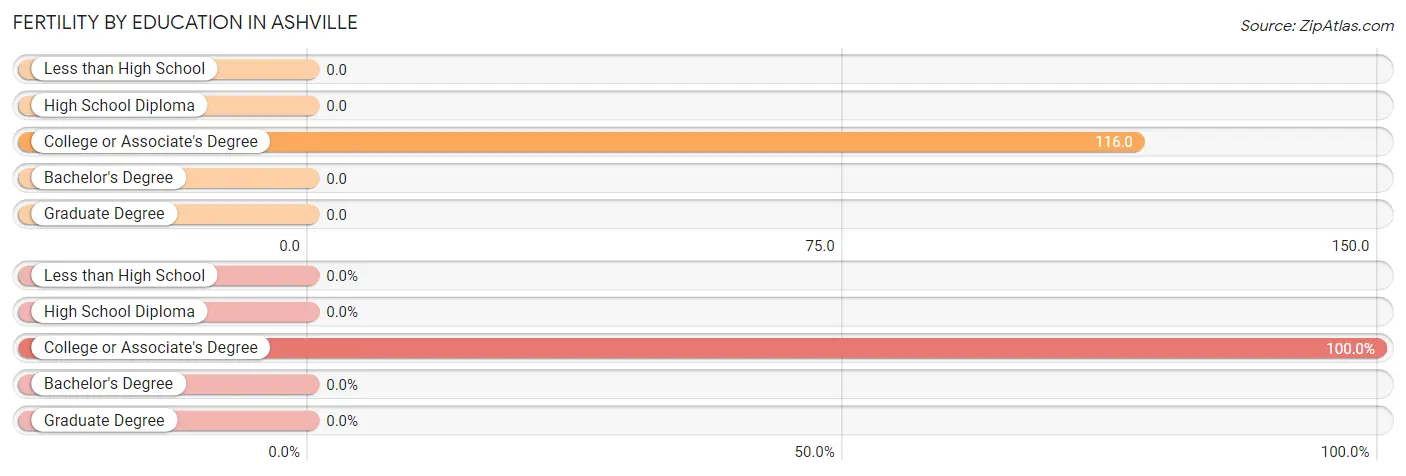
| Educational Attainment | Women with Births | Births / 1,000 Women |
| Less than High School | 0 (0.0%) | 0.0 |
| High School Diploma | 0 (0.0%) | 0.0 |
| College or Associate's Degree | 45 (100.0%) | 116.0 |
| Bachelor's Degree | 0 (0.0%) | 0.0 |
| Graduate Degree | 0 (0.0%) | 0.0 |
| Total | 45 (100.0%) | 36.0 |
Fertility by Education by Marriage Status in Ashville
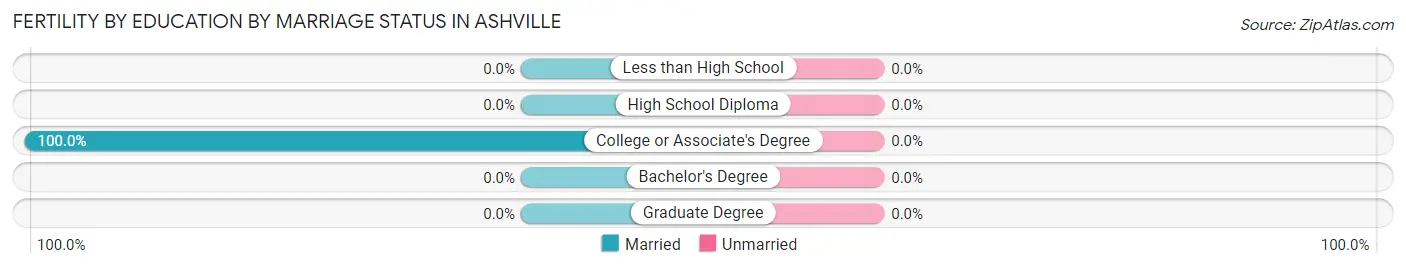
| Educational Attainment | Married | Unmarried |
| Less than High School | 0 (0.0%) | 0 (0.0%) |
| High School Diploma | 0 (0.0%) | 0 (0.0%) |
| College or Associate's Degree | 45 (100.0%) | 0 (0.0%) |
| Bachelor's Degree | 0 (0.0%) | 0 (0.0%) |
| Graduate Degree | 0 (0.0%) | 0 (0.0%) |
| Total | 45 (100.0%) | 0 (0.0%) |
Employment Characteristics in Ashville
Employment by Class of Employer in Ashville
Among the 2,104 employed individuals in Ashville, private company employees (1,381 | 65.6%), local government employees (306 | 14.5%), and self-employed (not incorporated) (135 | 6.4%) make up the most common classes of employment.
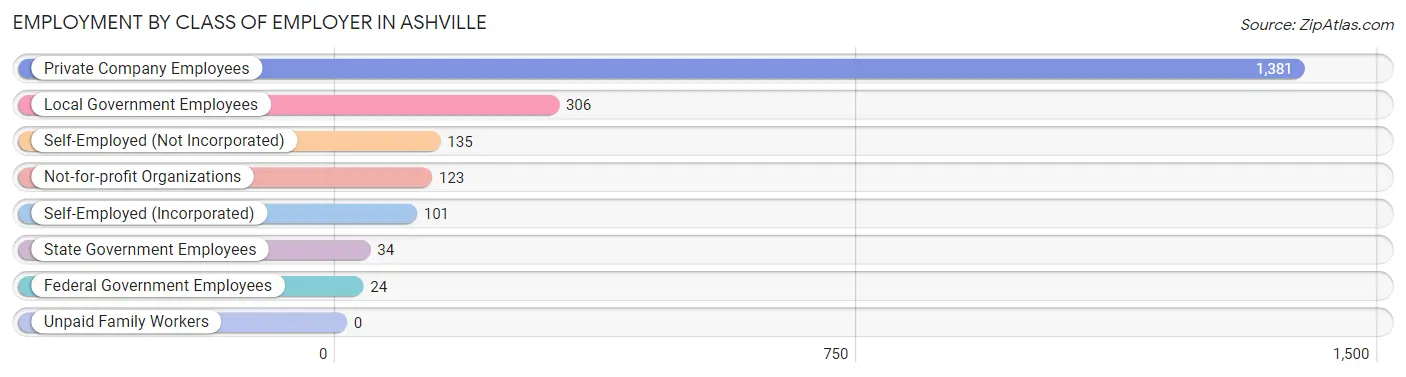
| Employer Class | # Employees | % Employees |
| Private Company Employees | 1,381 | 65.6% |
| Self-Employed (Incorporated) | 101 | 4.8% |
| Self-Employed (Not Incorporated) | 135 | 6.4% |
| Not-for-profit Organizations | 123 | 5.9% |
| Local Government Employees | 306 | 14.5% |
| State Government Employees | 34 | 1.6% |
| Federal Government Employees | 24 | 1.1% |
| Unpaid Family Workers | 0 | 0.0% |
| Total | 2,104 | 100.0% |
Employment Status by Age in Ashville
According to the labor force statistics for Ashville, out of the total population over 16 years of age (3,631), 62.4% or 2,266 individuals are in the labor force, with 4.3% or 97 of them unemployed. The age group with the highest labor force participation rate is 30 to 34 years, with 94.2% or 212 individuals in the labor force. Within the labor force, the 20 to 24 years age range has the highest percentage of unemployed individuals, with 14.8% or 53 of them being unemployed.
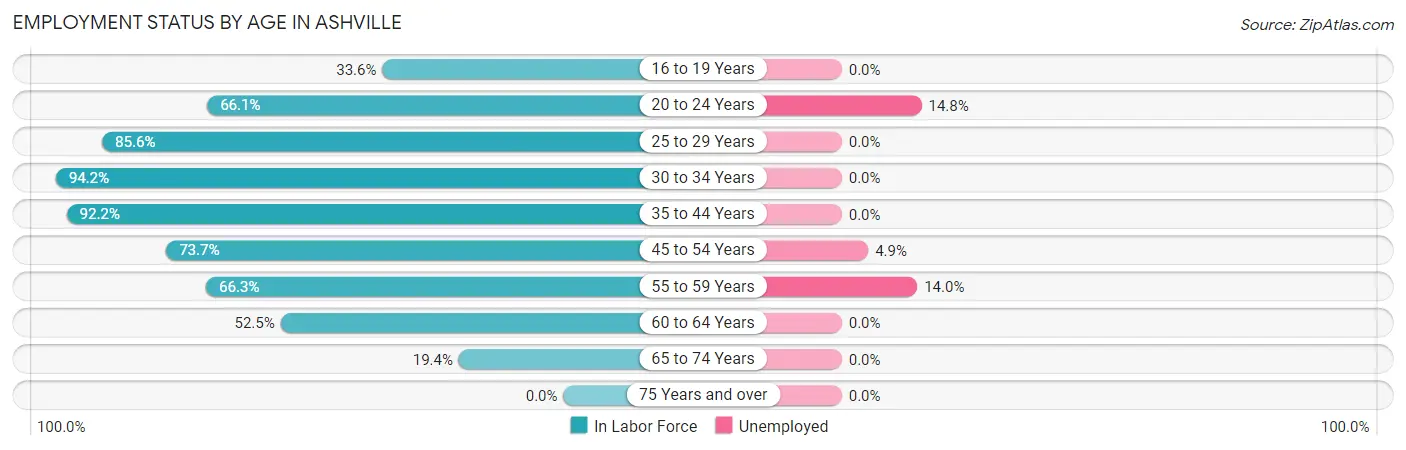
| Age Bracket | In Labor Force | Unemployed |
| 16 to 19 Years | 131 (33.6%) | 0 (0.0%) |
| 20 to 24 Years | 359 (66.1%) | 53 (14.8%) |
| 25 to 29 Years | 149 (85.6%) | 0 (0.0%) |
| 30 to 34 Years | 212 (94.2%) | 0 (0.0%) |
| 35 to 44 Years | 546 (92.2%) | 0 (0.0%) |
| 45 to 54 Years | 566 (73.7%) | 28 (4.9%) |
| 55 to 59 Years | 114 (66.3%) | 16 (14.0%) |
| 60 to 64 Years | 146 (52.5%) | 0 (0.0%) |
| 65 to 74 Years | 42 (19.4%) | 0 (0.0%) |
| 75 Years and over | 0 (0.0%) | 0 (0.0%) |
| Total | 2,266 (62.4%) | 97 (4.3%) |
Employment Status by Educational Attainment in Ashville
According to labor force statistics for Ashville, 78.5% of individuals (1,734) out of the total population between 25 and 64 years of age (2,209) are in the labor force, with 2.5% or 43 of them being unemployed. The group with the highest labor force participation rate are those with the educational attainment of bachelor's degree or higher, with 91.0% or 283 individuals in the labor force. Within the labor force, individuals with bachelor's degree or higher education have the highest percentage of unemployment, with 5.7% or 16 of them being unemployed.
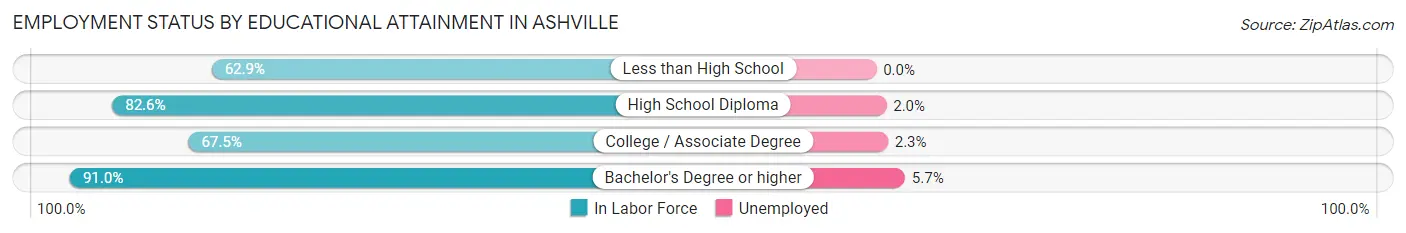
| Educational Attainment | In Labor Force | Unemployed |
| Less than High School | 100 (62.9%) | 0 (0.0%) |
| High School Diploma | 966 (82.6%) | 23 (2.0%) |
| College / Associate Degree | 384 (67.5%) | 13 (2.3%) |
| Bachelor's Degree or higher | 283 (91.0%) | 18 (5.7%) |
| Total | 1,734 (78.5%) | 55 (2.5%) |
Employment Occupations by Sex in Ashville
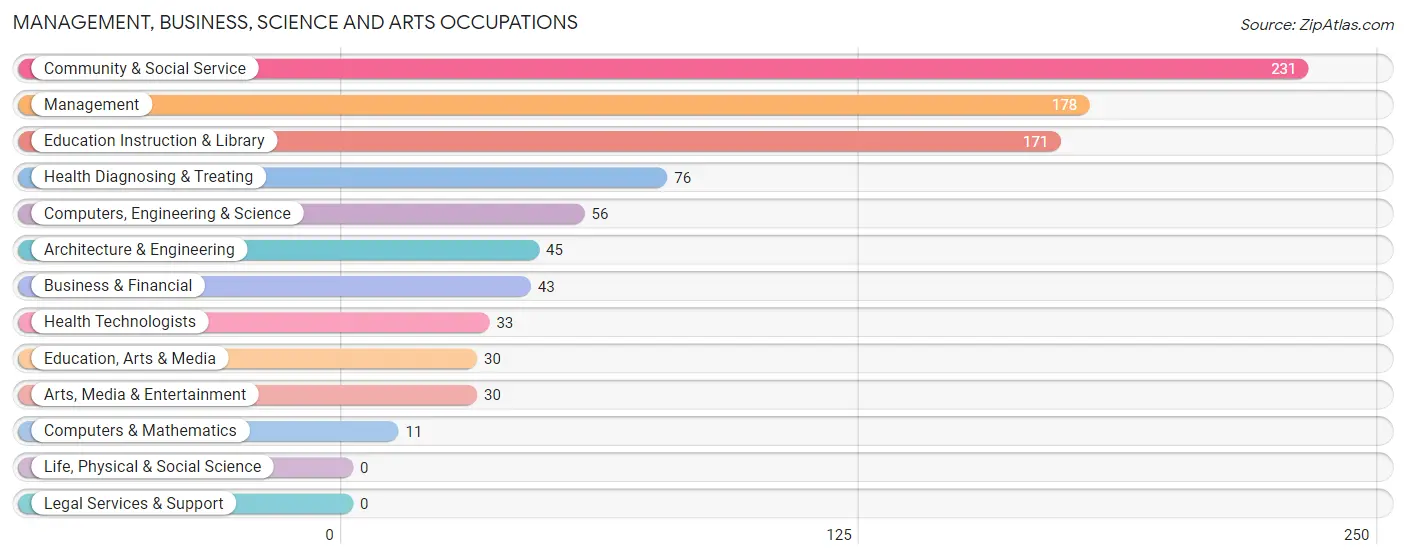
Management, Business, Science and Arts Occupations
The most common Management, Business, Science and Arts occupations in Ashville are Community & Social Service (231 | 10.6%), Management (178 | 8.2%), Education Instruction & Library (171 | 7.9%), Health Diagnosing & Treating (76 | 3.5%), and Computers, Engineering & Science (56 | 2.6%).
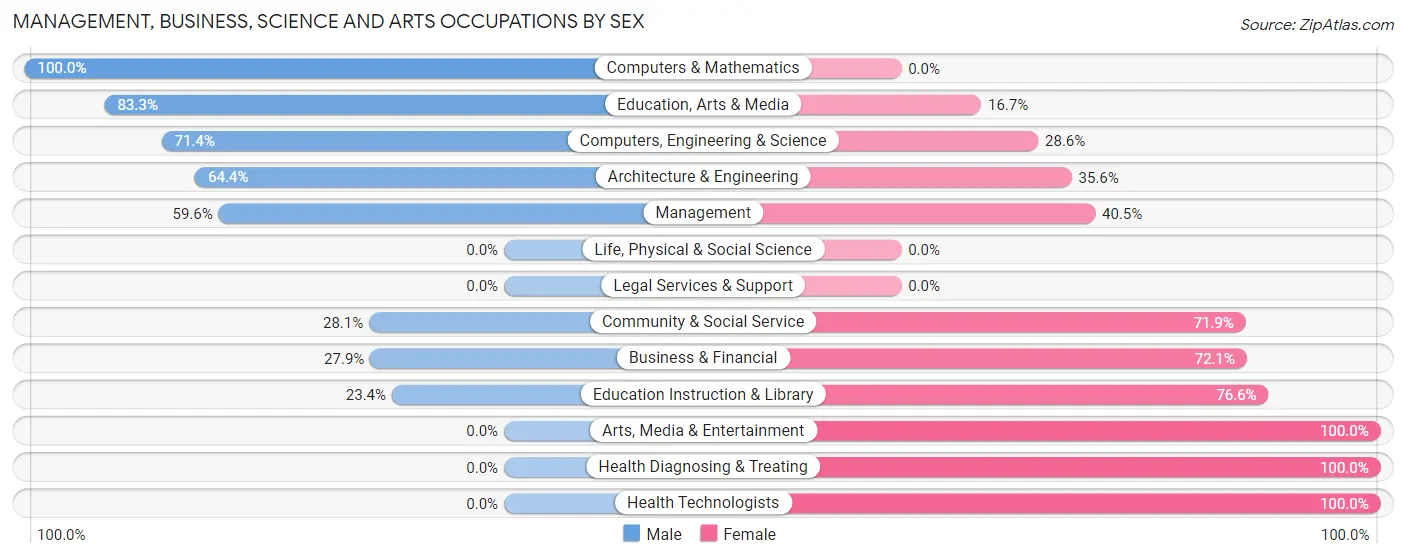
Management, Business, Science and Arts Occupations by Sex
Within the Management, Business, Science and Arts occupations in Ashville, the most male-oriented occupations are Computers & Mathematics (100.0%), Education, Arts & Media (83.3%), and Computers, Engineering & Science (71.4%), while the most female-oriented occupations are Arts, Media & Entertainment (100.0%), Health Diagnosing & Treating (100.0%), and Health Technologists (100.0%).
| Occupation | Male | Female |
| Management | 106 (59.6%) | 72 (40.5%) |
| Business & Financial | 12 (27.9%) | 31 (72.1%) |
| Computers, Engineering & Science | 40 (71.4%) | 16 (28.6%) |
| Computers & Mathematics | 11 (100.0%) | 0 (0.0%) |
| Architecture & Engineering | 29 (64.4%) | 16 (35.6%) |
| Life, Physical & Social Science | 0 (0.0%) | 0 (0.0%) |
| Community & Social Service | 65 (28.1%) | 166 (71.9%) |
| Education, Arts & Media | 25 (83.3%) | 5 (16.7%) |
| Legal Services & Support | 0 (0.0%) | 0 (0.0%) |
| Education Instruction & Library | 40 (23.4%) | 131 (76.6%) |
| Arts, Media & Entertainment | 0 (0.0%) | 30 (100.0%) |
| Health Diagnosing & Treating | 0 (0.0%) | 76 (100.0%) |
| Health Technologists | 0 (0.0%) | 33 (100.0%) |
| Total (Category) | 223 (38.2%) | 361 (61.8%) |
| Total (Overall) | 1,143 (52.7%) | 1,025 (47.3%) |
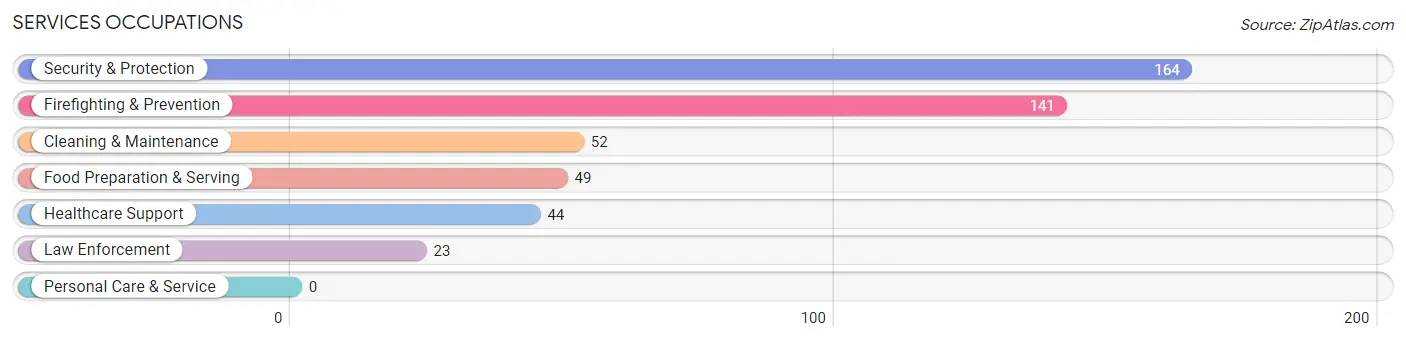
Services Occupations
The most common Services occupations in Ashville are Security & Protection (164 | 7.6%), Firefighting & Prevention (141 | 6.5%), Cleaning & Maintenance (52 | 2.4%), Food Preparation & Serving (49 | 2.3%), and Healthcare Support (44 | 2.0%).
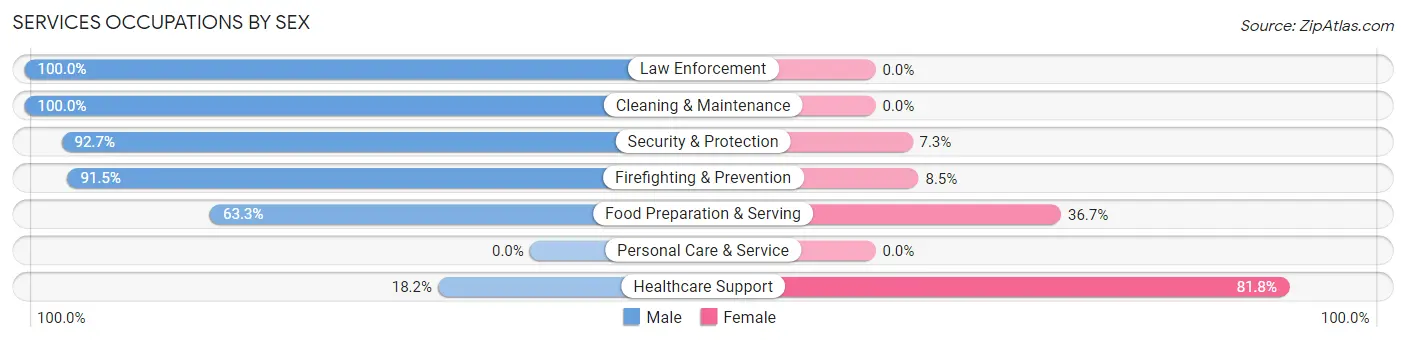
Services Occupations by Sex
Within the Services occupations in Ashville, the most male-oriented occupations are Law Enforcement (100.0%), Cleaning & Maintenance (100.0%), and Security & Protection (92.7%), while the most female-oriented occupations are Healthcare Support (81.8%), Food Preparation & Serving (36.7%), and Firefighting & Prevention (8.5%).
| Occupation | Male | Female |
| Healthcare Support | 8 (18.2%) | 36 (81.8%) |
| Security & Protection | 152 (92.7%) | 12 (7.3%) |
| Firefighting & Prevention | 129 (91.5%) | 12 (8.5%) |
| Law Enforcement | 23 (100.0%) | 0 (0.0%) |
| Food Preparation & Serving | 31 (63.3%) | 18 (36.7%) |
| Cleaning & Maintenance | 52 (100.0%) | 0 (0.0%) |
| Personal Care & Service | 0 (0.0%) | 0 (0.0%) |
| Total (Category) | 243 (78.6%) | 66 (21.4%) |
| Total (Overall) | 1,143 (52.7%) | 1,025 (47.3%) |
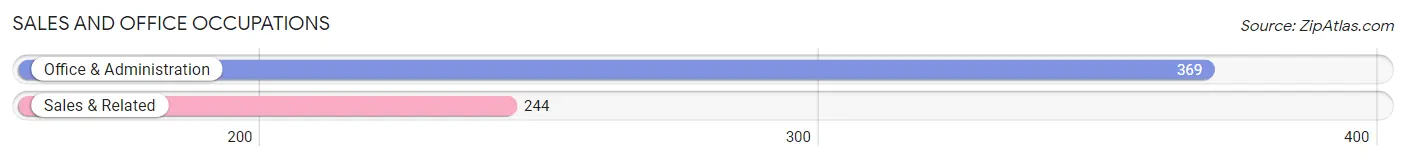
Sales and Office Occupations
The most common Sales and Office occupations in Ashville are Office & Administration (369 | 17.0%), and Sales & Related (244 | 11.3%).
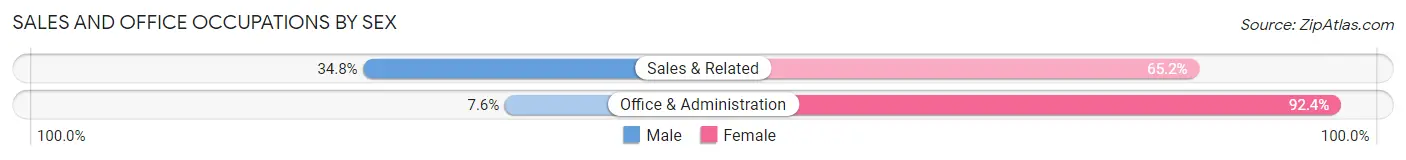
Sales and Office Occupations by Sex
| Occupation | Male | Female |
| Sales & Related | 85 (34.8%) | 159 (65.2%) |
| Office & Administration | 28 (7.6%) | 341 (92.4%) |
| Total (Category) | 113 (18.4%) | 500 (81.6%) |
| Total (Overall) | 1,143 (52.7%) | 1,025 (47.3%) |
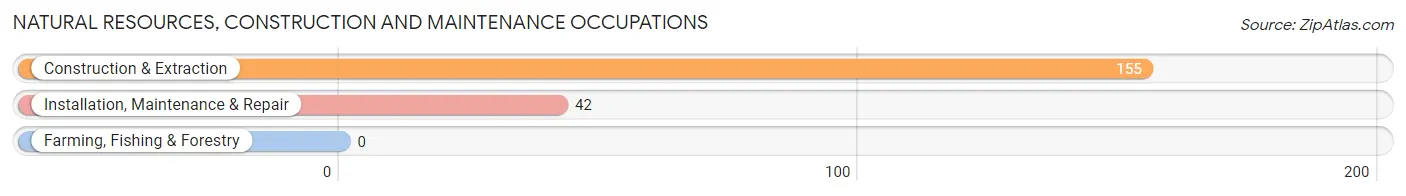
Natural Resources, Construction and Maintenance Occupations
The most common Natural Resources, Construction and Maintenance occupations in Ashville are Construction & Extraction (155 | 7.1%), and Installation, Maintenance & Repair (42 | 1.9%).
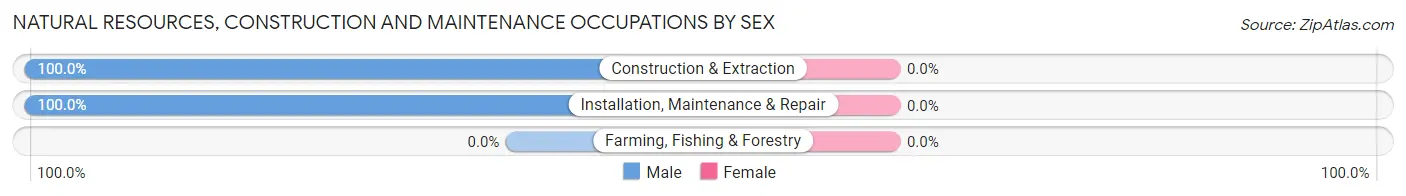
Natural Resources, Construction and Maintenance Occupations by Sex
| Occupation | Male | Female |
| Farming, Fishing & Forestry | 0 (0.0%) | 0 (0.0%) |
| Construction & Extraction | 155 (100.0%) | 0 (0.0%) |
| Installation, Maintenance & Repair | 42 (100.0%) | 0 (0.0%) |
| Total (Category) | 197 (100.0%) | 0 (0.0%) |
| Total (Overall) | 1,143 (52.7%) | 1,025 (47.3%) |
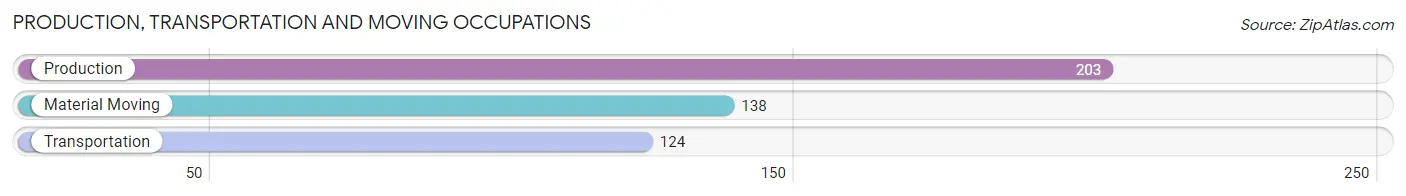
Production, Transportation and Moving Occupations
The most common Production, Transportation and Moving occupations in Ashville are Production (203 | 9.4%), Material Moving (138 | 6.4%), and Transportation (124 | 5.7%).
Production, Transportation and Moving Occupations by Sex
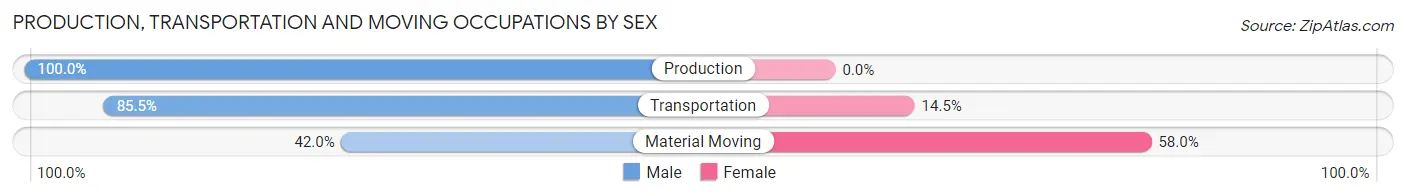
| Occupation | Male | Female |
| Production | 203 (100.0%) | 0 (0.0%) |
| Transportation | 106 (85.5%) | 18 (14.5%) |
| Material Moving | 58 (42.0%) | 80 (58.0%) |
| Total (Category) | 367 (78.9%) | 98 (21.1%) |
| Total (Overall) | 1,143 (52.7%) | 1,025 (47.3%) |
Employment Industries by Sex in Ashville
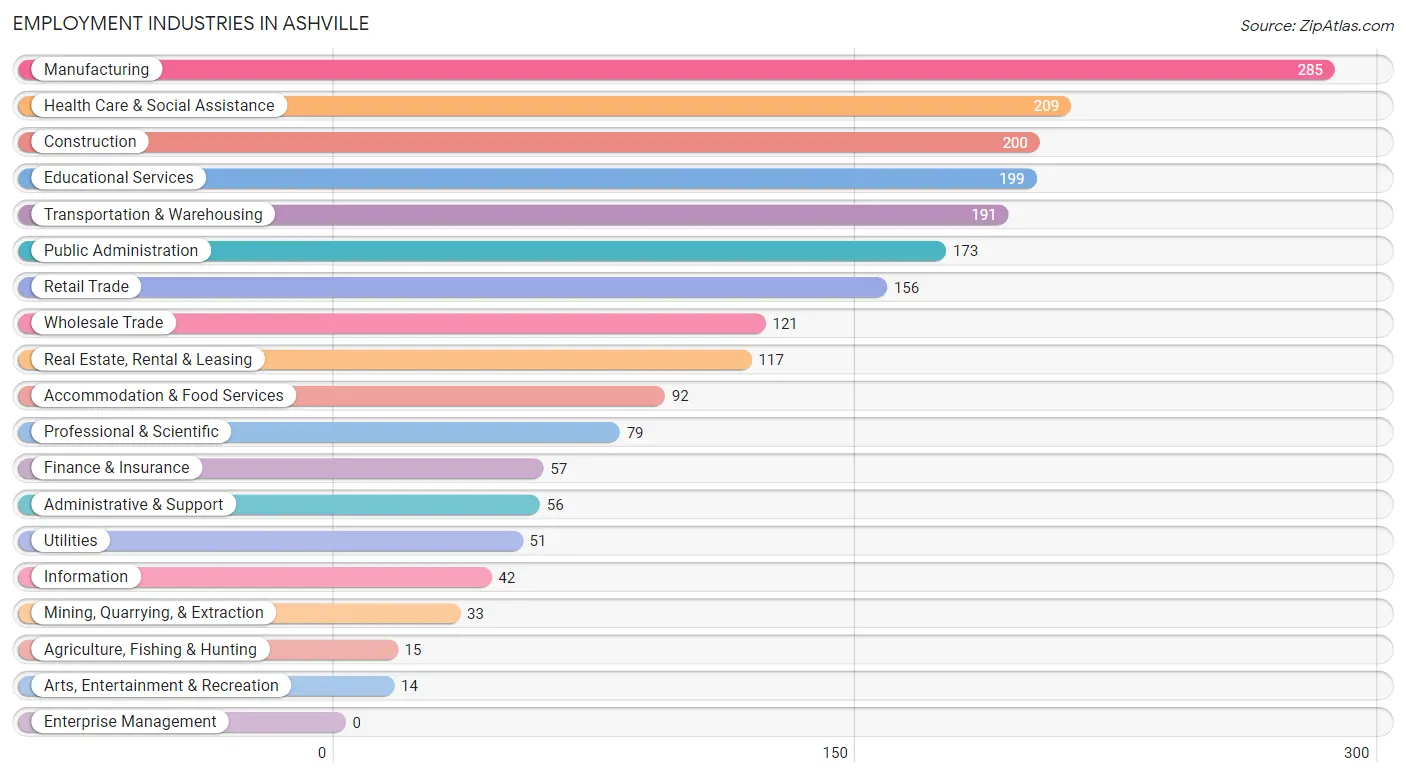
Employment Industries in Ashville
The major employment industries in Ashville include Manufacturing (285 | 13.2%), Health Care & Social Assistance (209 | 9.6%), Construction (200 | 9.2%), Educational Services (199 | 9.2%), and Transportation & Warehousing (191 | 8.8%).
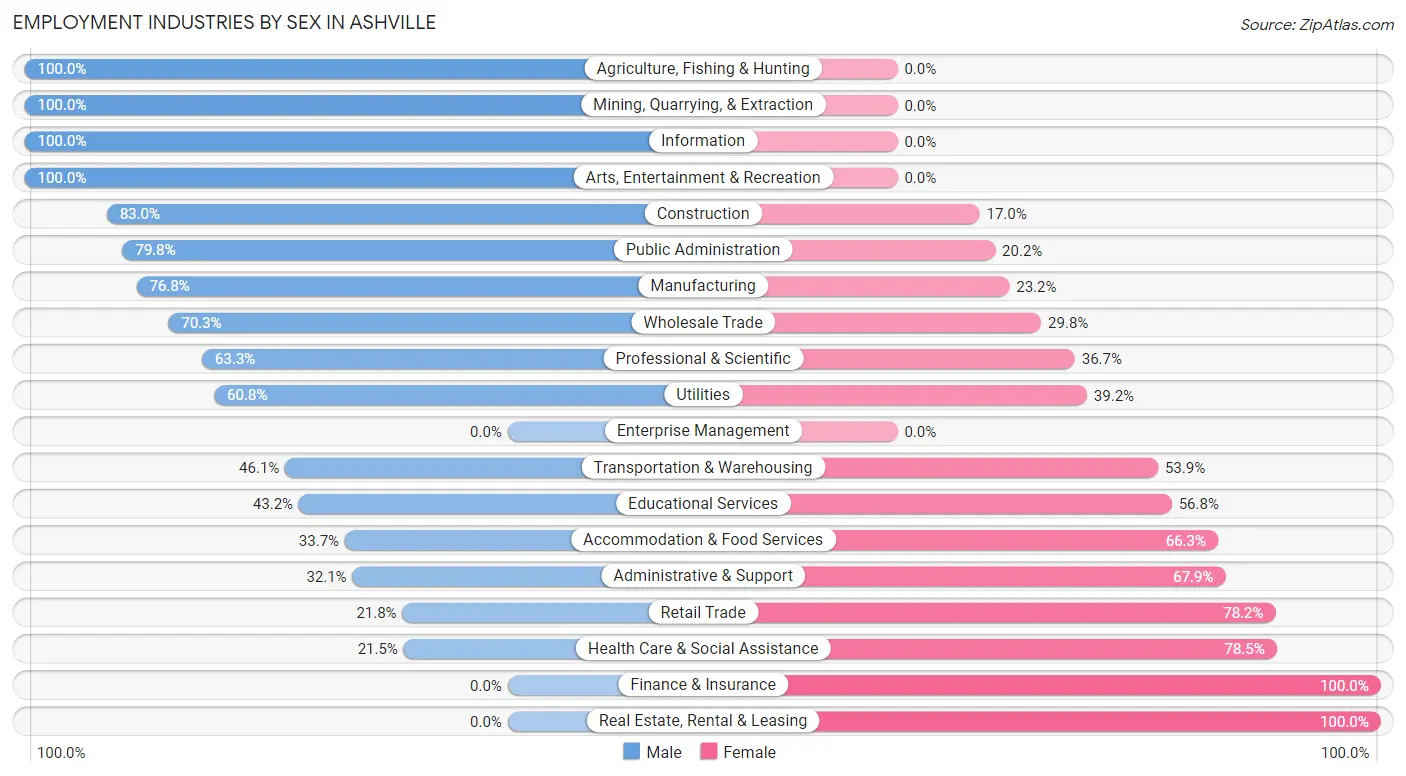
Employment Industries by Sex in Ashville
The Ashville industries that see more men than women are Agriculture, Fishing & Hunting (100.0%), Mining, Quarrying, & Extraction (100.0%), and Information (100.0%), whereas the industries that tend to have a higher number of women are Finance & Insurance (100.0%), Real Estate, Rental & Leasing (100.0%), and Health Care & Social Assistance (78.5%).
| Industry | Male | Female |
| Agriculture, Fishing & Hunting | 15 (100.0%) | 0 (0.0%) |
| Mining, Quarrying, & Extraction | 33 (100.0%) | 0 (0.0%) |
| Construction | 166 (83.0%) | 34 (17.0%) |
| Manufacturing | 219 (76.8%) | 66 (23.2%) |
| Wholesale Trade | 85 (70.3%) | 36 (29.7%) |
| Retail Trade | 34 (21.8%) | 122 (78.2%) |
| Transportation & Warehousing | 88 (46.1%) | 103 (53.9%) |
| Utilities | 31 (60.8%) | 20 (39.2%) |
| Information | 42 (100.0%) | 0 (0.0%) |
| Finance & Insurance | 0 (0.0%) | 57 (100.0%) |
| Real Estate, Rental & Leasing | 0 (0.0%) | 117 (100.0%) |
| Professional & Scientific | 50 (63.3%) | 29 (36.7%) |
| Enterprise Management | 0 (0.0%) | 0 (0.0%) |
| Administrative & Support | 18 (32.1%) | 38 (67.9%) |
| Educational Services | 86 (43.2%) | 113 (56.8%) |
| Health Care & Social Assistance | 45 (21.5%) | 164 (78.5%) |
| Arts, Entertainment & Recreation | 14 (100.0%) | 0 (0.0%) |
| Accommodation & Food Services | 31 (33.7%) | 61 (66.3%) |
| Public Administration | 138 (79.8%) | 35 (20.2%) |
| Total | 1,143 (52.7%) | 1,025 (47.3%) |
Education in Ashville
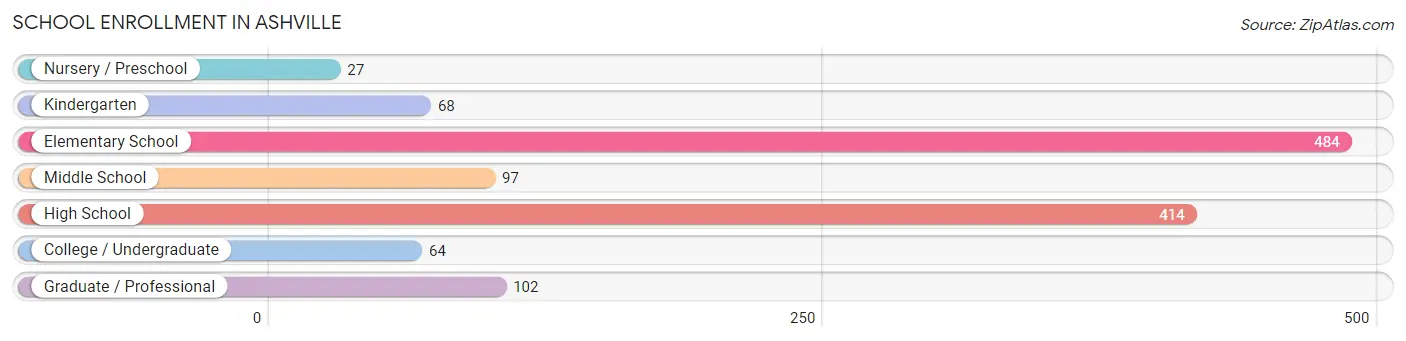
School Enrollment in Ashville
The most common levels of schooling among the 1,256 students in Ashville are elementary school (484 | 38.5%), high school (414 | 33.0%), and graduate / professional (102 | 8.1%).
| School Level | # Students | % Students |
| Nursery / Preschool | 27 | 2.1% |
| Kindergarten | 68 | 5.4% |
| Elementary School | 484 | 38.5% |
| Middle School | 97 | 7.7% |
| High School | 414 | 33.0% |
| College / Undergraduate | 64 | 5.1% |
| Graduate / Professional | 102 | 8.1% |
| Total | 1,256 | 100.0% |
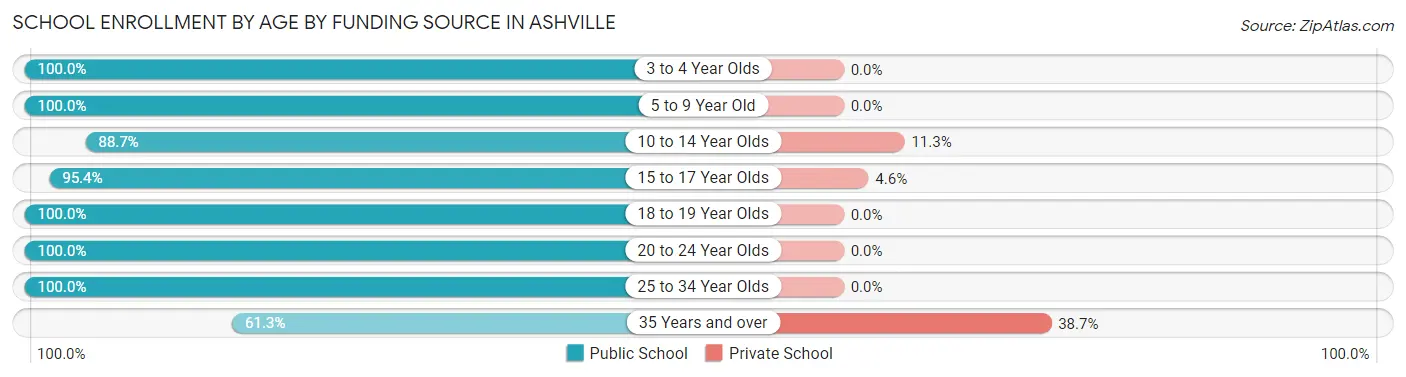
School Enrollment by Age by Funding Source in Ashville
Out of a total of 1,256 students who are enrolled in schools in Ashville, 77 (6.1%) attend a private institution, while the remaining 1,179 (93.9%) are enrolled in public schools. The age group of 35 years and over has the highest likelihood of being enrolled in private schools, with 46 (38.7% in the age bracket) enrolled. Conversely, the age group of 3 to 4 year olds has the lowest likelihood of being enrolled in a private school, with 13 (100.0% in the age bracket) attending a public institution.
| Age Bracket | Public School | Private School |
| 3 to 4 Year Olds | 13 (100.0%) | 0 (0.0%) |
| 5 to 9 Year Old | 513 (100.0%) | 0 (0.0%) |
| 10 to 14 Year Olds | 133 (88.7%) | 17 (11.3%) |
| 15 to 17 Year Olds | 269 (95.4%) | 13 (4.6%) |
| 18 to 19 Year Olds | 97 (100.0%) | 0 (0.0%) |
| 20 to 24 Year Olds | 27 (100.0%) | 0 (0.0%) |
| 25 to 34 Year Olds | 55 (100.0%) | 0 (0.0%) |
| 35 Years and over | 73 (61.3%) | 46 (38.7%) |
| Total | 1,179 (93.9%) | 77 (6.1%) |
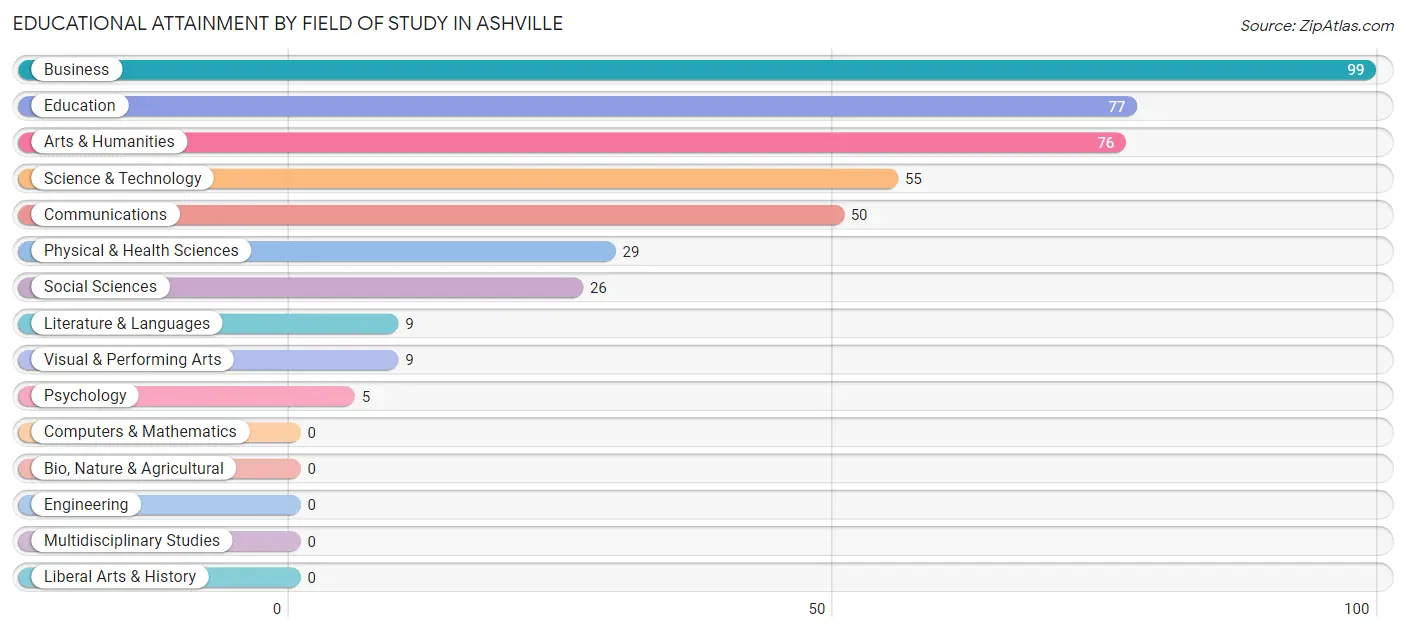
Educational Attainment by Field of Study in Ashville
Business (99 | 22.8%), education (77 | 17.7%), arts & humanities (76 | 17.5%), science & technology (55 | 12.6%), and communications (50 | 11.5%) are the most common fields of study among 435 individuals in Ashville who have obtained a bachelor's degree or higher.
| Field of Study | # Graduates | % Graduates |
| Computers & Mathematics | 0 | 0.0% |
| Bio, Nature & Agricultural | 0 | 0.0% |
| Physical & Health Sciences | 29 | 6.7% |
| Psychology | 5 | 1.1% |
| Social Sciences | 26 | 6.0% |
| Engineering | 0 | 0.0% |
| Multidisciplinary Studies | 0 | 0.0% |
| Science & Technology | 55 | 12.6% |
| Business | 99 | 22.8% |
| Education | 77 | 17.7% |
| Literature & Languages | 9 | 2.1% |
| Liberal Arts & History | 0 | 0.0% |
| Visual & Performing Arts | 9 | 2.1% |
| Communications | 50 | 11.5% |
| Arts & Humanities | 76 | 17.5% |
| Total | 435 | 100.0% |
Transportation & Commute in Ashville
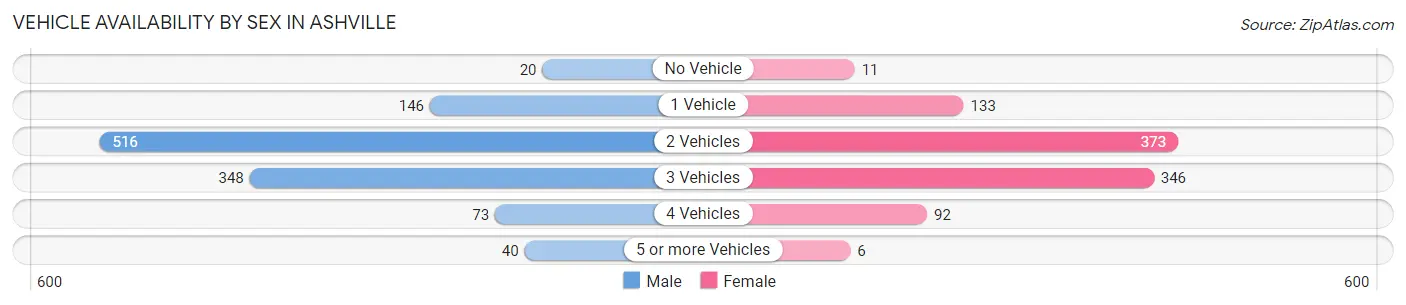
Vehicle Availability by Sex in Ashville
The most prevalent vehicle ownership categories in Ashville are males with 2 vehicles (516, accounting for 45.1%) and females with 2 vehicles (373, making up 53.7%).
| Vehicles Available | Male | Female |
| No Vehicle | 20 (1.8%) | 11 (1.1%) |
| 1 Vehicle | 146 (12.8%) | 133 (13.8%) |
| 2 Vehicles | 516 (45.1%) | 373 (38.8%) |
| 3 Vehicles | 348 (30.4%) | 346 (36.0%) |
| 4 Vehicles | 73 (6.4%) | 92 (9.6%) |
| 5 or more Vehicles | 40 (3.5%) | 6 (0.6%) |
| Total | 1,143 (100.0%) | 961 (100.0%) |
Commute Time in Ashville
The most frequently occuring commute durations in Ashville are 30 to 34 minutes (389 commuters, 21.1%), 25 to 29 minutes (234 commuters, 12.7%), and 5 to 9 minutes (208 commuters, 11.3%).
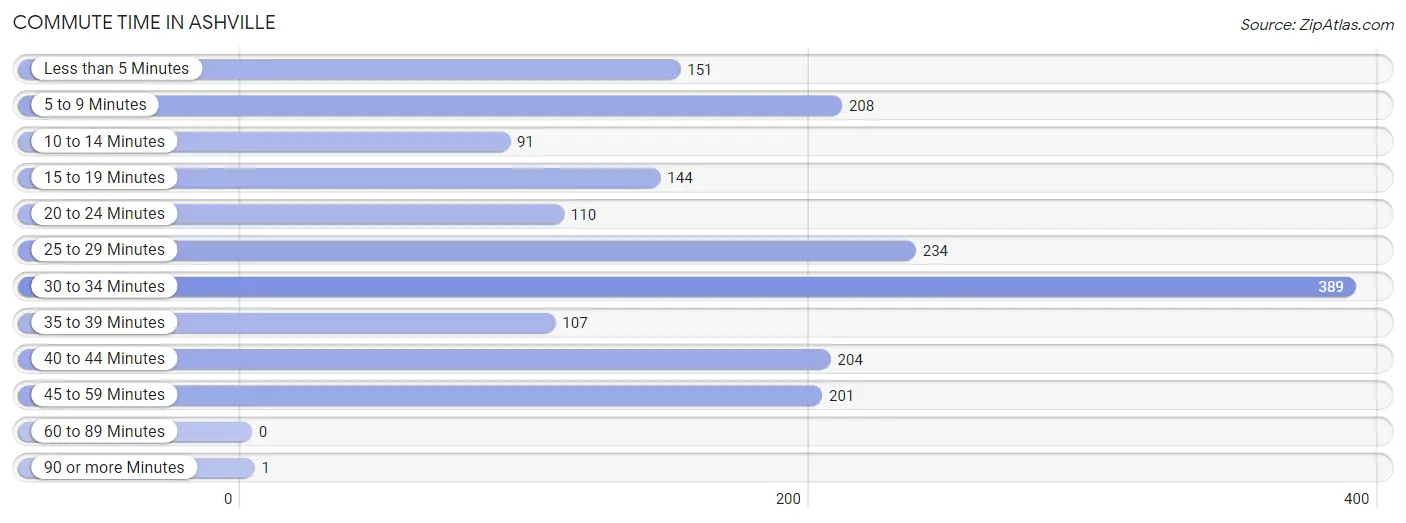
| Commute Time | # Commuters | % Commuters |
| Less than 5 Minutes | 151 | 8.2% |
| 5 to 9 Minutes | 208 | 11.3% |
| 10 to 14 Minutes | 91 | 5.0% |
| 15 to 19 Minutes | 144 | 7.8% |
| 20 to 24 Minutes | 110 | 6.0% |
| 25 to 29 Minutes | 234 | 12.7% |
| 30 to 34 Minutes | 389 | 21.1% |
| 35 to 39 Minutes | 107 | 5.8% |
| 40 to 44 Minutes | 204 | 11.1% |
| 45 to 59 Minutes | 201 | 10.9% |
| 60 to 89 Minutes | 0 | 0.0% |
| 90 or more Minutes | 1 | 0.1% |
Commute Time by Sex in Ashville
The most common commute times in Ashville are 25 to 29 minutes (186 commuters, 16.8%) for males and 30 to 34 minutes (227 commuters, 31.0%) for females.
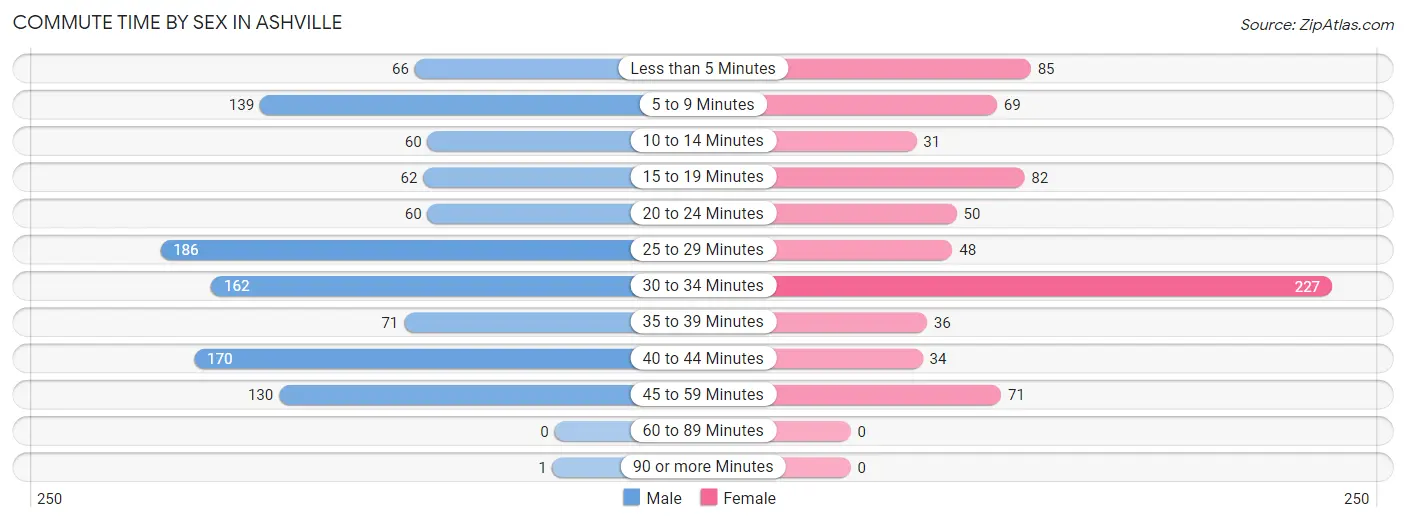
| Commute Time | Male | Female |
| Less than 5 Minutes | 66 (6.0%) | 85 (11.6%) |
| 5 to 9 Minutes | 139 (12.6%) | 69 (9.4%) |
| 10 to 14 Minutes | 60 (5.4%) | 31 (4.2%) |
| 15 to 19 Minutes | 62 (5.6%) | 82 (11.2%) |
| 20 to 24 Minutes | 60 (5.4%) | 50 (6.8%) |
| 25 to 29 Minutes | 186 (16.8%) | 48 (6.6%) |
| 30 to 34 Minutes | 162 (14.6%) | 227 (31.0%) |
| 35 to 39 Minutes | 71 (6.4%) | 36 (4.9%) |
| 40 to 44 Minutes | 170 (15.4%) | 34 (4.6%) |
| 45 to 59 Minutes | 130 (11.7%) | 71 (9.7%) |
| 60 to 89 Minutes | 0 (0.0%) | 0 (0.0%) |
| 90 or more Minutes | 1 (0.1%) | 0 (0.0%) |
Time of Departure to Work by Sex in Ashville
The most frequent times of departure to work in Ashville are 6:30 AM to 6:59 AM (195, 17.6%) for males and 6:30 AM to 6:59 AM (148, 20.2%) for females.
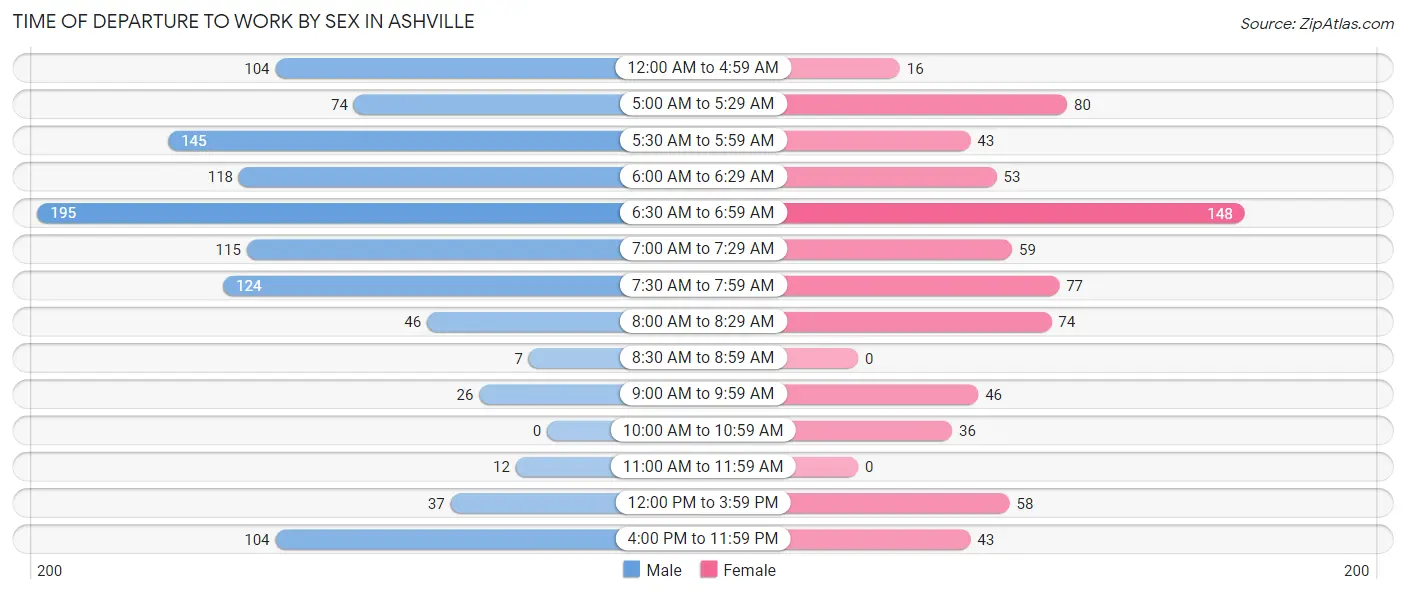
| Time of Departure | Male | Female |
| 12:00 AM to 4:59 AM | 104 (9.4%) | 16 (2.2%) |
| 5:00 AM to 5:29 AM | 74 (6.7%) | 80 (10.9%) |
| 5:30 AM to 5:59 AM | 145 (13.1%) | 43 (5.9%) |
| 6:00 AM to 6:29 AM | 118 (10.7%) | 53 (7.2%) |
| 6:30 AM to 6:59 AM | 195 (17.6%) | 148 (20.2%) |
| 7:00 AM to 7:29 AM | 115 (10.4%) | 59 (8.1%) |
| 7:30 AM to 7:59 AM | 124 (11.2%) | 77 (10.5%) |
| 8:00 AM to 8:29 AM | 46 (4.2%) | 74 (10.1%) |
| 8:30 AM to 8:59 AM | 7 (0.6%) | 0 (0.0%) |
| 9:00 AM to 9:59 AM | 26 (2.4%) | 46 (6.3%) |
| 10:00 AM to 10:59 AM | 0 (0.0%) | 36 (4.9%) |
| 11:00 AM to 11:59 AM | 12 (1.1%) | 0 (0.0%) |
| 12:00 PM to 3:59 PM | 37 (3.3%) | 58 (7.9%) |
| 4:00 PM to 11:59 PM | 104 (9.4%) | 43 (5.9%) |
| Total | 1,107 (100.0%) | 733 (100.0%) |
Housing Occupancy in Ashville
Occupancy by Ownership in Ashville
Of the total 1,776 dwellings in Ashville, owner-occupied units account for 1,013 (57.0%), while renter-occupied units make up 763 (43.0%).
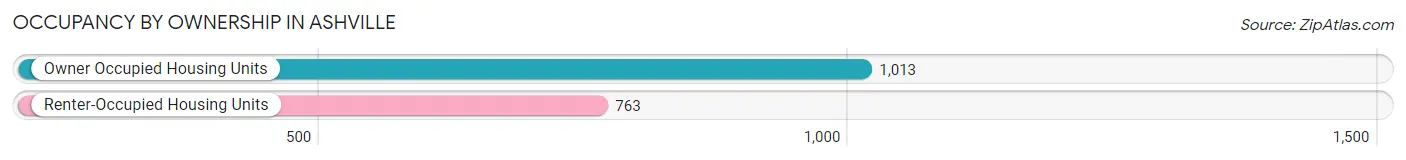
| Occupancy | # Housing Units | % Housing Units |
| Owner Occupied Housing Units | 1,013 | 57.0% |
| Renter-Occupied Housing Units | 763 | 43.0% |
| Total Occupied Housing Units | 1,776 | 100.0% |
Occupancy by Household Size in Ashville
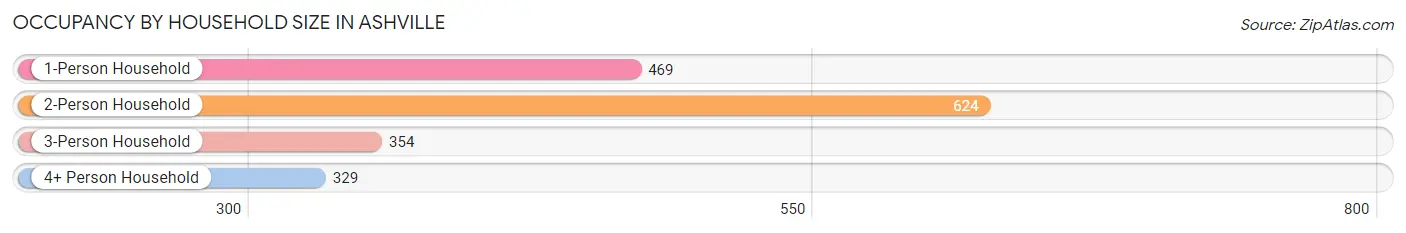
| Household Size | # Housing Units | % Housing Units |
| 1-Person Household | 469 | 26.4% |
| 2-Person Household | 624 | 35.1% |
| 3-Person Household | 354 | 19.9% |
| 4+ Person Household | 329 | 18.5% |
| Total Housing Units | 1,776 | 100.0% |
Occupancy by Ownership by Household Size in Ashville
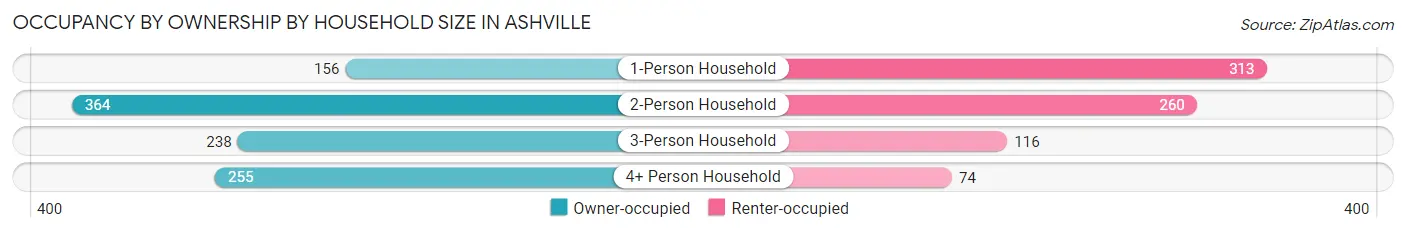
| Household Size | Owner-occupied | Renter-occupied |
| 1-Person Household | 156 (33.3%) | 313 (66.7%) |
| 2-Person Household | 364 (58.3%) | 260 (41.7%) |
| 3-Person Household | 238 (67.2%) | 116 (32.8%) |
| 4+ Person Household | 255 (77.5%) | 74 (22.5%) |
| Total Housing Units | 1,013 (57.0%) | 763 (43.0%) |
Occupancy by Educational Attainment in Ashville
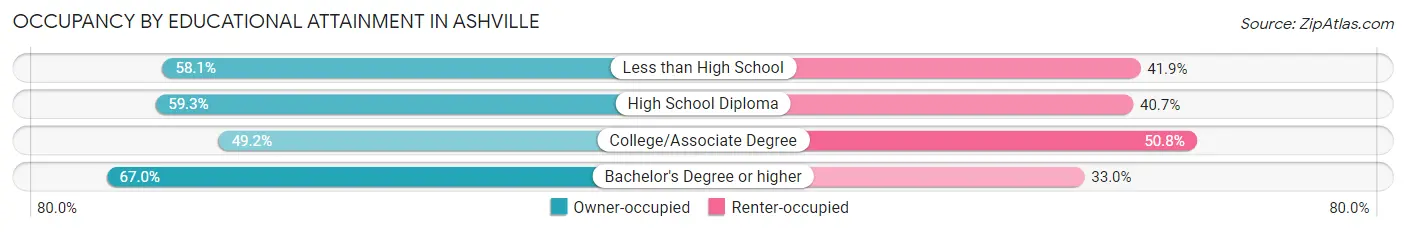
| Household Size | Owner-occupied | Renter-occupied |
| Less than High School | 43 (58.1%) | 31 (41.9%) |
| High School Diploma | 451 (59.3%) | 310 (40.7%) |
| College/Associate Degree | 308 (49.2%) | 318 (50.8%) |
| Bachelor's Degree or higher | 211 (67.0%) | 104 (33.0%) |
Occupancy by Age of Householder in Ashville
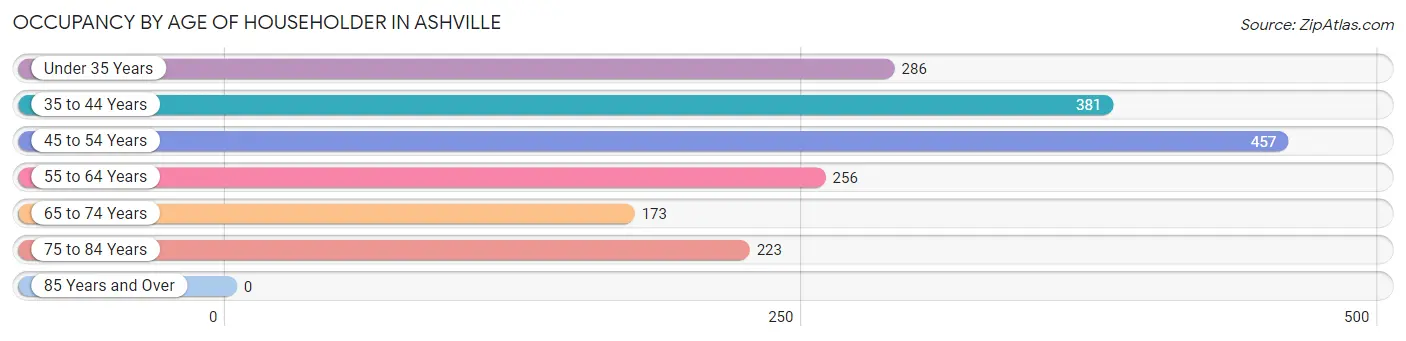
| Age Bracket | # Households | % Households |
| Under 35 Years | 286 | 16.1% |
| 35 to 44 Years | 381 | 21.4% |
| 45 to 54 Years | 457 | 25.7% |
| 55 to 64 Years | 256 | 14.4% |
| 65 to 74 Years | 173 | 9.7% |
| 75 to 84 Years | 223 | 12.6% |
| 85 Years and Over | 0 | 0.0% |
| Total | 1,776 | 100.0% |
Housing Finances in Ashville
Median Income by Occupancy in Ashville
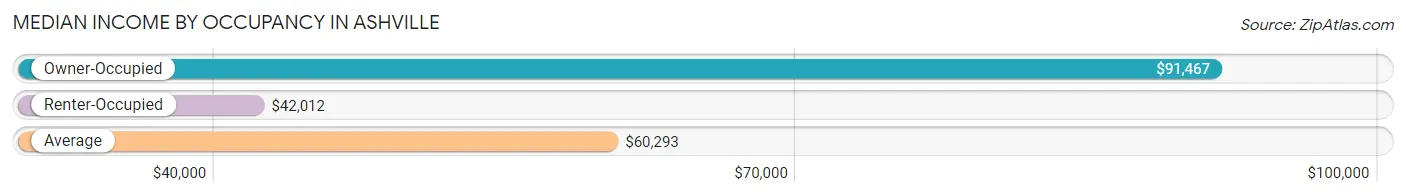
| Occupancy Type | # Households | Median Income |
| Owner-Occupied | 1,013 (57.0%) | $91,467 |
| Renter-Occupied | 763 (43.0%) | $42,012 |
| Average | 1,776 (100.0%) | $60,293 |
Occupancy by Householder Income Bracket in Ashville
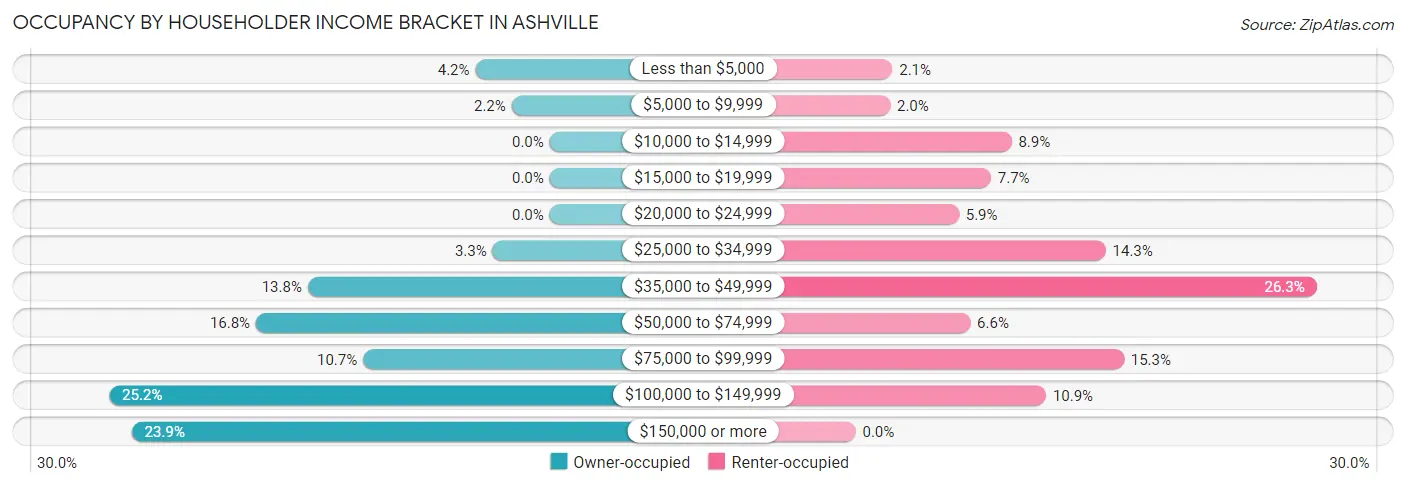
| Income Bracket | Owner-occupied | Renter-occupied |
| Less than $5,000 | 43 (4.2%) | 16 (2.1%) |
| $5,000 to $9,999 | 22 (2.2%) | 15 (2.0%) |
| $10,000 to $14,999 | 0 (0.0%) | 68 (8.9%) |
| $15,000 to $19,999 | 0 (0.0%) | 59 (7.7%) |
| $20,000 to $24,999 | 0 (0.0%) | 45 (5.9%) |
| $25,000 to $34,999 | 33 (3.3%) | 109 (14.3%) |
| $35,000 to $49,999 | 140 (13.8%) | 201 (26.3%) |
| $50,000 to $74,999 | 170 (16.8%) | 50 (6.6%) |
| $75,000 to $99,999 | 108 (10.7%) | 117 (15.3%) |
| $100,000 to $149,999 | 255 (25.2%) | 83 (10.9%) |
| $150,000 or more | 242 (23.9%) | 0 (0.0%) |
| Total | 1,013 (100.0%) | 763 (100.0%) |
Monthly Housing Cost Tiers in Ashville
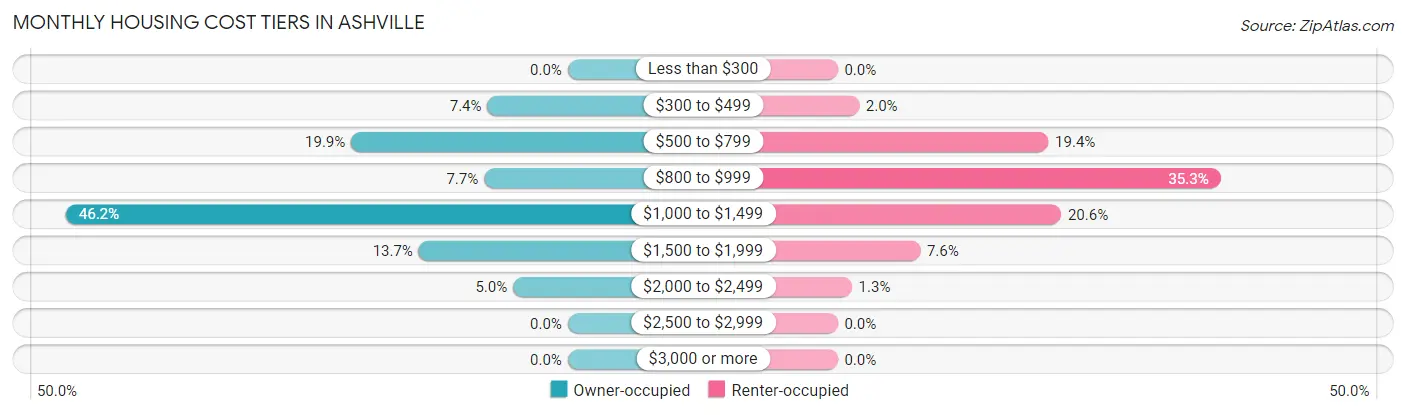
| Monthly Cost | Owner-occupied | Renter-occupied |
| Less than $300 | 0 (0.0%) | 0 (0.0%) |
| $300 to $499 | 75 (7.4%) | 15 (2.0%) |
| $500 to $799 | 202 (19.9%) | 148 (19.4%) |
| $800 to $999 | 78 (7.7%) | 269 (35.3%) |
| $1,000 to $1,499 | 468 (46.2%) | 157 (20.6%) |
| $1,500 to $1,999 | 139 (13.7%) | 58 (7.6%) |
| $2,000 to $2,499 | 51 (5.0%) | 10 (1.3%) |
| $2,500 to $2,999 | 0 (0.0%) | 0 (0.0%) |
| $3,000 or more | 0 (0.0%) | 0 (0.0%) |
| Total | 1,013 (100.0%) | 763 (100.0%) |
Physical Housing Characteristics in Ashville
Housing Structures in Ashville
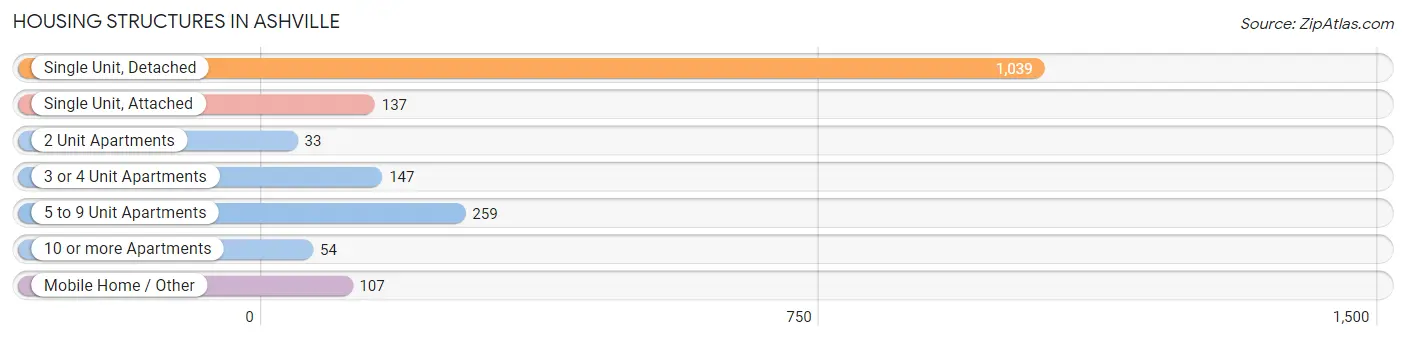
| Structure Type | # Housing Units | % Housing Units |
| Single Unit, Detached | 1,039 | 58.5% |
| Single Unit, Attached | 137 | 7.7% |
| 2 Unit Apartments | 33 | 1.9% |
| 3 or 4 Unit Apartments | 147 | 8.3% |
| 5 to 9 Unit Apartments | 259 | 14.6% |
| 10 or more Apartments | 54 | 3.0% |
| Mobile Home / Other | 107 | 6.0% |
| Total | 1,776 | 100.0% |
Housing Structures by Occupancy in Ashville
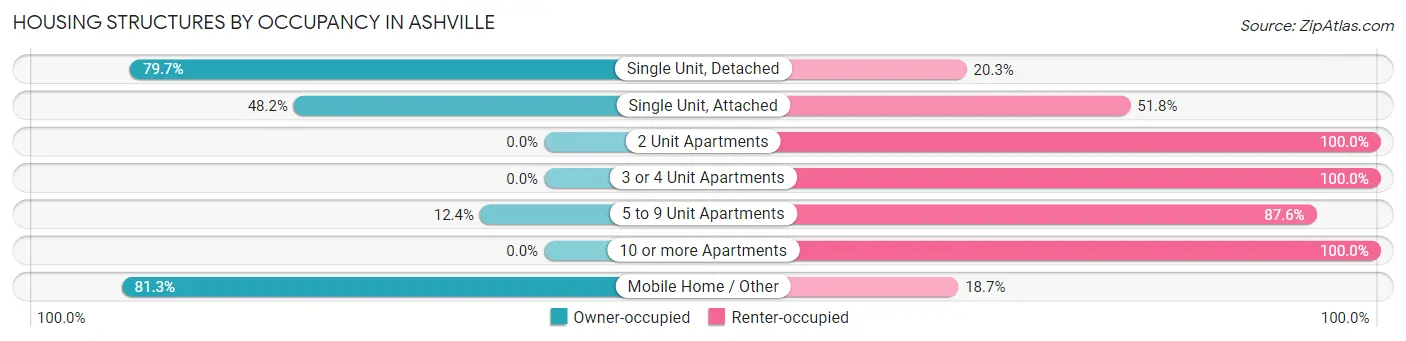
| Structure Type | Owner-occupied | Renter-occupied |
| Single Unit, Detached | 828 (79.7%) | 211 (20.3%) |
| Single Unit, Attached | 66 (48.2%) | 71 (51.8%) |
| 2 Unit Apartments | 0 (0.0%) | 33 (100.0%) |
| 3 or 4 Unit Apartments | 0 (0.0%) | 147 (100.0%) |
| 5 to 9 Unit Apartments | 32 (12.4%) | 227 (87.6%) |
| 10 or more Apartments | 0 (0.0%) | 54 (100.0%) |
| Mobile Home / Other | 87 (81.3%) | 20 (18.7%) |
| Total | 1,013 (57.0%) | 763 (43.0%) |
Housing Structures by Number of Rooms in Ashville
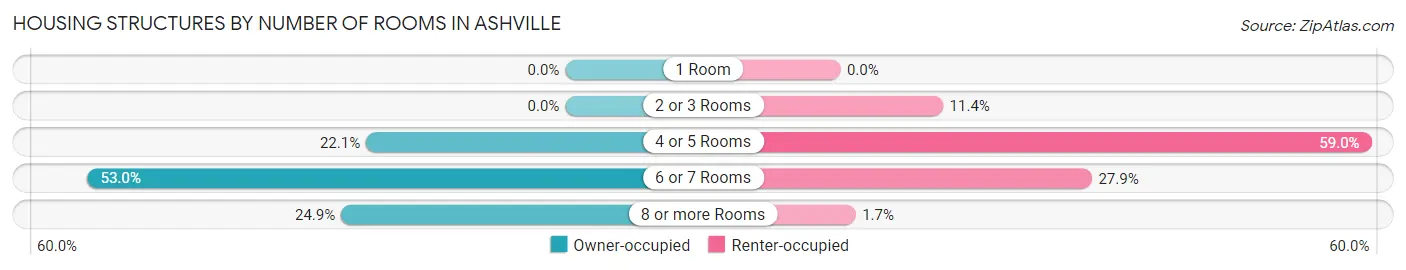
| Number of Rooms | Owner-occupied | Renter-occupied |
| 1 Room | 0 (0.0%) | 0 (0.0%) |
| 2 or 3 Rooms | 0 (0.0%) | 87 (11.4%) |
| 4 or 5 Rooms | 224 (22.1%) | 450 (59.0%) |
| 6 or 7 Rooms | 537 (53.0%) | 213 (27.9%) |
| 8 or more Rooms | 252 (24.9%) | 13 (1.7%) |
| Total | 1,013 (100.0%) | 763 (100.0%) |
Housing Structure by Heating Type in Ashville
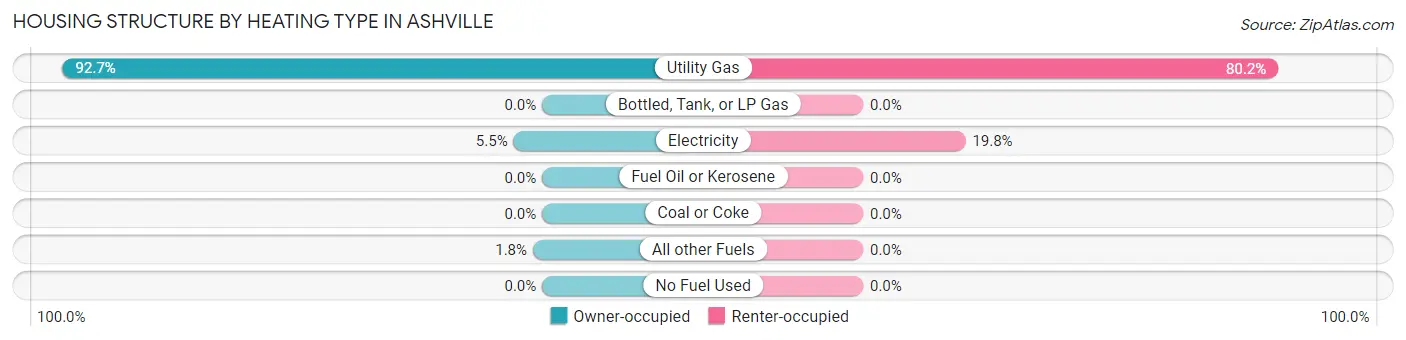
| Heating Type | Owner-occupied | Renter-occupied |
| Utility Gas | 939 (92.7%) | 612 (80.2%) |
| Bottled, Tank, or LP Gas | 0 (0.0%) | 0 (0.0%) |
| Electricity | 56 (5.5%) | 151 (19.8%) |
| Fuel Oil or Kerosene | 0 (0.0%) | 0 (0.0%) |
| Coal or Coke | 0 (0.0%) | 0 (0.0%) |
| All other Fuels | 18 (1.8%) | 0 (0.0%) |
| No Fuel Used | 0 (0.0%) | 0 (0.0%) |
| Total | 1,013 (100.0%) | 763 (100.0%) |
Household Vehicle Usage in Ashville
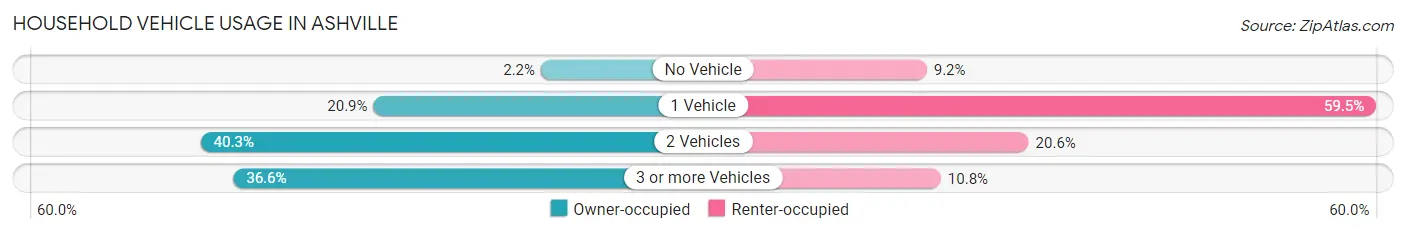
| Vehicles per Household | Owner-occupied | Renter-occupied |
| No Vehicle | 22 (2.2%) | 70 (9.2%) |
| 1 Vehicle | 212 (20.9%) | 454 (59.5%) |
| 2 Vehicles | 408 (40.3%) | 157 (20.6%) |
| 3 or more Vehicles | 371 (36.6%) | 82 (10.7%) |
| Total | 1,013 (100.0%) | 763 (100.0%) |
Real Estate & Mortgages in Ashville
Real Estate and Mortgage Overview in Ashville
| Characteristic | Without Mortgage | With Mortgage |
| Housing Units | 230 | 783 |
| Median Property Value | $178,900 | $191,200 |
| Median Household Income | $60,338 | $216 |
| Monthly Housing Costs | $545 | $0 |
| Real Estate Taxes | $1,850 | $0 |
Property Value by Mortgage Status in Ashville
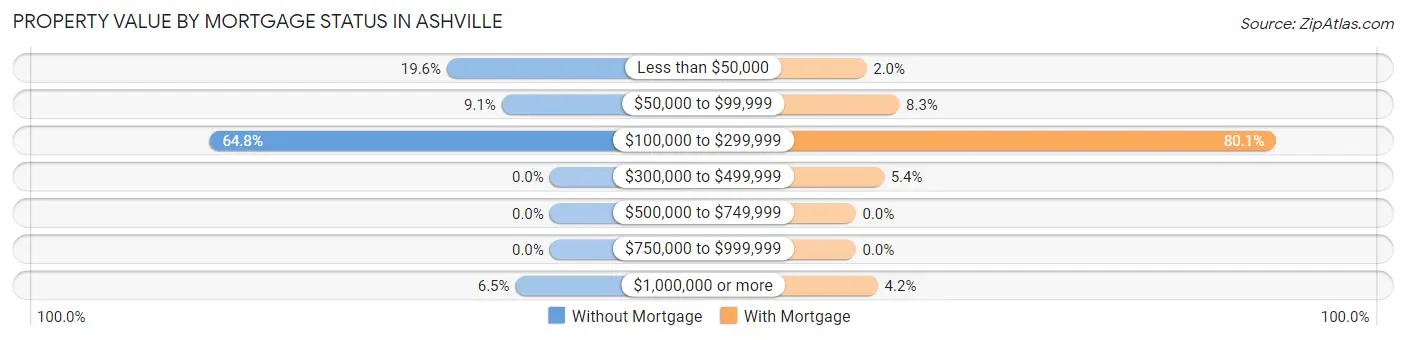
| Property Value | Without Mortgage | With Mortgage |
| Less than $50,000 | 45 (19.6%) | 16 (2.0%) |
| $50,000 to $99,999 | 21 (9.1%) | 65 (8.3%) |
| $100,000 to $299,999 | 149 (64.8%) | 627 (80.1%) |
| $300,000 to $499,999 | 0 (0.0%) | 42 (5.4%) |
| $500,000 to $749,999 | 0 (0.0%) | 0 (0.0%) |
| $750,000 to $999,999 | 0 (0.0%) | 0 (0.0%) |
| $1,000,000 or more | 15 (6.5%) | 33 (4.2%) |
| Total | 230 (100.0%) | 783 (100.0%) |
Household Income by Mortgage Status in Ashville
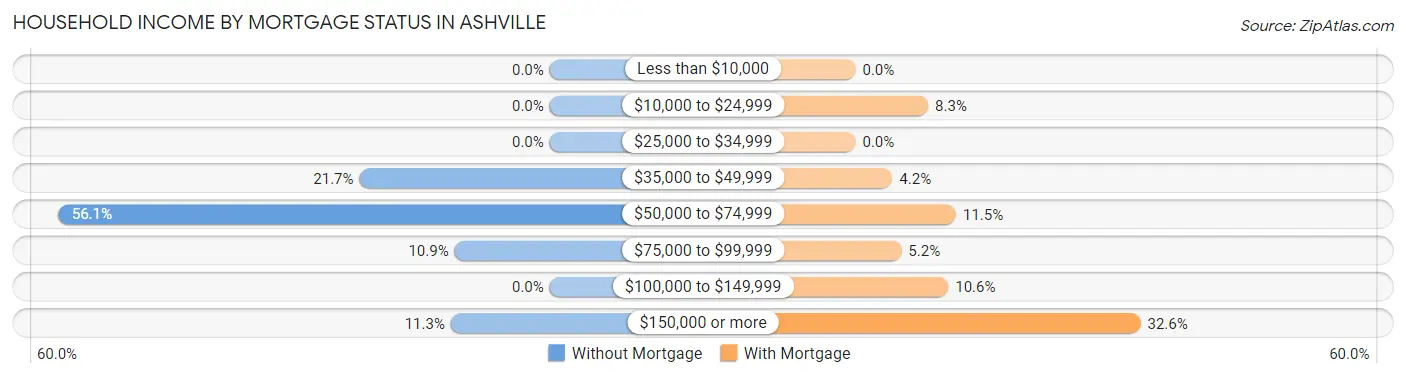
| Household Income | Without Mortgage | With Mortgage |
| Less than $10,000 | 0 (0.0%) | 0 (0.0%) |
| $10,000 to $24,999 | 0 (0.0%) | 65 (8.3%) |
| $25,000 to $34,999 | 0 (0.0%) | 0 (0.0%) |
| $35,000 to $49,999 | 50 (21.7%) | 33 (4.2%) |
| $50,000 to $74,999 | 129 (56.1%) | 90 (11.5%) |
| $75,000 to $99,999 | 25 (10.9%) | 41 (5.2%) |
| $100,000 to $149,999 | 0 (0.0%) | 83 (10.6%) |
| $150,000 or more | 26 (11.3%) | 255 (32.6%) |
| Total | 230 (100.0%) | 783 (100.0%) |
Property Value to Household Income Ratio in Ashville
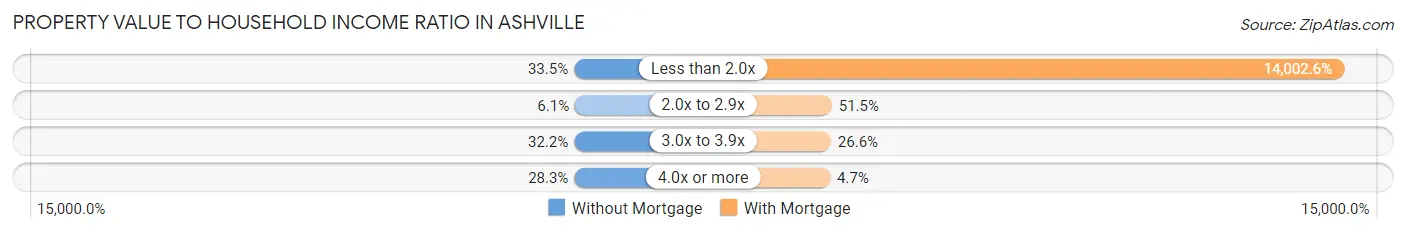
| Value-to-Income Ratio | Without Mortgage | With Mortgage |
| Less than 2.0x | 77 (33.5%) | 109,640 (14,002.5%) |
| 2.0x to 2.9x | 14 (6.1%) | 403 (51.5%) |
| 3.0x to 3.9x | 74 (32.2%) | 208 (26.6%) |
| 4.0x or more | 65 (28.3%) | 37 (4.7%) |
| Total | 230 (100.0%) | 783 (100.0%) |
Real Estate Taxes by Mortgage Status in Ashville
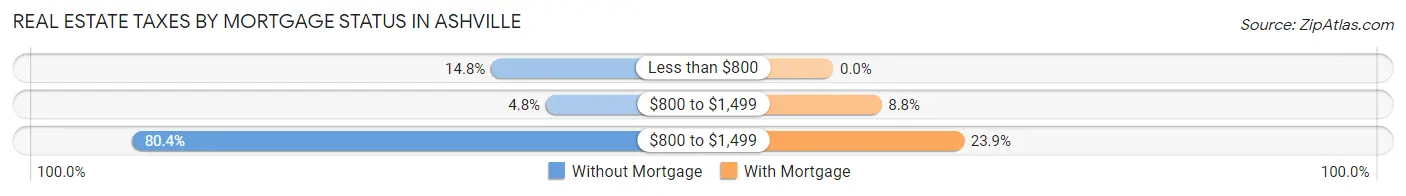
| Property Taxes | Without Mortgage | With Mortgage |
| Less than $800 | 34 (14.8%) | 0 (0.0%) |
| $800 to $1,499 | 11 (4.8%) | 69 (8.8%) |
| $800 to $1,499 | 185 (80.4%) | 187 (23.9%) |
| Total | 230 (100.0%) | 783 (100.0%) |
Health & Disability in Ashville
Health Insurance Coverage by Age in Ashville
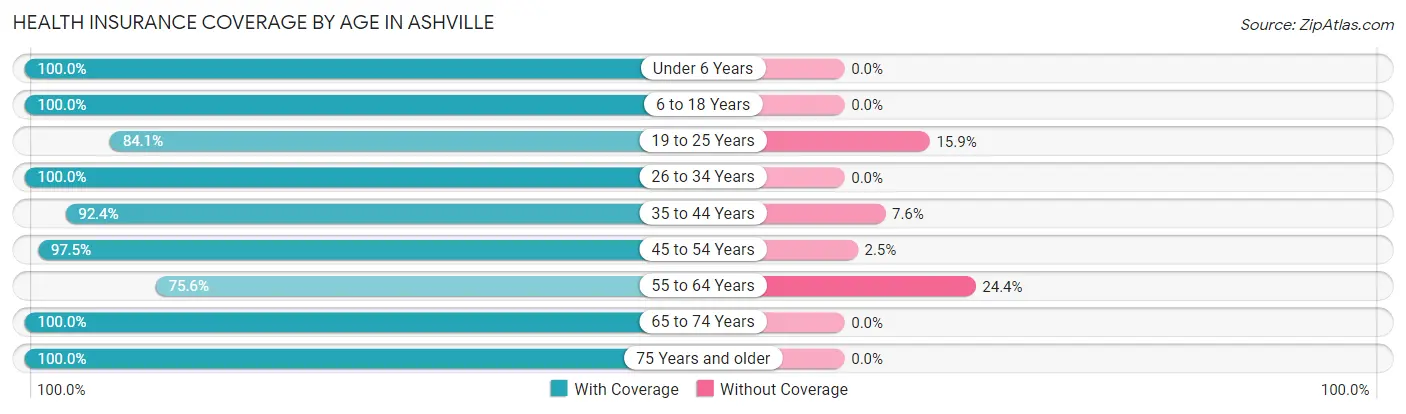
| Age Bracket | With Coverage | Without Coverage |
| Under 6 Years | 229 (100.0%) | 0 (0.0%) |
| 6 to 18 Years | 1,033 (100.0%) | 0 (0.0%) |
| 19 to 25 Years | 524 (84.1%) | 99 (15.9%) |
| 26 to 34 Years | 397 (100.0%) | 0 (0.0%) |
| 35 to 44 Years | 547 (92.4%) | 45 (7.6%) |
| 45 to 54 Years | 749 (97.5%) | 19 (2.5%) |
| 55 to 64 Years | 340 (75.6%) | 110 (24.4%) |
| 65 to 74 Years | 216 (100.0%) | 0 (0.0%) |
| 75 Years and older | 273 (100.0%) | 0 (0.0%) |
| Total | 4,308 (94.0%) | 273 (6.0%) |
Health Insurance Coverage by Citizenship Status in Ashville
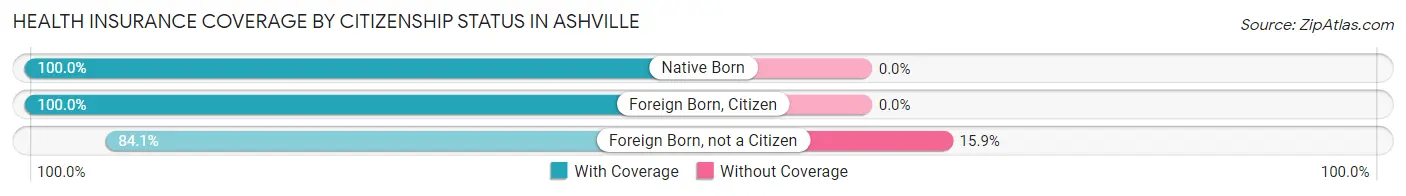
| Citizenship Status | With Coverage | Without Coverage |
| Native Born | 229 (100.0%) | 0 (0.0%) |
| Foreign Born, Citizen | 1,033 (100.0%) | 0 (0.0%) |
| Foreign Born, not a Citizen | 524 (84.1%) | 99 (15.9%) |
Health Insurance Coverage by Household Income in Ashville
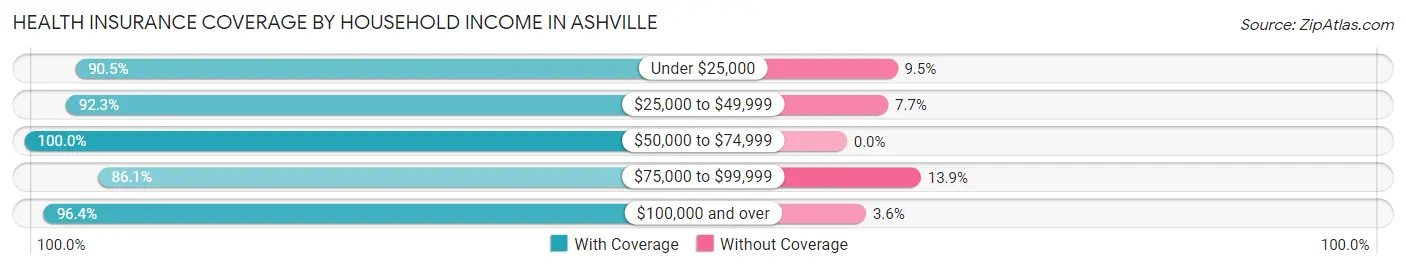
| Household Income | With Coverage | Without Coverage |
| Under $25,000 | 410 (90.5%) | 43 (9.5%) |
| $25,000 to $49,999 | 990 (92.3%) | 83 (7.7%) |
| $50,000 to $74,999 | 447 (100.0%) | 0 (0.0%) |
| $75,000 to $99,999 | 447 (86.1%) | 72 (13.9%) |
| $100,000 and over | 2,014 (96.4%) | 75 (3.6%) |
Public vs Private Health Insurance Coverage by Age in Ashville
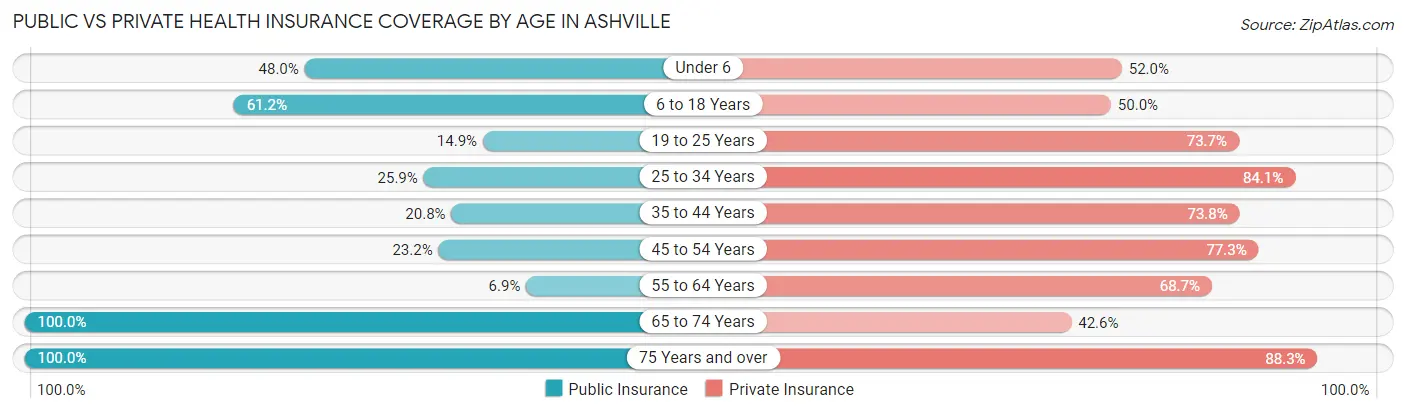
| Age Bracket | Public Insurance | Private Insurance |
| Under 6 | 110 (48.0%) | 119 (52.0%) |
| 6 to 18 Years | 632 (61.2%) | 516 (49.9%) |
| 19 to 25 Years | 93 (14.9%) | 459 (73.7%) |
| 25 to 34 Years | 103 (25.9%) | 334 (84.1%) |
| 35 to 44 Years | 123 (20.8%) | 437 (73.8%) |
| 45 to 54 Years | 178 (23.2%) | 594 (77.3%) |
| 55 to 64 Years | 31 (6.9%) | 309 (68.7%) |
| 65 to 74 Years | 216 (100.0%) | 92 (42.6%) |
| 75 Years and over | 273 (100.0%) | 241 (88.3%) |
| Total | 1,759 (38.4%) | 3,101 (67.7%) |
Disability Status by Sex by Age in Ashville
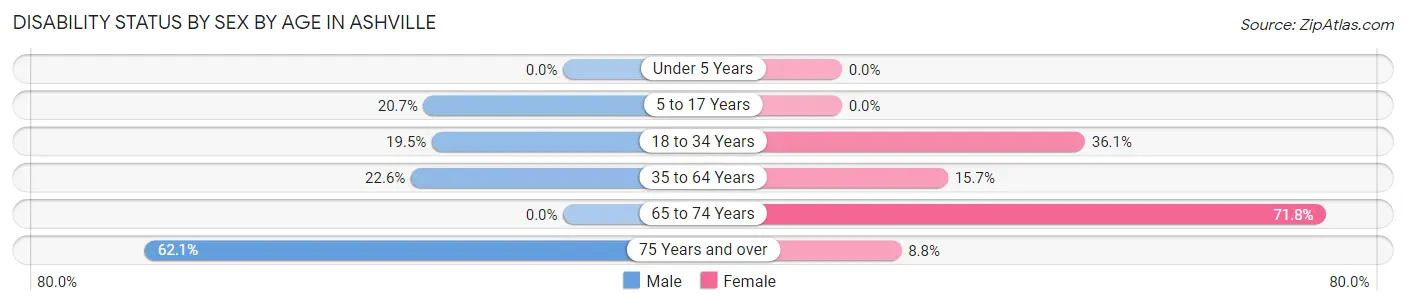
| Age Bracket | Male | Female |
| Under 5 Years | 0 (0.0%) | 0 (0.0%) |
| 5 to 17 Years | 75 (20.7%) | 0 (0.0%) |
| 18 to 34 Years | 127 (19.5%) | 179 (36.1%) |
| 35 to 64 Years | 195 (22.6%) | 149 (15.7%) |
| 65 to 74 Years | 0 (0.0%) | 107 (71.8%) |
| 75 Years and over | 64 (62.1%) | 15 (8.8%) |
Disability Class by Sex by Age in Ashville
Disability Class: Hearing Difficulty
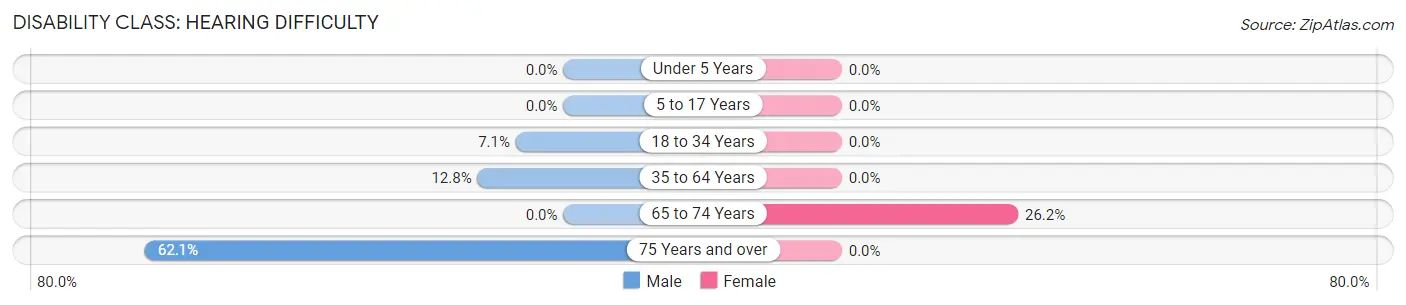
| Age Bracket | Male | Female |
| Under 5 Years | 0 (0.0%) | 0 (0.0%) |
| 5 to 17 Years | 0 (0.0%) | 0 (0.0%) |
| 18 to 34 Years | 46 (7.1%) | 0 (0.0%) |
| 35 to 64 Years | 110 (12.8%) | 0 (0.0%) |
| 65 to 74 Years | 0 (0.0%) | 39 (26.2%) |
| 75 Years and over | 64 (62.1%) | 0 (0.0%) |
Disability Class: Vision Difficulty
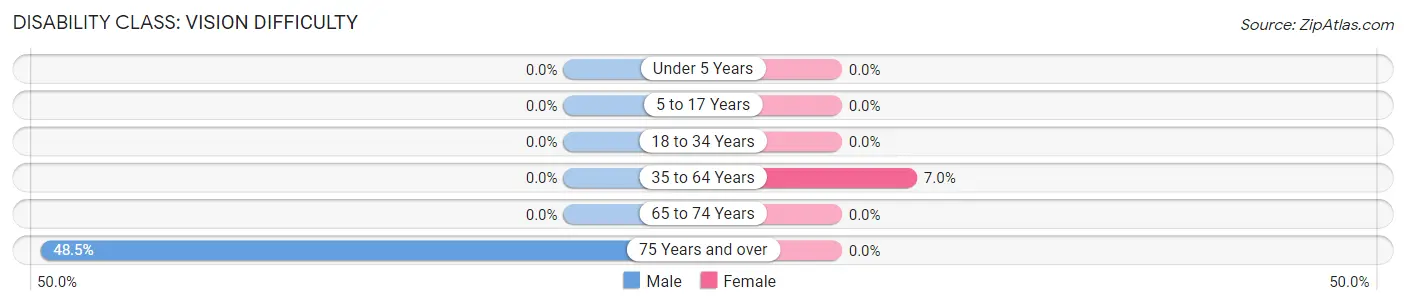
| Age Bracket | Male | Female |
| Under 5 Years | 0 (0.0%) | 0 (0.0%) |
| 5 to 17 Years | 0 (0.0%) | 0 (0.0%) |
| 18 to 34 Years | 0 (0.0%) | 0 (0.0%) |
| 35 to 64 Years | 0 (0.0%) | 66 (7.0%) |
| 65 to 74 Years | 0 (0.0%) | 0 (0.0%) |
| 75 Years and over | 50 (48.5%) | 0 (0.0%) |
Disability Class: Cognitive Difficulty
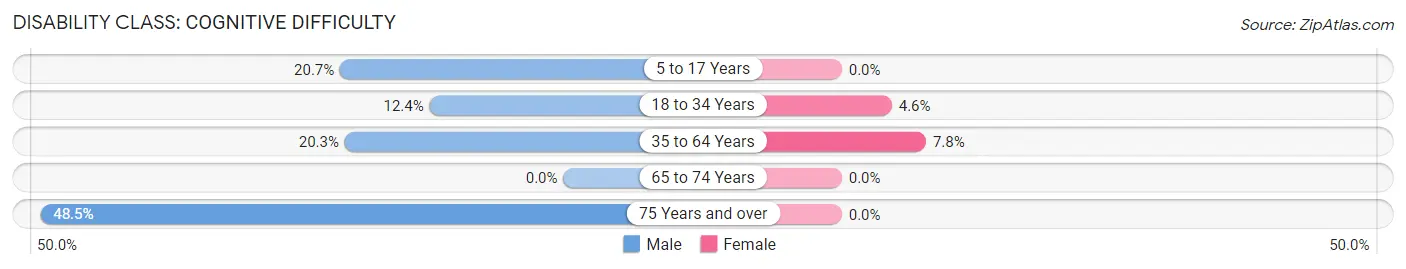
| Age Bracket | Male | Female |
| 5 to 17 Years | 75 (20.7%) | 0 (0.0%) |
| 18 to 34 Years | 81 (12.4%) | 23 (4.6%) |
| 35 to 64 Years | 175 (20.3%) | 74 (7.8%) |
| 65 to 74 Years | 0 (0.0%) | 0 (0.0%) |
| 75 Years and over | 50 (48.5%) | 0 (0.0%) |
Disability Class: Ambulatory Difficulty
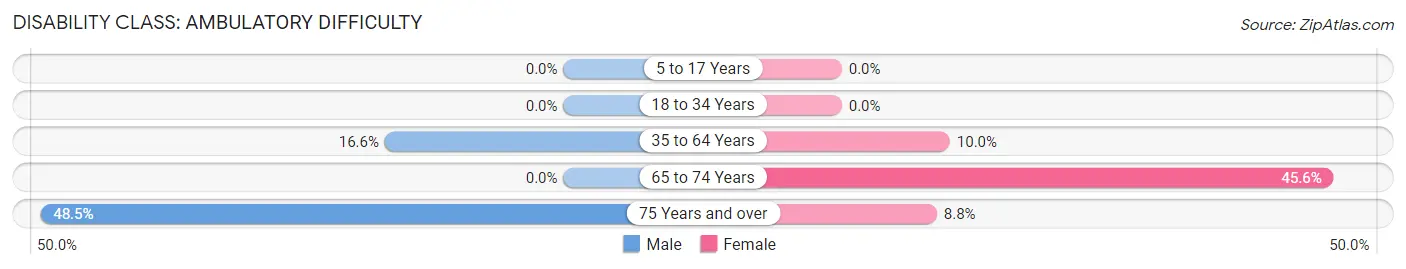
| Age Bracket | Male | Female |
| 5 to 17 Years | 0 (0.0%) | 0 (0.0%) |
| 18 to 34 Years | 0 (0.0%) | 0 (0.0%) |
| 35 to 64 Years | 143 (16.6%) | 95 (10.0%) |
| 65 to 74 Years | 0 (0.0%) | 68 (45.6%) |
| 75 Years and over | 50 (48.5%) | 15 (8.8%) |
Disability Class: Self-Care Difficulty
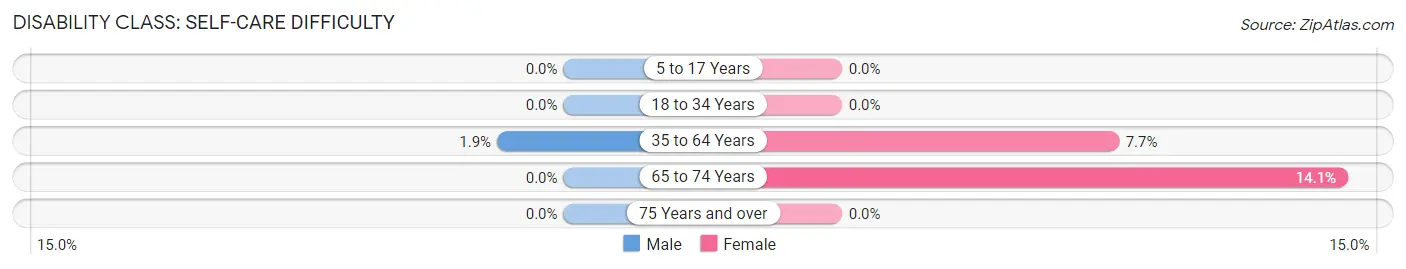
| Age Bracket | Male | Female |
| 5 to 17 Years | 0 (0.0%) | 0 (0.0%) |
| 18 to 34 Years | 0 (0.0%) | 0 (0.0%) |
| 35 to 64 Years | 16 (1.8%) | 73 (7.7%) |
| 65 to 74 Years | 0 (0.0%) | 21 (14.1%) |
| 75 Years and over | 0 (0.0%) | 0 (0.0%) |
Technology Access in Ashville
Computing Device Access in Ashville
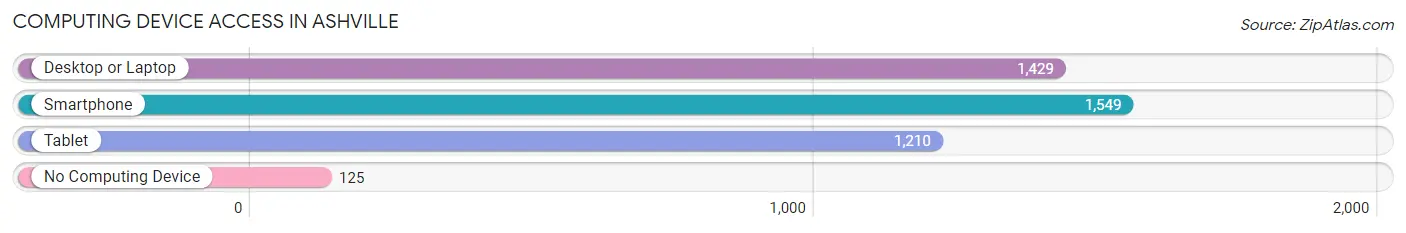
| Device Type | # Households | % Households |
| Desktop or Laptop | 1,429 | 80.5% |
| Smartphone | 1,549 | 87.2% |
| Tablet | 1,210 | 68.1% |
| No Computing Device | 125 | 7.0% |
| Total | 1,776 | 100.0% |
Internet Access in Ashville
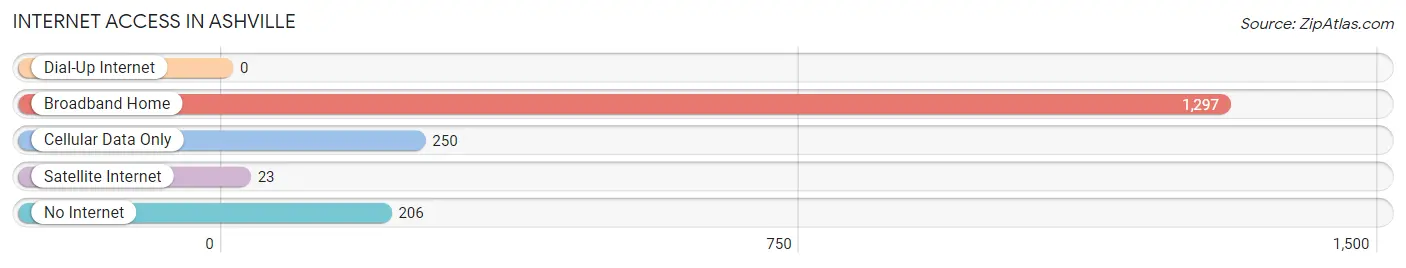
| Internet Type | # Households | % Households |
| Dial-Up Internet | 0 | 0.0% |
| Broadband Home | 1,297 | 73.0% |
| Cellular Data Only | 250 | 14.1% |
| Satellite Internet | 23 | 1.3% |
| No Internet | 206 | 11.6% |
| Total | 1,776 | 100.0% |
Ashville Summary
Asheville, Ohio is a small village located in the southeastern corner of Clermont County, Ohio. It is situated on the banks of the Little Miami River, approximately 25 miles east of Cincinnati. The village has a population of approximately 1,000 people and covers an area of 0.6 square miles.
History
Asheville was founded in 1817 by a group of settlers from North Carolina. The village was named after the city of Asheville, North Carolina, which was the hometown of many of the settlers. The village was originally known as “New Asheville” and was later shortened to “Asheville”.
The village was incorporated in 1845 and was home to a variety of businesses, including a sawmill, a gristmill, a tannery, a blacksmith shop, and a general store. The village also had a post office, a school, and a church.
In the late 19th century, the village was a popular tourist destination due to its proximity to the Little Miami River. The village was also home to a number of resorts, including the Asheville Hotel, which was built in 1891.
Geography
Asheville is located in the southeastern corner of Clermont County, Ohio. It is situated on the banks of the Little Miami River, approximately 25 miles east of Cincinnati. The village has a total area of 0.6 square miles, all of which is land.
The village is located in the Little Miami River Valley, which is a region of rolling hills and valleys. The terrain is mostly flat, with some areas of higher elevation. The village is located in a temperate climate, with hot summers and cold winters.
Economy
Asheville’s economy is largely based on agriculture and tourism. The village is home to a number of farms, which produce a variety of crops, including corn, soybeans, wheat, and hay. The village is also home to a number of wineries, which produce a variety of wines.
The village is also home to a number of small businesses, including restaurants, shops, and other services. The village is also home to a number of bed and breakfasts, which attract tourists from all over the country.
Demographics
As of the 2010 census, the village had a population of 1,000 people. The racial makeup of the village was 97.2% White, 0.7% African American, 0.2% Native American, 0.2% Asian, 0.2% from other races, and 1.7% from two or more races. Hispanic or Latino of any race were 0.7% of the population.
The median income for a household in the village was $45,000, and the median income for a family was $50,000. The per capita income for the village was $20,000. About 8.3% of families and 10.3% of the population were below the poverty line, including 14.3% of those under age 18 and none of those age 65 or over.
Common Questions
What is Per Capita Income in Ashville?
Per Capita income in Ashville is $35,094.
What is the Median Family Income in Ashville?
Median Family Income in Ashville is $77,083.
What is the Median Household income in Ashville?
Median Household Income in Ashville is $60,293.
What is Income or Wage Gap in Ashville?
Income or Wage Gap in Ashville is 14.9%.
Women in Ashville earn 85.1 cents for every dollar earned by a man.
What is Inequality or Gini Index in Ashville?
Inequality or Gini Index in Ashville is 0.43.
What is the Total Population of Ashville?
Total Population of Ashville is 4,581.
What is the Total Male Population of Ashville?
Total Male Population of Ashville is 2,170.
What is the Total Female Population of Ashville?
Total Female Population of Ashville is 2,411.
What is the Ratio of Males per 100 Females in Ashville?
There are 90.00 Males per 100 Females in Ashville.
What is the Ratio of Females per 100 Males in Ashville?
There are 111.11 Females per 100 Males in Ashville.
What is the Median Population Age in Ashville?
Median Population Age in Ashville is 35.1 Years.
What is the Average Family Size in Ashville
Average Family Size in Ashville is 3.2 People.
What is the Average Household Size in Ashville
Average Household Size in Ashville is 2.6 People.
How Large is the Labor Force in Ashville?
There are 2,266 People in the Labor Forcein in Ashville.
What is the Percentage of People in the Labor Force in Ashville?
62.4% of People are in the Labor Force in Ashville.
What is the Unemployment Rate in Ashville?
Unemployment Rate in Ashville is 4.3%.