Archbold, OH Map & Demographics
Archbold Map
Archbold Overview
$35,339
PER CAPITA INCOME
$91,250
AVG FAMILY INCOME
$69,125
AVG HOUSEHOLD INCOME
47.4%
WAGE / INCOME GAP [ % ]
52.6¢/ $1
WAGE / INCOME GAP [ $ ]
0.41
INEQUALITY / GINI INDEX
4,439
TOTAL POPULATION
2,134
MALE POPULATION
2,305
FEMALE POPULATION
92.58
MALES / 100 FEMALES
108.01
FEMALES / 100 MALES
45.2
MEDIAN AGE
3.0
AVG FAMILY SIZE
2.4
AVG HOUSEHOLD SIZE
2,232
LABOR FORCE [ PEOPLE ]
65.0%
PERCENT IN LABOR FORCE
5.6%
UNEMPLOYMENT RATE
Archbold Zip Codes
Income in Archbold
Income Overview in Archbold
Per Capita Income in Archbold is $35,339, while median incomes of families and households are $91,250 and $69,125 respectively.
| Characteristic | Number | Measure |
| Per Capita Income | 4,439 | $35,339 |
| Median Family Income | 1,201 | $91,250 |
| Mean Family Income | 1,201 | $105,965 |
| Median Household Income | 1,773 | $69,125 |
| Mean Household Income | 1,773 | $86,290 |
| Income Deficit | 1,201 | $0 |
| Wage / Income Gap (%) | 4,439 | 47.45% |
| Wage / Income Gap ($) | 4,439 | 52.55¢ per $1 |
| Gini / Inequality Index | 4,439 | 0.41 |
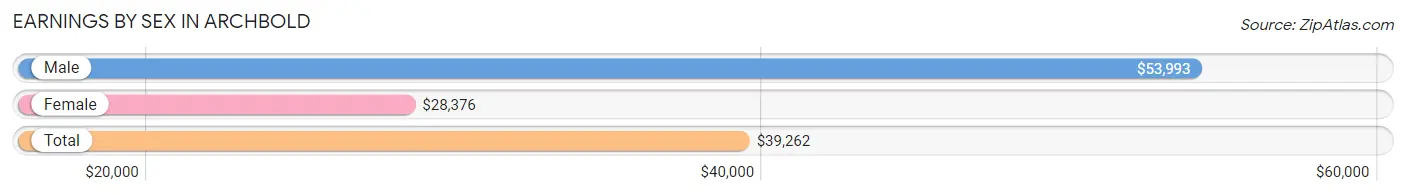
Earnings by Sex in Archbold
Average Earnings in Archbold are $39,262, $53,993 for men and $28,376 for women, a difference of 47.4%.
| Sex | Number | Average Earnings |
| Male | 1,167 (52.1%) | $53,993 |
| Female | 1,071 (47.9%) | $28,376 |
| Total | 2,238 (100.0%) | $39,262 |
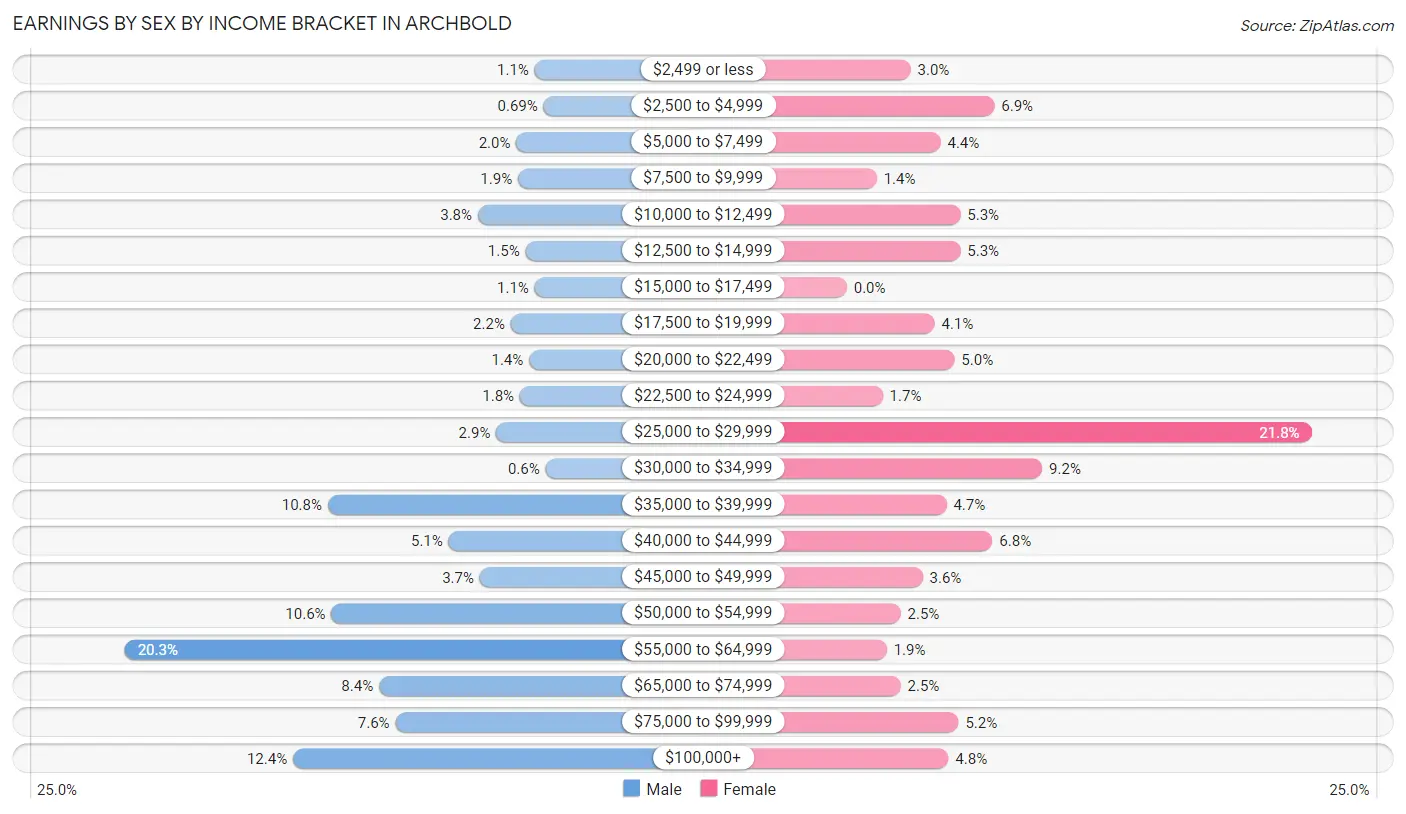
Earnings by Sex by Income Bracket in Archbold
The most common earnings brackets in Archbold are $55,000 to $64,999 for men (237 | 20.3%) and $25,000 to $29,999 for women (233 | 21.8%).
| Income | Male | Female |
| $2,499 or less | 13 (1.1%) | 32 (3.0%) |
| $2,500 to $4,999 | 8 (0.7%) | 74 (6.9%) |
| $5,000 to $7,499 | 23 (2.0%) | 47 (4.4%) |
| $7,500 to $9,999 | 22 (1.9%) | 15 (1.4%) |
| $10,000 to $12,499 | 44 (3.8%) | 57 (5.3%) |
| $12,500 to $14,999 | 18 (1.5%) | 57 (5.3%) |
| $15,000 to $17,499 | 13 (1.1%) | 0 (0.0%) |
| $17,500 to $19,999 | 26 (2.2%) | 44 (4.1%) |
| $20,000 to $22,499 | 16 (1.4%) | 54 (5.0%) |
| $22,500 to $24,999 | 21 (1.8%) | 18 (1.7%) |
| $25,000 to $29,999 | 34 (2.9%) | 233 (21.8%) |
| $30,000 to $34,999 | 7 (0.6%) | 98 (9.1%) |
| $35,000 to $39,999 | 126 (10.8%) | 50 (4.7%) |
| $40,000 to $44,999 | 60 (5.1%) | 73 (6.8%) |
| $45,000 to $49,999 | 43 (3.7%) | 38 (3.5%) |
| $50,000 to $54,999 | 124 (10.6%) | 27 (2.5%) |
| $55,000 to $64,999 | 237 (20.3%) | 20 (1.9%) |
| $65,000 to $74,999 | 98 (8.4%) | 27 (2.5%) |
| $75,000 to $99,999 | 89 (7.6%) | 56 (5.2%) |
| $100,000+ | 145 (12.4%) | 51 (4.8%) |
| Total | 1,167 (100.0%) | 1,071 (100.0%) |
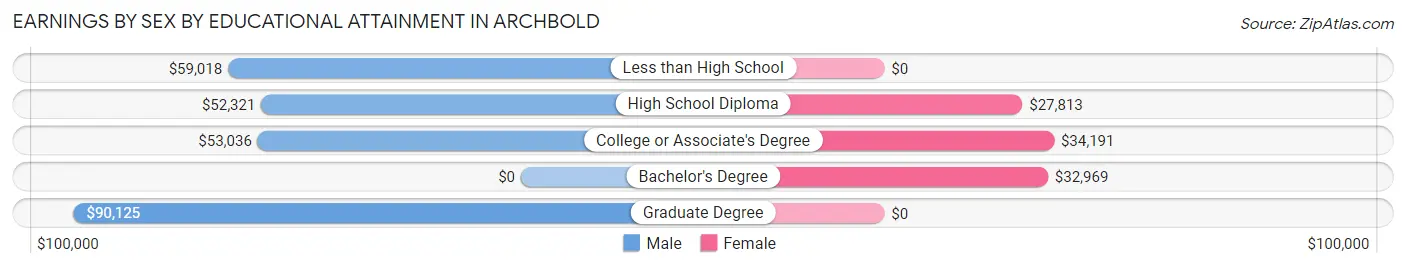
Earnings by Sex by Educational Attainment in Archbold
Average earnings in Archbold are $58,512 for men and $29,362 for women, a difference of 49.8%. Men with an educational attainment of graduate degree enjoy the highest average annual earnings of $90,125, while those with high school diploma education earn the least with $52,321. Women with an educational attainment of college or associate's degree earn the most with the average annual earnings of $34,191, while those with high school diploma education have the smallest earnings of $27,813.
| Educational Attainment | Male Income | Female Income |
| Less than High School | $59,018 | $0 |
| High School Diploma | $52,321 | $27,813 |
| College or Associate's Degree | $53,036 | $34,191 |
| Bachelor's Degree | - | - |
| Graduate Degree | $90,125 | $0 |
| Total | $58,512 | $29,362 |
Family Income in Archbold
Family Income Brackets in Archbold
According to the Archbold family income data, there are 263 families falling into the $50,000 to $74,999 income range, which is the most common income bracket and makes up 21.9% of all families.
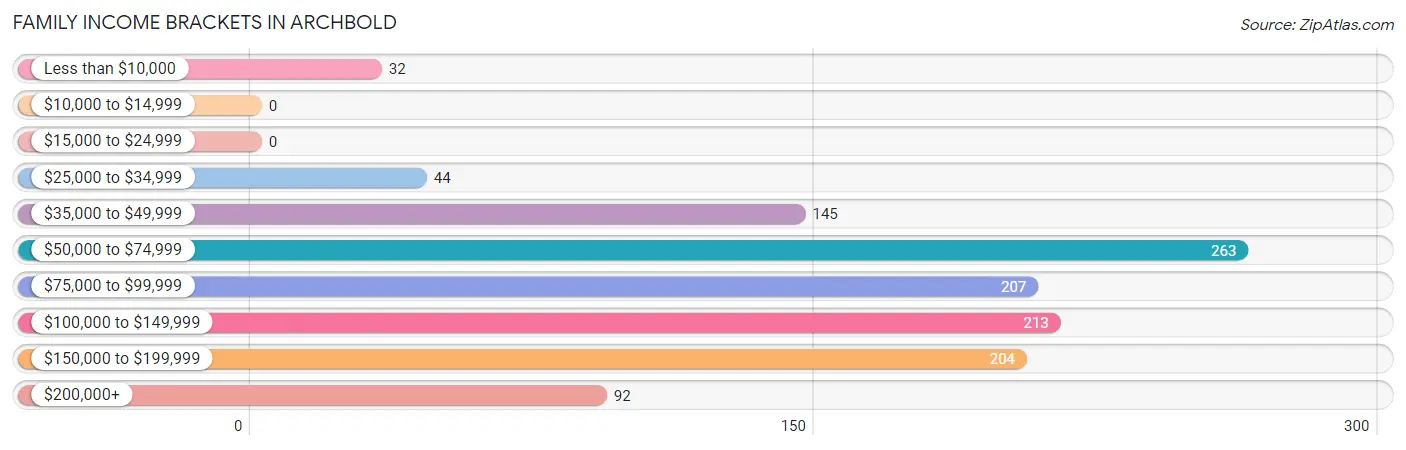
| Income Bracket | # Families | % Families |
| Less than $10,000 | 32 | 2.7% |
| $10,000 to $14,999 | 0 | 0.0% |
| $15,000 to $24,999 | 0 | 0.0% |
| $25,000 to $34,999 | 44 | 3.7% |
| $35,000 to $49,999 | 145 | 12.1% |
| $50,000 to $74,999 | 263 | 21.9% |
| $75,000 to $99,999 | 207 | 17.2% |
| $100,000 to $149,999 | 213 | 17.7% |
| $150,000 to $199,999 | 204 | 17.0% |
| $200,000+ | 92 | 7.7% |
Family Income by Famaliy Size in Archbold
3-person families (126 | 10.5%) account for the highest median family income in Archbold with $112,083 per family, while 2-person families (691 | 57.5%) have the highest median income of $39,558 per family member.
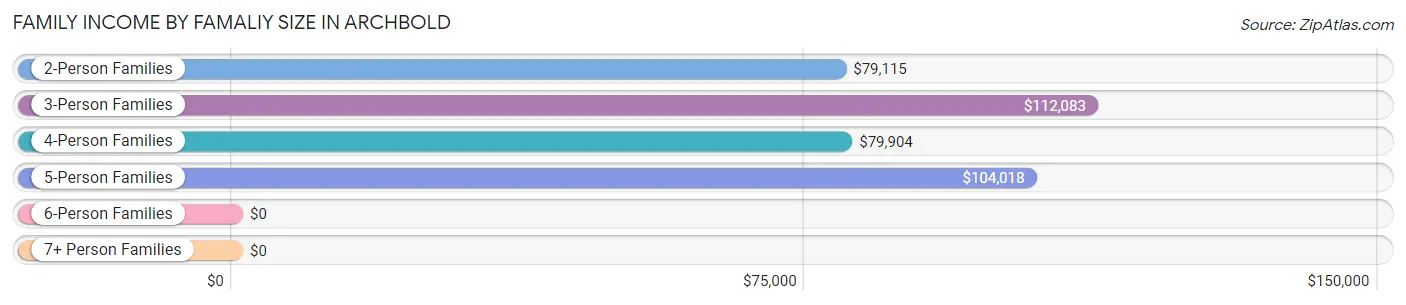
| Income Bracket | # Families | Median Income |
| 2-Person Families | 691 (57.5%) | $79,115 |
| 3-Person Families | 126 (10.5%) | $112,083 |
| 4-Person Families | 216 (18.0%) | $79,904 |
| 5-Person Families | 112 (9.3%) | $104,018 |
| 6-Person Families | 14 (1.2%) | $0 |
| 7+ Person Families | 42 (3.5%) | $0 |
| Total | 1,201 (100.0%) | $91,250 |
Family Income by Number of Earners in Archbold
The median family income in Archbold is $91,250, with families comprising 2 earners (538) having the highest median family income of $112,826, while families with no earners (177) have the lowest median family income of $61,250, accounting for 44.8% and 14.7% of families, respectively.
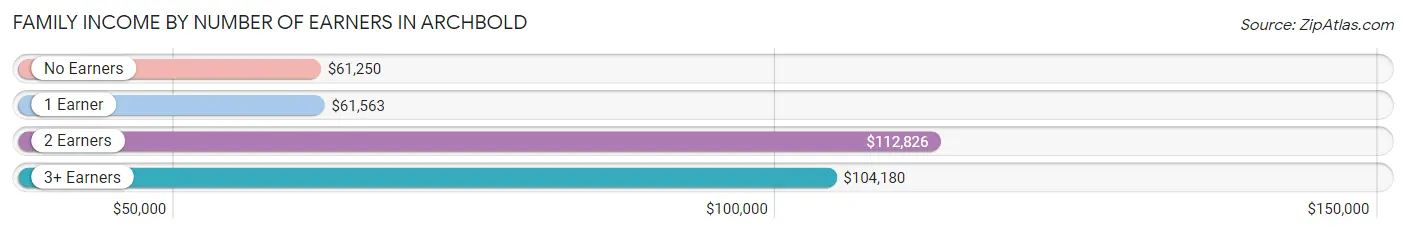
| Number of Earners | # Families | Median Income |
| No Earners | 177 (14.7%) | $61,250 |
| 1 Earner | 354 (29.5%) | $61,563 |
| 2 Earners | 538 (44.8%) | $112,826 |
| 3+ Earners | 132 (11.0%) | $104,180 |
| Total | 1,201 (100.0%) | $91,250 |
Household Income in Archbold
Household Income Brackets in Archbold
With 287 households falling in the category, the $50,000 to $74,999 income range is the most frequent in Archbold, accounting for 16.2% of all households. In contrast, only 60 households (3.4%) fall into the $15,000 to $24,999 income bracket, making it the least populous group.
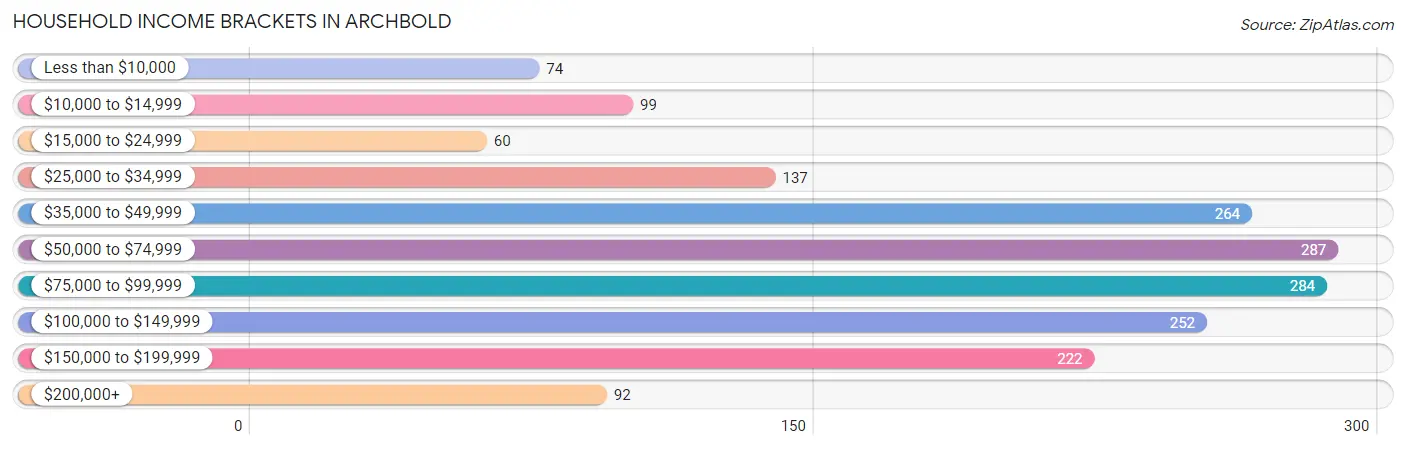
| Income Bracket | # Households | % Households |
| Less than $10,000 | 74 | 4.2% |
| $10,000 to $14,999 | 99 | 5.6% |
| $15,000 to $24,999 | 60 | 3.4% |
| $25,000 to $34,999 | 137 | 7.7% |
| $35,000 to $49,999 | 264 | 14.9% |
| $50,000 to $74,999 | 287 | 16.2% |
| $75,000 to $99,999 | 284 | 16.0% |
| $100,000 to $149,999 | 252 | 14.2% |
| $150,000 to $199,999 | 222 | 12.5% |
| $200,000+ | 92 | 5.2% |
Household Income by Householder Age in Archbold
The median household income in Archbold is $69,125, with the highest median household income of $103,033 found in the 45 to 64 years age bracket for the primary householder. A total of 634 households (35.8%) fall into this category. Meanwhile, the 15 to 24 years age bracket for the primary householder has the lowest median household income of $0, with 131 households (7.4%) in this group.
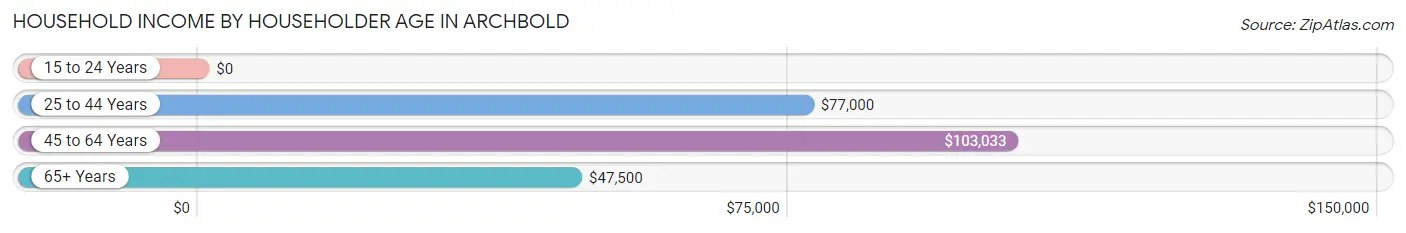
| Income Bracket | # Households | Median Income |
| 15 to 24 Years | 131 (7.4%) | $0 |
| 25 to 44 Years | 378 (21.3%) | $77,000 |
| 45 to 64 Years | 634 (35.8%) | $103,033 |
| 65+ Years | 630 (35.5%) | $47,500 |
| Total | 1,773 (100.0%) | $69,125 |
Poverty in Archbold
Income Below Poverty by Sex and Age in Archbold
With 2.5% poverty level for males and 8.7% for females among the residents of Archbold, 5 year old males and 18 to 24 year old females are the most vulnerable to poverty, with 10 males (100.0%) and 109 females (53.2%) in their respective age groups living below the poverty level.
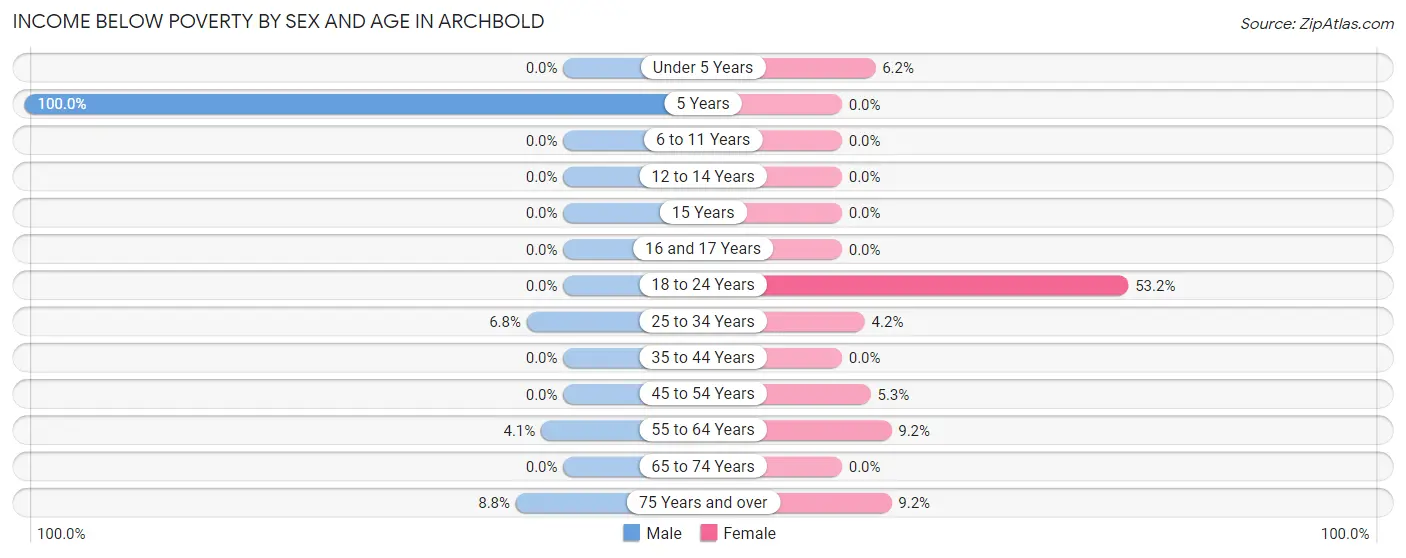
| Age Bracket | Male | Female |
| Under 5 Years | 0 (0.0%) | 8 (6.2%) |
| 5 Years | 10 (100.0%) | 0 (0.0%) |
| 6 to 11 Years | 0 (0.0%) | 0 (0.0%) |
| 12 to 14 Years | 0 (0.0%) | 0 (0.0%) |
| 15 Years | 0 (0.0%) | 0 (0.0%) |
| 16 and 17 Years | 0 (0.0%) | 0 (0.0%) |
| 18 to 24 Years | 0 (0.0%) | 109 (53.2%) |
| 25 to 34 Years | 8 (6.8%) | 10 (4.2%) |
| 35 to 44 Years | 0 (0.0%) | 0 (0.0%) |
| 45 to 54 Years | 0 (0.0%) | 11 (5.3%) |
| 55 to 64 Years | 14 (4.1%) | 34 (9.2%) |
| 65 to 74 Years | 0 (0.0%) | 0 (0.0%) |
| 75 Years and over | 21 (8.8%) | 24 (9.2%) |
| Total | 53 (2.5%) | 196 (8.7%) |
Income Above Poverty by Sex and Age in Archbold
According to the poverty statistics in Archbold, males aged under 5 years and females aged 5 years are the age groups that are most secure financially, with 100.0% of males and 100.0% of females in these age groups living above the poverty line.
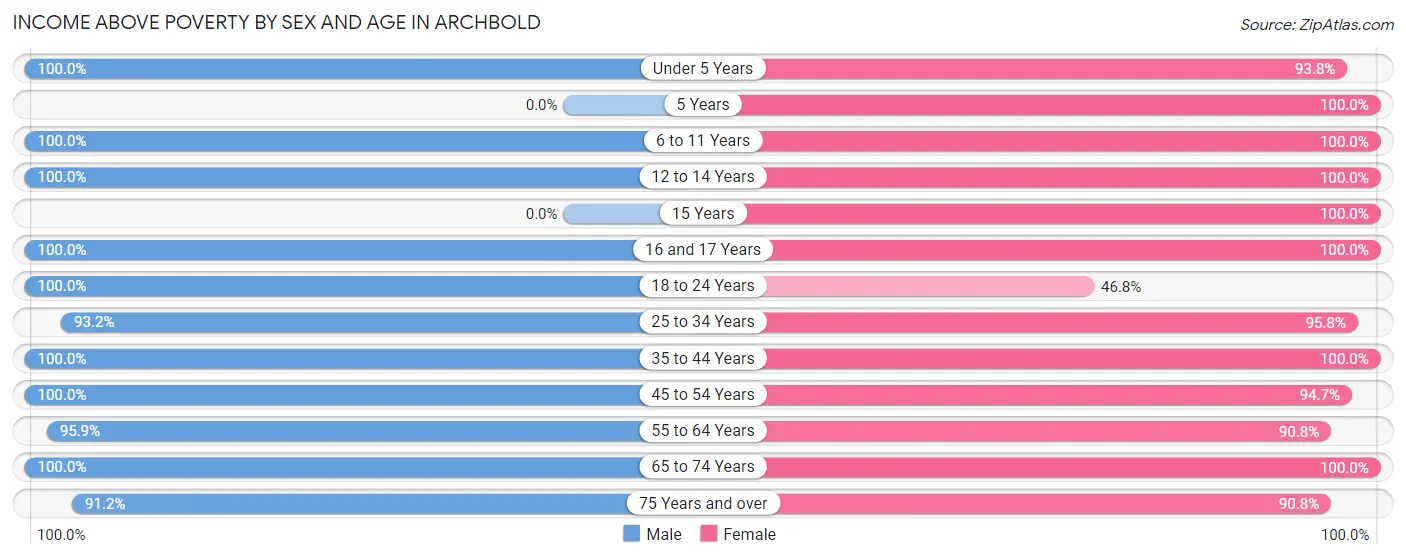
| Age Bracket | Male | Female |
| Under 5 Years | 108 (100.0%) | 121 (93.8%) |
| 5 Years | 0 (0.0%) | 12 (100.0%) |
| 6 to 11 Years | 221 (100.0%) | 233 (100.0%) |
| 12 to 14 Years | 126 (100.0%) | 149 (100.0%) |
| 15 Years | 0 (0.0%) | 7 (100.0%) |
| 16 and 17 Years | 54 (100.0%) | 60 (100.0%) |
| 18 to 24 Years | 114 (100.0%) | 96 (46.8%) |
| 25 to 34 Years | 110 (93.2%) | 226 (95.8%) |
| 35 to 44 Years | 247 (100.0%) | 168 (100.0%) |
| 45 to 54 Years | 264 (100.0%) | 195 (94.7%) |
| 55 to 64 Years | 325 (95.9%) | 336 (90.8%) |
| 65 to 74 Years | 244 (100.0%) | 203 (100.0%) |
| 75 Years and over | 217 (91.2%) | 237 (90.8%) |
| Total | 2,030 (97.5%) | 2,043 (91.2%) |
Income Below Poverty Among Married-Couple Families in Archbold
The poverty statistics for married-couple families in Archbold show that 2.4% or 25 of the total 1,044 families live below the poverty line. Families with no children have the highest poverty rate of 3.6%, comprising of 25 families. On the other hand, families with 1 or 2 children have the lowest poverty rate of 0.0%, which includes 0 families.
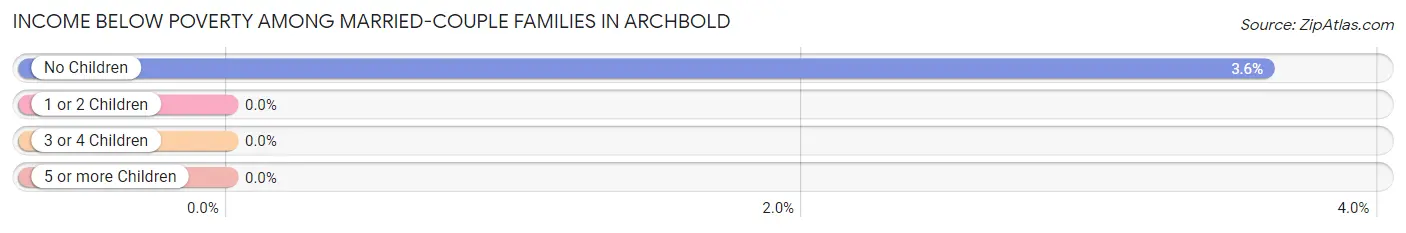
| Children | Above Poverty | Below Poverty |
| No Children | 667 (96.4%) | 25 (3.6%) |
| 1 or 2 Children | 226 (100.0%) | 0 (0.0%) |
| 3 or 4 Children | 84 (100.0%) | 0 (0.0%) |
| 5 or more Children | 42 (100.0%) | 0 (0.0%) |
| Total | 1,019 (97.6%) | 25 (2.4%) |
Income Below Poverty Among Single-Parent Households in Archbold
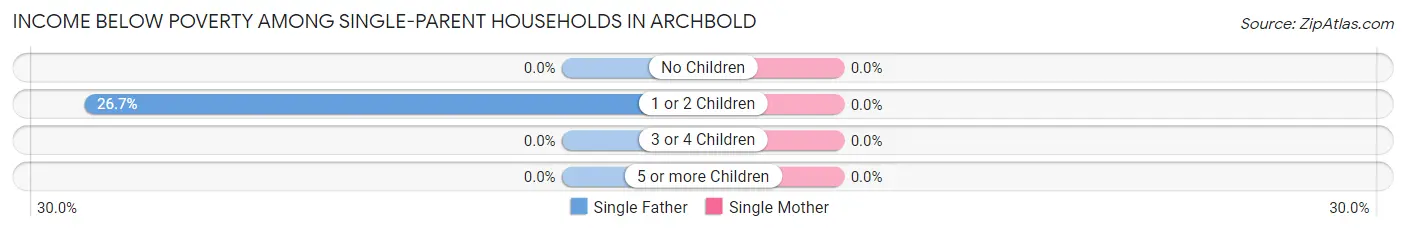
| Children | Single Father | Single Mother |
| No Children | 0 (0.0%) | 0 (0.0%) |
| 1 or 2 Children | 8 (26.7%) | 0 (0.0%) |
| 3 or 4 Children | 0 (0.0%) | 0 (0.0%) |
| 5 or more Children | 0 (0.0%) | 0 (0.0%) |
| Total | 8 (17.0%) | 0 (0.0%) |
Income Below Poverty Among Married-Couple vs Single-Parent Households in Archbold
The poverty data for Archbold shows that 25 of the married-couple family households (2.4%) and 8 of the single-parent households (5.1%) are living below the poverty level. Within the married-couple family households, those with no children have the highest poverty rate, with 25 households (3.6%) falling below the poverty line. Among the single-parent households, those with 1 or 2 children have the highest poverty rate, with 8 household (6.6%) living below poverty.
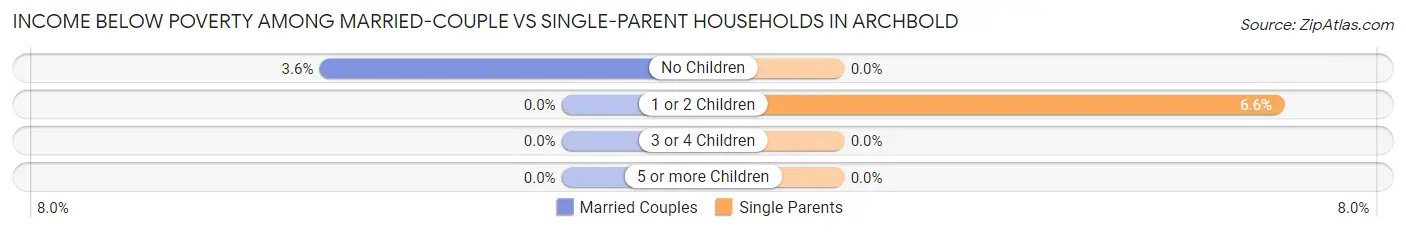
| Children | Married-Couple Families | Single-Parent Households |
| No Children | 25 (3.6%) | 0 (0.0%) |
| 1 or 2 Children | 0 (0.0%) | 8 (6.6%) |
| 3 or 4 Children | 0 (0.0%) | 0 (0.0%) |
| 5 or more Children | 0 (0.0%) | 0 (0.0%) |
| Total | 25 (2.4%) | 8 (5.1%) |
Race in Archbold
The most populous races in Archbold are White / Caucasian (3,710 | 83.6%), Hispanic or Latino (720 | 16.2%), and Two or more Races (445 | 10.0%).
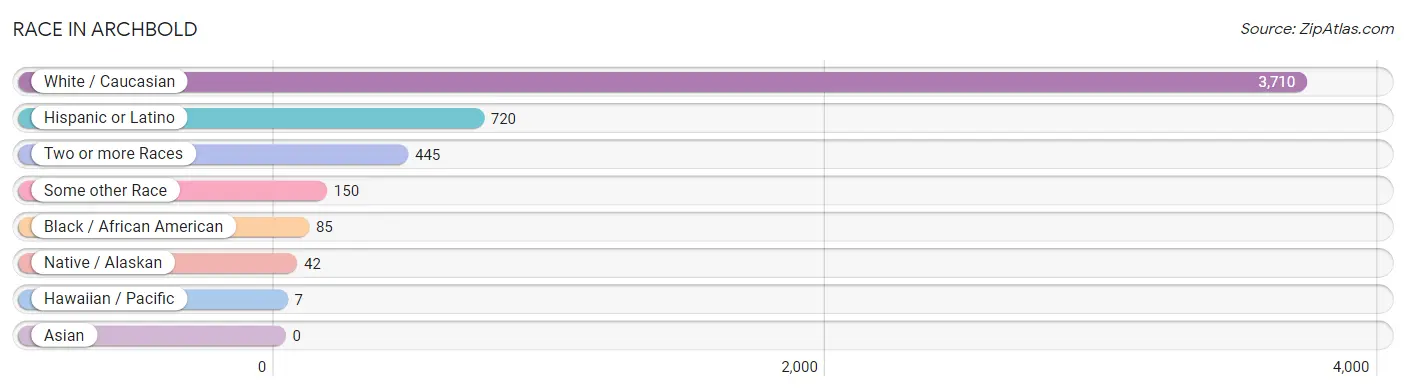
| Race | # Population | % Population |
| Asian | 0 | 0.0% |
| Black / African American | 85 | 1.9% |
| Hawaiian / Pacific | 7 | 0.2% |
| Hispanic or Latino | 720 | 16.2% |
| Native / Alaskan | 42 | 0.9% |
| White / Caucasian | 3,710 | 83.6% |
| Two or more Races | 445 | 10.0% |
| Some other Race | 150 | 3.4% |
| Total | 4,439 | 100.0% |
Ancestry in Archbold
The most populous ancestries reported in Archbold are German (1,856 | 41.8%), Irish (528 | 11.9%), Mexican (482 | 10.9%), American (311 | 7.0%), and English (231 | 5.2%), together accounting for 76.8% of all Archbold residents.
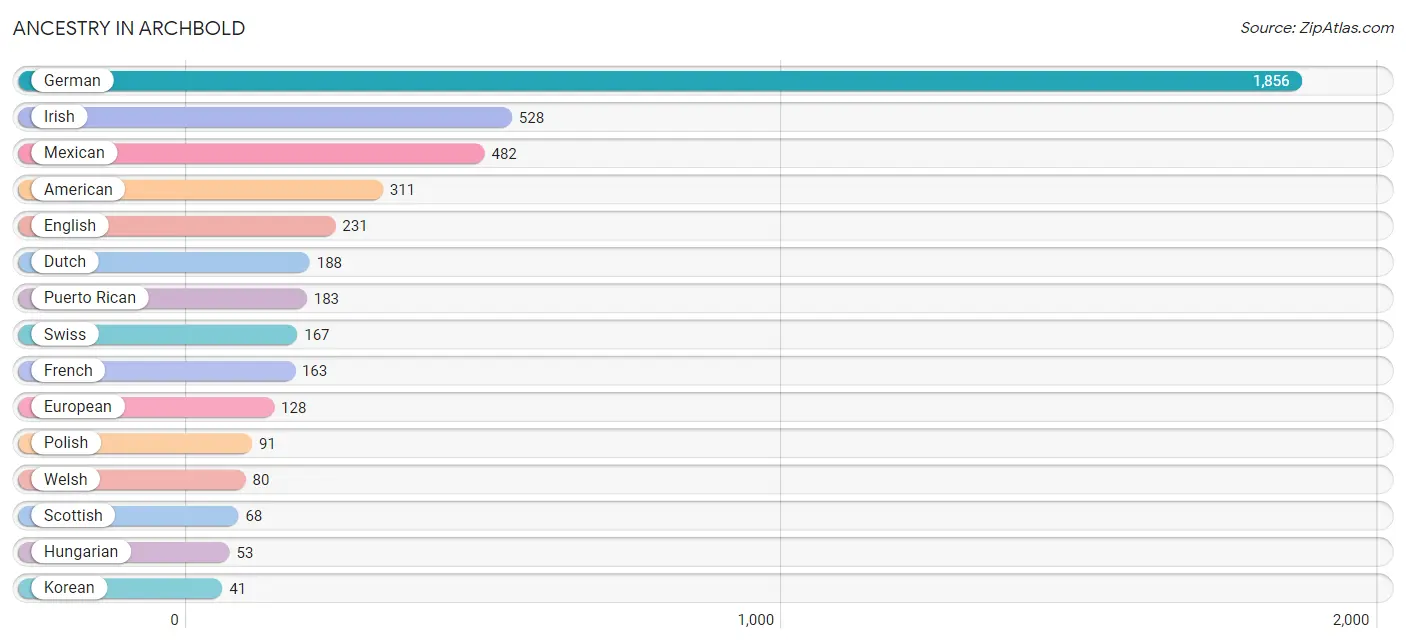
| Ancestry | # Population | % Population |
| American | 311 | 7.0% |
| British | 12 | 0.3% |
| Cherokee | 6 | 0.1% |
| Colombian | 21 | 0.5% |
| Czech | 9 | 0.2% |
| Dutch | 188 | 4.2% |
| English | 231 | 5.2% |
| Estonian | 9 | 0.2% |
| European | 128 | 2.9% |
| French | 163 | 3.7% |
| German | 1,856 | 41.8% |
| Haitian | 1 | 0.0% |
| Hungarian | 53 | 1.2% |
| Irish | 528 | 11.9% |
| Italian | 33 | 0.7% |
| Korean | 41 | 0.9% |
| Mexican | 482 | 10.9% |
| Polish | 91 | 2.1% |
| Puerto Rican | 183 | 4.1% |
| Romanian | 7 | 0.2% |
| Samoan | 7 | 0.2% |
| Scotch-Irish | 7 | 0.2% |
| Scottish | 68 | 1.5% |
| Slovene | 11 | 0.3% |
| South American | 21 | 0.5% |
| Spanish | 34 | 0.8% |
| Swedish | 10 | 0.2% |
| Swiss | 167 | 3.8% |
| Welsh | 80 | 1.8% | View All 29 Rows |
Immigrants in Archbold
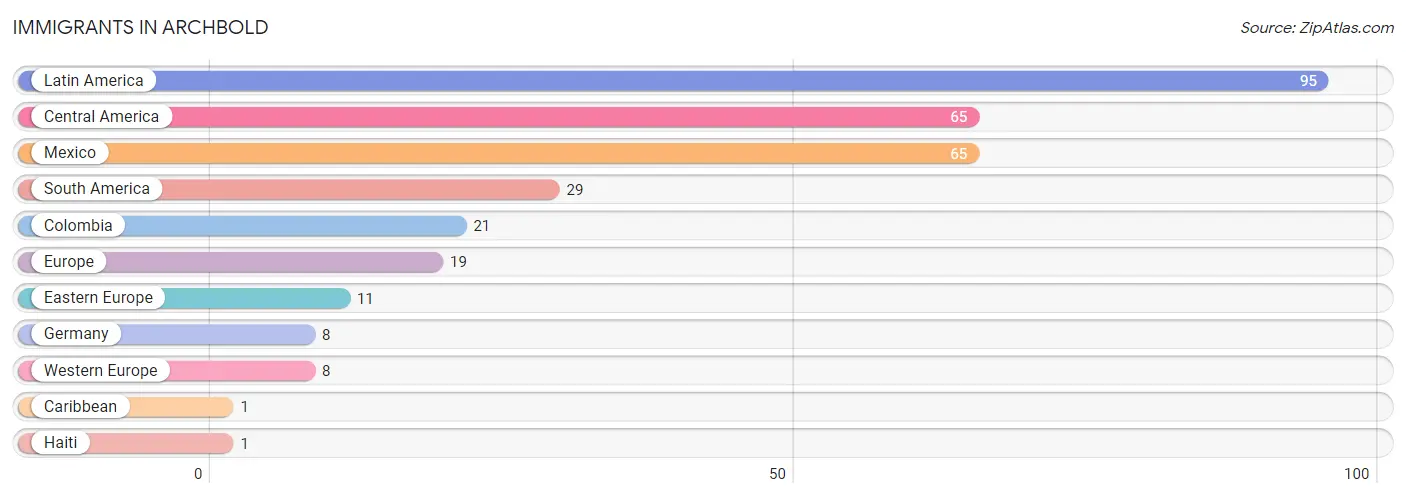
The most numerous immigrant groups reported in Archbold came from Latin America (95 | 2.1%), Central America (65 | 1.5%), Mexico (65 | 1.5%), South America (29 | 0.6%), and Colombia (21 | 0.5%), together accounting for 6.2% of all Archbold residents.
| Immigration Origin | # Population | % Population |
| Caribbean | 1 | 0.0% |
| Central America | 65 | 1.5% |
| Colombia | 21 | 0.5% |
| Eastern Europe | 11 | 0.3% |
| Europe | 19 | 0.4% |
| Germany | 8 | 0.2% |
| Haiti | 1 | 0.0% |
| Latin America | 95 | 2.1% |
| Mexico | 65 | 1.5% |
| South America | 29 | 0.6% |
| Western Europe | 8 | 0.2% | View All 11 Rows |
Sex and Age in Archbold
Sex and Age in Archbold
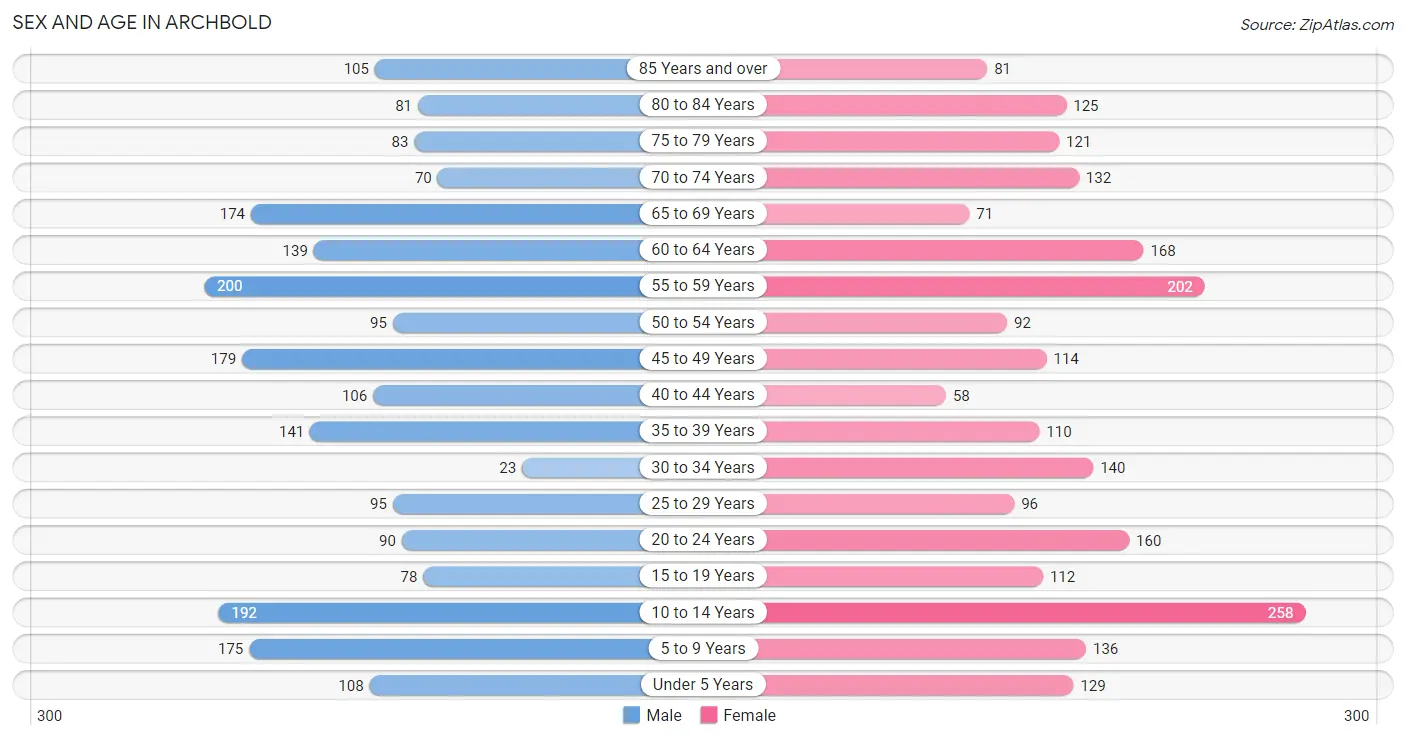
The most populous age groups in Archbold are 55 to 59 Years (200 | 9.4%) for men and 10 to 14 Years (258 | 11.2%) for women.
| Age Bracket | Male | Female |
| Under 5 Years | 108 (5.1%) | 129 (5.6%) |
| 5 to 9 Years | 175 (8.2%) | 136 (5.9%) |
| 10 to 14 Years | 192 (9.0%) | 258 (11.2%) |
| 15 to 19 Years | 78 (3.7%) | 112 (4.9%) |
| 20 to 24 Years | 90 (4.2%) | 160 (6.9%) |
| 25 to 29 Years | 95 (4.4%) | 96 (4.2%) |
| 30 to 34 Years | 23 (1.1%) | 140 (6.1%) |
| 35 to 39 Years | 141 (6.6%) | 110 (4.8%) |
| 40 to 44 Years | 106 (5.0%) | 58 (2.5%) |
| 45 to 49 Years | 179 (8.4%) | 114 (5.0%) |
| 50 to 54 Years | 95 (4.4%) | 92 (4.0%) |
| 55 to 59 Years | 200 (9.4%) | 202 (8.8%) |
| 60 to 64 Years | 139 (6.5%) | 168 (7.3%) |
| 65 to 69 Years | 174 (8.2%) | 71 (3.1%) |
| 70 to 74 Years | 70 (3.3%) | 132 (5.7%) |
| 75 to 79 Years | 83 (3.9%) | 121 (5.2%) |
| 80 to 84 Years | 81 (3.8%) | 125 (5.4%) |
| 85 Years and over | 105 (4.9%) | 81 (3.5%) |
| Total | 2,134 (100.0%) | 2,305 (100.0%) |
Families and Households in Archbold
Median Family Size in Archbold
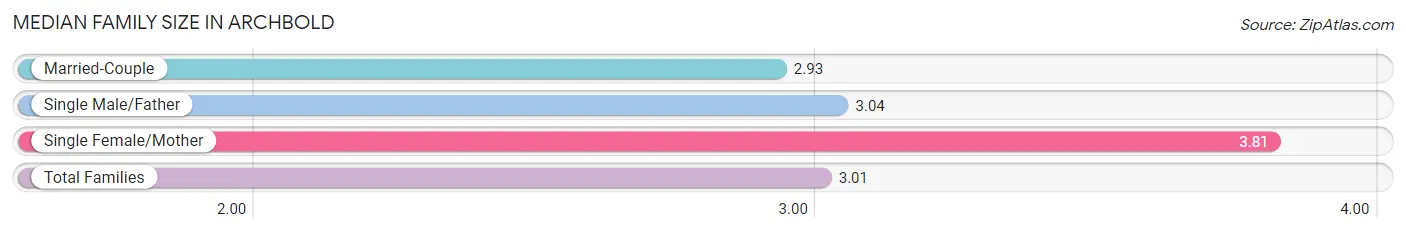
The median family size in Archbold is 3.01 persons per family, with single female/mother families (110 | 9.2%) accounting for the largest median family size of 3.81 persons per family. On the other hand, married-couple families (1,044 | 86.9%) represent the smallest median family size with 2.93 persons per family.
| Family Type | # Families | Family Size |
| Married-Couple | 1,044 (86.9%) | 2.93 |
| Single Male/Father | 47 (3.9%) | 3.04 |
| Single Female/Mother | 110 (9.2%) | 3.81 |
| Total Families | 1,201 (100.0%) | 3.01 |
Median Household Size in Archbold
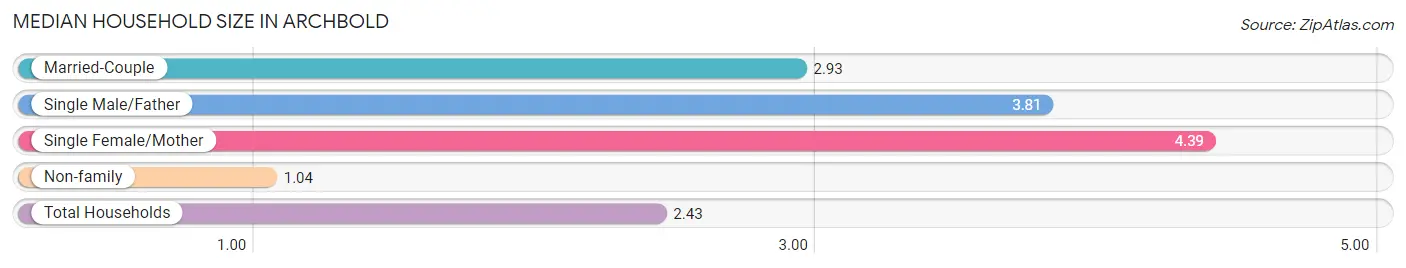
The median household size in Archbold is 2.43 persons per household, with single female/mother households (110 | 6.2%) accounting for the largest median household size of 4.39 persons per household. non-family households (572 | 32.3%) represent the smallest median household size with 1.04 persons per household.
| Household Type | # Households | Household Size |
| Married-Couple | 1,044 (58.9%) | 2.93 |
| Single Male/Father | 47 (2.6%) | 3.81 |
| Single Female/Mother | 110 (6.2%) | 4.39 |
| Non-family | 572 (32.3%) | 1.04 |
| Total Households | 1,773 (100.0%) | 2.43 |
Household Size by Marriage Status in Archbold
Out of a total of 1,773 households in Archbold, 1,201 (67.7%) are family households, while 572 (32.3%) are nonfamily households. The most numerous type of family households are 2-person households, comprising 678, and the most common type of nonfamily households are 1-person households, comprising 549.
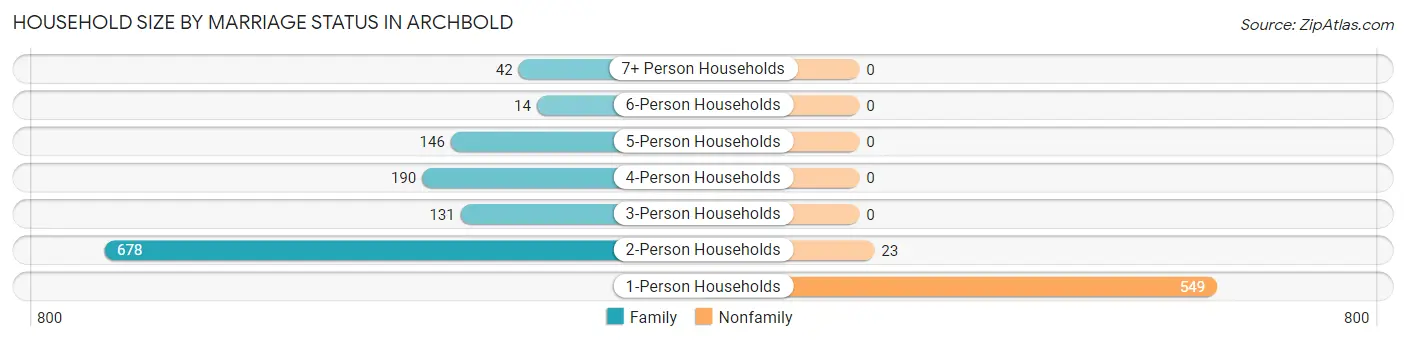
| Household Size | Family Households | Nonfamily Households |
| 1-Person Households | - | 549 (31.0%) |
| 2-Person Households | 678 (38.2%) | 23 (1.3%) |
| 3-Person Households | 131 (7.4%) | 0 (0.0%) |
| 4-Person Households | 190 (10.7%) | 0 (0.0%) |
| 5-Person Households | 146 (8.2%) | 0 (0.0%) |
| 6-Person Households | 14 (0.8%) | 0 (0.0%) |
| 7+ Person Households | 42 (2.4%) | 0 (0.0%) |
| Total | 1,201 (67.7%) | 572 (32.3%) |
Female Fertility in Archbold
Fertility by Age in Archbold
Average fertility rate in Archbold is 19.0 births per 1,000 women. Women in the age bracket of 20 to 34 years have the highest fertility rate with 40.0 births per 1,000 women. Women in the age bracket of 20 to 34 years acount for 100.0% of all women with births.
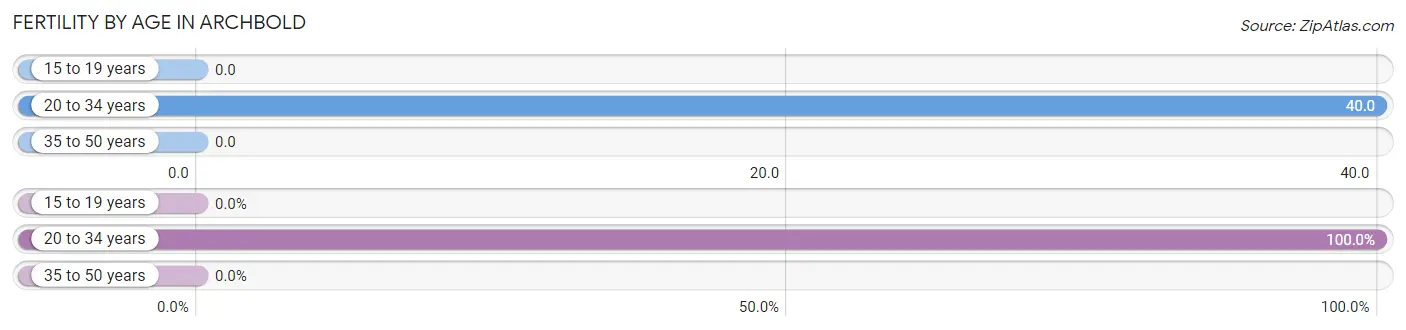
| Age Bracket | Women with Births | Births / 1,000 Women |
| 15 to 19 years | 0 (0.0%) | 0.0 |
| 20 to 34 years | 16 (100.0%) | 40.0 |
| 35 to 50 years | 0 (0.0%) | 0.0 |
| Total | 16 (100.0%) | 19.0 |
Fertility by Age by Marriage Status in Archbold
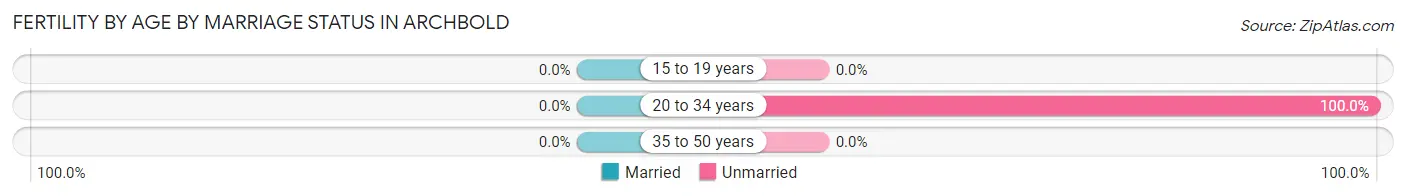
| Age Bracket | Married | Unmarried |
| 15 to 19 years | 0 (0.0%) | 0 (0.0%) |
| 20 to 34 years | 0 (0.0%) | 16 (100.0%) |
| 35 to 50 years | 0 (0.0%) | 0 (0.0%) |
| Total | 0 (0.0%) | 16 (100.0%) |
Fertility by Education in Archbold
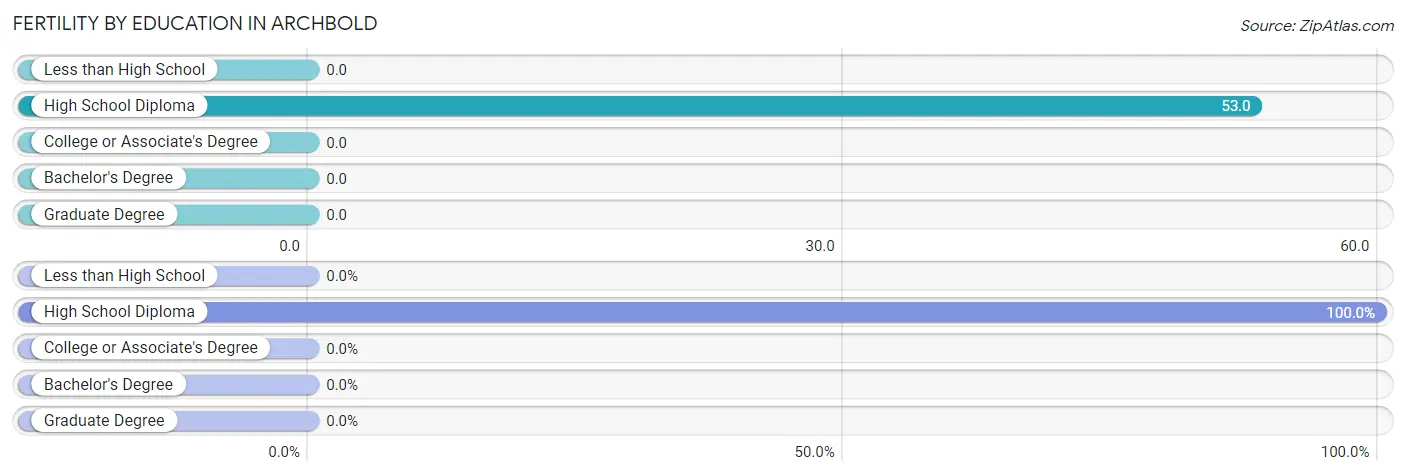
| Educational Attainment | Women with Births | Births / 1,000 Women |
| Less than High School | 0 (0.0%) | 0.0 |
| High School Diploma | 16 (100.0%) | 53.0 |
| College or Associate's Degree | 0 (0.0%) | 0.0 |
| Bachelor's Degree | 0 (0.0%) | 0.0 |
| Graduate Degree | 0 (0.0%) | 0.0 |
| Total | 16 (100.0%) | 19.0 |
Fertility by Education by Marriage Status in Archbold
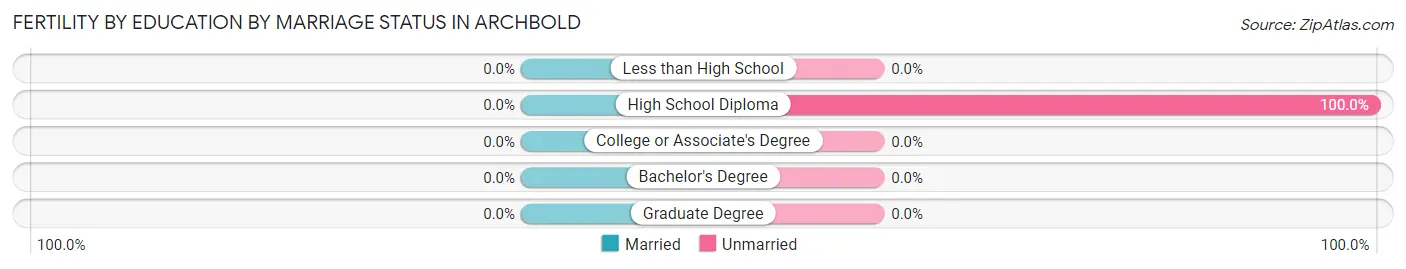
| Educational Attainment | Married | Unmarried |
| Less than High School | 0 (0.0%) | 0 (0.0%) |
| High School Diploma | 0 (0.0%) | 16 (100.0%) |
| College or Associate's Degree | 0 (0.0%) | 0 (0.0%) |
| Bachelor's Degree | 0 (0.0%) | 0 (0.0%) |
| Graduate Degree | 0 (0.0%) | 0 (0.0%) |
| Total | 0 (0.0%) | 16 (100.0%) |
Employment Characteristics in Archbold
Employment by Class of Employer in Archbold
Among the 2,085 employed individuals in Archbold, private company employees (1,398 | 67.0%), local government employees (256 | 12.3%), and not-for-profit organizations (178 | 8.5%) make up the most common classes of employment.
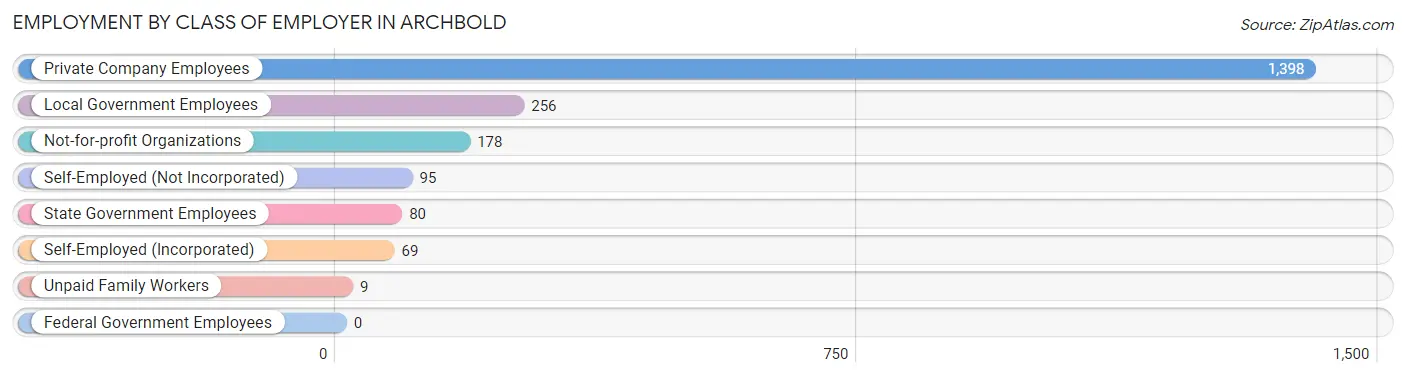
| Employer Class | # Employees | % Employees |
| Private Company Employees | 1,398 | 67.0% |
| Self-Employed (Incorporated) | 69 | 3.3% |
| Self-Employed (Not Incorporated) | 95 | 4.6% |
| Not-for-profit Organizations | 178 | 8.5% |
| Local Government Employees | 256 | 12.3% |
| State Government Employees | 80 | 3.8% |
| Federal Government Employees | 0 | 0.0% |
| Unpaid Family Workers | 9 | 0.4% |
| Total | 2,085 | 100.0% |
Employment Status by Age in Archbold
According to the labor force statistics for Archbold, out of the total population over 16 years of age (3,434), 65.0% or 2,232 individuals are in the labor force, with 5.6% or 125 of them unemployed. The age group with the highest labor force participation rate is 35 to 44 years, with 98.1% or 407 individuals in the labor force. Within the labor force, the 16 to 19 years age range has the highest percentage of unemployed individuals, with 24.5% or 23 of them being unemployed.
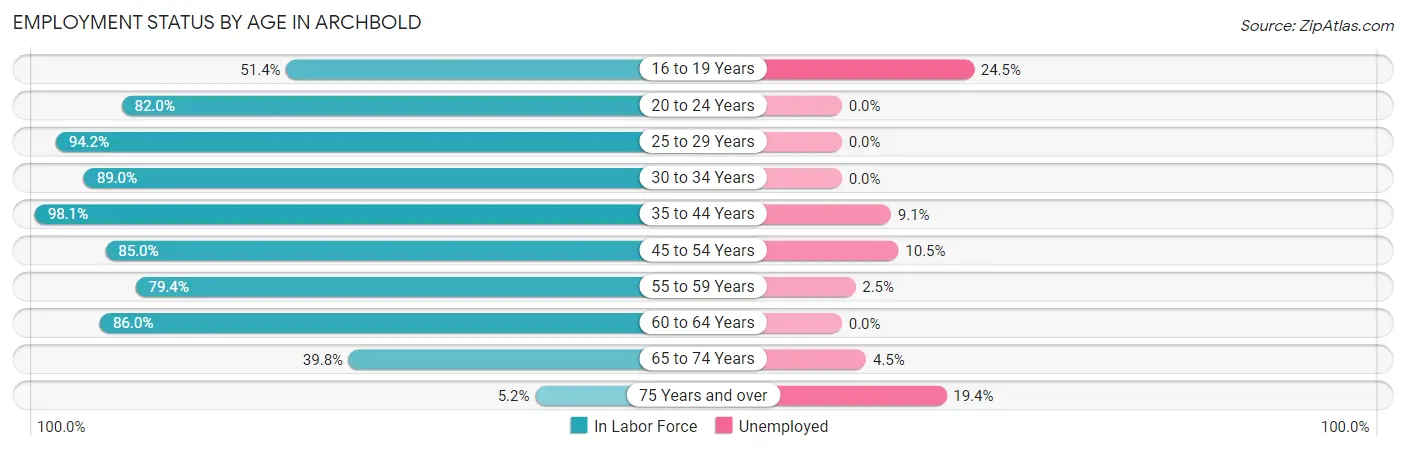
| Age Bracket | In Labor Force | Unemployed |
| 16 to 19 Years | 94 (51.4%) | 23 (24.5%) |
| 20 to 24 Years | 205 (82.0%) | 0 (0.0%) |
| 25 to 29 Years | 180 (94.2%) | 0 (0.0%) |
| 30 to 34 Years | 145 (89.0%) | 0 (0.0%) |
| 35 to 44 Years | 407 (98.1%) | 37 (9.1%) |
| 45 to 54 Years | 408 (85.0%) | 43 (10.5%) |
| 55 to 59 Years | 319 (79.4%) | 8 (2.5%) |
| 60 to 64 Years | 264 (86.0%) | 0 (0.0%) |
| 65 to 74 Years | 178 (39.8%) | 8 (4.5%) |
| 75 Years and over | 31 (5.2%) | 6 (19.4%) |
| Total | 2,232 (65.0%) | 125 (5.6%) |
Employment Status by Educational Attainment in Archbold
According to labor force statistics for Archbold, 88.0% of individuals (1,723) out of the total population between 25 and 64 years of age (1,958) are in the labor force, with 5.1% or 88 of them being unemployed. The group with the highest labor force participation rate are those with the educational attainment of bachelor's degree or higher, with 90.0% or 442 individuals in the labor force. Within the labor force, individuals with less than high school education have the highest percentage of unemployment, with 38.9% or 37 of them being unemployed.
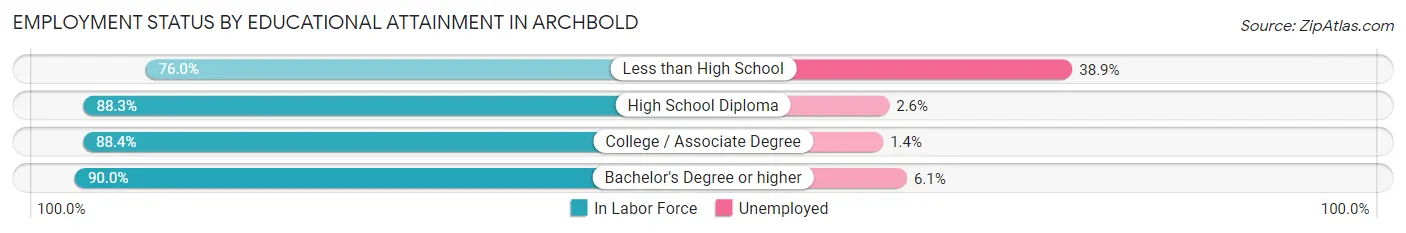
| Educational Attainment | In Labor Force | Unemployed |
| Less than High School | 95 (76.0%) | 49 (38.9%) |
| High School Diploma | 606 (88.3%) | 18 (2.6%) |
| College / Associate Degree | 580 (88.4%) | 9 (1.4%) |
| Bachelor's Degree or higher | 442 (90.0%) | 30 (6.1%) |
| Total | 1,723 (88.0%) | 100 (5.1%) |
Employment Occupations by Sex in Archbold
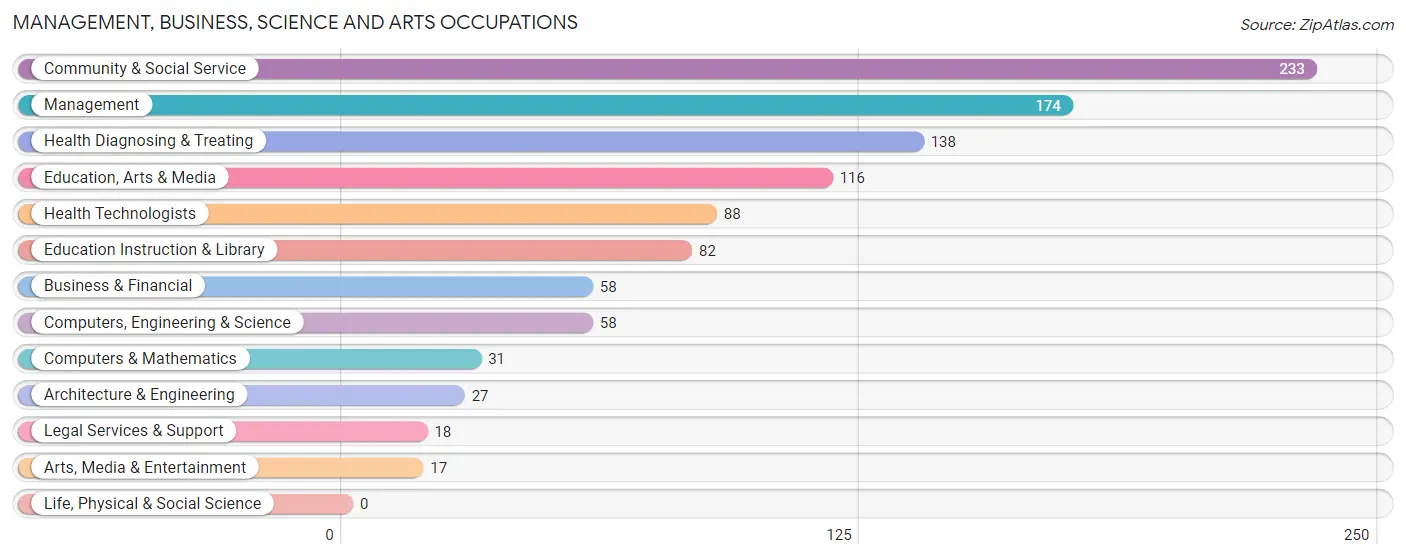
Management, Business, Science and Arts Occupations
The most common Management, Business, Science and Arts occupations in Archbold are Community & Social Service (233 | 11.1%), Management (174 | 8.3%), Health Diagnosing & Treating (138 | 6.6%), Education, Arts & Media (116 | 5.5%), and Health Technologists (88 | 4.2%).
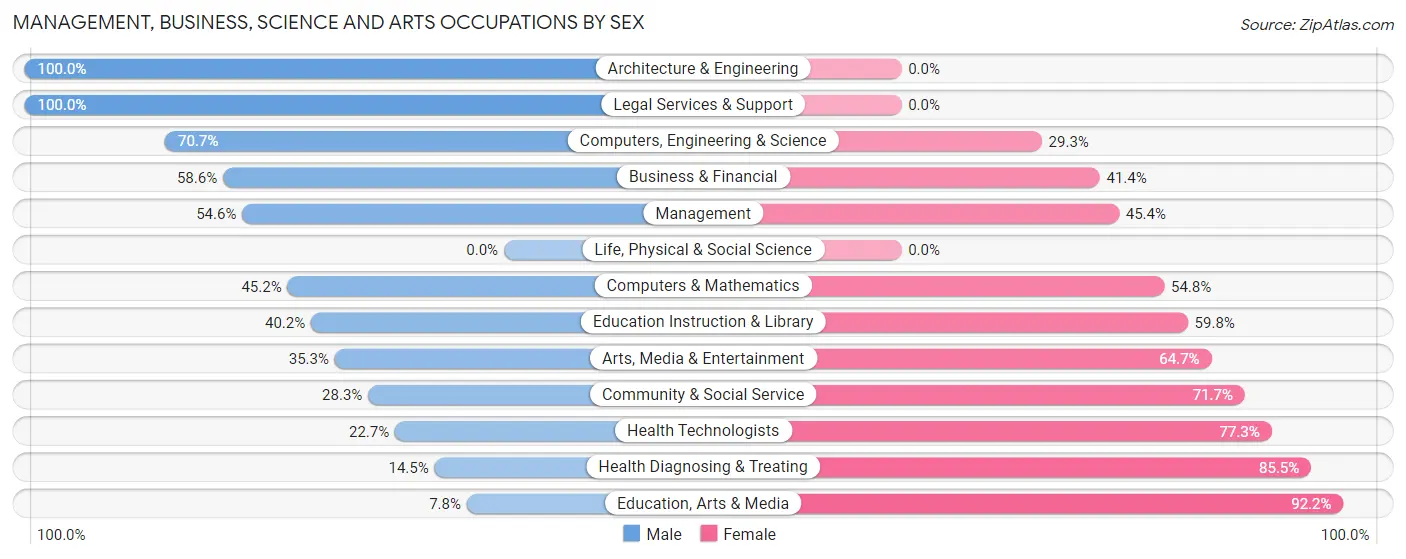
Management, Business, Science and Arts Occupations by Sex
Within the Management, Business, Science and Arts occupations in Archbold, the most male-oriented occupations are Architecture & Engineering (100.0%), Legal Services & Support (100.0%), and Computers, Engineering & Science (70.7%), while the most female-oriented occupations are Education, Arts & Media (92.2%), Health Diagnosing & Treating (85.5%), and Health Technologists (77.3%).
| Occupation | Male | Female |
| Management | 95 (54.6%) | 79 (45.4%) |
| Business & Financial | 34 (58.6%) | 24 (41.4%) |
| Computers, Engineering & Science | 41 (70.7%) | 17 (29.3%) |
| Computers & Mathematics | 14 (45.2%) | 17 (54.8%) |
| Architecture & Engineering | 27 (100.0%) | 0 (0.0%) |
| Life, Physical & Social Science | 0 (0.0%) | 0 (0.0%) |
| Community & Social Service | 66 (28.3%) | 167 (71.7%) |
| Education, Arts & Media | 9 (7.8%) | 107 (92.2%) |
| Legal Services & Support | 18 (100.0%) | 0 (0.0%) |
| Education Instruction & Library | 33 (40.2%) | 49 (59.8%) |
| Arts, Media & Entertainment | 6 (35.3%) | 11 (64.7%) |
| Health Diagnosing & Treating | 20 (14.5%) | 118 (85.5%) |
| Health Technologists | 20 (22.7%) | 68 (77.3%) |
| Total (Category) | 256 (38.7%) | 405 (61.3%) |
| Total (Overall) | 1,085 (51.5%) | 1,021 (48.5%) |
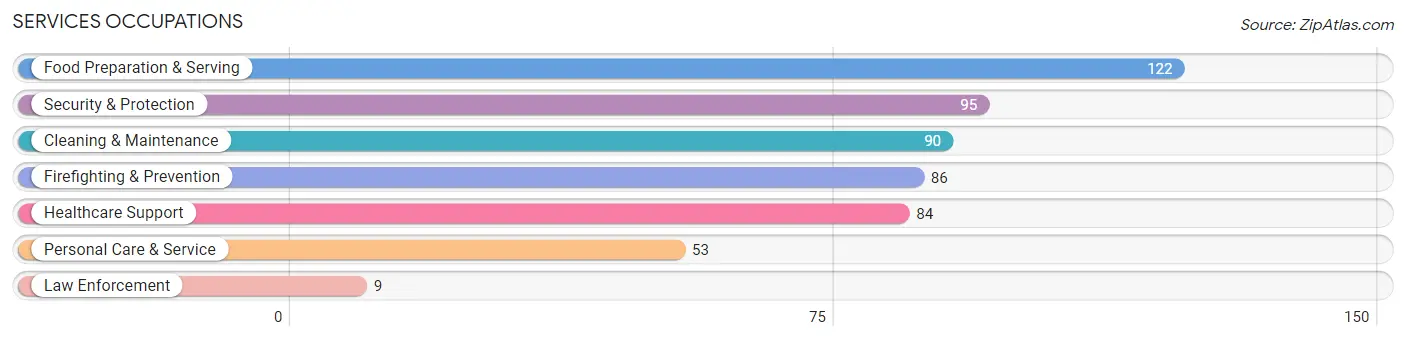
Services Occupations
The most common Services occupations in Archbold are Food Preparation & Serving (122 | 5.8%), Security & Protection (95 | 4.5%), Cleaning & Maintenance (90 | 4.3%), Firefighting & Prevention (86 | 4.1%), and Healthcare Support (84 | 4.0%).
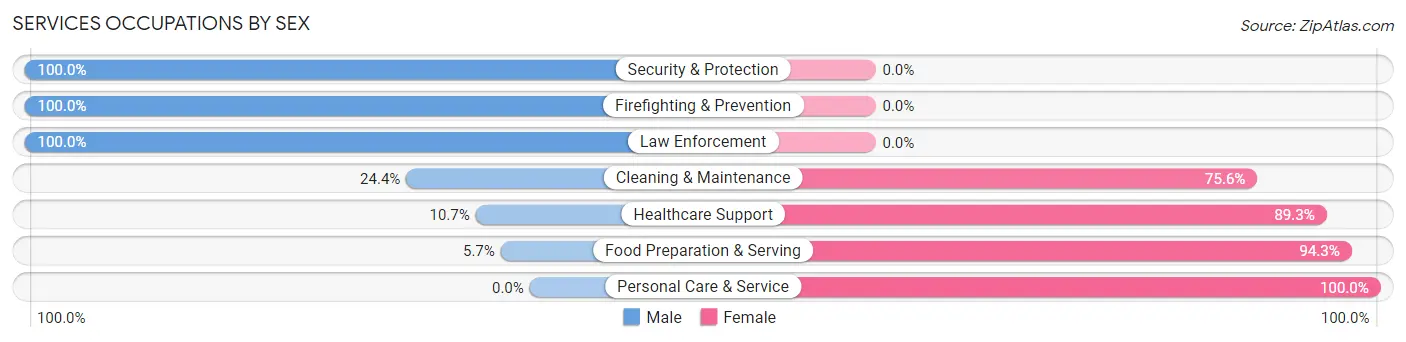
Services Occupations by Sex
Within the Services occupations in Archbold, the most male-oriented occupations are Security & Protection (100.0%), Firefighting & Prevention (100.0%), and Law Enforcement (100.0%), while the most female-oriented occupations are Personal Care & Service (100.0%), Food Preparation & Serving (94.3%), and Healthcare Support (89.3%).
| Occupation | Male | Female |
| Healthcare Support | 9 (10.7%) | 75 (89.3%) |
| Security & Protection | 95 (100.0%) | 0 (0.0%) |
| Firefighting & Prevention | 86 (100.0%) | 0 (0.0%) |
| Law Enforcement | 9 (100.0%) | 0 (0.0%) |
| Food Preparation & Serving | 7 (5.7%) | 115 (94.3%) |
| Cleaning & Maintenance | 22 (24.4%) | 68 (75.6%) |
| Personal Care & Service | 0 (0.0%) | 53 (100.0%) |
| Total (Category) | 133 (29.9%) | 311 (70.1%) |
| Total (Overall) | 1,085 (51.5%) | 1,021 (48.5%) |
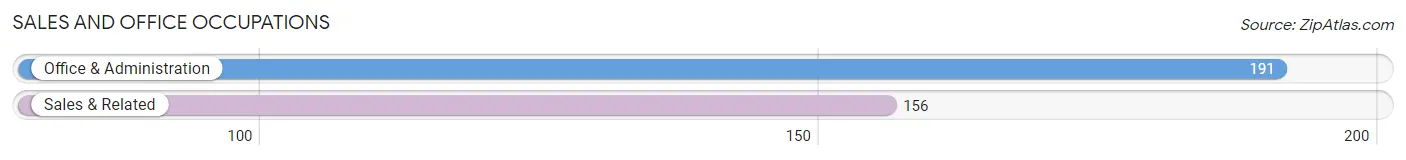
Sales and Office Occupations
The most common Sales and Office occupations in Archbold are Office & Administration (191 | 9.1%), and Sales & Related (156 | 7.4%).
Sales and Office Occupations by Sex
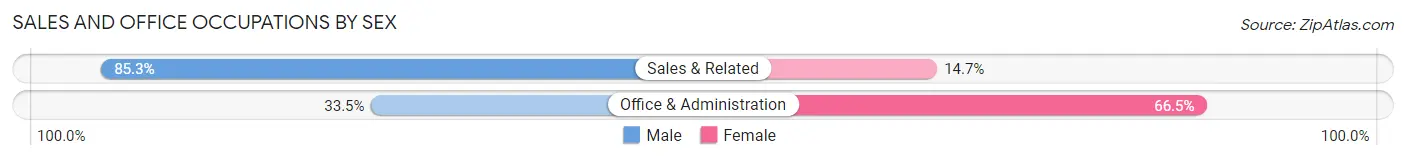
| Occupation | Male | Female |
| Sales & Related | 133 (85.3%) | 23 (14.7%) |
| Office & Administration | 64 (33.5%) | 127 (66.5%) |
| Total (Category) | 197 (56.8%) | 150 (43.2%) |
| Total (Overall) | 1,085 (51.5%) | 1,021 (48.5%) |
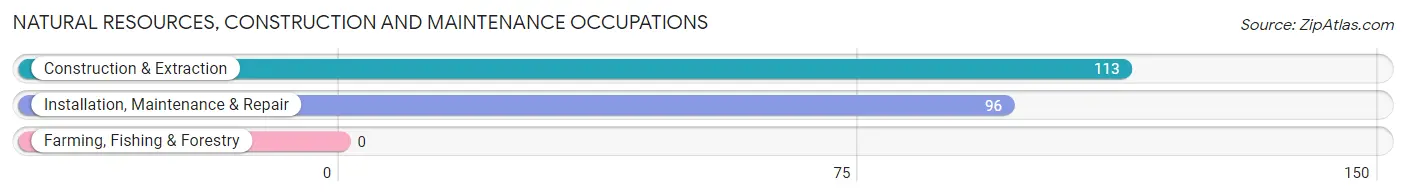
Natural Resources, Construction and Maintenance Occupations
The most common Natural Resources, Construction and Maintenance occupations in Archbold are Construction & Extraction (113 | 5.4%), and Installation, Maintenance & Repair (96 | 4.6%).
Natural Resources, Construction and Maintenance Occupations by Sex
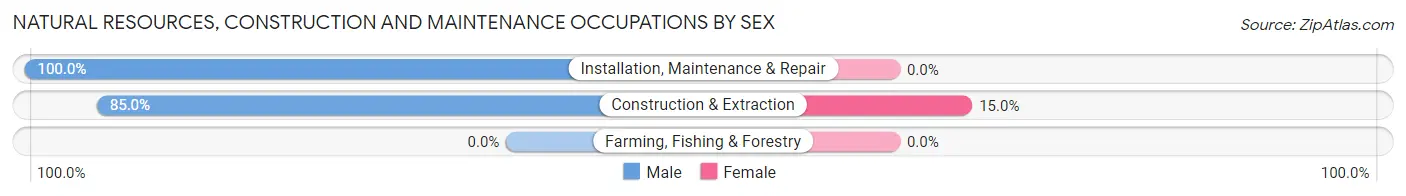
| Occupation | Male | Female |
| Farming, Fishing & Forestry | 0 (0.0%) | 0 (0.0%) |
| Construction & Extraction | 96 (85.0%) | 17 (15.0%) |
| Installation, Maintenance & Repair | 96 (100.0%) | 0 (0.0%) |
| Total (Category) | 192 (91.9%) | 17 (8.1%) |
| Total (Overall) | 1,085 (51.5%) | 1,021 (48.5%) |
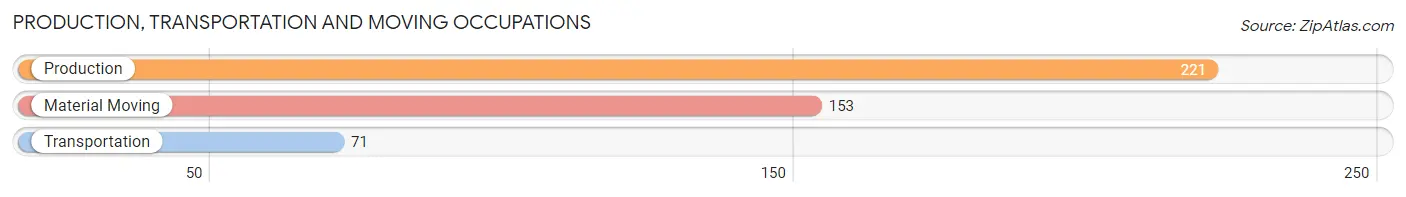
Production, Transportation and Moving Occupations
The most common Production, Transportation and Moving occupations in Archbold are Production (221 | 10.5%), Material Moving (153 | 7.3%), and Transportation (71 | 3.4%).
Production, Transportation and Moving Occupations by Sex
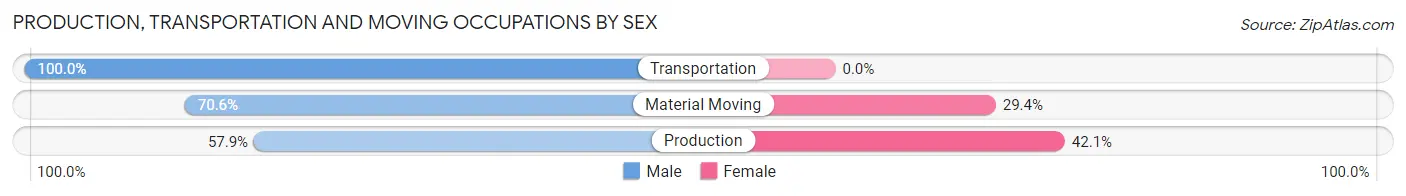
| Occupation | Male | Female |
| Production | 128 (57.9%) | 93 (42.1%) |
| Transportation | 71 (100.0%) | 0 (0.0%) |
| Material Moving | 108 (70.6%) | 45 (29.4%) |
| Total (Category) | 307 (69.0%) | 138 (31.0%) |
| Total (Overall) | 1,085 (51.5%) | 1,021 (48.5%) |
Employment Industries by Sex in Archbold
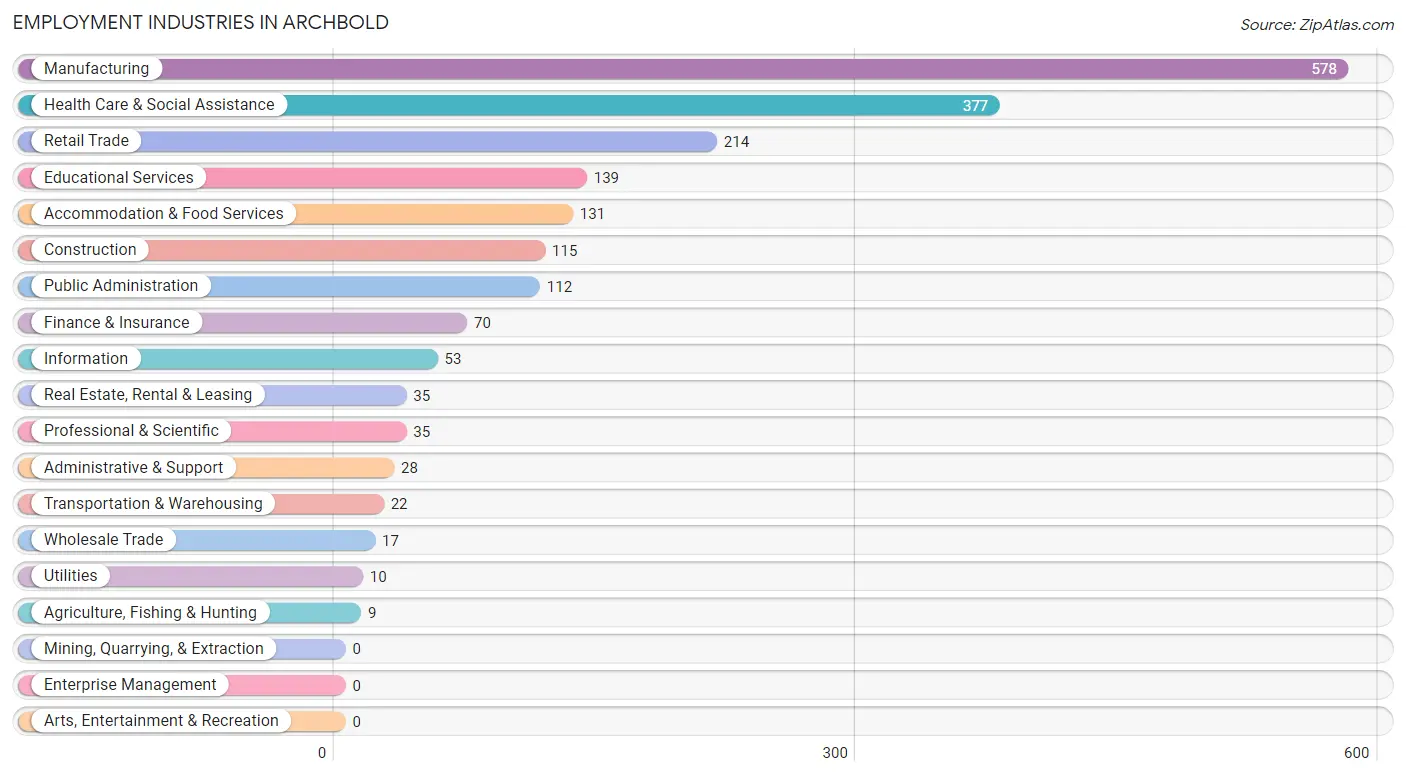
Employment Industries in Archbold
The major employment industries in Archbold include Manufacturing (578 | 27.5%), Health Care & Social Assistance (377 | 17.9%), Retail Trade (214 | 10.2%), Educational Services (139 | 6.6%), and Accommodation & Food Services (131 | 6.2%).
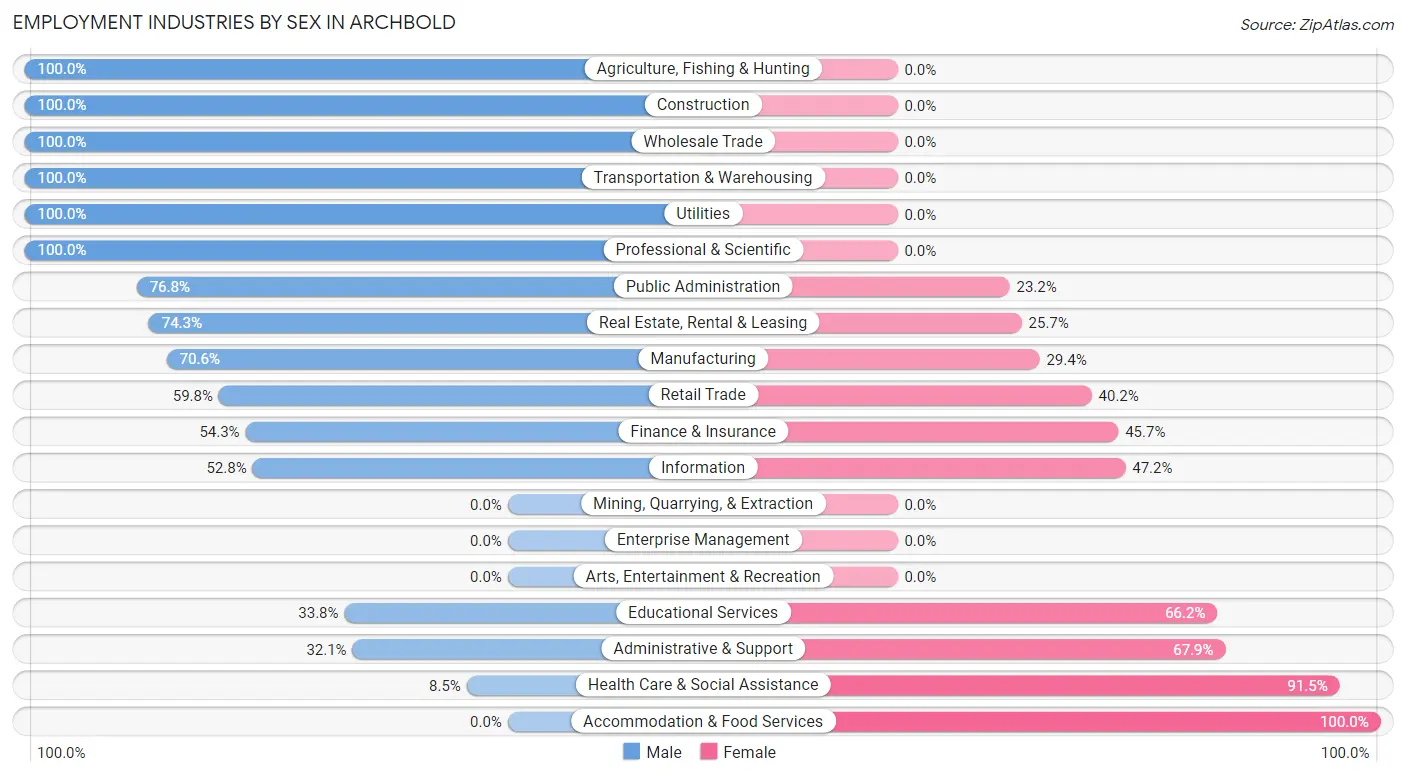
Employment Industries by Sex in Archbold
The Archbold industries that see more men than women are Agriculture, Fishing & Hunting (100.0%), Construction (100.0%), and Wholesale Trade (100.0%), whereas the industries that tend to have a higher number of women are Accommodation & Food Services (100.0%), Health Care & Social Assistance (91.5%), and Administrative & Support (67.9%).
| Industry | Male | Female |
| Agriculture, Fishing & Hunting | 9 (100.0%) | 0 (0.0%) |
| Mining, Quarrying, & Extraction | 0 (0.0%) | 0 (0.0%) |
| Construction | 115 (100.0%) | 0 (0.0%) |
| Manufacturing | 408 (70.6%) | 170 (29.4%) |
| Wholesale Trade | 17 (100.0%) | 0 (0.0%) |
| Retail Trade | 128 (59.8%) | 86 (40.2%) |
| Transportation & Warehousing | 22 (100.0%) | 0 (0.0%) |
| Utilities | 10 (100.0%) | 0 (0.0%) |
| Information | 28 (52.8%) | 25 (47.2%) |
| Finance & Insurance | 38 (54.3%) | 32 (45.7%) |
| Real Estate, Rental & Leasing | 26 (74.3%) | 9 (25.7%) |
| Professional & Scientific | 35 (100.0%) | 0 (0.0%) |
| Enterprise Management | 0 (0.0%) | 0 (0.0%) |
| Administrative & Support | 9 (32.1%) | 19 (67.9%) |
| Educational Services | 47 (33.8%) | 92 (66.2%) |
| Health Care & Social Assistance | 32 (8.5%) | 345 (91.5%) |
| Arts, Entertainment & Recreation | 0 (0.0%) | 0 (0.0%) |
| Accommodation & Food Services | 0 (0.0%) | 131 (100.0%) |
| Public Administration | 86 (76.8%) | 26 (23.2%) |
| Total | 1,085 (51.5%) | 1,021 (48.5%) |
Education in Archbold
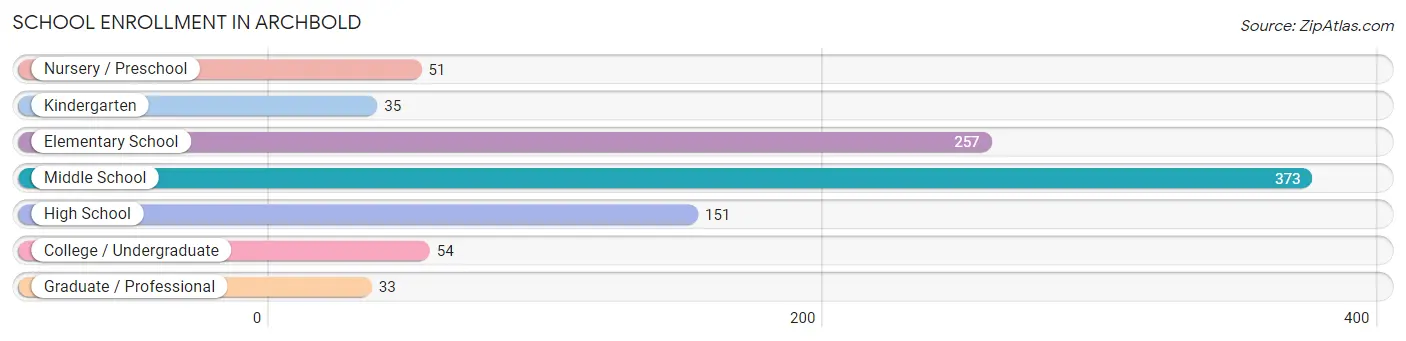
School Enrollment in Archbold
The most common levels of schooling among the 954 students in Archbold are middle school (373 | 39.1%), elementary school (257 | 26.9%), and high school (151 | 15.8%).
| School Level | # Students | % Students |
| Nursery / Preschool | 51 | 5.3% |
| Kindergarten | 35 | 3.7% |
| Elementary School | 257 | 26.9% |
| Middle School | 373 | 39.1% |
| High School | 151 | 15.8% |
| College / Undergraduate | 54 | 5.7% |
| Graduate / Professional | 33 | 3.5% |
| Total | 954 | 100.0% |
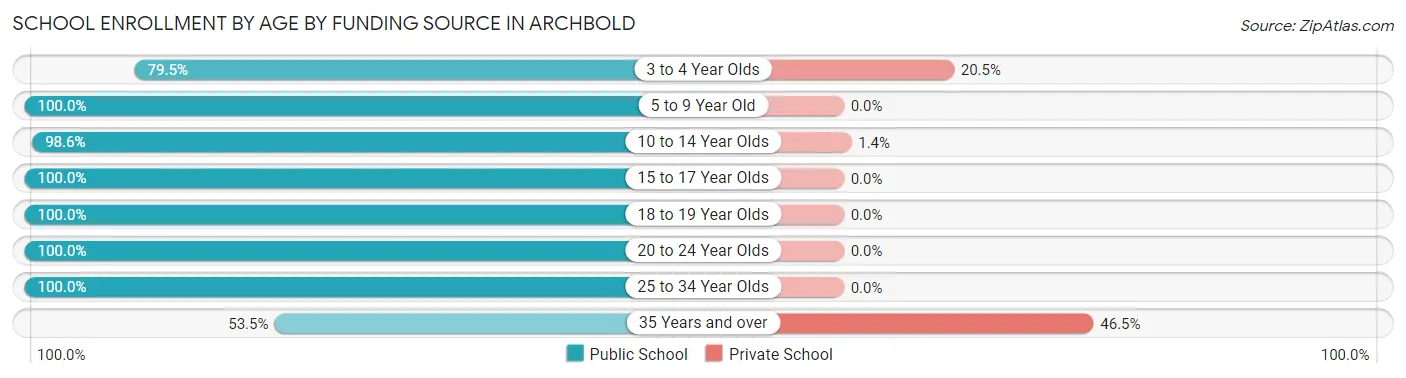
School Enrollment by Age by Funding Source in Archbold
Out of a total of 954 students who are enrolled in schools in Archbold, 34 (3.6%) attend a private institution, while the remaining 920 (96.4%) are enrolled in public schools. The age group of 35 years and over has the highest likelihood of being enrolled in private schools, with 20 (46.5% in the age bracket) enrolled. Conversely, the age group of 5 to 9 year old has the lowest likelihood of being enrolled in a private school, with 264 (100.0% in the age bracket) attending a public institution.
| Age Bracket | Public School | Private School |
| 3 to 4 Year Olds | 31 (79.5%) | 8 (20.5%) |
| 5 to 9 Year Old | 264 (100.0%) | 0 (0.0%) |
| 10 to 14 Year Olds | 417 (98.6%) | 6 (1.4%) |
| 15 to 17 Year Olds | 121 (100.0%) | 0 (0.0%) |
| 18 to 19 Year Olds | 45 (100.0%) | 0 (0.0%) |
| 20 to 24 Year Olds | 8 (100.0%) | 0 (0.0%) |
| 25 to 34 Year Olds | 11 (100.0%) | 0 (0.0%) |
| 35 Years and over | 23 (53.5%) | 20 (46.5%) |
| Total | 920 (96.4%) | 34 (3.6%) |
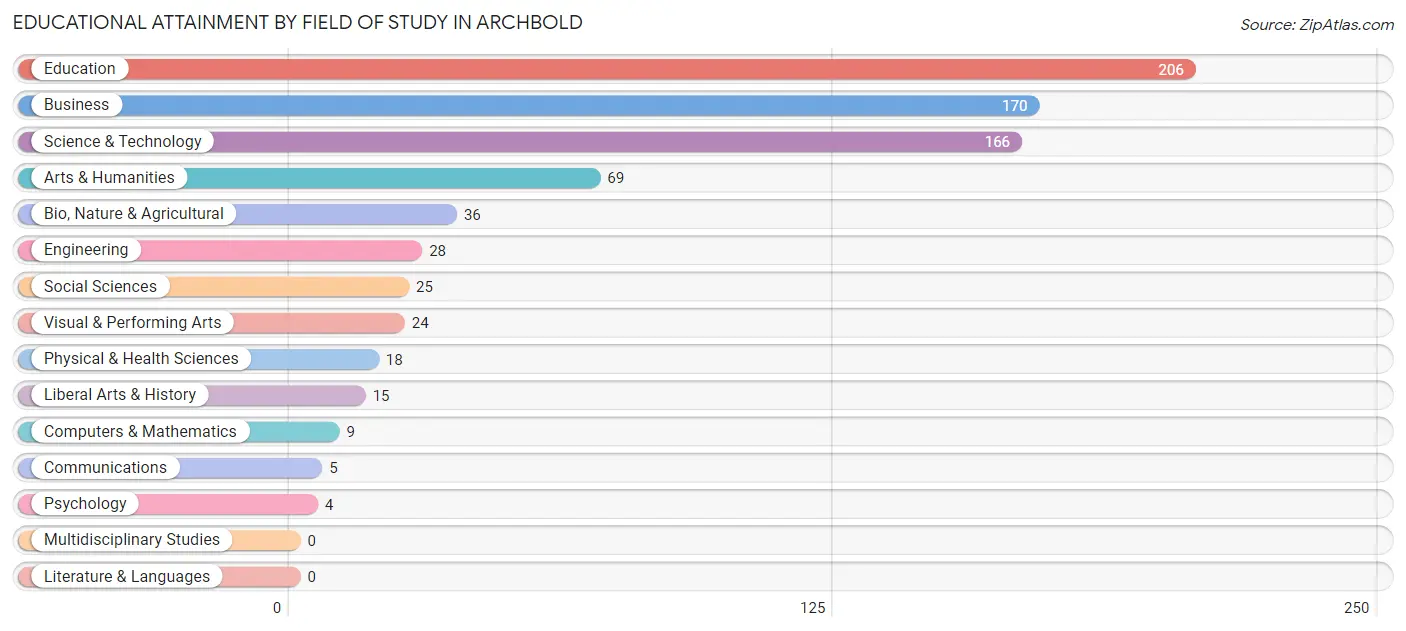
Educational Attainment by Field of Study in Archbold
Education (206 | 26.6%), business (170 | 21.9%), science & technology (166 | 21.4%), arts & humanities (69 | 8.9%), and bio, nature & agricultural (36 | 4.6%) are the most common fields of study among 775 individuals in Archbold who have obtained a bachelor's degree or higher.
| Field of Study | # Graduates | % Graduates |
| Computers & Mathematics | 9 | 1.2% |
| Bio, Nature & Agricultural | 36 | 4.6% |
| Physical & Health Sciences | 18 | 2.3% |
| Psychology | 4 | 0.5% |
| Social Sciences | 25 | 3.2% |
| Engineering | 28 | 3.6% |
| Multidisciplinary Studies | 0 | 0.0% |
| Science & Technology | 166 | 21.4% |
| Business | 170 | 21.9% |
| Education | 206 | 26.6% |
| Literature & Languages | 0 | 0.0% |
| Liberal Arts & History | 15 | 1.9% |
| Visual & Performing Arts | 24 | 3.1% |
| Communications | 5 | 0.6% |
| Arts & Humanities | 69 | 8.9% |
| Total | 775 | 100.0% |
Transportation & Commute in Archbold
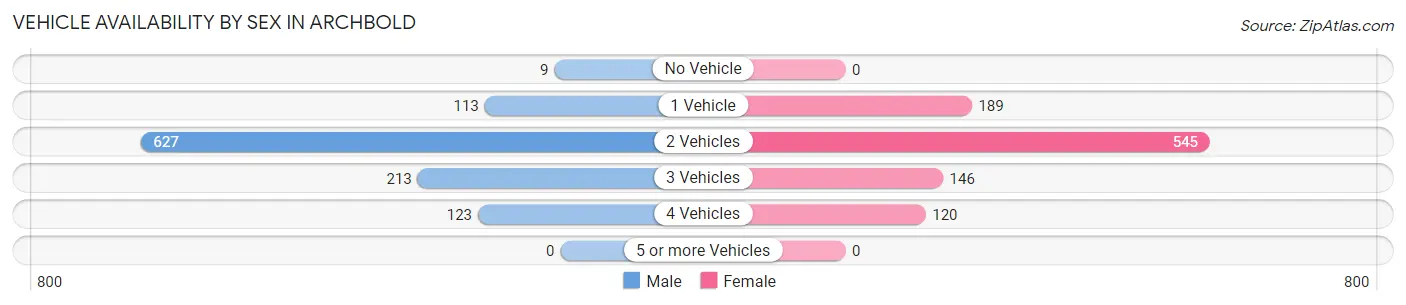
Vehicle Availability by Sex in Archbold
The most prevalent vehicle ownership categories in Archbold are males with 2 vehicles (627, accounting for 57.8%) and females with 2 vehicles (545, making up 62.7%).
| Vehicles Available | Male | Female |
| No Vehicle | 9 (0.8%) | 0 (0.0%) |
| 1 Vehicle | 113 (10.4%) | 189 (18.9%) |
| 2 Vehicles | 627 (57.8%) | 545 (54.5%) |
| 3 Vehicles | 213 (19.6%) | 146 (14.6%) |
| 4 Vehicles | 123 (11.3%) | 120 (12.0%) |
| 5 or more Vehicles | 0 (0.0%) | 0 (0.0%) |
| Total | 1,085 (100.0%) | 1,000 (100.0%) |
Commute Time in Archbold
The most frequently occuring commute durations in Archbold are 5 to 9 minutes (721 commuters, 36.4%), less than 5 minutes (395 commuters, 19.9%), and 30 to 34 minutes (169 commuters, 8.5%).
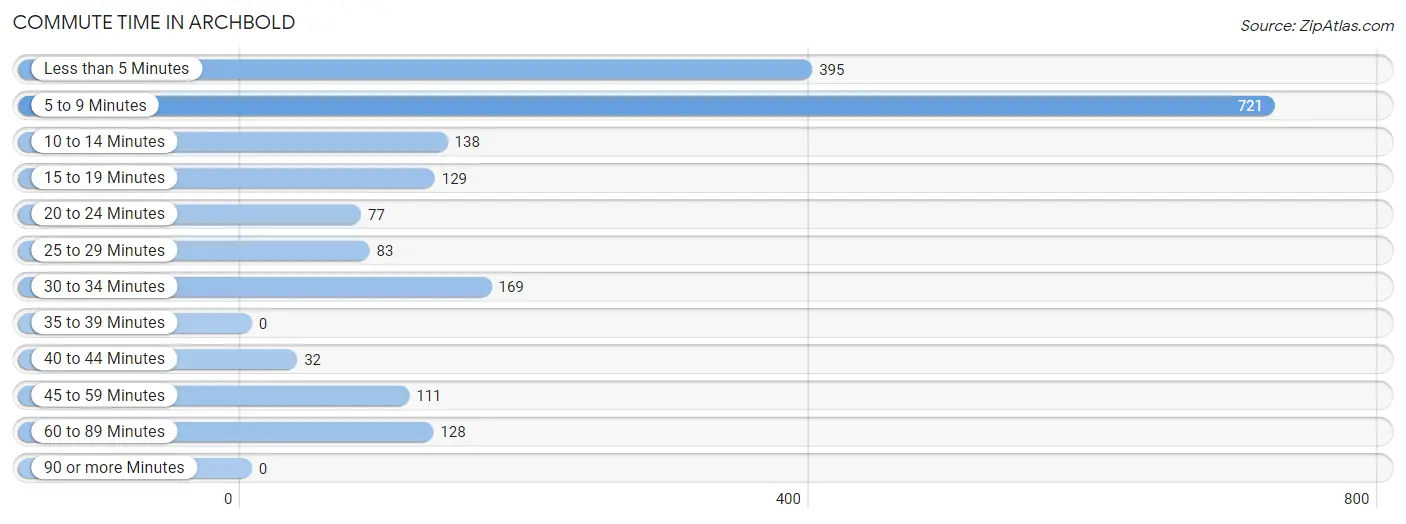
| Commute Time | # Commuters | % Commuters |
| Less than 5 Minutes | 395 | 19.9% |
| 5 to 9 Minutes | 721 | 36.4% |
| 10 to 14 Minutes | 138 | 7.0% |
| 15 to 19 Minutes | 129 | 6.5% |
| 20 to 24 Minutes | 77 | 3.9% |
| 25 to 29 Minutes | 83 | 4.2% |
| 30 to 34 Minutes | 169 | 8.5% |
| 35 to 39 Minutes | 0 | 0.0% |
| 40 to 44 Minutes | 32 | 1.6% |
| 45 to 59 Minutes | 111 | 5.6% |
| 60 to 89 Minutes | 128 | 6.5% |
| 90 or more Minutes | 0 | 0.0% |
Commute Time by Sex in Archbold
The most common commute times in Archbold are 5 to 9 minutes (417 commuters, 40.4%) for males and 5 to 9 minutes (304 commuters, 32.0%) for females.
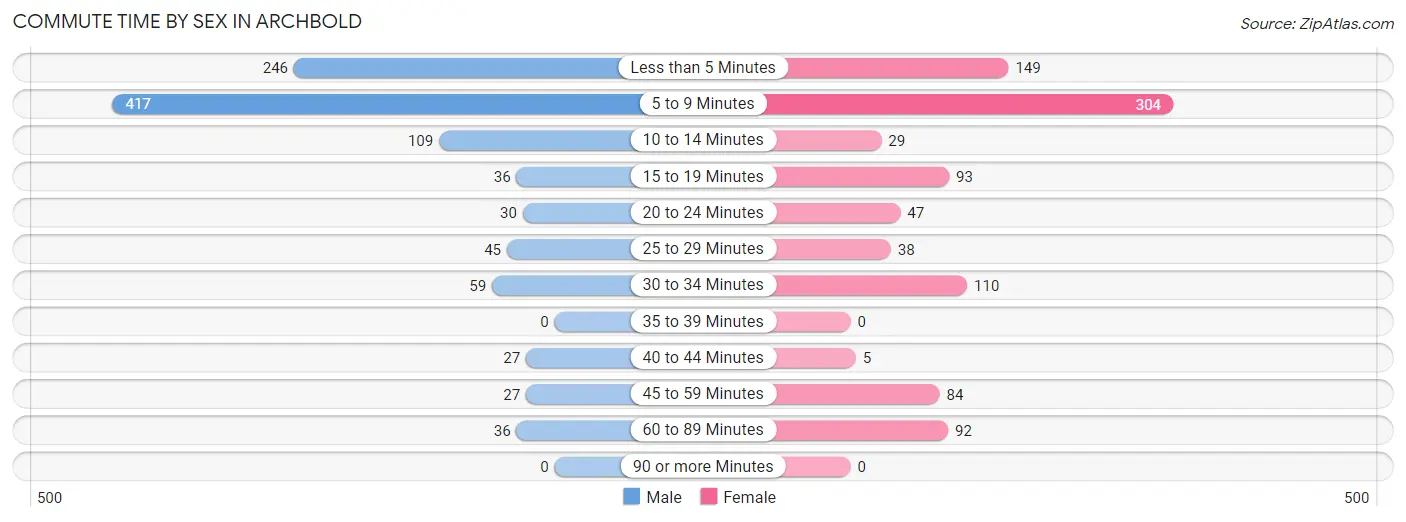
| Commute Time | Male | Female |
| Less than 5 Minutes | 246 (23.8%) | 149 (15.7%) |
| 5 to 9 Minutes | 417 (40.4%) | 304 (32.0%) |
| 10 to 14 Minutes | 109 (10.6%) | 29 (3.0%) |
| 15 to 19 Minutes | 36 (3.5%) | 93 (9.8%) |
| 20 to 24 Minutes | 30 (2.9%) | 47 (4.9%) |
| 25 to 29 Minutes | 45 (4.4%) | 38 (4.0%) |
| 30 to 34 Minutes | 59 (5.7%) | 110 (11.6%) |
| 35 to 39 Minutes | 0 (0.0%) | 0 (0.0%) |
| 40 to 44 Minutes | 27 (2.6%) | 5 (0.5%) |
| 45 to 59 Minutes | 27 (2.6%) | 84 (8.8%) |
| 60 to 89 Minutes | 36 (3.5%) | 92 (9.7%) |
| 90 or more Minutes | 0 (0.0%) | 0 (0.0%) |
Time of Departure to Work by Sex in Archbold
The most frequent times of departure to work in Archbold are 7:00 AM to 7:29 AM (155, 15.0%) for males and 7:30 AM to 7:59 AM (183, 19.2%) for females.
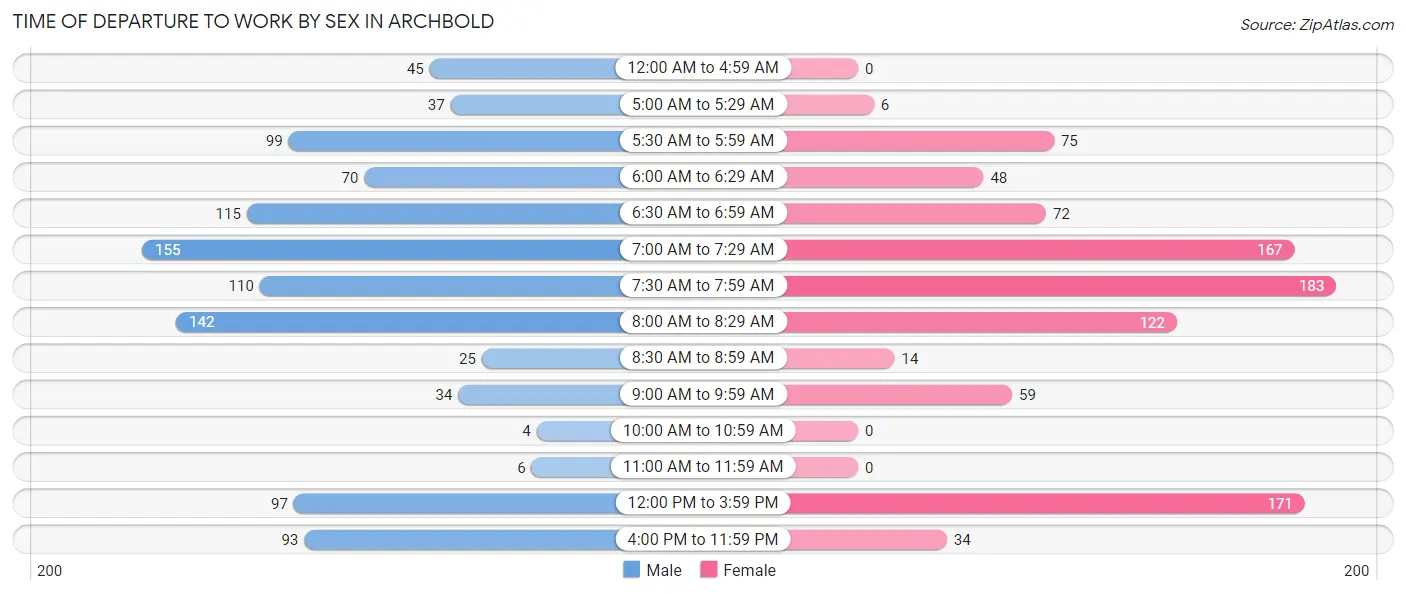
| Time of Departure | Male | Female |
| 12:00 AM to 4:59 AM | 45 (4.4%) | 0 (0.0%) |
| 5:00 AM to 5:29 AM | 37 (3.6%) | 6 (0.6%) |
| 5:30 AM to 5:59 AM | 99 (9.6%) | 75 (7.9%) |
| 6:00 AM to 6:29 AM | 70 (6.8%) | 48 (5.1%) |
| 6:30 AM to 6:59 AM | 115 (11.1%) | 72 (7.6%) |
| 7:00 AM to 7:29 AM | 155 (15.0%) | 167 (17.6%) |
| 7:30 AM to 7:59 AM | 110 (10.7%) | 183 (19.2%) |
| 8:00 AM to 8:29 AM | 142 (13.8%) | 122 (12.8%) |
| 8:30 AM to 8:59 AM | 25 (2.4%) | 14 (1.5%) |
| 9:00 AM to 9:59 AM | 34 (3.3%) | 59 (6.2%) |
| 10:00 AM to 10:59 AM | 4 (0.4%) | 0 (0.0%) |
| 11:00 AM to 11:59 AM | 6 (0.6%) | 0 (0.0%) |
| 12:00 PM to 3:59 PM | 97 (9.4%) | 171 (18.0%) |
| 4:00 PM to 11:59 PM | 93 (9.0%) | 34 (3.6%) |
| Total | 1,032 (100.0%) | 951 (100.0%) |
Housing Occupancy in Archbold
Occupancy by Ownership in Archbold
Of the total 1,773 dwellings in Archbold, owner-occupied units account for 1,318 (74.3%), while renter-occupied units make up 455 (25.7%).
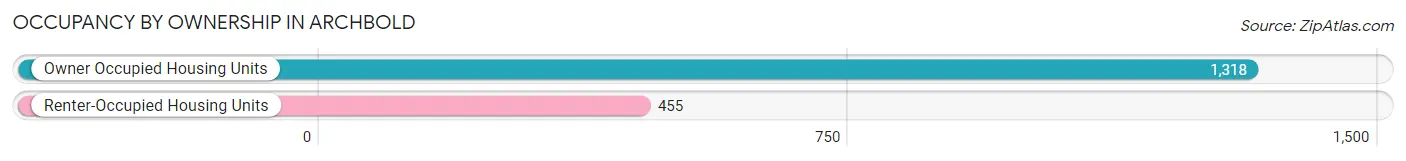
| Occupancy | # Housing Units | % Housing Units |
| Owner Occupied Housing Units | 1,318 | 74.3% |
| Renter-Occupied Housing Units | 455 | 25.7% |
| Total Occupied Housing Units | 1,773 | 100.0% |
Occupancy by Household Size in Archbold
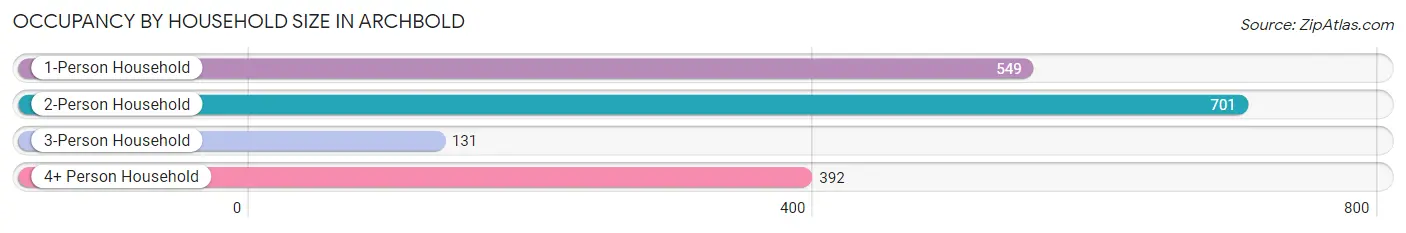
| Household Size | # Housing Units | % Housing Units |
| 1-Person Household | 549 | 31.0% |
| 2-Person Household | 701 | 39.5% |
| 3-Person Household | 131 | 7.4% |
| 4+ Person Household | 392 | 22.1% |
| Total Housing Units | 1,773 | 100.0% |
Occupancy by Ownership by Household Size in Archbold
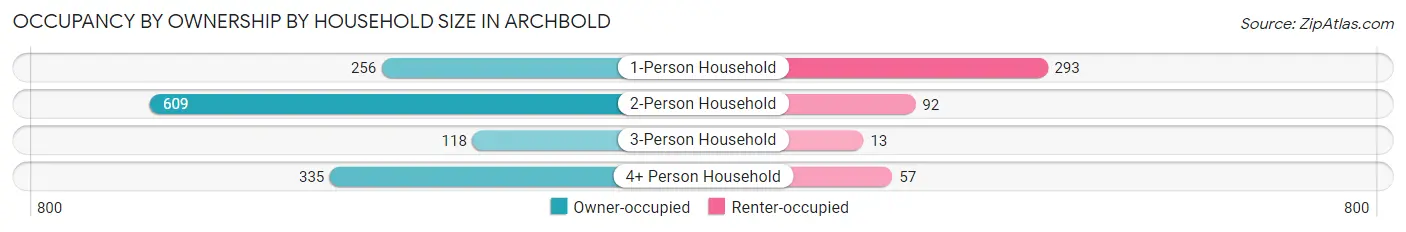
| Household Size | Owner-occupied | Renter-occupied |
| 1-Person Household | 256 (46.6%) | 293 (53.4%) |
| 2-Person Household | 609 (86.9%) | 92 (13.1%) |
| 3-Person Household | 118 (90.1%) | 13 (9.9%) |
| 4+ Person Household | 335 (85.5%) | 57 (14.5%) |
| Total Housing Units | 1,318 (74.3%) | 455 (25.7%) |
Occupancy by Educational Attainment in Archbold
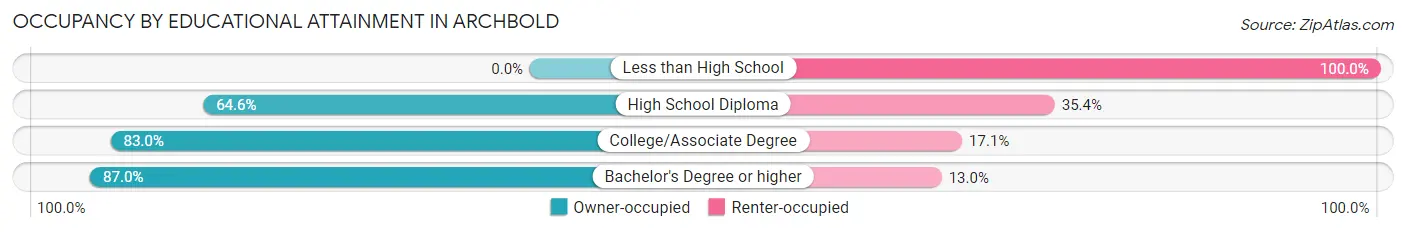
| Household Size | Owner-occupied | Renter-occupied |
| Less than High School | 0 (0.0%) | 65 (100.0%) |
| High School Diploma | 412 (64.6%) | 226 (35.4%) |
| College/Associate Degree | 511 (83.0%) | 105 (17.1%) |
| Bachelor's Degree or higher | 395 (87.0%) | 59 (13.0%) |
Occupancy by Age of Householder in Archbold
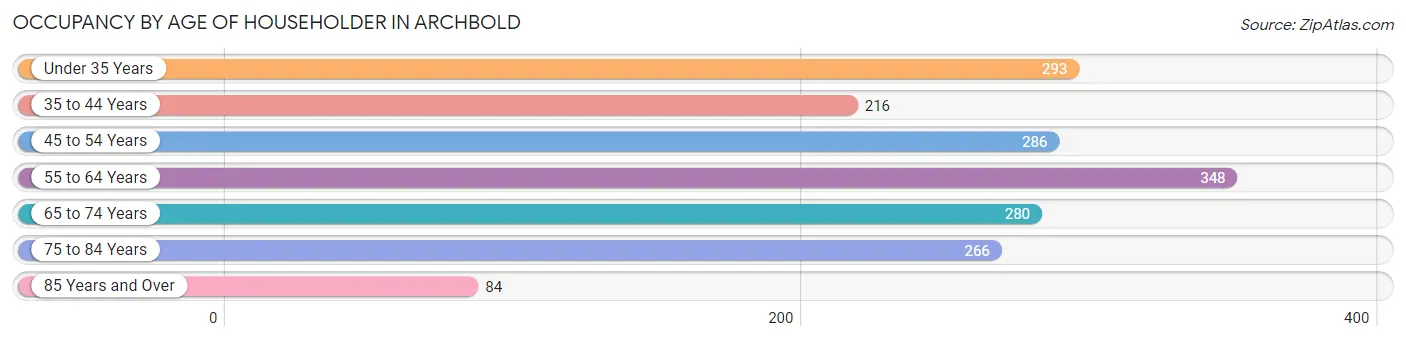
| Age Bracket | # Households | % Households |
| Under 35 Years | 293 | 16.5% |
| 35 to 44 Years | 216 | 12.2% |
| 45 to 54 Years | 286 | 16.1% |
| 55 to 64 Years | 348 | 19.6% |
| 65 to 74 Years | 280 | 15.8% |
| 75 to 84 Years | 266 | 15.0% |
| 85 Years and Over | 84 | 4.7% |
| Total | 1,773 | 100.0% |
Housing Finances in Archbold
Median Income by Occupancy in Archbold
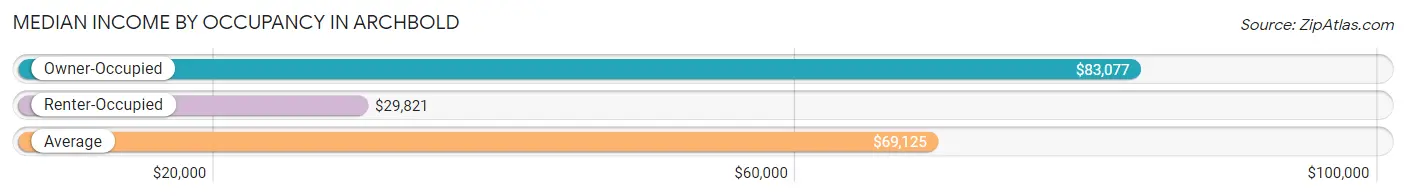
| Occupancy Type | # Households | Median Income |
| Owner-Occupied | 1,318 (74.3%) | $83,077 |
| Renter-Occupied | 455 (25.7%) | $29,821 |
| Average | 1,773 (100.0%) | $69,125 |
Occupancy by Householder Income Bracket in Archbold
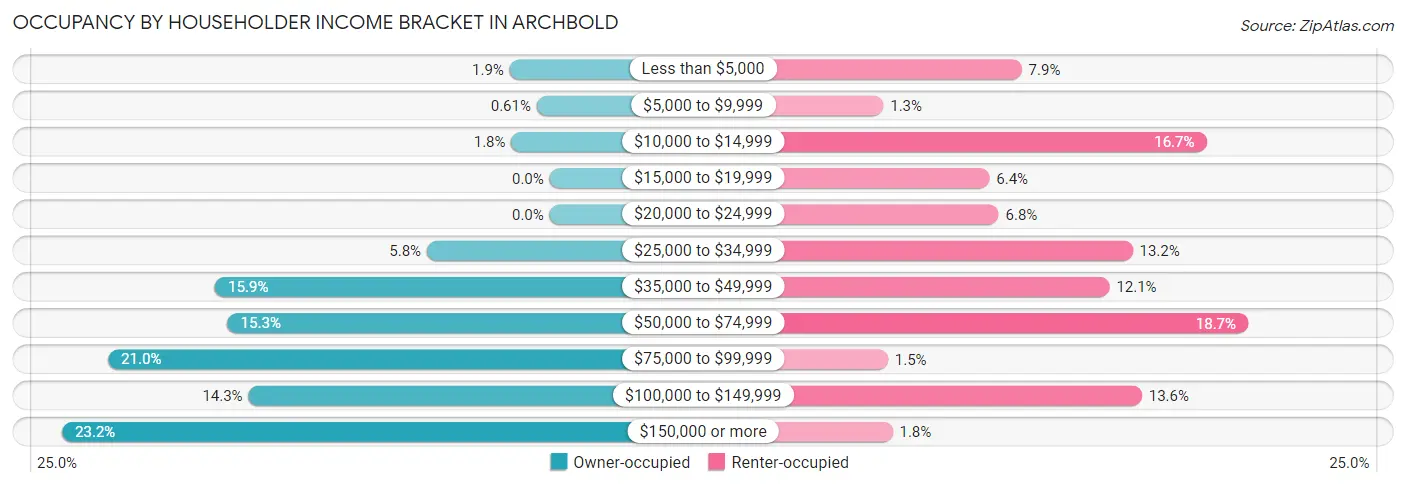
| Income Bracket | Owner-occupied | Renter-occupied |
| Less than $5,000 | 25 (1.9%) | 36 (7.9%) |
| $5,000 to $9,999 | 8 (0.6%) | 6 (1.3%) |
| $10,000 to $14,999 | 24 (1.8%) | 76 (16.7%) |
| $15,000 to $19,999 | 0 (0.0%) | 29 (6.4%) |
| $20,000 to $24,999 | 0 (0.0%) | 31 (6.8%) |
| $25,000 to $34,999 | 77 (5.8%) | 60 (13.2%) |
| $35,000 to $49,999 | 210 (15.9%) | 55 (12.1%) |
| $50,000 to $74,999 | 202 (15.3%) | 85 (18.7%) |
| $75,000 to $99,999 | 277 (21.0%) | 7 (1.5%) |
| $100,000 to $149,999 | 189 (14.3%) | 62 (13.6%) |
| $150,000 or more | 306 (23.2%) | 8 (1.8%) |
| Total | 1,318 (100.0%) | 455 (100.0%) |
Monthly Housing Cost Tiers in Archbold
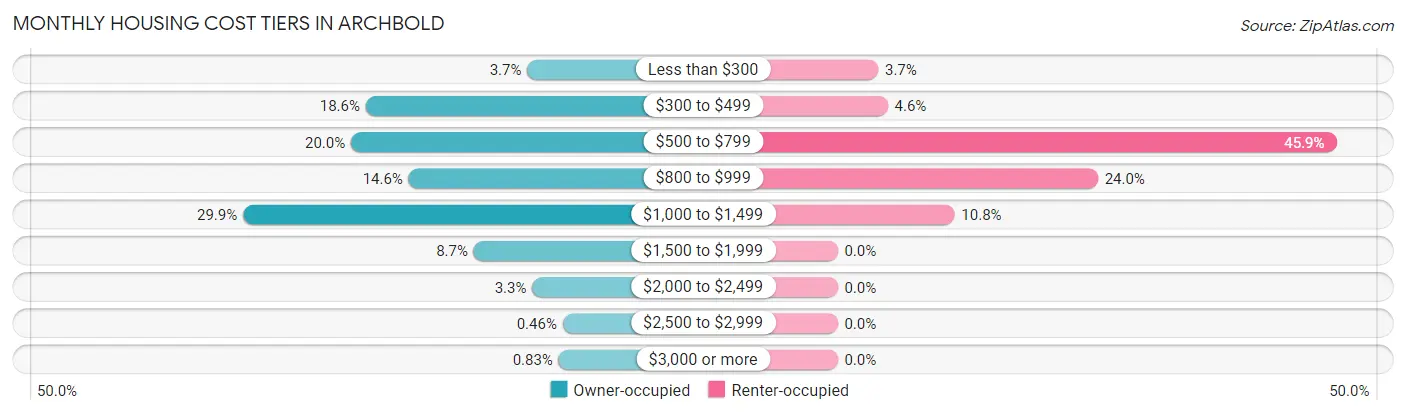
| Monthly Cost | Owner-occupied | Renter-occupied |
| Less than $300 | 49 (3.7%) | 17 (3.7%) |
| $300 to $499 | 245 (18.6%) | 21 (4.6%) |
| $500 to $799 | 263 (20.0%) | 209 (45.9%) |
| $800 to $999 | 193 (14.6%) | 109 (24.0%) |
| $1,000 to $1,499 | 394 (29.9%) | 49 (10.8%) |
| $1,500 to $1,999 | 114 (8.6%) | 0 (0.0%) |
| $2,000 to $2,499 | 43 (3.3%) | 0 (0.0%) |
| $2,500 to $2,999 | 6 (0.5%) | 0 (0.0%) |
| $3,000 or more | 11 (0.8%) | 0 (0.0%) |
| Total | 1,318 (100.0%) | 455 (100.0%) |
Physical Housing Characteristics in Archbold
Housing Structures in Archbold
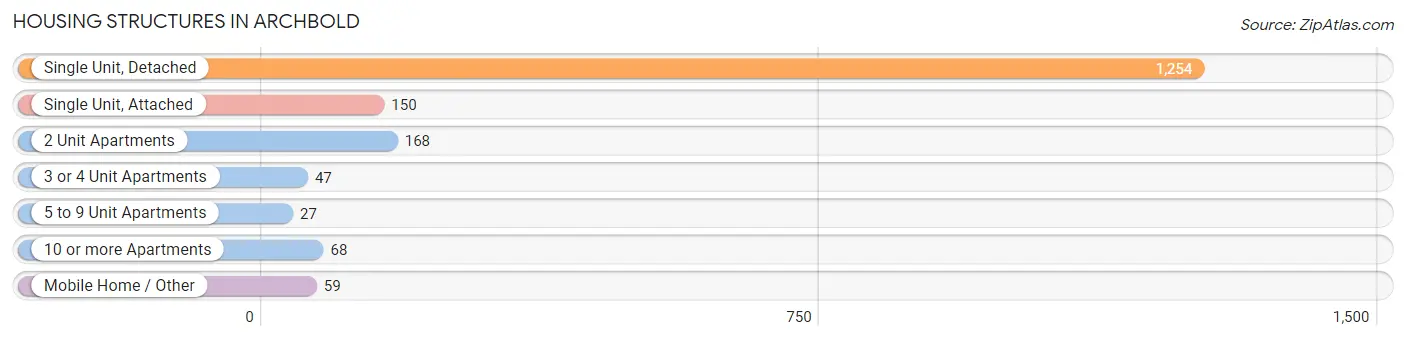
| Structure Type | # Housing Units | % Housing Units |
| Single Unit, Detached | 1,254 | 70.7% |
| Single Unit, Attached | 150 | 8.5% |
| 2 Unit Apartments | 168 | 9.5% |
| 3 or 4 Unit Apartments | 47 | 2.6% |
| 5 to 9 Unit Apartments | 27 | 1.5% |
| 10 or more Apartments | 68 | 3.8% |
| Mobile Home / Other | 59 | 3.3% |
| Total | 1,773 | 100.0% |
Housing Structures by Occupancy in Archbold
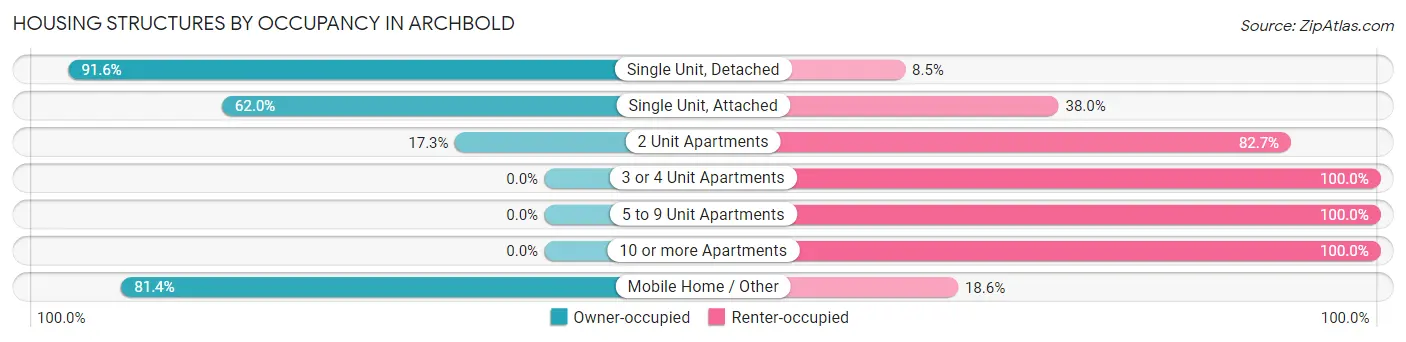
| Structure Type | Owner-occupied | Renter-occupied |
| Single Unit, Detached | 1,148 (91.5%) | 106 (8.5%) |
| Single Unit, Attached | 93 (62.0%) | 57 (38.0%) |
| 2 Unit Apartments | 29 (17.3%) | 139 (82.7%) |
| 3 or 4 Unit Apartments | 0 (0.0%) | 47 (100.0%) |
| 5 to 9 Unit Apartments | 0 (0.0%) | 27 (100.0%) |
| 10 or more Apartments | 0 (0.0%) | 68 (100.0%) |
| Mobile Home / Other | 48 (81.4%) | 11 (18.6%) |
| Total | 1,318 (74.3%) | 455 (25.7%) |
Housing Structures by Number of Rooms in Archbold
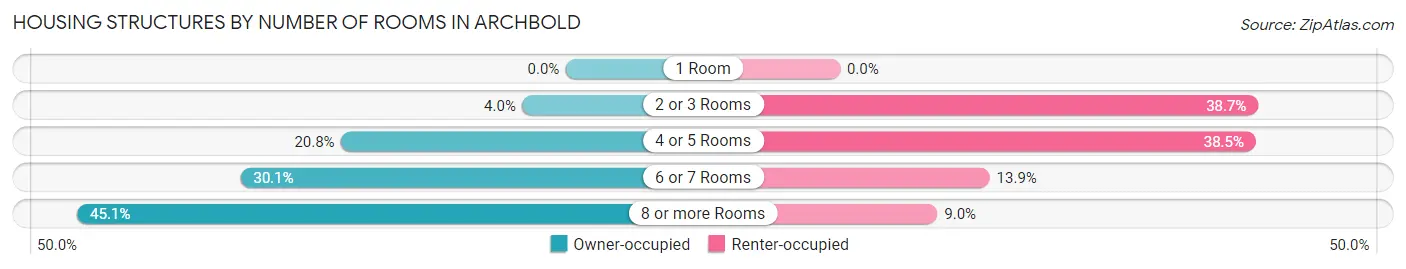
| Number of Rooms | Owner-occupied | Renter-occupied |
| 1 Room | 0 (0.0%) | 0 (0.0%) |
| 2 or 3 Rooms | 53 (4.0%) | 176 (38.7%) |
| 4 or 5 Rooms | 274 (20.8%) | 175 (38.5%) |
| 6 or 7 Rooms | 396 (30.0%) | 63 (13.9%) |
| 8 or more Rooms | 595 (45.1%) | 41 (9.0%) |
| Total | 1,318 (100.0%) | 455 (100.0%) |
Housing Structure by Heating Type in Archbold
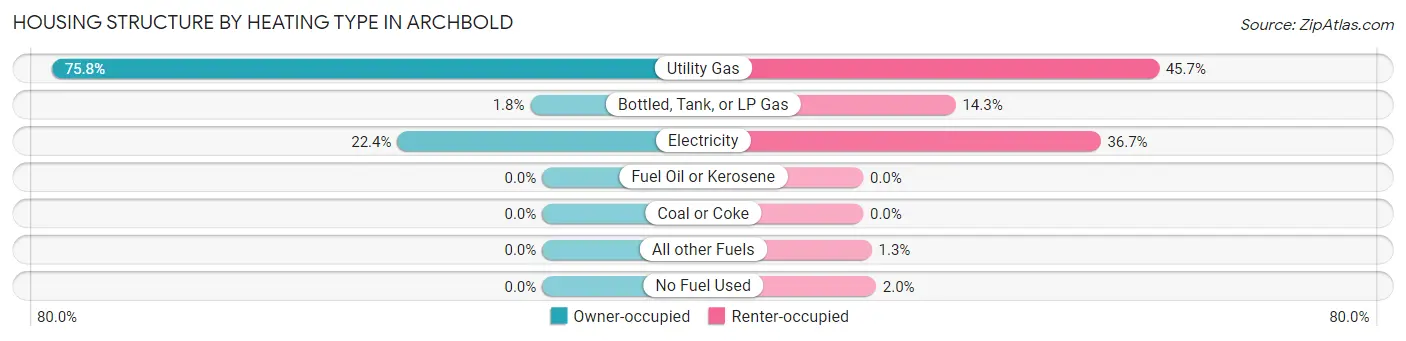
| Heating Type | Owner-occupied | Renter-occupied |
| Utility Gas | 999 (75.8%) | 208 (45.7%) |
| Bottled, Tank, or LP Gas | 24 (1.8%) | 65 (14.3%) |
| Electricity | 295 (22.4%) | 167 (36.7%) |
| Fuel Oil or Kerosene | 0 (0.0%) | 0 (0.0%) |
| Coal or Coke | 0 (0.0%) | 0 (0.0%) |
| All other Fuels | 0 (0.0%) | 6 (1.3%) |
| No Fuel Used | 0 (0.0%) | 9 (2.0%) |
| Total | 1,318 (100.0%) | 455 (100.0%) |
Household Vehicle Usage in Archbold
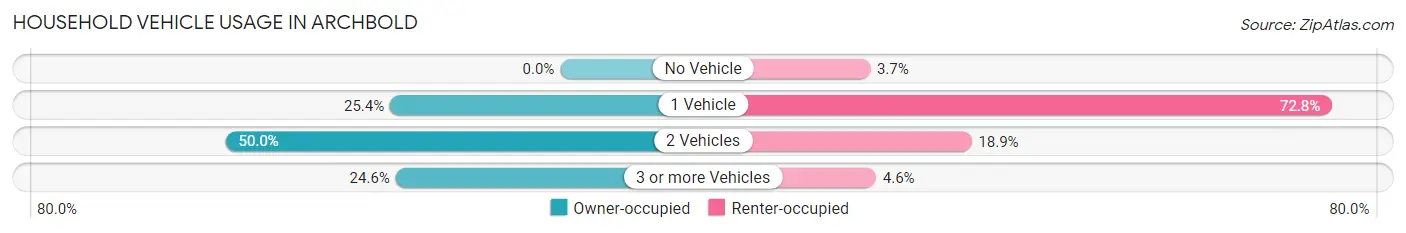
| Vehicles per Household | Owner-occupied | Renter-occupied |
| No Vehicle | 0 (0.0%) | 17 (3.7%) |
| 1 Vehicle | 335 (25.4%) | 331 (72.8%) |
| 2 Vehicles | 659 (50.0%) | 86 (18.9%) |
| 3 or more Vehicles | 324 (24.6%) | 21 (4.6%) |
| Total | 1,318 (100.0%) | 455 (100.0%) |
Real Estate & Mortgages in Archbold
Real Estate and Mortgage Overview in Archbold
| Characteristic | Without Mortgage | With Mortgage |
| Housing Units | 588 | 730 |
| Median Property Value | $175,900 | $159,800 |
| Median Household Income | $65,658 | $171 |
| Monthly Housing Costs | $519 | $11 |
| Real Estate Taxes | $2,094 | $10 |
Property Value by Mortgage Status in Archbold
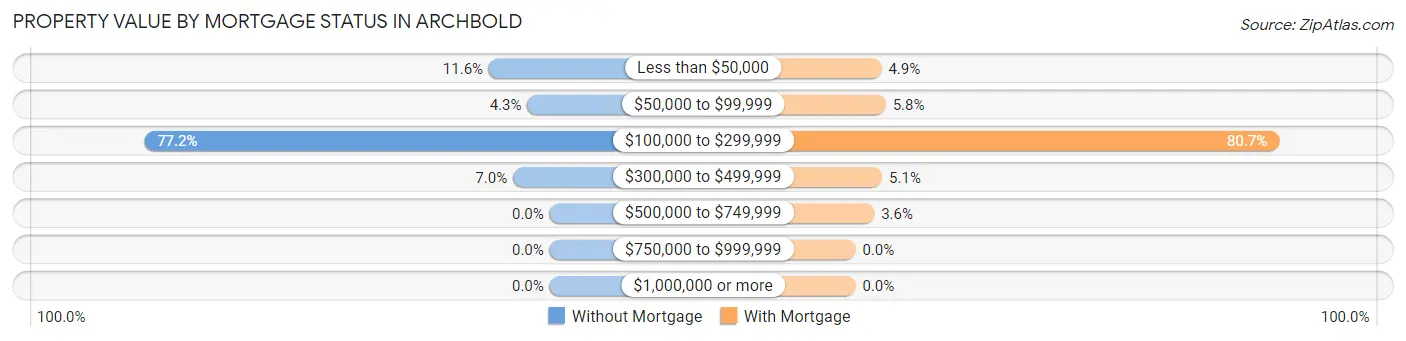
| Property Value | Without Mortgage | With Mortgage |
| Less than $50,000 | 68 (11.6%) | 36 (4.9%) |
| $50,000 to $99,999 | 25 (4.3%) | 42 (5.8%) |
| $100,000 to $299,999 | 454 (77.2%) | 589 (80.7%) |
| $300,000 to $499,999 | 41 (7.0%) | 37 (5.1%) |
| $500,000 to $749,999 | 0 (0.0%) | 26 (3.6%) |
| $750,000 to $999,999 | 0 (0.0%) | 0 (0.0%) |
| $1,000,000 or more | 0 (0.0%) | 0 (0.0%) |
| Total | 588 (100.0%) | 730 (100.0%) |
Household Income by Mortgage Status in Archbold
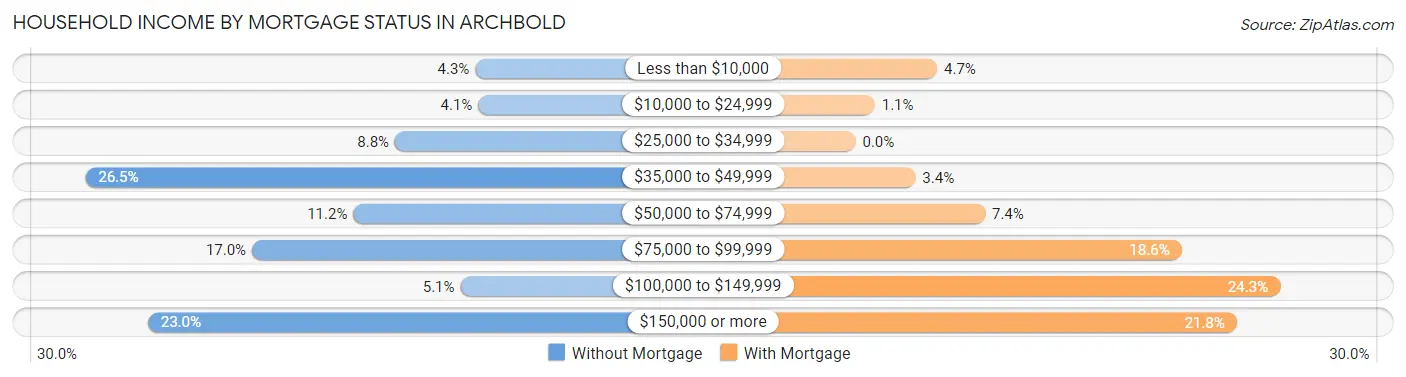
| Household Income | Without Mortgage | With Mortgage |
| Less than $10,000 | 25 (4.3%) | 34 (4.7%) |
| $10,000 to $24,999 | 24 (4.1%) | 8 (1.1%) |
| $25,000 to $34,999 | 52 (8.8%) | 0 (0.0%) |
| $35,000 to $49,999 | 156 (26.5%) | 25 (3.4%) |
| $50,000 to $74,999 | 66 (11.2%) | 54 (7.4%) |
| $75,000 to $99,999 | 100 (17.0%) | 136 (18.6%) |
| $100,000 to $149,999 | 30 (5.1%) | 177 (24.2%) |
| $150,000 or more | 135 (23.0%) | 159 (21.8%) |
| Total | 588 (100.0%) | 730 (100.0%) |
Property Value to Household Income Ratio in Archbold
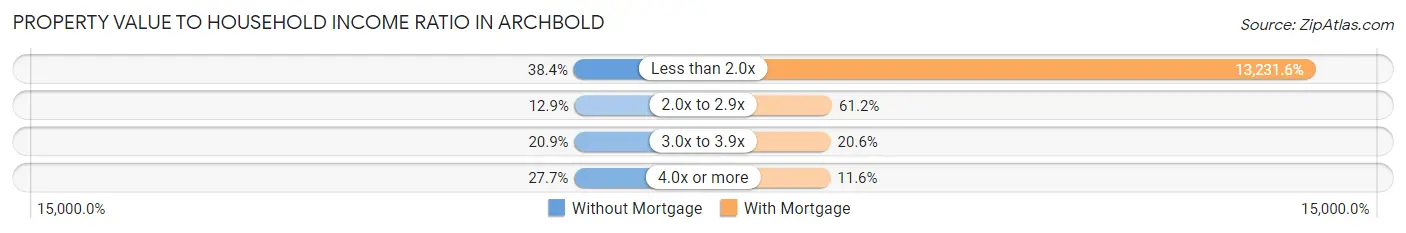
| Value-to-Income Ratio | Without Mortgage | With Mortgage |
| Less than 2.0x | 226 (38.4%) | 96,591 (13,231.6%) |
| 2.0x to 2.9x | 76 (12.9%) | 447 (61.2%) |
| 3.0x to 3.9x | 123 (20.9%) | 150 (20.5%) |
| 4.0x or more | 163 (27.7%) | 85 (11.6%) |
| Total | 588 (100.0%) | 730 (100.0%) |
Real Estate Taxes by Mortgage Status in Archbold
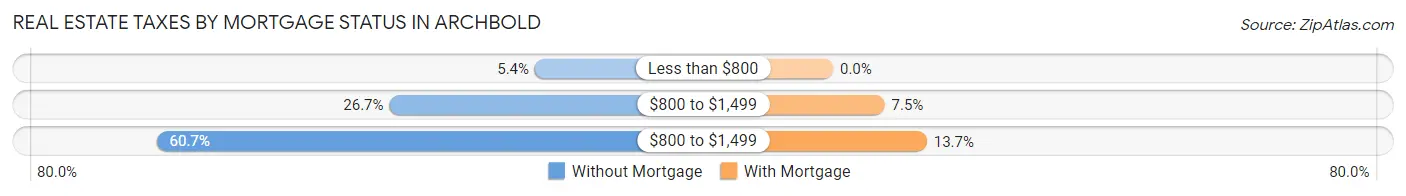
| Property Taxes | Without Mortgage | With Mortgage |
| Less than $800 | 32 (5.4%) | 0 (0.0%) |
| $800 to $1,499 | 157 (26.7%) | 55 (7.5%) |
| $800 to $1,499 | 357 (60.7%) | 100 (13.7%) |
| Total | 588 (100.0%) | 730 (100.0%) |
Health & Disability in Archbold
Health Insurance Coverage by Age in Archbold
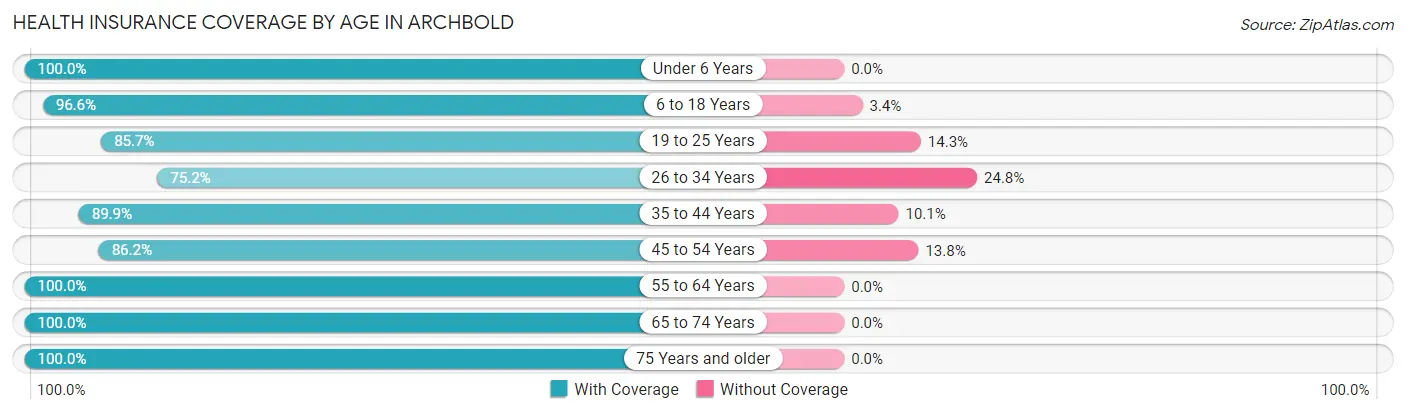
| Age Bracket | With Coverage | Without Coverage |
| Under 6 Years | 259 (100.0%) | 0 (0.0%) |
| 6 to 18 Years | 881 (96.6%) | 31 (3.4%) |
| 19 to 25 Years | 252 (85.7%) | 42 (14.3%) |
| 26 to 34 Years | 246 (75.2%) | 81 (24.8%) |
| 35 to 44 Years | 373 (89.9%) | 42 (10.1%) |
| 45 to 54 Years | 405 (86.2%) | 65 (13.8%) |
| 55 to 64 Years | 709 (100.0%) | 0 (0.0%) |
| 65 to 74 Years | 447 (100.0%) | 0 (0.0%) |
| 75 Years and older | 499 (100.0%) | 0 (0.0%) |
| Total | 4,071 (94.0%) | 261 (6.0%) |
Health Insurance Coverage by Citizenship Status in Archbold
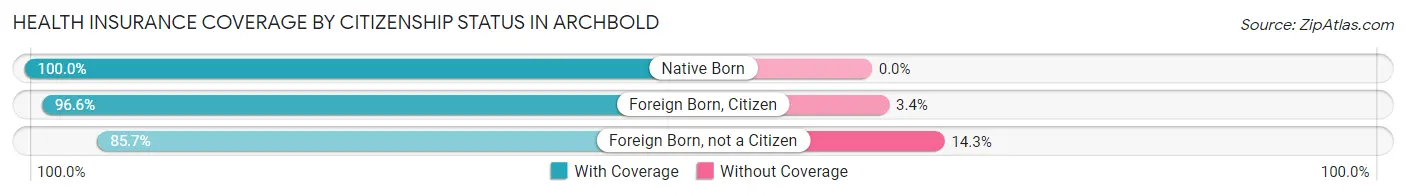
| Citizenship Status | With Coverage | Without Coverage |
| Native Born | 259 (100.0%) | 0 (0.0%) |
| Foreign Born, Citizen | 881 (96.6%) | 31 (3.4%) |
| Foreign Born, not a Citizen | 252 (85.7%) | 42 (14.3%) |
Health Insurance Coverage by Household Income in Archbold
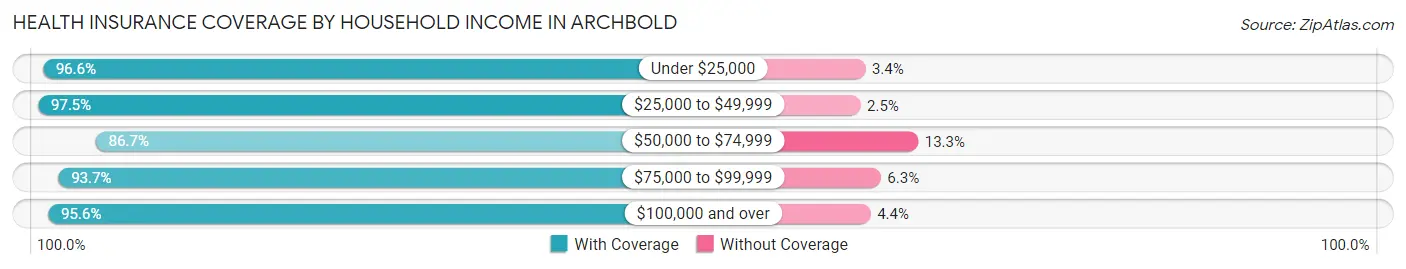
| Household Income | With Coverage | Without Coverage |
| Under $25,000 | 284 (96.6%) | 10 (3.4%) |
| $25,000 to $49,999 | 626 (97.5%) | 16 (2.5%) |
| $50,000 to $74,999 | 652 (86.7%) | 100 (13.3%) |
| $75,000 to $99,999 | 966 (93.7%) | 65 (6.3%) |
| $100,000 and over | 1,526 (95.6%) | 70 (4.4%) |
Public vs Private Health Insurance Coverage by Age in Archbold
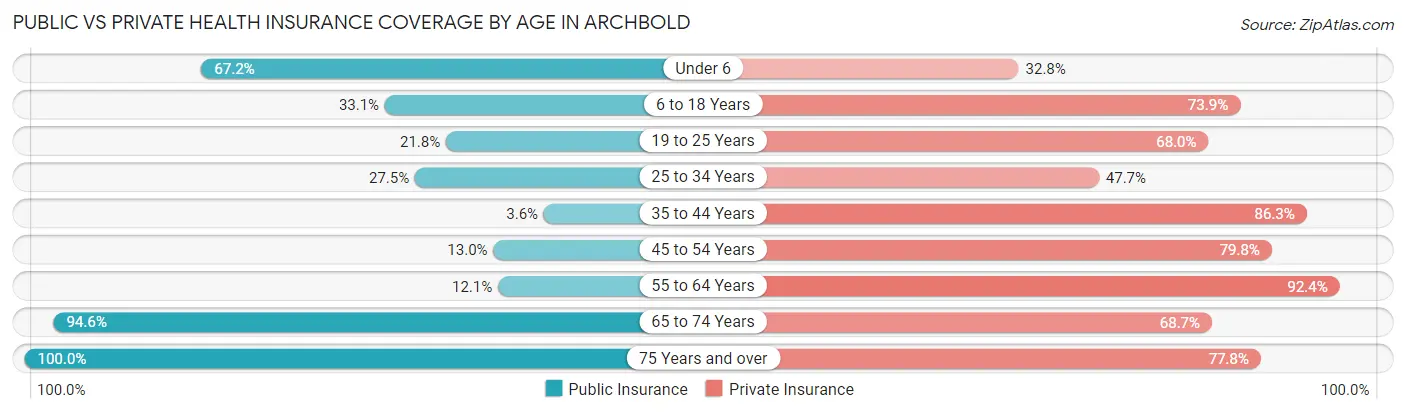
| Age Bracket | Public Insurance | Private Insurance |
| Under 6 | 174 (67.2%) | 85 (32.8%) |
| 6 to 18 Years | 302 (33.1%) | 674 (73.9%) |
| 19 to 25 Years | 64 (21.8%) | 200 (68.0%) |
| 25 to 34 Years | 90 (27.5%) | 156 (47.7%) |
| 35 to 44 Years | 15 (3.6%) | 358 (86.3%) |
| 45 to 54 Years | 61 (13.0%) | 375 (79.8%) |
| 55 to 64 Years | 86 (12.1%) | 655 (92.4%) |
| 65 to 74 Years | 423 (94.6%) | 307 (68.7%) |
| 75 Years and over | 499 (100.0%) | 388 (77.8%) |
| Total | 1,714 (39.6%) | 3,198 (73.8%) |
Disability Status by Sex by Age in Archbold
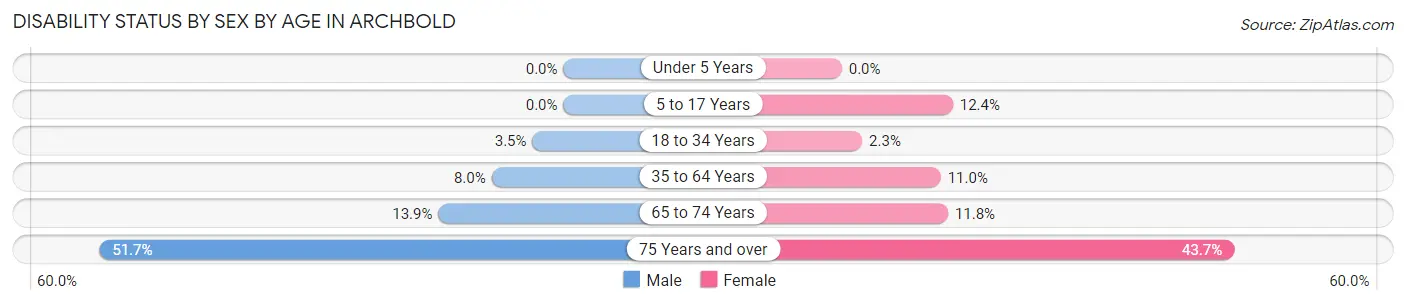
| Age Bracket | Male | Female |
| Under 5 Years | 0 (0.0%) | 0 (0.0%) |
| 5 to 17 Years | 0 (0.0%) | 57 (12.4%) |
| 18 to 34 Years | 8 (3.5%) | 10 (2.3%) |
| 35 to 64 Years | 68 (8.0%) | 82 (11.0%) |
| 65 to 74 Years | 34 (13.9%) | 24 (11.8%) |
| 75 Years and over | 123 (51.7%) | 114 (43.7%) |
Disability Class by Sex by Age in Archbold
Disability Class: Hearing Difficulty
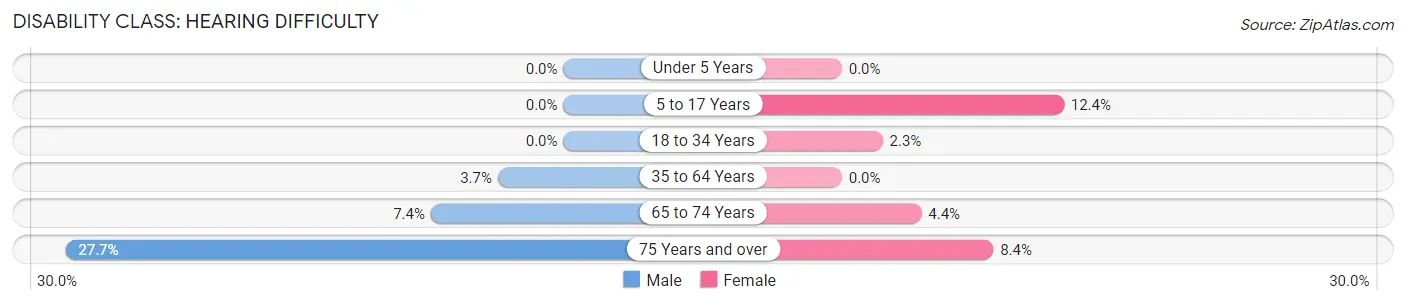
| Age Bracket | Male | Female |
| Under 5 Years | 0 (0.0%) | 0 (0.0%) |
| 5 to 17 Years | 0 (0.0%) | 57 (12.4%) |
| 18 to 34 Years | 0 (0.0%) | 10 (2.3%) |
| 35 to 64 Years | 31 (3.6%) | 0 (0.0%) |
| 65 to 74 Years | 18 (7.4%) | 9 (4.4%) |
| 75 Years and over | 66 (27.7%) | 22 (8.4%) |
Disability Class: Vision Difficulty
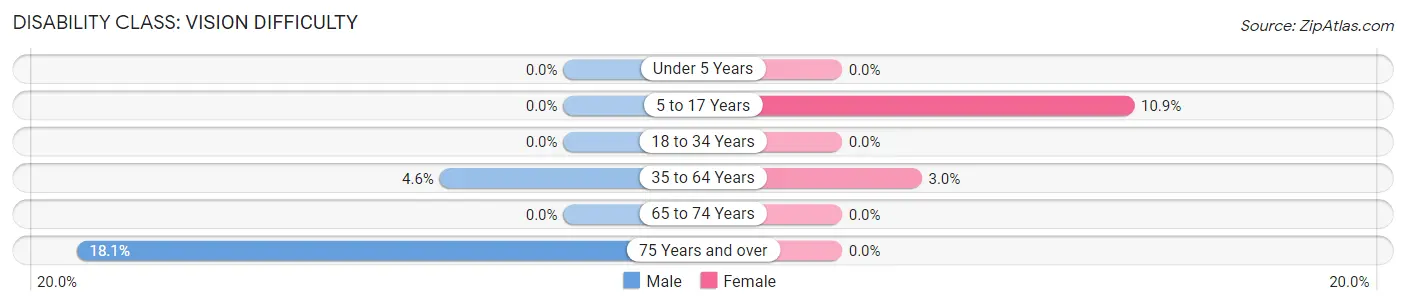
| Age Bracket | Male | Female |
| Under 5 Years | 0 (0.0%) | 0 (0.0%) |
| 5 to 17 Years | 0 (0.0%) | 50 (10.8%) |
| 18 to 34 Years | 0 (0.0%) | 0 (0.0%) |
| 35 to 64 Years | 39 (4.6%) | 22 (3.0%) |
| 65 to 74 Years | 0 (0.0%) | 0 (0.0%) |
| 75 Years and over | 43 (18.1%) | 0 (0.0%) |
Disability Class: Cognitive Difficulty
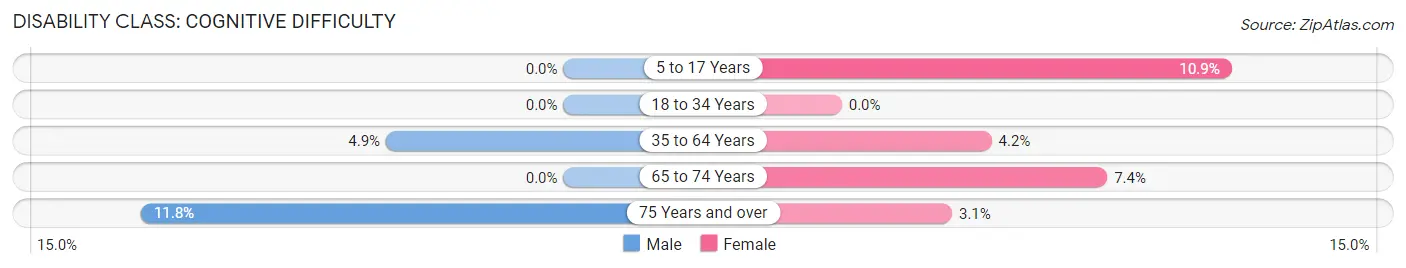
| Age Bracket | Male | Female |
| 5 to 17 Years | 0 (0.0%) | 50 (10.8%) |
| 18 to 34 Years | 0 (0.0%) | 0 (0.0%) |
| 35 to 64 Years | 42 (4.9%) | 31 (4.2%) |
| 65 to 74 Years | 0 (0.0%) | 15 (7.4%) |
| 75 Years and over | 28 (11.8%) | 8 (3.1%) |
Disability Class: Ambulatory Difficulty
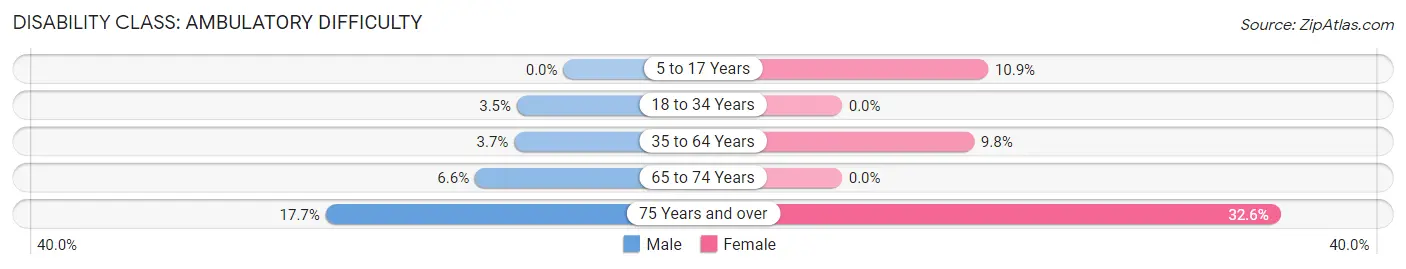
| Age Bracket | Male | Female |
| 5 to 17 Years | 0 (0.0%) | 50 (10.8%) |
| 18 to 34 Years | 8 (3.5%) | 0 (0.0%) |
| 35 to 64 Years | 31 (3.6%) | 73 (9.8%) |
| 65 to 74 Years | 16 (6.6%) | 0 (0.0%) |
| 75 Years and over | 42 (17.6%) | 85 (32.6%) |
Disability Class: Self-Care Difficulty
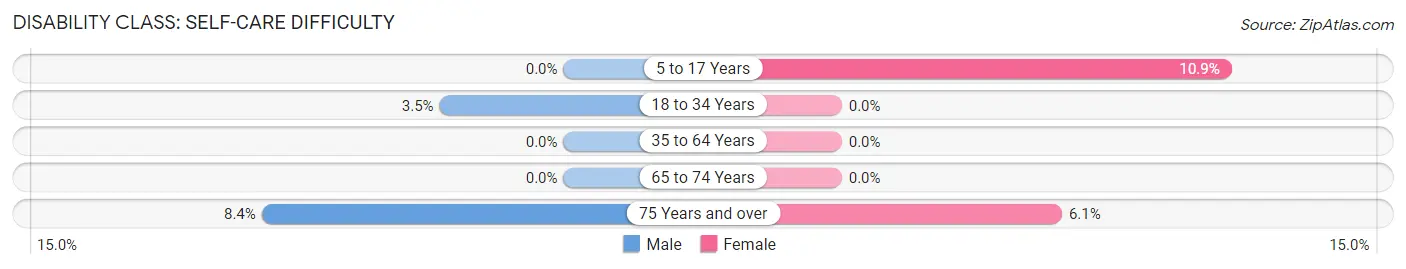
| Age Bracket | Male | Female |
| 5 to 17 Years | 0 (0.0%) | 50 (10.8%) |
| 18 to 34 Years | 8 (3.5%) | 0 (0.0%) |
| 35 to 64 Years | 0 (0.0%) | 0 (0.0%) |
| 65 to 74 Years | 0 (0.0%) | 0 (0.0%) |
| 75 Years and over | 20 (8.4%) | 16 (6.1%) |
Technology Access in Archbold
Computing Device Access in Archbold
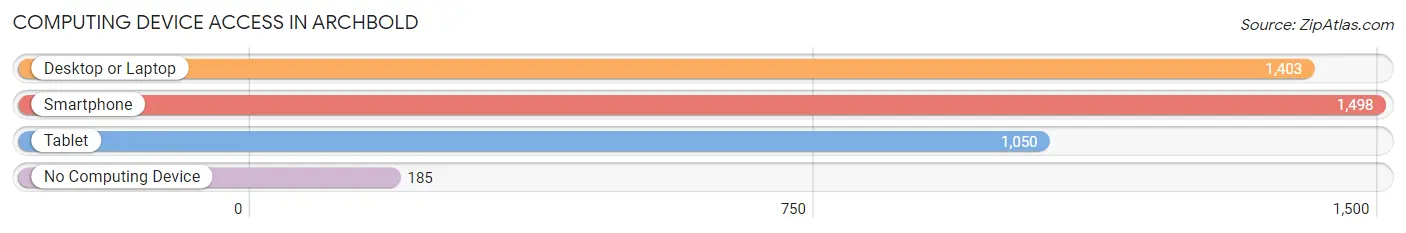
| Device Type | # Households | % Households |
| Desktop or Laptop | 1,403 | 79.1% |
| Smartphone | 1,498 | 84.5% |
| Tablet | 1,050 | 59.2% |
| No Computing Device | 185 | 10.4% |
| Total | 1,773 | 100.0% |
Internet Access in Archbold
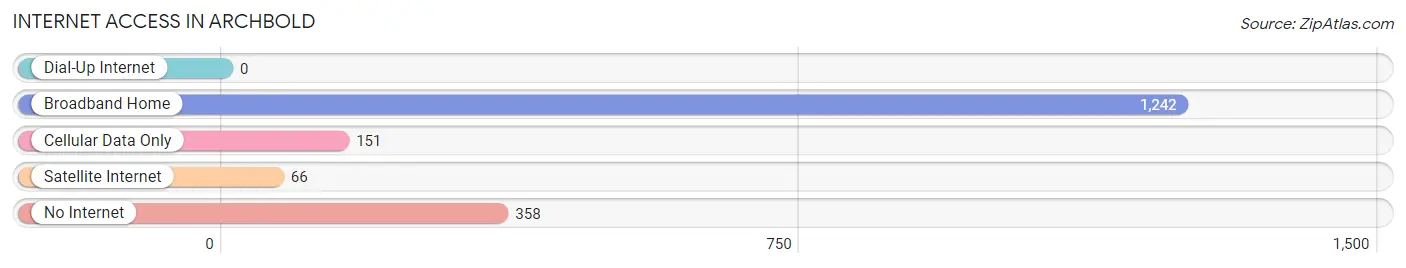
| Internet Type | # Households | % Households |
| Dial-Up Internet | 0 | 0.0% |
| Broadband Home | 1,242 | 70.1% |
| Cellular Data Only | 151 | 8.5% |
| Satellite Internet | 66 | 3.7% |
| No Internet | 358 | 20.2% |
| Total | 1,773 | 100.0% |
Archbold Summary
History
The village of Archbold, Ohio is located in the northwest corner of Fulton County, Ohio. It was founded in 1854 by a group of Mennonites from Pennsylvania. The village was named after John Archbold, a prominent businessman and philanthropist from New York. The Mennonites were attracted to the area due to its rich soil and abundant natural resources.
The village was incorporated in 1867 and quickly grew to become a thriving agricultural community. The village was home to a variety of businesses, including a flour mill, a sawmill, a blacksmith shop, and a general store. The village also had a post office, a bank, and a newspaper.
In the late 19th century, the village began to diversify its economy. The first industry to move into the village was a furniture factory, which opened in 1891. This was followed by a cigar factory in 1895 and a canning factory in 1897.
The village continued to grow and prosper throughout the 20th century. In the 1950s, the village was home to a variety of industries, including a foundry, a machine shop, and a plastics factory. The village also had a variety of retail stores, including a grocery store, a hardware store, and a drug store.
Geography
Archbold is located in the northwest corner of Fulton County, Ohio. It is situated on the banks of the Tiffin River, which flows through the village. The village is surrounded by farmland and is located approximately 25 miles from Toledo, Ohio.
The village has a total area of 1.3 square miles, all of which is land. The village is located at an elevation of 845 feet above sea level. The climate in the area is characterized by hot, humid summers and cold, snowy winters.
Economy
Archbold’s economy is largely based on agriculture and manufacturing. The village is home to a variety of agricultural businesses, including a dairy farm, a hog farm, and a poultry farm. The village also has a variety of manufacturing businesses, including a furniture factory, a machine shop, and a plastics factory.
The village also has a variety of retail stores, including a grocery store, a hardware store, and a drug store. The village also has a variety of restaurants, including a pizza shop, a Mexican restaurant, and a Chinese restaurant.
Demographics
As of the 2010 census, the village of Archbold had a population of 4,541. The population was spread out with 49.2% male and 50.8% female. The median age was 37.7 years.
The racial makeup of the village was 95.2% White, 0.7% African American, 0.2% Native American, 0.7% Asian, 0.1% Pacific Islander, 1.2% from other races, and 2.0% from two or more races. Hispanic or Latino of any race were 3.2% of the population.
The median household income in the village was $45,938 and the median family income was $54,917. The per capita income for the village was $20,945. About 8.2% of families and 10.2% of the population were below the poverty line, including 14.2% of those under age 18 and 5.2% of those age 65 or over.
Common Questions
What is Per Capita Income in Archbold?
Per Capita income in Archbold is $35,339.
What is the Median Family Income in Archbold?
Median Family Income in Archbold is $91,250.
What is the Median Household income in Archbold?
Median Household Income in Archbold is $69,125.
What is Income or Wage Gap in Archbold?
Income or Wage Gap in Archbold is 47.4%.
Women in Archbold earn 52.6 cents for every dollar earned by a man.
What is Inequality or Gini Index in Archbold?
Inequality or Gini Index in Archbold is 0.41.
What is the Total Population of Archbold?
Total Population of Archbold is 4,439.
What is the Total Male Population of Archbold?
Total Male Population of Archbold is 2,134.
What is the Total Female Population of Archbold?
Total Female Population of Archbold is 2,305.
What is the Ratio of Males per 100 Females in Archbold?
There are 92.58 Males per 100 Females in Archbold.
What is the Ratio of Females per 100 Males in Archbold?
There are 108.01 Females per 100 Males in Archbold.
What is the Median Population Age in Archbold?
Median Population Age in Archbold is 45.2 Years.
What is the Average Family Size in Archbold
Average Family Size in Archbold is 3.0 People.
What is the Average Household Size in Archbold
Average Household Size in Archbold is 2.4 People.
How Large is the Labor Force in Archbold?
There are 2,232 People in the Labor Forcein in Archbold.
What is the Percentage of People in the Labor Force in Archbold?
65.0% of People are in the Labor Force in Archbold.
What is the Unemployment Rate in Archbold?
Unemployment Rate in Archbold is 5.6%.