Andover, OH Map & Demographics
Andover Map
Andover Overview
$21,660
PER CAPITA INCOME
$50,515
AVG FAMILY INCOME
$47,404
AVG HOUSEHOLD INCOME
65.3%
WAGE / INCOME GAP [ % ]
34.7¢/ $1
WAGE / INCOME GAP [ $ ]
0.30
INEQUALITY / GINI INDEX
708
TOTAL POPULATION
346
MALE POPULATION
362
FEMALE POPULATION
95.58
MALES / 100 FEMALES
104.62
FEMALES / 100 MALES
56.0
MEDIAN AGE
2.7
AVG FAMILY SIZE
2.1
AVG HOUSEHOLD SIZE
274
LABOR FORCE [ PEOPLE ]
46.4%
PERCENT IN LABOR FORCE
4.7%
UNEMPLOYMENT RATE
Andover Zip Codes
Andover Area Codes
Income in Andover
Income Overview in Andover
Per Capita Income in Andover is $21,660, while median incomes of families and households are $50,515 and $47,404 respectively.
| Characteristic | Number | Measure |
| Per Capita Income | 708 | $21,660 |
| Median Family Income | 153 | $50,515 |
| Mean Family Income | 153 | $52,507 |
| Median Household Income | 287 | $47,404 |
| Mean Household Income | 287 | $49,959 |
| Income Deficit | 153 | $0 |
| Wage / Income Gap (%) | 708 | 65.27% |
| Wage / Income Gap ($) | 708 | 34.73¢ per $1 |
| Gini / Inequality Index | 708 | 0.30 |
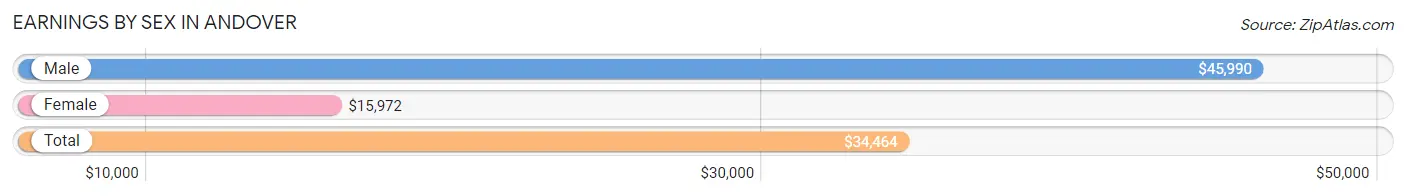
Earnings by Sex in Andover
Average Earnings in Andover are $34,464, $45,990 for men and $15,972 for women, a difference of 65.3%.
| Sex | Number | Average Earnings |
| Male | 157 (54.1%) | $45,990 |
| Female | 133 (45.9%) | $15,972 |
| Total | 290 (100.0%) | $34,464 |
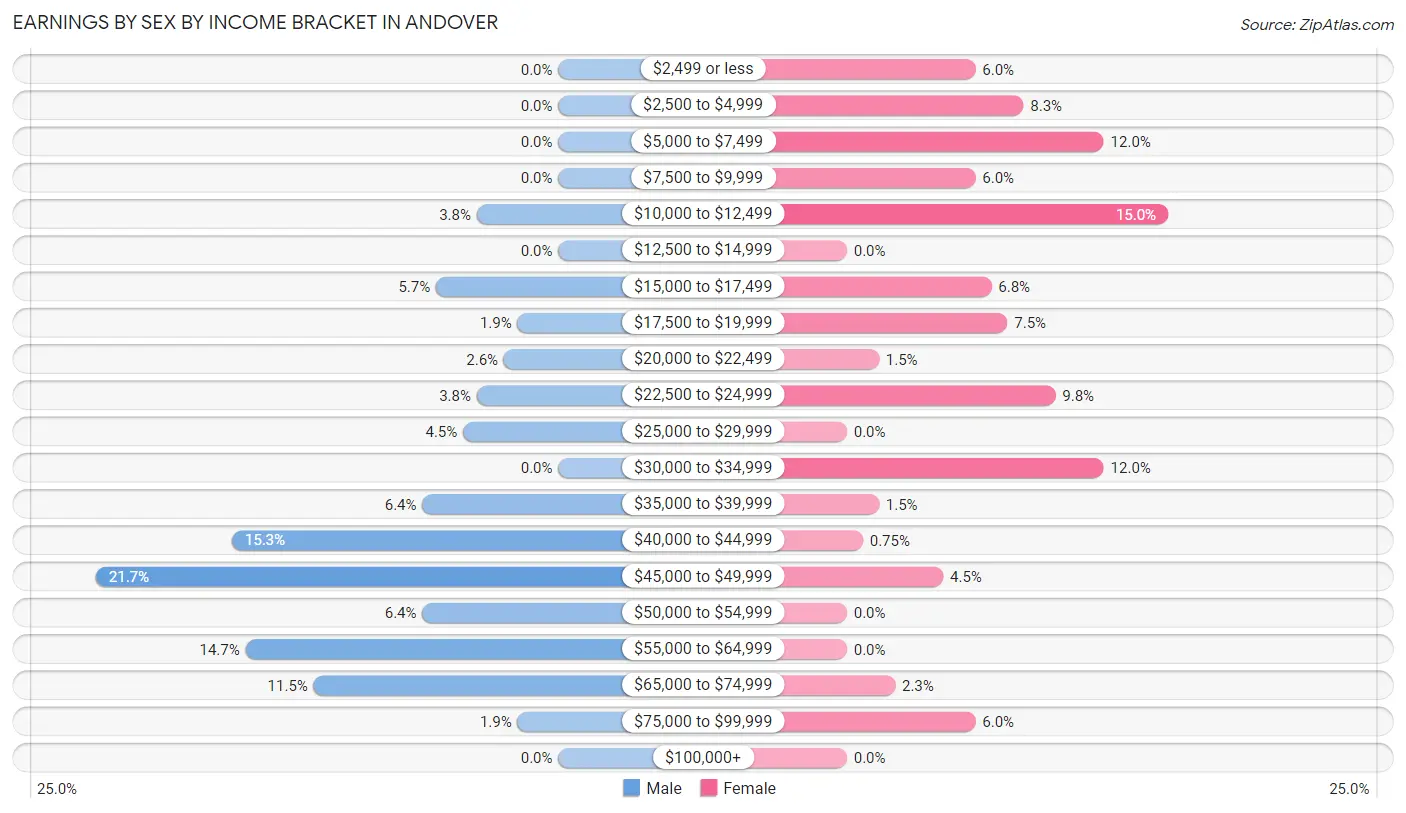
Earnings by Sex by Income Bracket in Andover
The most common earnings brackets in Andover are $45,000 to $49,999 for men (34 | 21.7%) and $10,000 to $12,499 for women (20 | 15.0%).
| Income | Male | Female |
| $2,499 or less | 0 (0.0%) | 8 (6.0%) |
| $2,500 to $4,999 | 0 (0.0%) | 11 (8.3%) |
| $5,000 to $7,499 | 0 (0.0%) | 16 (12.0%) |
| $7,500 to $9,999 | 0 (0.0%) | 8 (6.0%) |
| $10,000 to $12,499 | 6 (3.8%) | 20 (15.0%) |
| $12,500 to $14,999 | 0 (0.0%) | 0 (0.0%) |
| $15,000 to $17,499 | 9 (5.7%) | 9 (6.8%) |
| $17,500 to $19,999 | 3 (1.9%) | 10 (7.5%) |
| $20,000 to $22,499 | 4 (2.5%) | 2 (1.5%) |
| $22,500 to $24,999 | 6 (3.8%) | 13 (9.8%) |
| $25,000 to $29,999 | 7 (4.5%) | 0 (0.0%) |
| $30,000 to $34,999 | 0 (0.0%) | 16 (12.0%) |
| $35,000 to $39,999 | 10 (6.4%) | 2 (1.5%) |
| $40,000 to $44,999 | 24 (15.3%) | 1 (0.7%) |
| $45,000 to $49,999 | 34 (21.7%) | 6 (4.5%) |
| $50,000 to $54,999 | 10 (6.4%) | 0 (0.0%) |
| $55,000 to $64,999 | 23 (14.6%) | 0 (0.0%) |
| $65,000 to $74,999 | 18 (11.5%) | 3 (2.3%) |
| $75,000 to $99,999 | 3 (1.9%) | 8 (6.0%) |
| $100,000+ | 0 (0.0%) | 0 (0.0%) |
| Total | 157 (100.0%) | 133 (100.0%) |
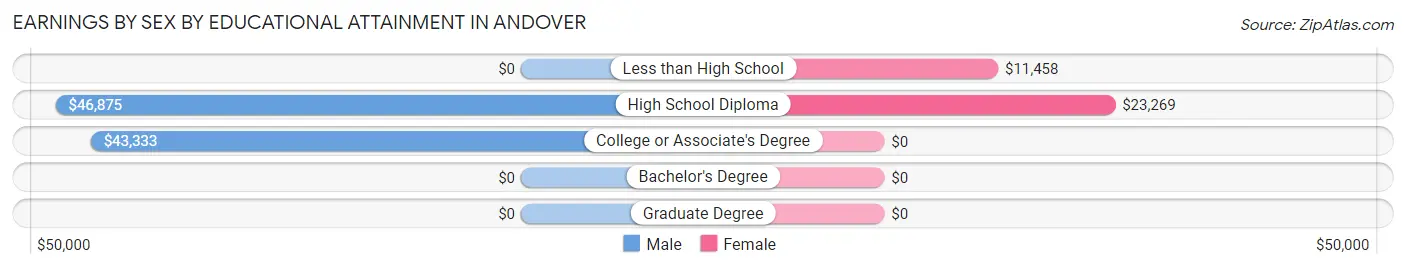
Earnings by Sex by Educational Attainment in Andover
Average earnings in Andover are $47,031 for men and $17,083 for women, a difference of 63.7%. Men with an educational attainment of high school diploma enjoy the highest average annual earnings of $46,875, while those with college or associate's degree education earn the least with $43,333. Women with an educational attainment of high school diploma earn the most with the average annual earnings of $23,269, while those with less than high school education have the smallest earnings of $11,458.
| Educational Attainment | Male Income | Female Income |
| Less than High School | - | - |
| High School Diploma | $46,875 | $23,269 |
| College or Associate's Degree | $43,333 | $0 |
| Bachelor's Degree | - | - |
| Graduate Degree | - | - |
| Total | $47,031 | $17,083 |
Family Income in Andover
Family Income Brackets in Andover
According to the Andover family income data, there are 43 families falling into the $50,000 to $74,999 income range, which is the most common income bracket and makes up 28.1% of all families.
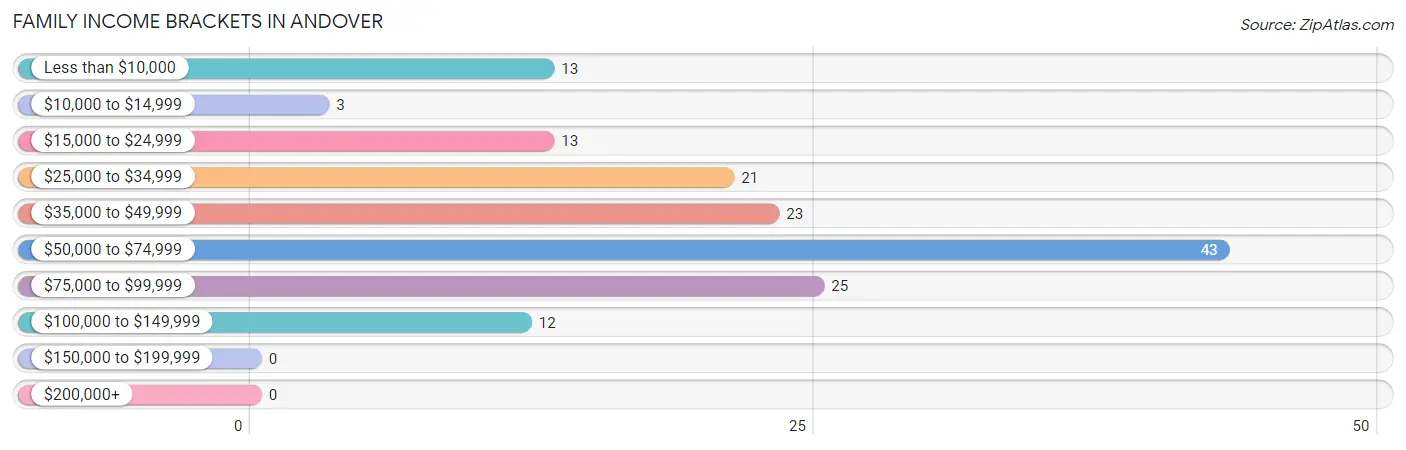
| Income Bracket | # Families | % Families |
| Less than $10,000 | 13 | 8.5% |
| $10,000 to $14,999 | 3 | 2.0% |
| $15,000 to $24,999 | 13 | 8.5% |
| $25,000 to $34,999 | 21 | 13.7% |
| $35,000 to $49,999 | 23 | 15.0% |
| $50,000 to $74,999 | 43 | 28.1% |
| $75,000 to $99,999 | 25 | 16.3% |
| $100,000 to $149,999 | 12 | 7.8% |
| $150,000 to $199,999 | 0 | 0.0% |
| $200,000+ | 0 | 0.0% |
Family Income by Famaliy Size in Andover
3-person families (48 | 31.4%) account for the highest median family income in Andover with $70,625 per family, while 3-person families (48 | 31.4%) have the highest median income of $23,542 per family member.
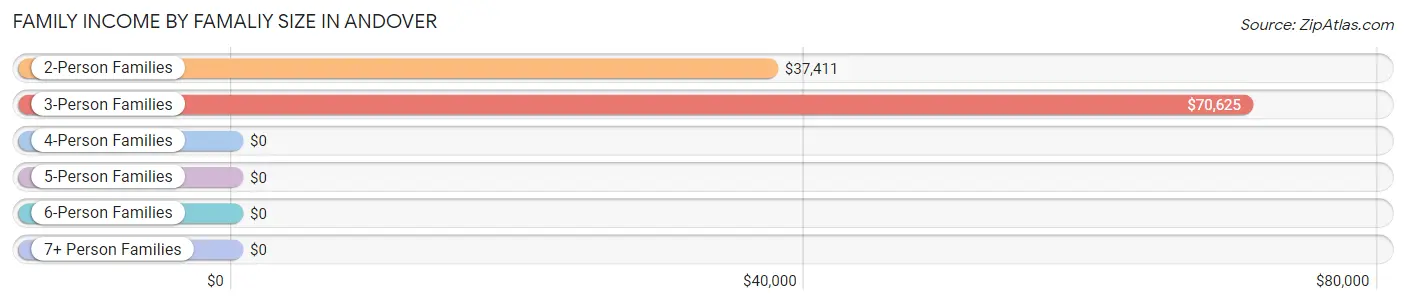
| Income Bracket | # Families | Median Income |
| 2-Person Families | 87 (56.9%) | $37,411 |
| 3-Person Families | 48 (31.4%) | $70,625 |
| 4-Person Families | 16 (10.5%) | $0 |
| 5-Person Families | 1 (0.6%) | $0 |
| 6-Person Families | 0 (0.0%) | $0 |
| 7+ Person Families | 1 (0.6%) | $0 |
| Total | 153 (100.0%) | $50,515 |
Family Income by Number of Earners in Andover
The median family income in Andover is $50,515, with families comprising 3+ earners (18) having the highest median family income of $99,063, while families with no earners (51) have the lowest median family income of $25,461, accounting for 11.8% and 33.3% of families, respectively.
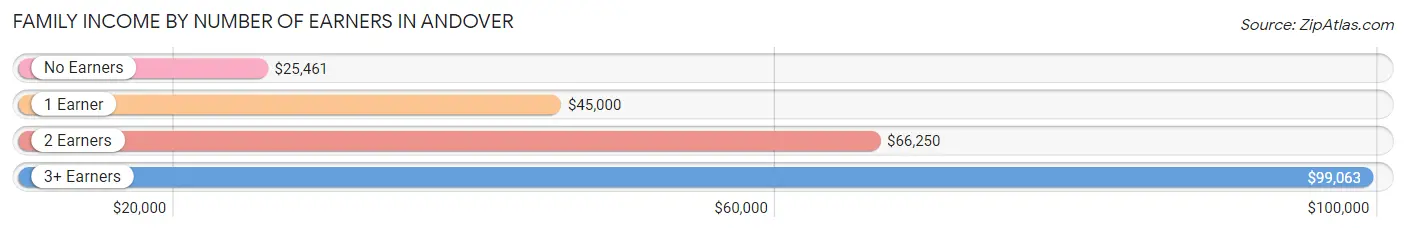
| Number of Earners | # Families | Median Income |
| No Earners | 51 (33.3%) | $25,461 |
| 1 Earner | 48 (31.4%) | $45,000 |
| 2 Earners | 36 (23.5%) | $66,250 |
| 3+ Earners | 18 (11.8%) | $99,063 |
| Total | 153 (100.0%) | $50,515 |
Household Income in Andover
Household Income Brackets in Andover
With 106 households falling in the category, the $50,000 to $74,999 income range is the most frequent in Andover, accounting for 36.9% of all households.
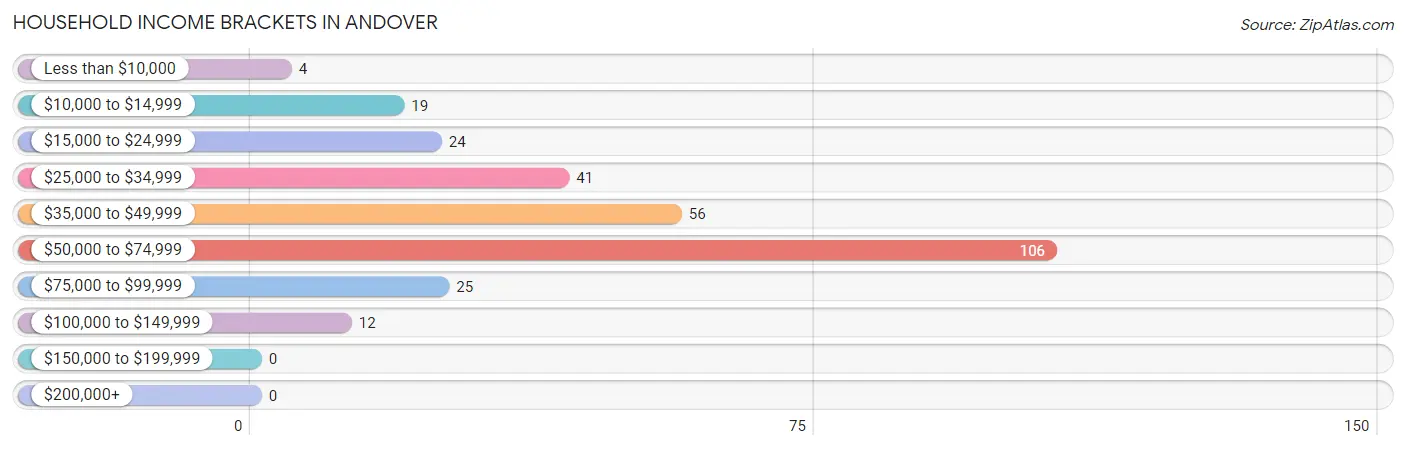
| Income Bracket | # Households | % Households |
| Less than $10,000 | 4 | 1.4% |
| $10,000 to $14,999 | 19 | 6.6% |
| $15,000 to $24,999 | 24 | 8.4% |
| $25,000 to $34,999 | 41 | 14.3% |
| $35,000 to $49,999 | 56 | 19.5% |
| $50,000 to $74,999 | 106 | 36.9% |
| $75,000 to $99,999 | 25 | 8.7% |
| $100,000 to $149,999 | 12 | 4.2% |
| $150,000 to $199,999 | 0 | 0.0% |
| $200,000+ | 0 | 0.0% |
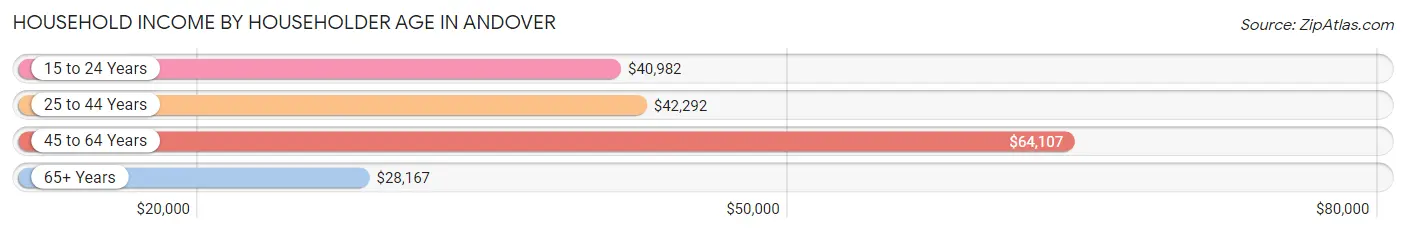
Household Income by Householder Age in Andover
The median household income in Andover is $47,404, with the highest median household income of $64,107 found in the 45 to 64 years age bracket for the primary householder. A total of 111 households (38.7%) fall into this category. Meanwhile, the 65+ years age bracket for the primary householder has the lowest median household income of $28,167, with 110 households (38.3%) in this group.
| Income Bracket | # Households | Median Income |
| 15 to 24 Years | 35 (12.2%) | $40,982 |
| 25 to 44 Years | 31 (10.8%) | $42,292 |
| 45 to 64 Years | 111 (38.7%) | $64,107 |
| 65+ Years | 110 (38.3%) | $28,167 |
| Total | 287 (100.0%) | $47,404 |
Poverty in Andover
Income Below Poverty by Sex and Age in Andover
With 18.8% poverty level for males and 23.0% for females among the residents of Andover, 12 to 14 year old males and 16 and 17 year old females are the most vulnerable to poverty, with 5 males (100.0%) and 6 females (100.0%) in their respective age groups living below the poverty level.
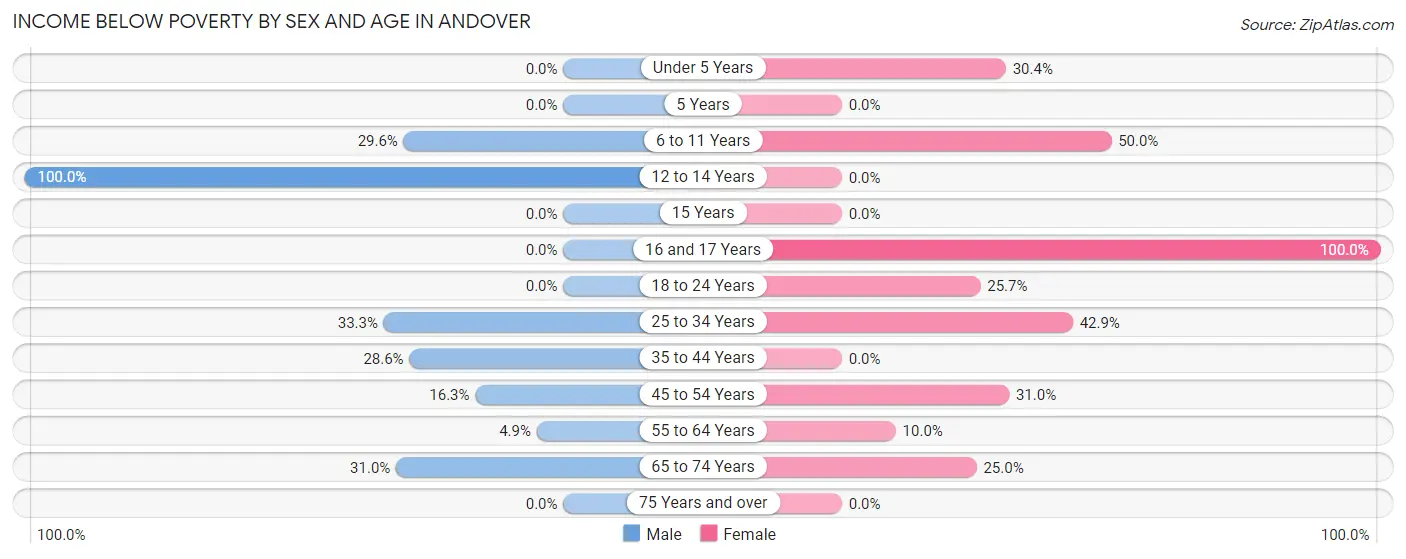
| Age Bracket | Male | Female |
| Under 5 Years | 0 (0.0%) | 7 (30.4%) |
| 5 Years | 0 (0.0%) | 0 (0.0%) |
| 6 to 11 Years | 8 (29.6%) | 4 (50.0%) |
| 12 to 14 Years | 5 (100.0%) | 0 (0.0%) |
| 15 Years | 0 (0.0%) | 0 (0.0%) |
| 16 and 17 Years | 0 (0.0%) | 6 (100.0%) |
| 18 to 24 Years | 0 (0.0%) | 9 (25.7%) |
| 25 to 34 Years | 11 (33.3%) | 12 (42.9%) |
| 35 to 44 Years | 4 (28.6%) | 0 (0.0%) |
| 45 to 54 Years | 8 (16.3%) | 9 (31.0%) |
| 55 to 64 Years | 3 (4.9%) | 6 (10.0%) |
| 65 to 74 Years | 18 (31.0%) | 14 (25.0%) |
| 75 Years and over | 0 (0.0%) | 0 (0.0%) |
| Total | 57 (18.8%) | 67 (23.0%) |
Income Above Poverty by Sex and Age in Andover
According to the poverty statistics in Andover, males aged 5 years and females aged 5 years are the age groups that are most secure financially, with 100.0% of males and 100.0% of females in these age groups living above the poverty line.
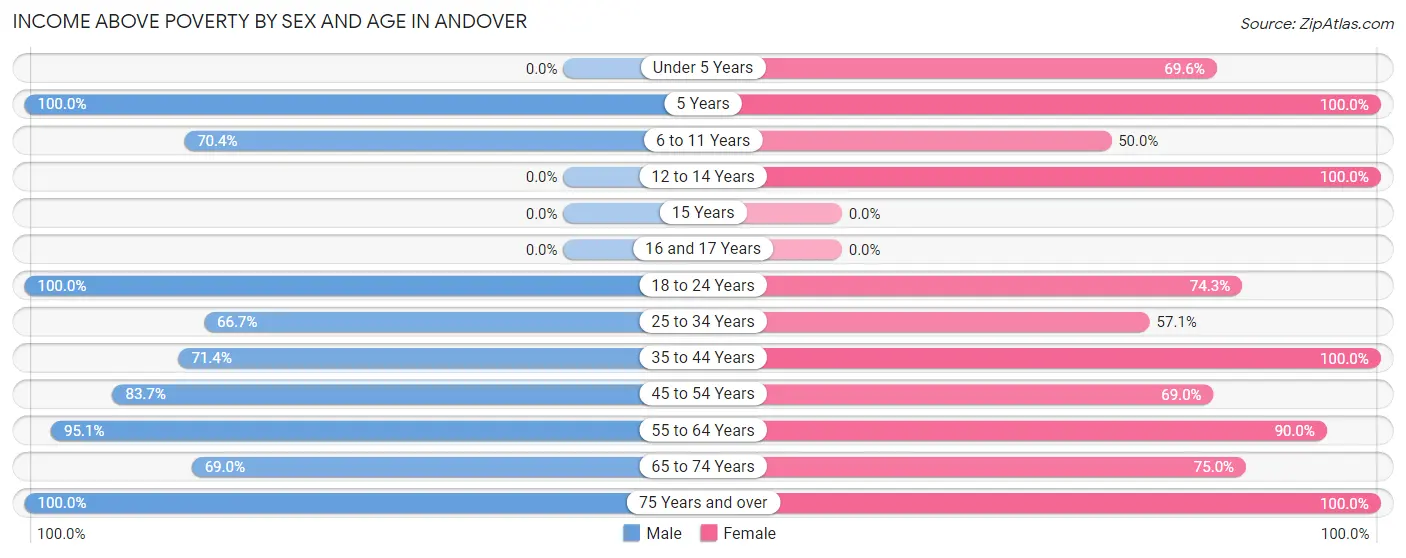
| Age Bracket | Male | Female |
| Under 5 Years | 0 (0.0%) | 16 (69.6%) |
| 5 Years | 22 (100.0%) | 13 (100.0%) |
| 6 to 11 Years | 19 (70.4%) | 4 (50.0%) |
| 12 to 14 Years | 0 (0.0%) | 4 (100.0%) |
| 15 Years | 0 (0.0%) | 0 (0.0%) |
| 16 and 17 Years | 0 (0.0%) | 0 (0.0%) |
| 18 to 24 Years | 20 (100.0%) | 26 (74.3%) |
| 25 to 34 Years | 22 (66.7%) | 16 (57.1%) |
| 35 to 44 Years | 10 (71.4%) | 17 (100.0%) |
| 45 to 54 Years | 41 (83.7%) | 20 (69.0%) |
| 55 to 64 Years | 58 (95.1%) | 54 (90.0%) |
| 65 to 74 Years | 40 (69.0%) | 42 (75.0%) |
| 75 Years and over | 14 (100.0%) | 12 (100.0%) |
| Total | 246 (81.2%) | 224 (77.0%) |
Income Below Poverty Among Married-Couple Families in Andover
The poverty statistics for married-couple families in Andover show that 9.9% or 10 of the total 101 families live below the poverty line. Families with no children have the highest poverty rate of 12.0%, comprising of 10 families. On the other hand, families with 1 or 2 children have the lowest poverty rate of 0.0%, which includes 0 families.
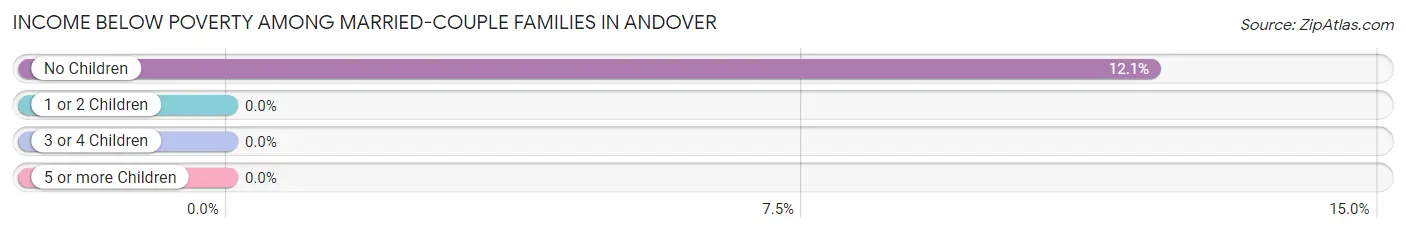
| Children | Above Poverty | Below Poverty |
| No Children | 73 (87.9%) | 10 (12.0%) |
| 1 or 2 Children | 17 (100.0%) | 0 (0.0%) |
| 3 or 4 Children | 1 (100.0%) | 0 (0.0%) |
| 5 or more Children | 0 (0.0%) | 0 (0.0%) |
| Total | 91 (90.1%) | 10 (9.9%) |
Income Below Poverty Among Single-Parent Households in Andover
According to the poverty data in Andover, 100.0% or 4 single-father households and 25.0% or 12 single-mother households are living below the poverty line. Among single-father households, those with 3 or 4 children have the highest poverty rate, with 4 households (100.0%) experiencing poverty. Likewise, among single-mother households, those with 1 or 2 children have the highest poverty rate, with 12 households (28.6%) falling below the poverty line.
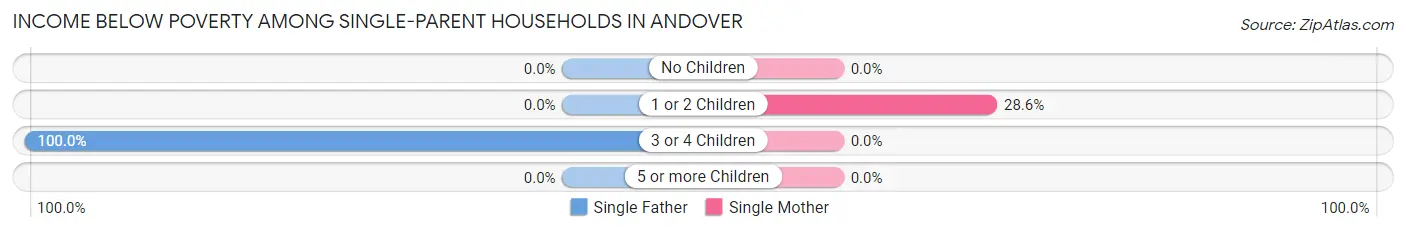
| Children | Single Father | Single Mother |
| No Children | 0 (0.0%) | 0 (0.0%) |
| 1 or 2 Children | 0 (0.0%) | 12 (28.6%) |
| 3 or 4 Children | 4 (100.0%) | 0 (0.0%) |
| 5 or more Children | 0 (0.0%) | 0 (0.0%) |
| Total | 4 (100.0%) | 12 (25.0%) |
Income Below Poverty Among Married-Couple vs Single-Parent Households in Andover
The poverty data for Andover shows that 10 of the married-couple family households (9.9%) and 16 of the single-parent households (30.8%) are living below the poverty level. Within the married-couple family households, those with no children have the highest poverty rate, with 10 households (12.0%) falling below the poverty line. Among the single-parent households, those with 3 or 4 children have the highest poverty rate, with 4 household (100.0%) living below poverty.
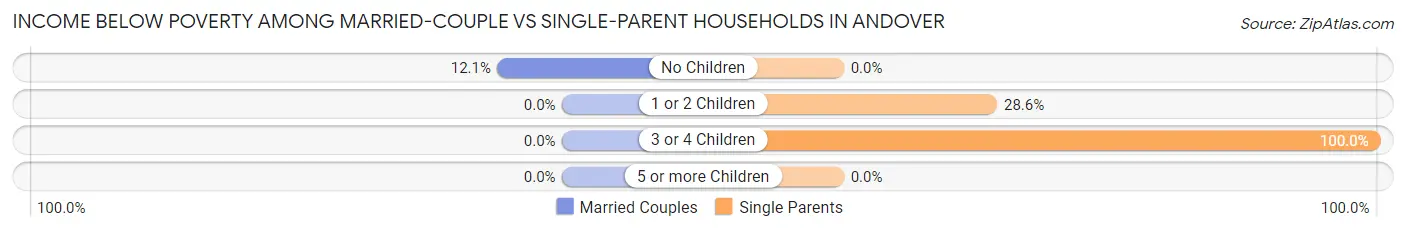
| Children | Married-Couple Families | Single-Parent Households |
| No Children | 10 (12.0%) | 0 (0.0%) |
| 1 or 2 Children | 0 (0.0%) | 12 (28.6%) |
| 3 or 4 Children | 0 (0.0%) | 4 (100.0%) |
| 5 or more Children | 0 (0.0%) | 0 (0.0%) |
| Total | 10 (9.9%) | 16 (30.8%) |
Race in Andover
The most populous races in Andover are White / Caucasian (689 | 97.3%), Black / African American (10 | 1.4%), and Two or more Races (9 | 1.3%).
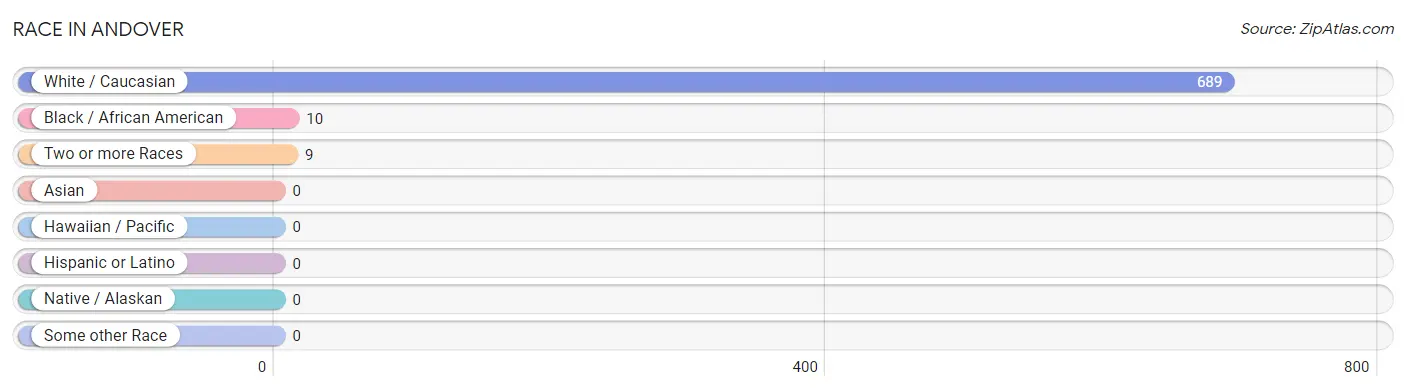
| Race | # Population | % Population |
| Asian | 0 | 0.0% |
| Black / African American | 10 | 1.4% |
| Hawaiian / Pacific | 0 | 0.0% |
| Hispanic or Latino | 0 | 0.0% |
| Native / Alaskan | 0 | 0.0% |
| White / Caucasian | 689 | 97.3% |
| Two or more Races | 9 | 1.3% |
| Some other Race | 0 | 0.0% |
| Total | 708 | 100.0% |
Ancestry in Andover
The most populous ancestries reported in Andover are American (161 | 22.7%), English (79 | 11.2%), German (79 | 11.2%), Irish (70 | 9.9%), and Dutch (38 | 5.4%), together accounting for 60.3% of all Andover residents.
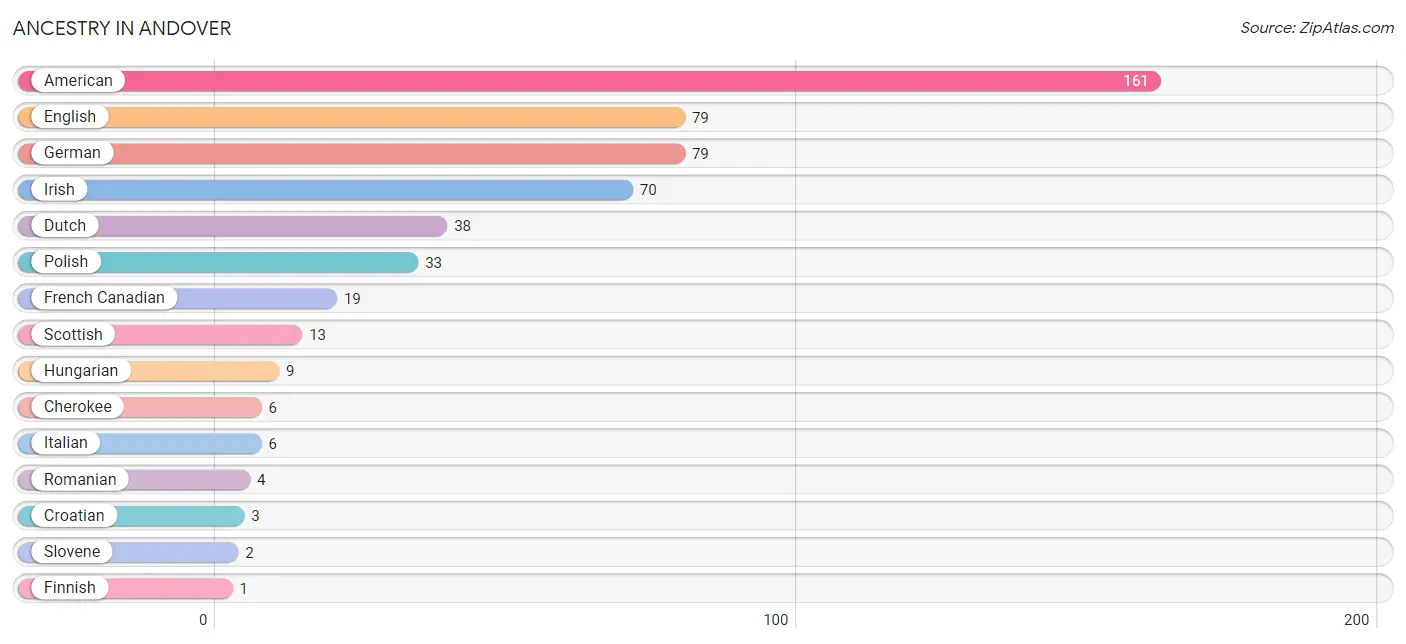
| Ancestry | # Population | % Population |
| American | 161 | 22.7% |
| Cherokee | 6 | 0.9% |
| Croatian | 3 | 0.4% |
| Dutch | 38 | 5.4% |
| English | 79 | 11.2% |
| Finnish | 1 | 0.1% |
| French Canadian | 19 | 2.7% |
| German | 79 | 11.2% |
| Hungarian | 9 | 1.3% |
| Irish | 70 | 9.9% |
| Italian | 6 | 0.9% |
| Polish | 33 | 4.7% |
| Romanian | 4 | 0.6% |
| Scotch-Irish | 1 | 0.1% |
| Scottish | 13 | 1.8% |
| Slovene | 2 | 0.3% | View All 16 Rows |
Immigrants in Andover

| Immigration Origin | # Population | % Population | View All 0 Rows |
Sex and Age in Andover
Sex and Age in Andover
The most populous age groups in Andover are 5 to 9 Years (48 | 13.9%) for men and 60 to 64 Years (50 | 13.8%) for women.
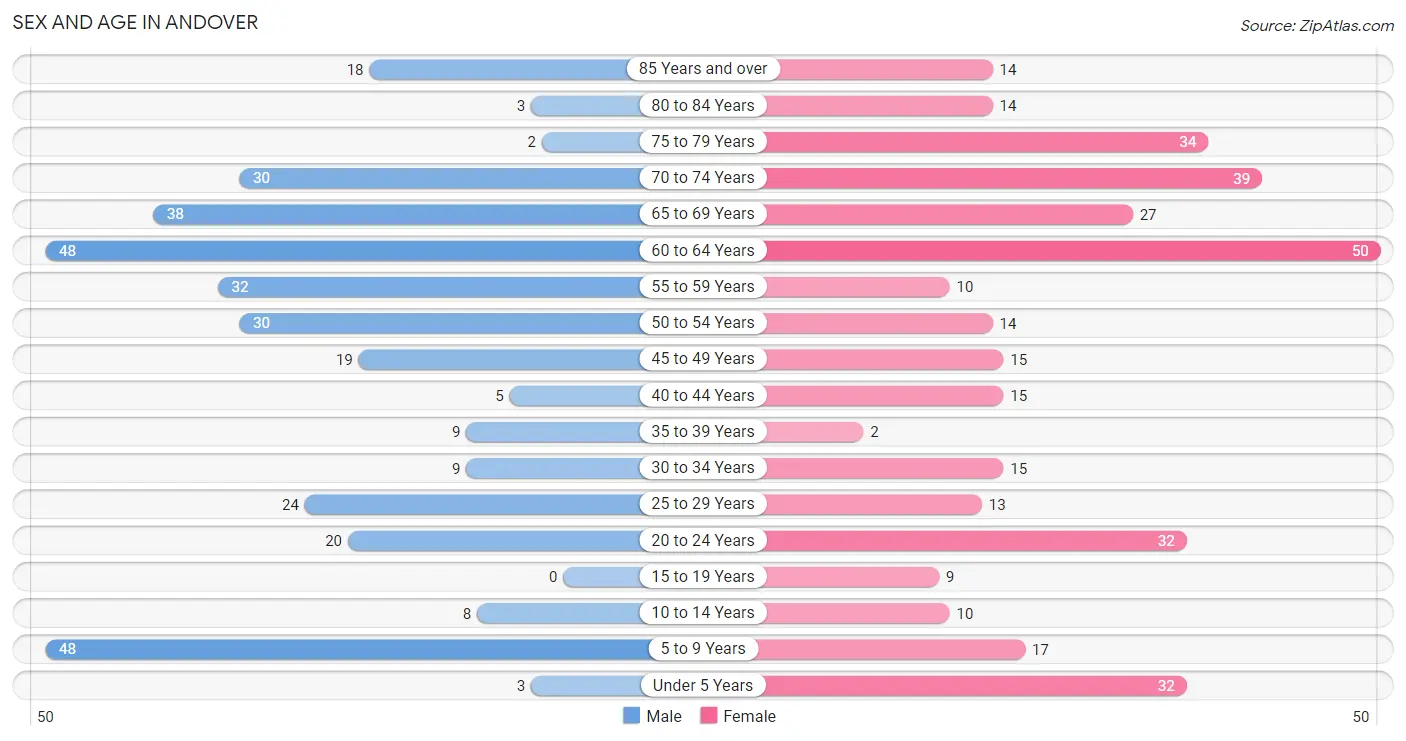
| Age Bracket | Male | Female |
| Under 5 Years | 3 (0.9%) | 32 (8.8%) |
| 5 to 9 Years | 48 (13.9%) | 17 (4.7%) |
| 10 to 14 Years | 8 (2.3%) | 10 (2.8%) |
| 15 to 19 Years | 0 (0.0%) | 9 (2.5%) |
| 20 to 24 Years | 20 (5.8%) | 32 (8.8%) |
| 25 to 29 Years | 24 (6.9%) | 13 (3.6%) |
| 30 to 34 Years | 9 (2.6%) | 15 (4.1%) |
| 35 to 39 Years | 9 (2.6%) | 2 (0.5%) |
| 40 to 44 Years | 5 (1.5%) | 15 (4.1%) |
| 45 to 49 Years | 19 (5.5%) | 15 (4.1%) |
| 50 to 54 Years | 30 (8.7%) | 14 (3.9%) |
| 55 to 59 Years | 32 (9.2%) | 10 (2.8%) |
| 60 to 64 Years | 48 (13.9%) | 50 (13.8%) |
| 65 to 69 Years | 38 (11.0%) | 27 (7.5%) |
| 70 to 74 Years | 30 (8.7%) | 39 (10.8%) |
| 75 to 79 Years | 2 (0.6%) | 34 (9.4%) |
| 80 to 84 Years | 3 (0.9%) | 14 (3.9%) |
| 85 Years and over | 18 (5.2%) | 14 (3.9%) |
| Total | 346 (100.0%) | 362 (100.0%) |
Families and Households in Andover
Median Family Size in Andover
The median family size in Andover is 2.67 persons per family, with single male/father families (4 | 2.6%) accounting for the largest median family size of 4.5 persons per family. On the other hand, single female/mother families (48 | 31.4%) represent the smallest median family size with 2.56 persons per family.
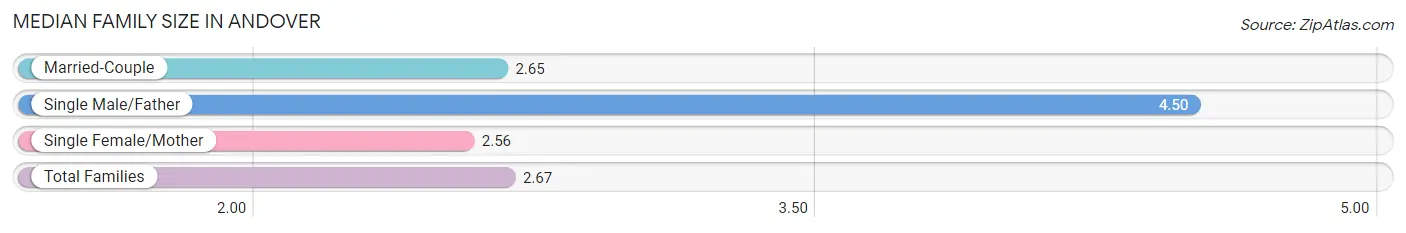
| Family Type | # Families | Family Size |
| Married-Couple | 101 (66.0%) | 2.65 |
| Single Male/Father | 4 (2.6%) | 4.50 |
| Single Female/Mother | 48 (31.4%) | 2.56 |
| Total Families | 153 (100.0%) | 2.67 |
Median Household Size in Andover
The median household size in Andover is 2.13 persons per household, with single male/father households (4 | 1.4%) accounting for the largest median household size of 5.5 persons per household. non-family households (134 | 46.7%) represent the smallest median household size with 1.29 persons per household.
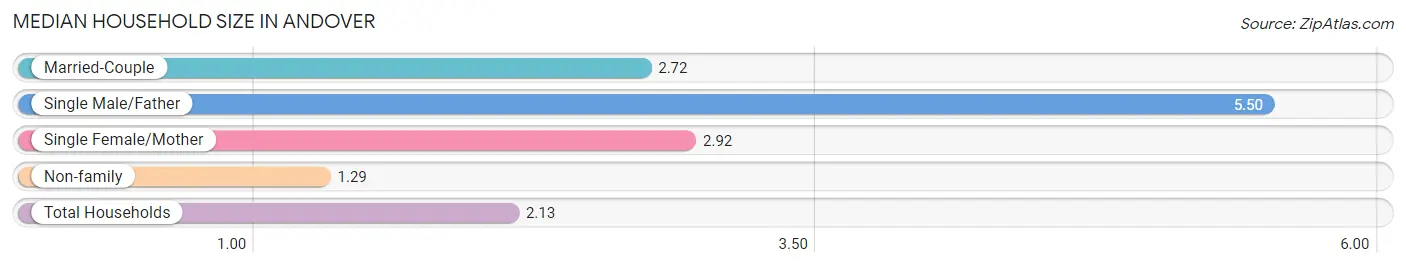
| Household Type | # Households | Household Size |
| Married-Couple | 101 (35.2%) | 2.72 |
| Single Male/Father | 4 (1.4%) | 5.50 |
| Single Female/Mother | 48 (16.7%) | 2.92 |
| Non-family | 134 (46.7%) | 1.29 |
| Total Households | 287 (100.0%) | 2.13 |
Household Size by Marriage Status in Andover
Out of a total of 287 households in Andover, 153 (53.3%) are family households, while 134 (46.7%) are nonfamily households. The most numerous type of family households are 2-person households, comprising 76, and the most common type of nonfamily households are 1-person households, comprising 108.
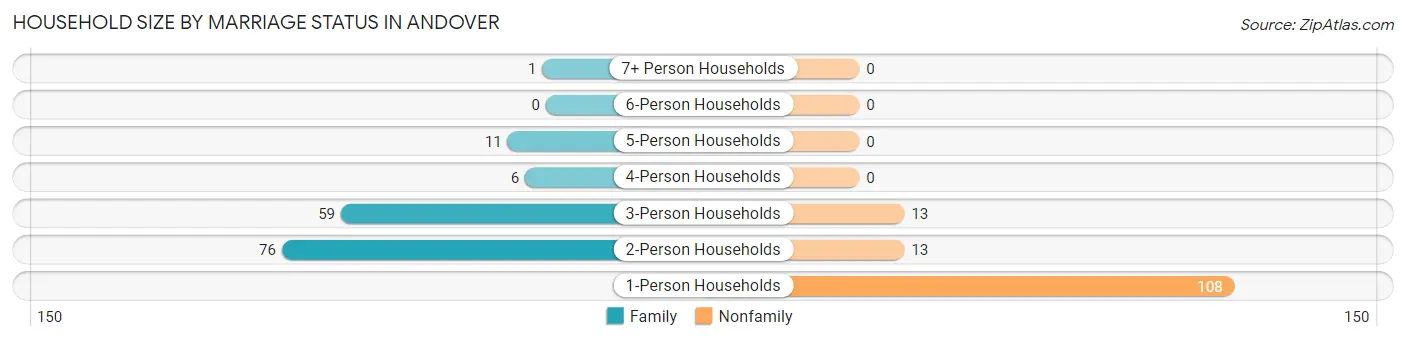
| Household Size | Family Households | Nonfamily Households |
| 1-Person Households | - | 108 (37.6%) |
| 2-Person Households | 76 (26.5%) | 13 (4.5%) |
| 3-Person Households | 59 (20.6%) | 13 (4.5%) |
| 4-Person Households | 6 (2.1%) | 0 (0.0%) |
| 5-Person Households | 11 (3.8%) | 0 (0.0%) |
| 6-Person Households | 0 (0.0%) | 0 (0.0%) |
| 7+ Person Households | 1 (0.4%) | 0 (0.0%) |
| Total | 153 (53.3%) | 134 (46.7%) |
Female Fertility in Andover
Fertility by Age in Andover
Average fertility rate in Andover is 79.0 births per 1,000 women. Women in the age bracket of 20 to 34 years have the highest fertility rate with 133.0 births per 1,000 women. Women in the age bracket of 20 to 34 years acount for 100.0% of all women with births.
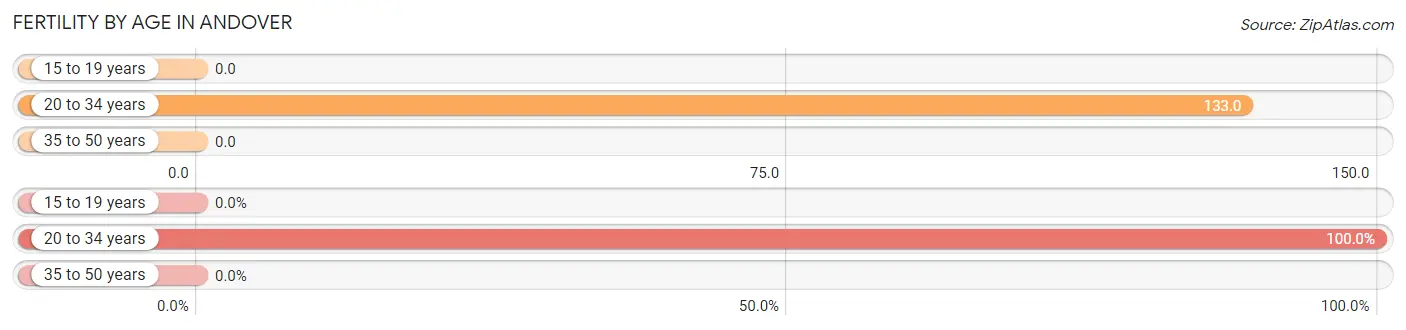
| Age Bracket | Women with Births | Births / 1,000 Women |
| 15 to 19 years | 0 (0.0%) | 0.0 |
| 20 to 34 years | 8 (100.0%) | 133.0 |
| 35 to 50 years | 0 (0.0%) | 0.0 |
| Total | 8 (100.0%) | 79.0 |
Fertility by Age by Marriage Status in Andover
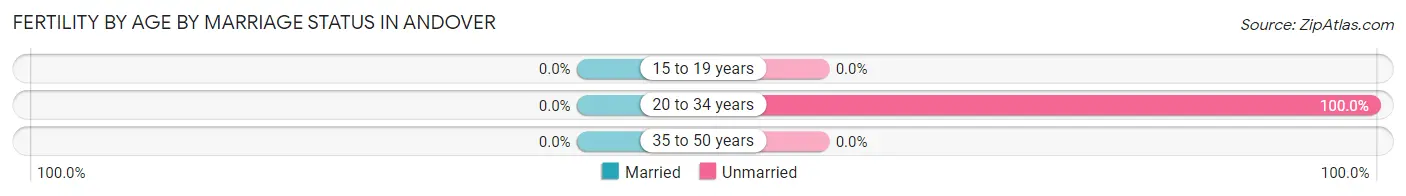
| Age Bracket | Married | Unmarried |
| 15 to 19 years | 0 (0.0%) | 0 (0.0%) |
| 20 to 34 years | 0 (0.0%) | 8 (100.0%) |
| 35 to 50 years | 0 (0.0%) | 0 (0.0%) |
| Total | 0 (0.0%) | 8 (100.0%) |
Fertility by Education in Andover
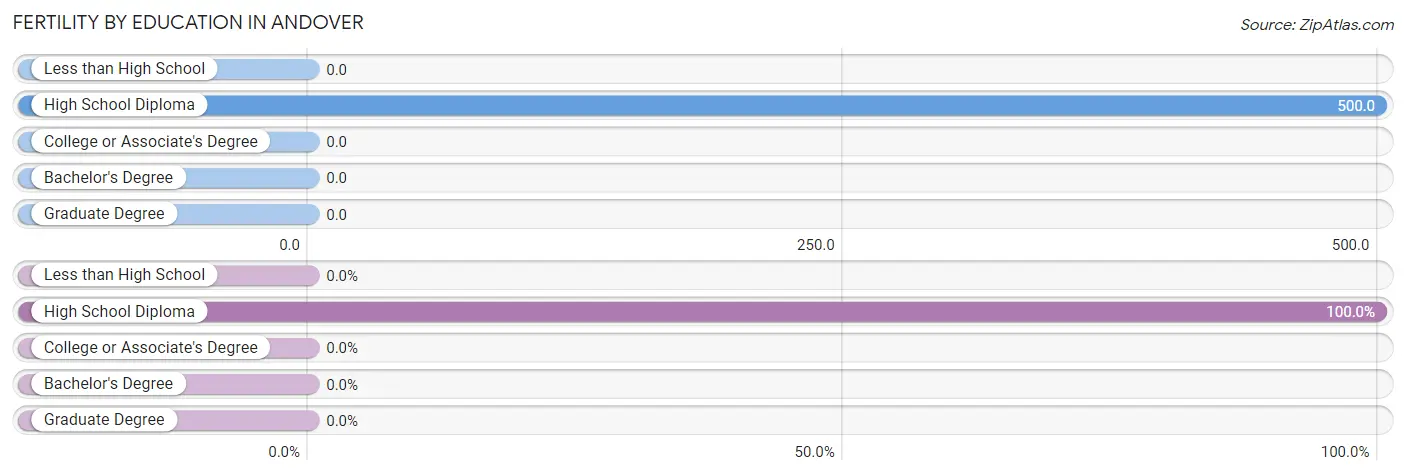
| Educational Attainment | Women with Births | Births / 1,000 Women |
| Less than High School | 0 (0.0%) | 0.0 |
| High School Diploma | 8 (100.0%) | 500.0 |
| College or Associate's Degree | 0 (0.0%) | 0.0 |
| Bachelor's Degree | 0 (0.0%) | 0.0 |
| Graduate Degree | 0 (0.0%) | 0.0 |
| Total | 8 (100.0%) | 79.0 |
Fertility by Education by Marriage Status in Andover
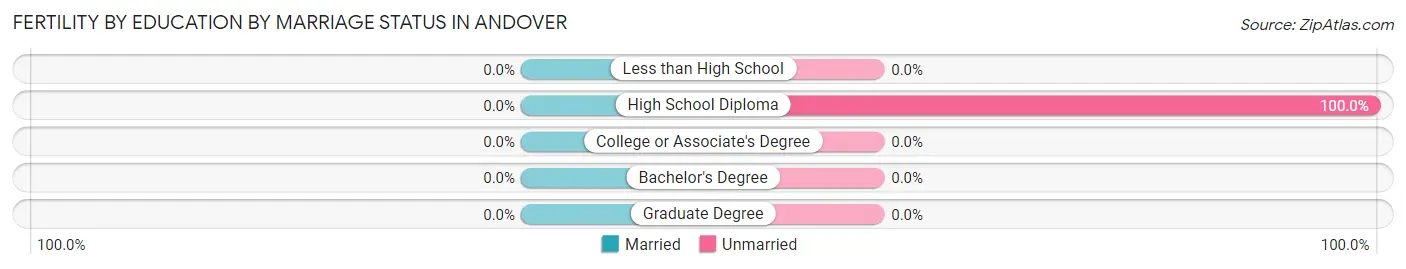
| Educational Attainment | Married | Unmarried |
| Less than High School | 0 (0.0%) | 0 (0.0%) |
| High School Diploma | 0 (0.0%) | 8 (100.0%) |
| College or Associate's Degree | 0 (0.0%) | 0 (0.0%) |
| Bachelor's Degree | 0 (0.0%) | 0 (0.0%) |
| Graduate Degree | 0 (0.0%) | 0 (0.0%) |
| Total | 0 (0.0%) | 8 (100.0%) |
Employment Characteristics in Andover
Employment by Class of Employer in Andover
Among the 261 employed individuals in Andover, private company employees (199 | 76.2%), local government employees (34 | 13.0%), and self-employed (incorporated) (18 | 6.9%) make up the most common classes of employment.
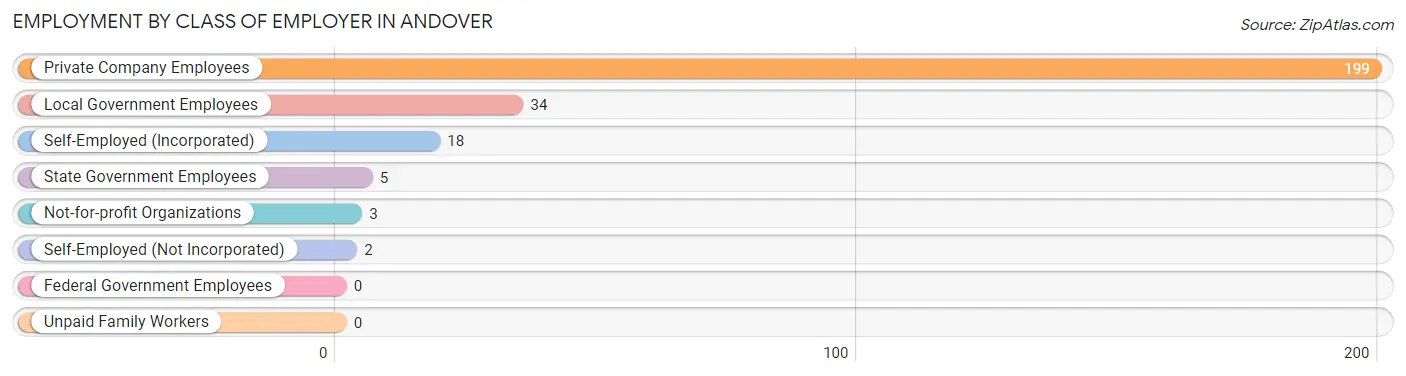
| Employer Class | # Employees | % Employees |
| Private Company Employees | 199 | 76.2% |
| Self-Employed (Incorporated) | 18 | 6.9% |
| Self-Employed (Not Incorporated) | 2 | 0.8% |
| Not-for-profit Organizations | 3 | 1.1% |
| Local Government Employees | 34 | 13.0% |
| State Government Employees | 5 | 1.9% |
| Federal Government Employees | 0 | 0.0% |
| Unpaid Family Workers | 0 | 0.0% |
| Total | 261 | 100.0% |
Employment Status by Age in Andover
According to the labor force statistics for Andover, out of the total population over 16 years of age (590), 46.4% or 274 individuals are in the labor force, with 4.7% or 13 of them unemployed. The age group with the highest labor force participation rate is 16 to 19 years, with 100.0% or 9 individuals in the labor force. Within the labor force, the 35 to 44 years age range has the highest percentage of unemployed individuals, with 24.0% or 6 of them being unemployed.
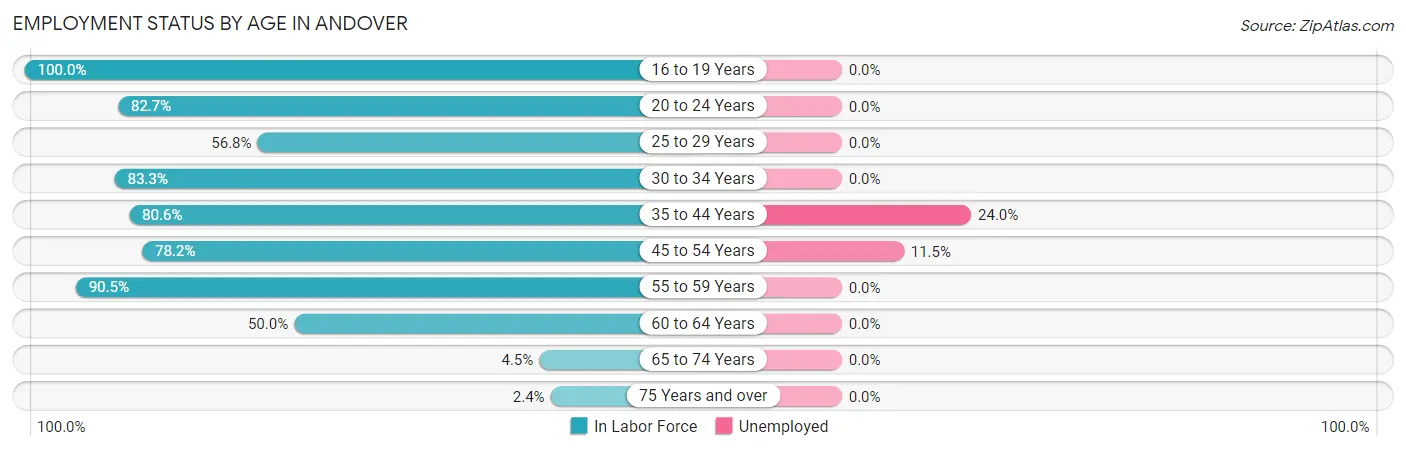
| Age Bracket | In Labor Force | Unemployed |
| 16 to 19 Years | 9 (100.0%) | 0 (0.0%) |
| 20 to 24 Years | 43 (82.7%) | 0 (0.0%) |
| 25 to 29 Years | 21 (56.8%) | 0 (0.0%) |
| 30 to 34 Years | 20 (83.3%) | 0 (0.0%) |
| 35 to 44 Years | 25 (80.6%) | 6 (24.0%) |
| 45 to 54 Years | 61 (78.2%) | 7 (11.5%) |
| 55 to 59 Years | 38 (90.5%) | 0 (0.0%) |
| 60 to 64 Years | 49 (50.0%) | 0 (0.0%) |
| 65 to 74 Years | 6 (4.5%) | 0 (0.0%) |
| 75 Years and over | 2 (2.4%) | 0 (0.0%) |
| Total | 274 (46.4%) | 13 (4.7%) |
Employment Status by Educational Attainment in Andover
According to labor force statistics for Andover, 69.0% of individuals (214) out of the total population between 25 and 64 years of age (310) are in the labor force, with 6.1% or 13 of them being unemployed. The group with the highest labor force participation rate are those with the educational attainment of bachelor's degree or higher, with 86.7% or 26 individuals in the labor force. Within the labor force, individuals with college / associate degree education have the highest percentage of unemployment, with 8.0% or 6 of them being unemployed.
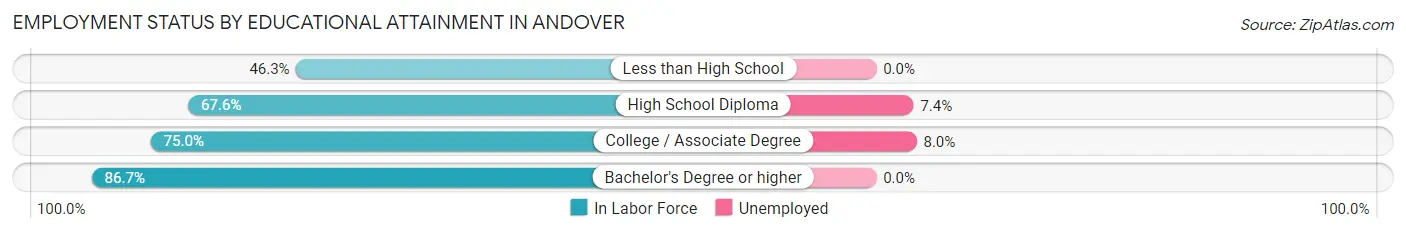
| Educational Attainment | In Labor Force | Unemployed |
| Less than High School | 19 (46.3%) | 0 (0.0%) |
| High School Diploma | 94 (67.6%) | 10 (7.4%) |
| College / Associate Degree | 75 (75.0%) | 8 (8.0%) |
| Bachelor's Degree or higher | 26 (86.7%) | 0 (0.0%) |
| Total | 214 (69.0%) | 19 (6.1%) |
Employment Occupations by Sex in Andover
Management, Business, Science and Arts Occupations
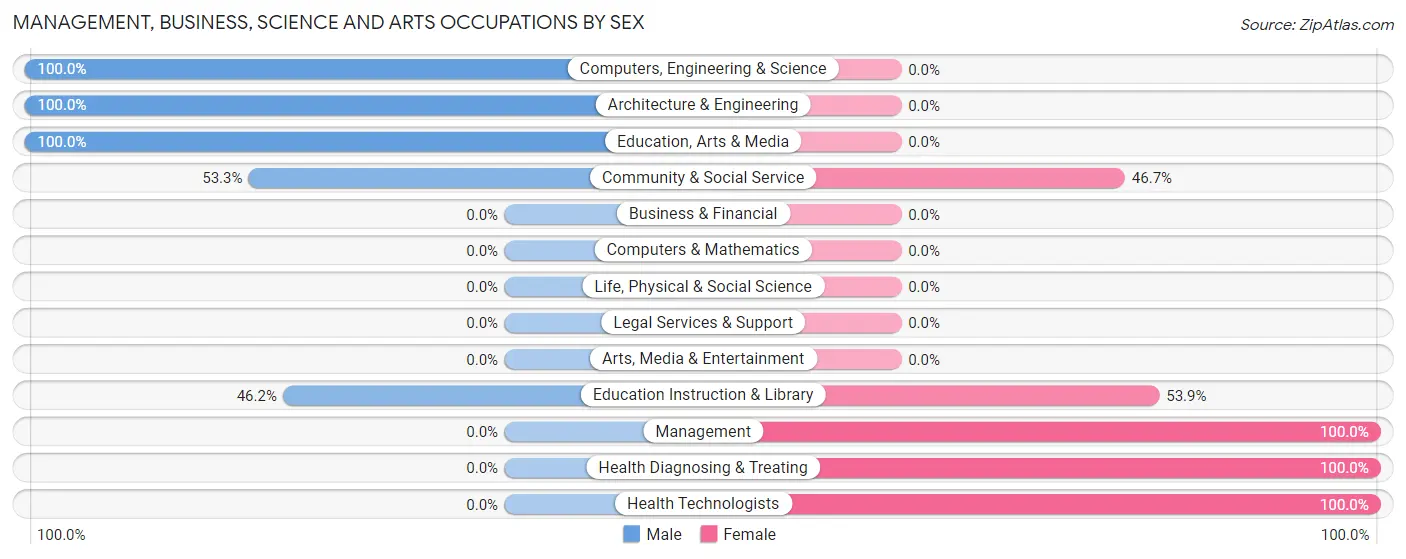
The most common Management, Business, Science and Arts occupations in Andover are Community & Social Service (15 | 5.8%), Education Instruction & Library (13 | 5.0%), Management (10 | 3.8%), Computers, Engineering & Science (10 | 3.8%), and Architecture & Engineering (10 | 3.8%).
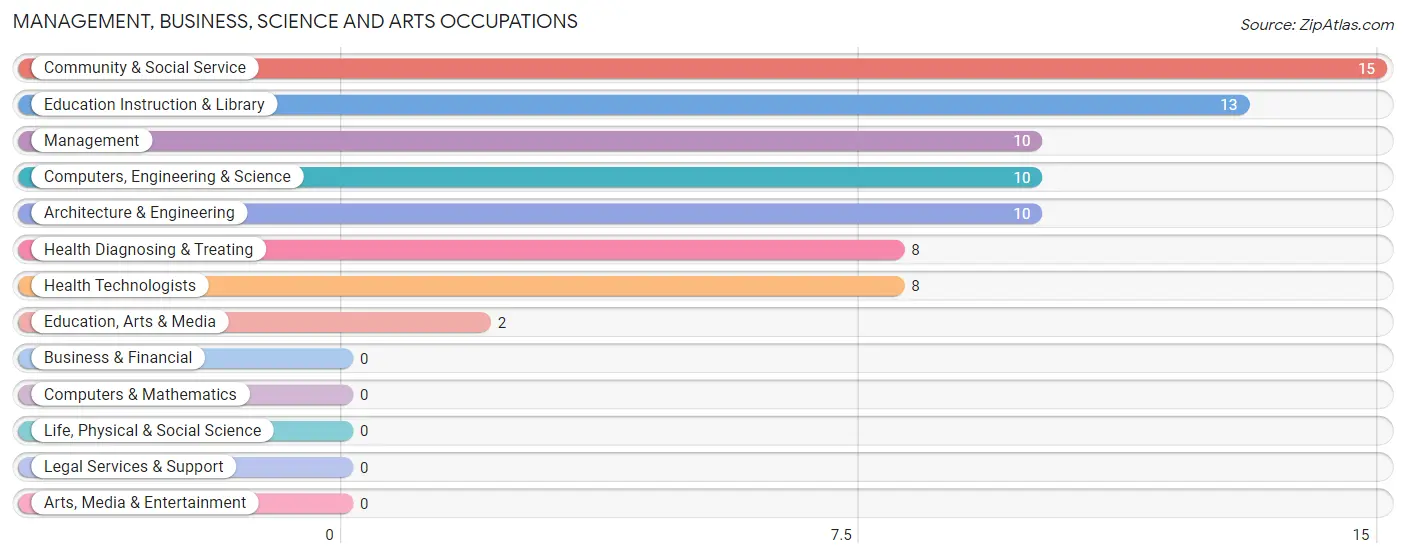
Management, Business, Science and Arts Occupations by Sex
Within the Management, Business, Science and Arts occupations in Andover, the most male-oriented occupations are Computers, Engineering & Science (100.0%), Architecture & Engineering (100.0%), and Education, Arts & Media (100.0%), while the most female-oriented occupations are Management (100.0%), Health Diagnosing & Treating (100.0%), and Health Technologists (100.0%).
| Occupation | Male | Female |
| Management | 0 (0.0%) | 10 (100.0%) |
| Business & Financial | 0 (0.0%) | 0 (0.0%) |
| Computers, Engineering & Science | 10 (100.0%) | 0 (0.0%) |
| Computers & Mathematics | 0 (0.0%) | 0 (0.0%) |
| Architecture & Engineering | 10 (100.0%) | 0 (0.0%) |
| Life, Physical & Social Science | 0 (0.0%) | 0 (0.0%) |
| Community & Social Service | 8 (53.3%) | 7 (46.7%) |
| Education, Arts & Media | 2 (100.0%) | 0 (0.0%) |
| Legal Services & Support | 0 (0.0%) | 0 (0.0%) |
| Education Instruction & Library | 6 (46.2%) | 7 (53.8%) |
| Arts, Media & Entertainment | 0 (0.0%) | 0 (0.0%) |
| Health Diagnosing & Treating | 0 (0.0%) | 8 (100.0%) |
| Health Technologists | 0 (0.0%) | 8 (100.0%) |
| Total (Category) | 18 (41.9%) | 25 (58.1%) |
| Total (Overall) | 144 (55.2%) | 117 (44.8%) |
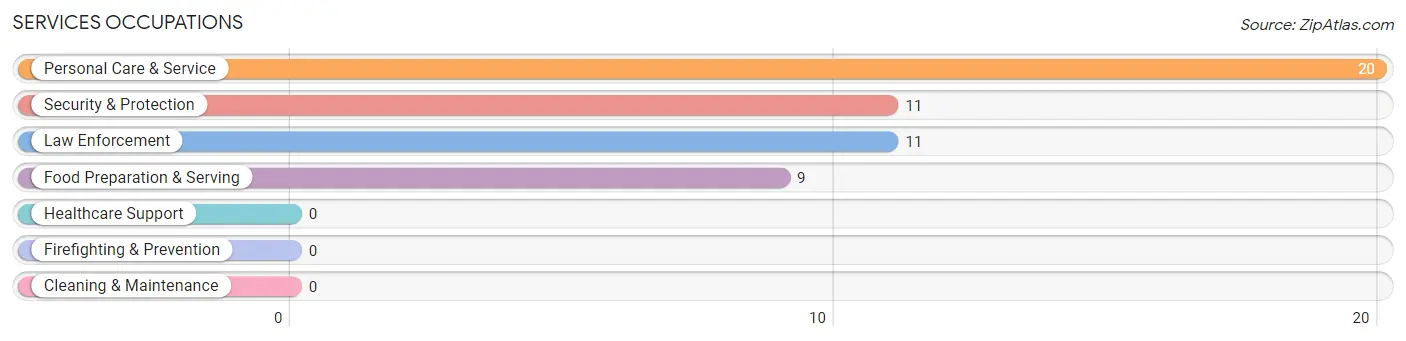
Services Occupations
The most common Services occupations in Andover are Personal Care & Service (20 | 7.7%), Security & Protection (11 | 4.2%), Law Enforcement (11 | 4.2%), and Food Preparation & Serving (9 | 3.5%).
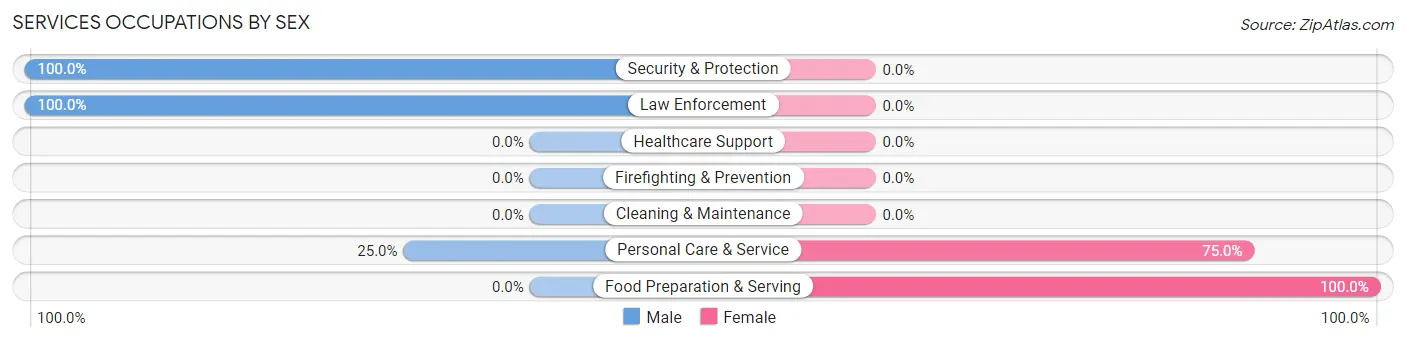
Services Occupations by Sex
Within the Services occupations in Andover, the most male-oriented occupations are Security & Protection (100.0%), Law Enforcement (100.0%), and Personal Care & Service (25.0%), while the most female-oriented occupations are Food Preparation & Serving (100.0%), and Personal Care & Service (75.0%).
| Occupation | Male | Female |
| Healthcare Support | 0 (0.0%) | 0 (0.0%) |
| Security & Protection | 11 (100.0%) | 0 (0.0%) |
| Firefighting & Prevention | 0 (0.0%) | 0 (0.0%) |
| Law Enforcement | 11 (100.0%) | 0 (0.0%) |
| Food Preparation & Serving | 0 (0.0%) | 9 (100.0%) |
| Cleaning & Maintenance | 0 (0.0%) | 0 (0.0%) |
| Personal Care & Service | 5 (25.0%) | 15 (75.0%) |
| Total (Category) | 16 (40.0%) | 24 (60.0%) |
| Total (Overall) | 144 (55.2%) | 117 (44.8%) |
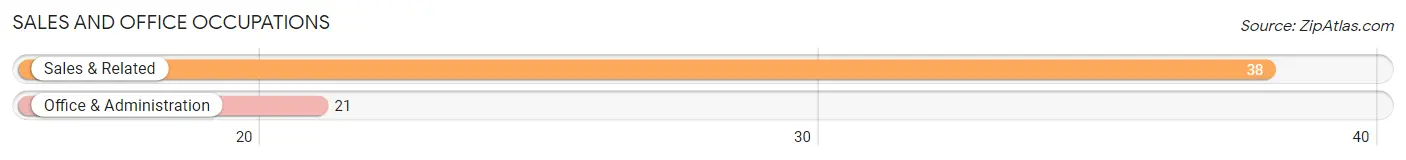
Sales and Office Occupations
The most common Sales and Office occupations in Andover are Sales & Related (38 | 14.6%), and Office & Administration (21 | 8.1%).
Sales and Office Occupations by Sex
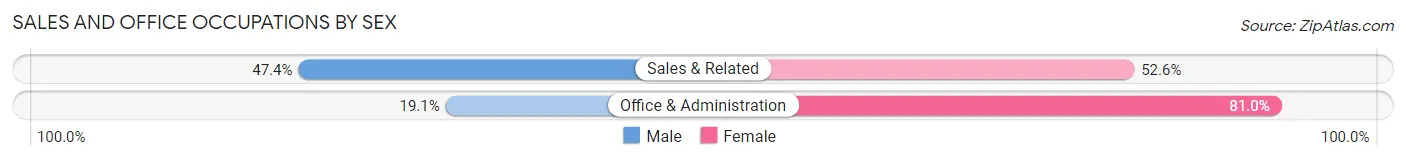
| Occupation | Male | Female |
| Sales & Related | 18 (47.4%) | 20 (52.6%) |
| Office & Administration | 4 (19.1%) | 17 (80.9%) |
| Total (Category) | 22 (37.3%) | 37 (62.7%) |
| Total (Overall) | 144 (55.2%) | 117 (44.8%) |
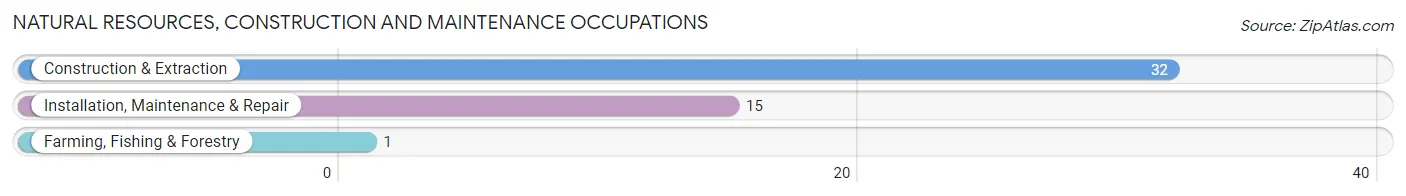
Natural Resources, Construction and Maintenance Occupations
The most common Natural Resources, Construction and Maintenance occupations in Andover are Construction & Extraction (32 | 12.3%), Installation, Maintenance & Repair (15 | 5.8%), and Farming, Fishing & Forestry (1 | 0.4%).
Natural Resources, Construction and Maintenance Occupations by Sex
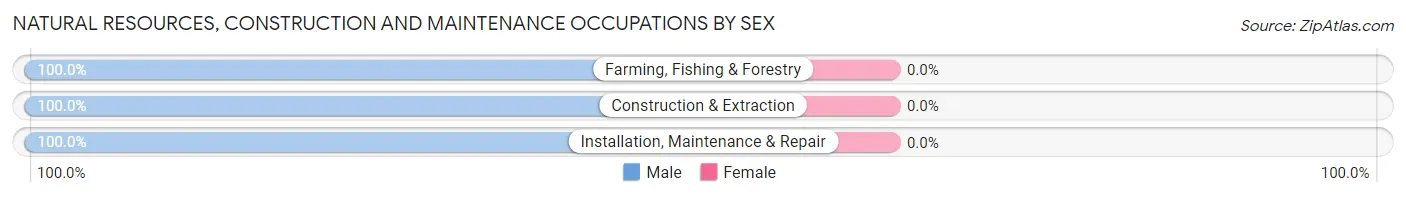
| Occupation | Male | Female |
| Farming, Fishing & Forestry | 1 (100.0%) | 0 (0.0%) |
| Construction & Extraction | 32 (100.0%) | 0 (0.0%) |
| Installation, Maintenance & Repair | 15 (100.0%) | 0 (0.0%) |
| Total (Category) | 48 (100.0%) | 0 (0.0%) |
| Total (Overall) | 144 (55.2%) | 117 (44.8%) |
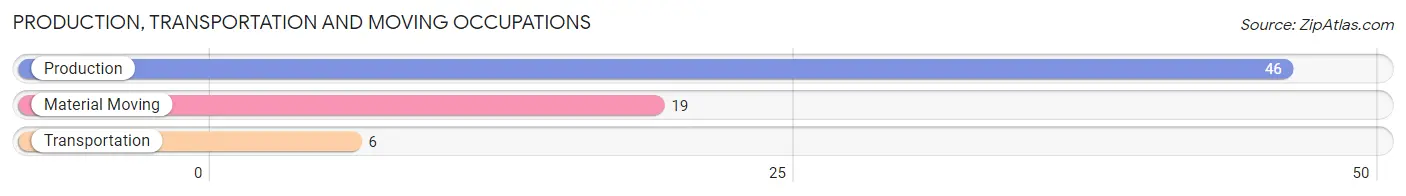
Production, Transportation and Moving Occupations
The most common Production, Transportation and Moving occupations in Andover are Production (46 | 17.6%), Material Moving (19 | 7.3%), and Transportation (6 | 2.3%).
Production, Transportation and Moving Occupations by Sex
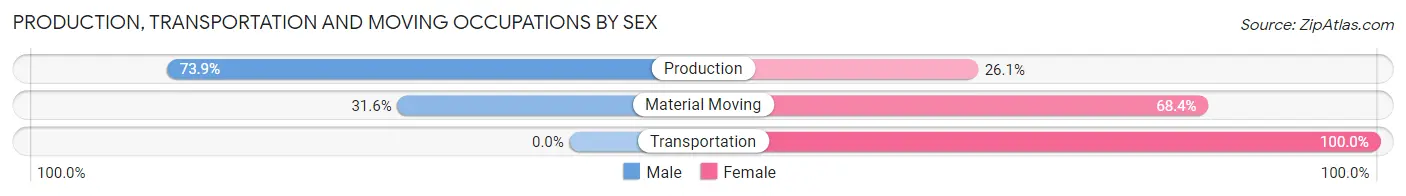
| Occupation | Male | Female |
| Production | 34 (73.9%) | 12 (26.1%) |
| Transportation | 0 (0.0%) | 6 (100.0%) |
| Material Moving | 6 (31.6%) | 13 (68.4%) |
| Total (Category) | 40 (56.3%) | 31 (43.7%) |
| Total (Overall) | 144 (55.2%) | 117 (44.8%) |
Employment Industries by Sex in Andover
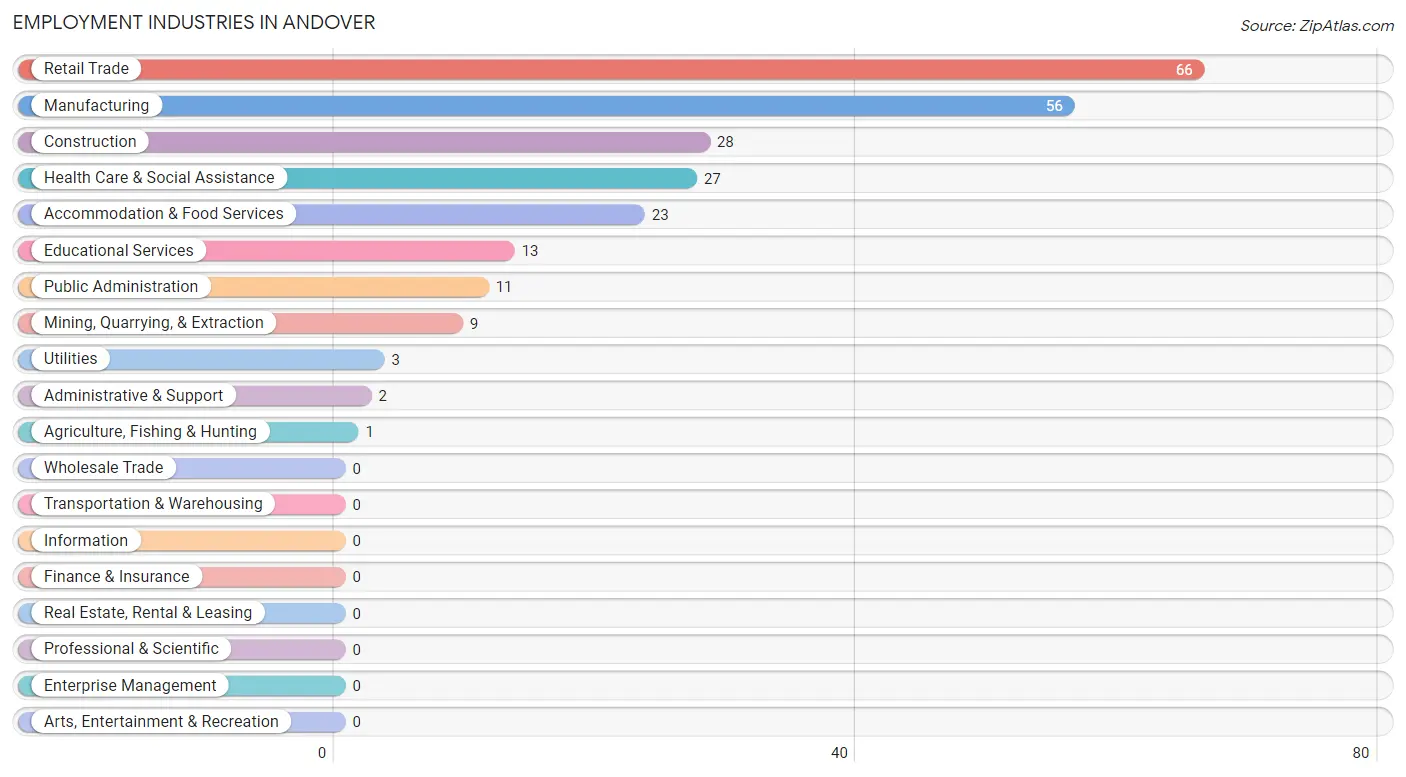
Employment Industries in Andover
The major employment industries in Andover include Retail Trade (66 | 25.3%), Manufacturing (56 | 21.5%), Construction (28 | 10.7%), Health Care & Social Assistance (27 | 10.3%), and Accommodation & Food Services (23 | 8.8%).
Employment Industries by Sex in Andover
The Andover industries that see more men than women are Agriculture, Fishing & Hunting (100.0%), Construction (100.0%), and Public Administration (100.0%), whereas the industries that tend to have a higher number of women are Utilities (100.0%), Administrative & Support (100.0%), and Accommodation & Food Services (100.0%).
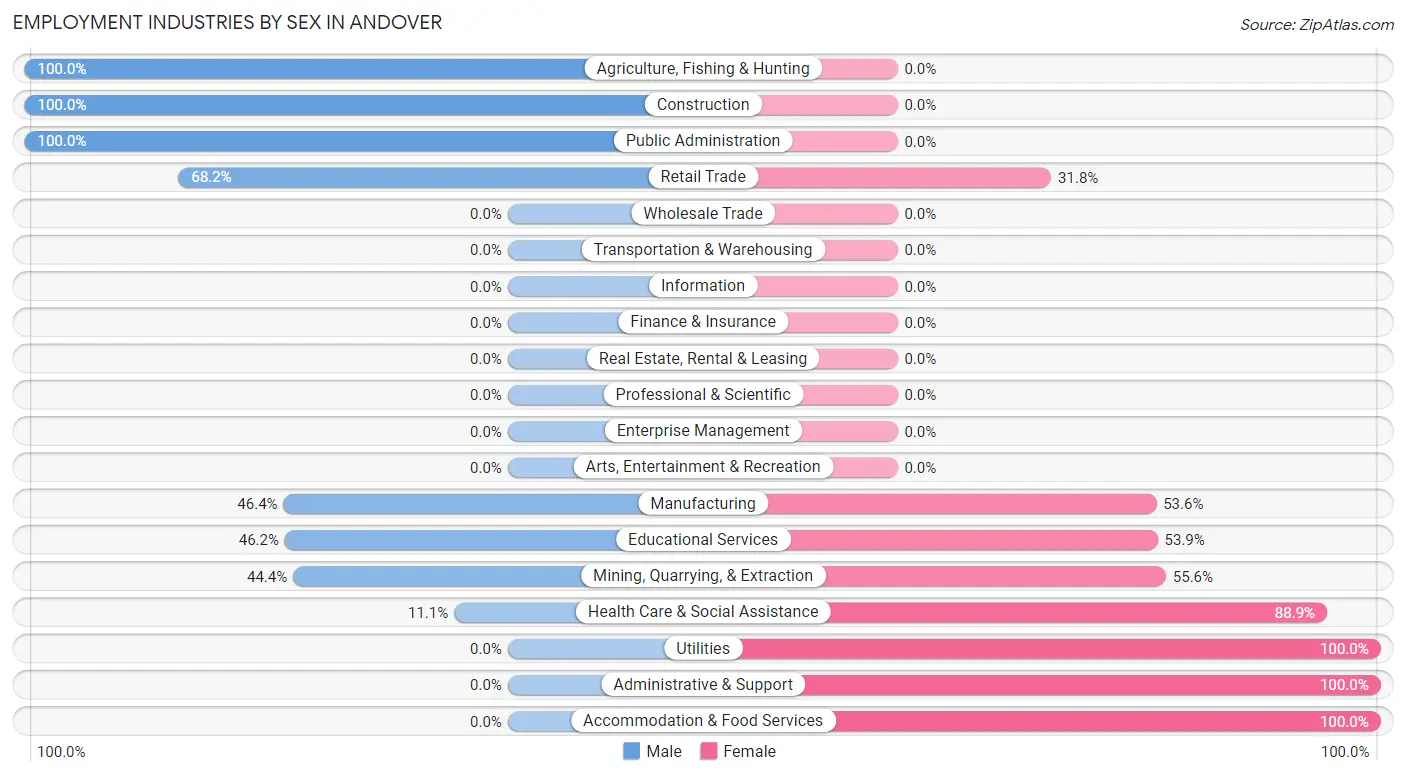
| Industry | Male | Female |
| Agriculture, Fishing & Hunting | 1 (100.0%) | 0 (0.0%) |
| Mining, Quarrying, & Extraction | 4 (44.4%) | 5 (55.6%) |
| Construction | 28 (100.0%) | 0 (0.0%) |
| Manufacturing | 26 (46.4%) | 30 (53.6%) |
| Wholesale Trade | 0 (0.0%) | 0 (0.0%) |
| Retail Trade | 45 (68.2%) | 21 (31.8%) |
| Transportation & Warehousing | 0 (0.0%) | 0 (0.0%) |
| Utilities | 0 (0.0%) | 3 (100.0%) |
| Information | 0 (0.0%) | 0 (0.0%) |
| Finance & Insurance | 0 (0.0%) | 0 (0.0%) |
| Real Estate, Rental & Leasing | 0 (0.0%) | 0 (0.0%) |
| Professional & Scientific | 0 (0.0%) | 0 (0.0%) |
| Enterprise Management | 0 (0.0%) | 0 (0.0%) |
| Administrative & Support | 0 (0.0%) | 2 (100.0%) |
| Educational Services | 6 (46.2%) | 7 (53.8%) |
| Health Care & Social Assistance | 3 (11.1%) | 24 (88.9%) |
| Arts, Entertainment & Recreation | 0 (0.0%) | 0 (0.0%) |
| Accommodation & Food Services | 0 (0.0%) | 23 (100.0%) |
| Public Administration | 11 (100.0%) | 0 (0.0%) |
| Total | 144 (55.2%) | 117 (44.8%) |
Education in Andover
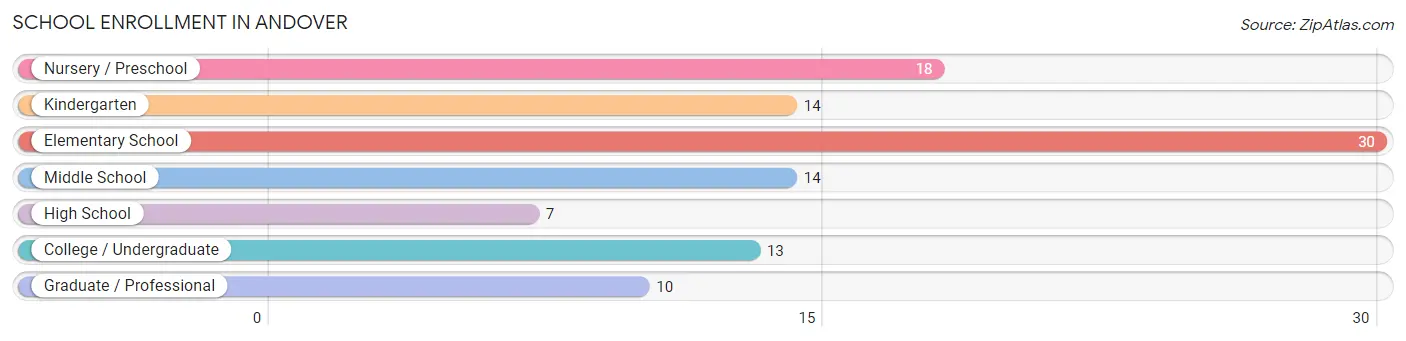
School Enrollment in Andover
The most common levels of schooling among the 106 students in Andover are elementary school (30 | 28.3%), nursery / preschool (18 | 17.0%), and kindergarten (14 | 13.2%).
| School Level | # Students | % Students |
| Nursery / Preschool | 18 | 17.0% |
| Kindergarten | 14 | 13.2% |
| Elementary School | 30 | 28.3% |
| Middle School | 14 | 13.2% |
| High School | 7 | 6.6% |
| College / Undergraduate | 13 | 12.3% |
| Graduate / Professional | 10 | 9.4% |
| Total | 106 | 100.0% |
School Enrollment by Age by Funding Source in Andover
Out of a total of 106 students who are enrolled in schools in Andover, 3 (2.8%) attend a private institution, while the remaining 103 (97.2%) are enrolled in public schools. The age group of 5 to 9 year old has the highest likelihood of being enrolled in private schools, with 3 (5.6% in the age bracket) enrolled. Conversely, the age group of 3 to 4 year olds has the lowest likelihood of being enrolled in a private school, with 5 (100.0% in the age bracket) attending a public institution.
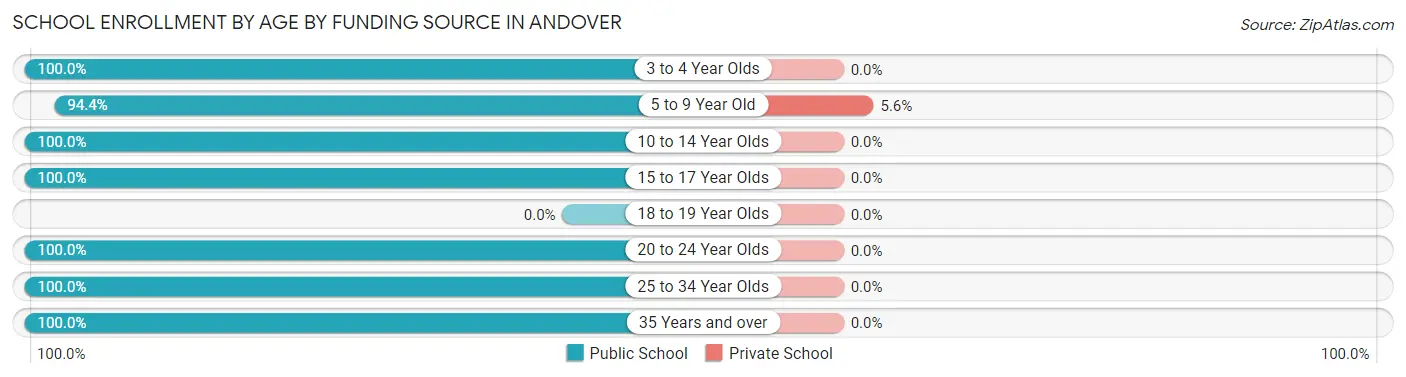
| Age Bracket | Public School | Private School |
| 3 to 4 Year Olds | 5 (100.0%) | 0 (0.0%) |
| 5 to 9 Year Old | 51 (94.4%) | 3 (5.6%) |
| 10 to 14 Year Olds | 18 (100.0%) | 0 (0.0%) |
| 15 to 17 Year Olds | 6 (100.0%) | 0 (0.0%) |
| 18 to 19 Year Olds | 0 (0.0%) | 0 (0.0%) |
| 20 to 24 Year Olds | 11 (100.0%) | 0 (0.0%) |
| 25 to 34 Year Olds | 10 (100.0%) | 0 (0.0%) |
| 35 Years and over | 2 (100.0%) | 0 (0.0%) |
| Total | 103 (97.2%) | 3 (2.8%) |
Educational Attainment by Field of Study in Andover
Psychology (10 | 31.2%), education (9 | 28.1%), arts & humanities (5 | 15.6%), science & technology (3 | 9.4%), and business (3 | 9.4%) are the most common fields of study among 32 individuals in Andover who have obtained a bachelor's degree or higher.
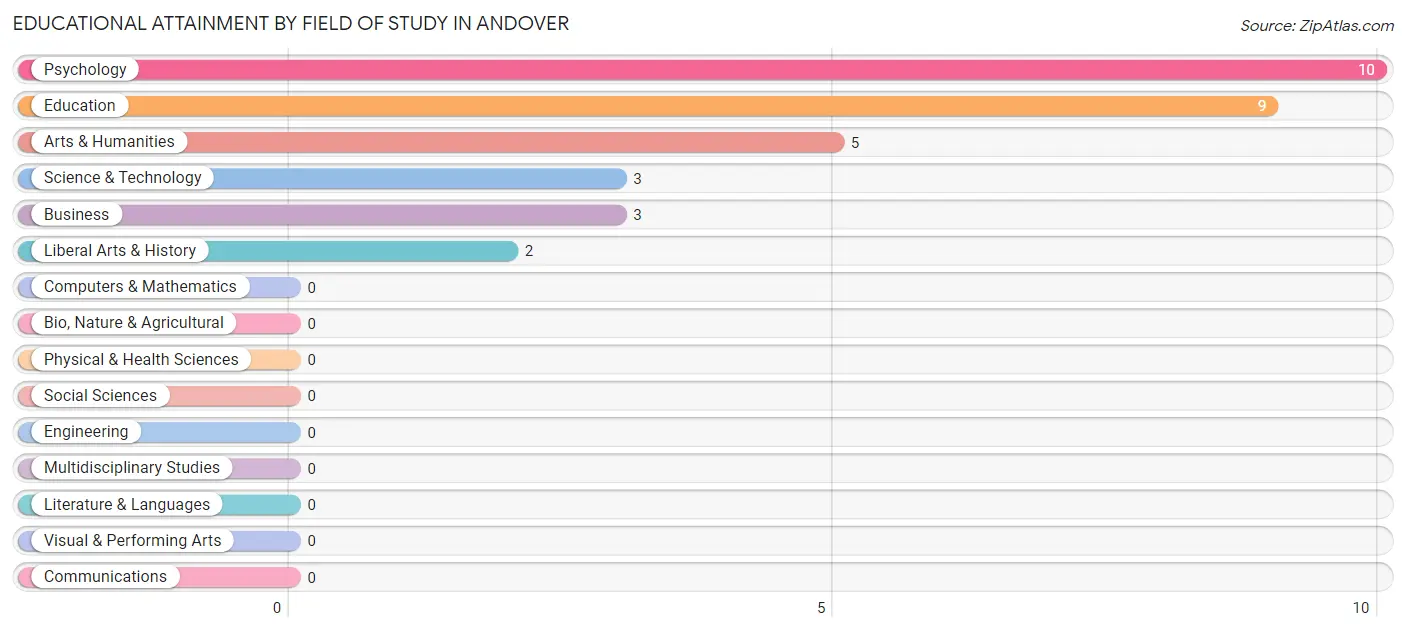
| Field of Study | # Graduates | % Graduates |
| Computers & Mathematics | 0 | 0.0% |
| Bio, Nature & Agricultural | 0 | 0.0% |
| Physical & Health Sciences | 0 | 0.0% |
| Psychology | 10 | 31.2% |
| Social Sciences | 0 | 0.0% |
| Engineering | 0 | 0.0% |
| Multidisciplinary Studies | 0 | 0.0% |
| Science & Technology | 3 | 9.4% |
| Business | 3 | 9.4% |
| Education | 9 | 28.1% |
| Literature & Languages | 0 | 0.0% |
| Liberal Arts & History | 2 | 6.2% |
| Visual & Performing Arts | 0 | 0.0% |
| Communications | 0 | 0.0% |
| Arts & Humanities | 5 | 15.6% |
| Total | 32 | 100.0% |
Transportation & Commute in Andover
Vehicle Availability by Sex in Andover
The most prevalent vehicle ownership categories in Andover are males with 2 vehicles (87, accounting for 60.4%) and females with 2 vehicles (42, making up 74.4%).
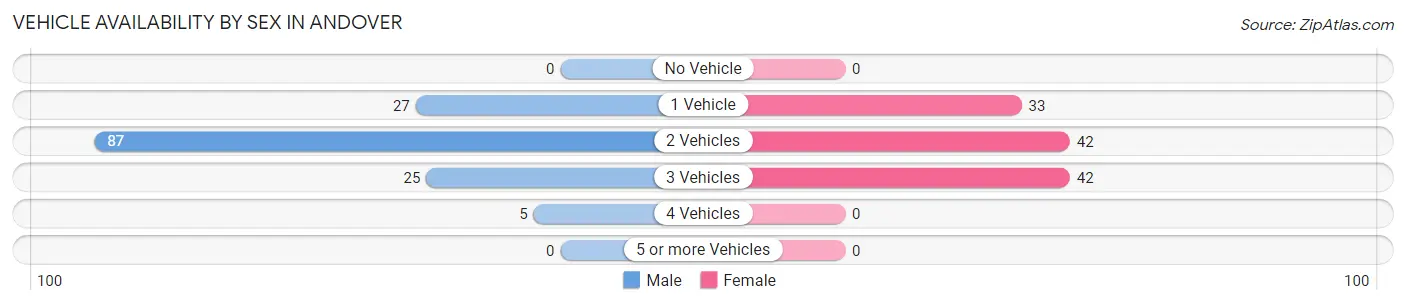
| Vehicles Available | Male | Female |
| No Vehicle | 0 (0.0%) | 0 (0.0%) |
| 1 Vehicle | 27 (18.8%) | 33 (28.2%) |
| 2 Vehicles | 87 (60.4%) | 42 (35.9%) |
| 3 Vehicles | 25 (17.4%) | 42 (35.9%) |
| 4 Vehicles | 5 (3.5%) | 0 (0.0%) |
| 5 or more Vehicles | 0 (0.0%) | 0 (0.0%) |
| Total | 144 (100.0%) | 117 (100.0%) |
Commute Time in Andover
The most frequently occuring commute durations in Andover are 5 to 9 minutes (57 commuters, 22.1%), 30 to 34 minutes (39 commuters, 15.1%), and less than 5 minutes (32 commuters, 12.4%).
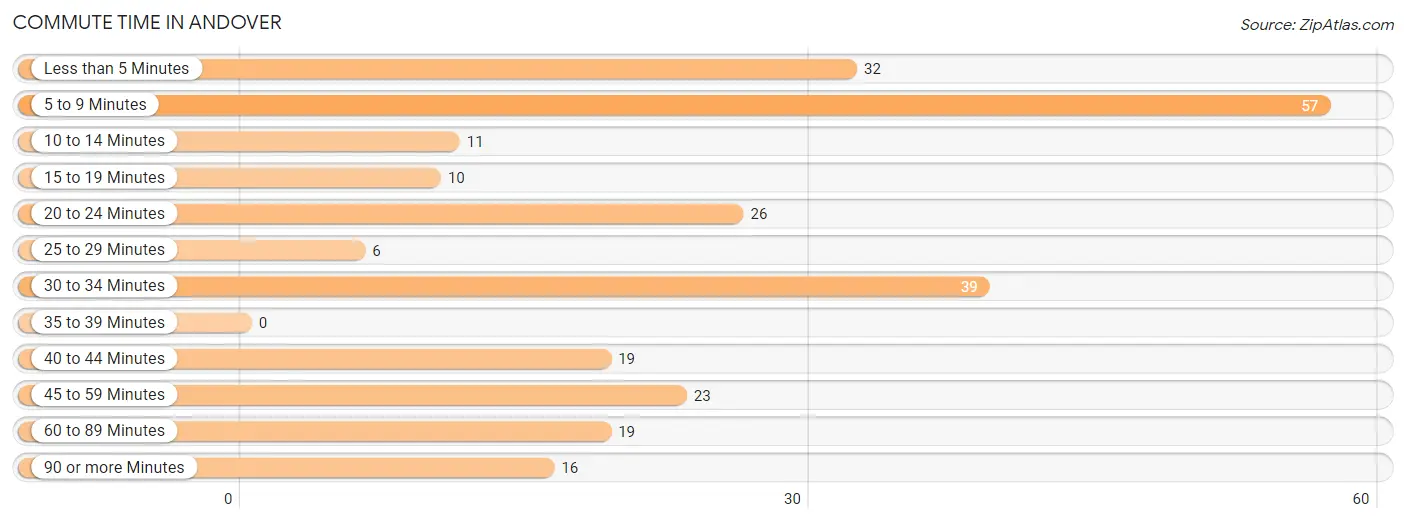
| Commute Time | # Commuters | % Commuters |
| Less than 5 Minutes | 32 | 12.4% |
| 5 to 9 Minutes | 57 | 22.1% |
| 10 to 14 Minutes | 11 | 4.3% |
| 15 to 19 Minutes | 10 | 3.9% |
| 20 to 24 Minutes | 26 | 10.1% |
| 25 to 29 Minutes | 6 | 2.3% |
| 30 to 34 Minutes | 39 | 15.1% |
| 35 to 39 Minutes | 0 | 0.0% |
| 40 to 44 Minutes | 19 | 7.4% |
| 45 to 59 Minutes | 23 | 8.9% |
| 60 to 89 Minutes | 19 | 7.4% |
| 90 or more Minutes | 16 | 6.2% |
Commute Time by Sex in Andover
The most common commute times in Andover are 20 to 24 minutes (24 commuters, 17.0%) for males and 5 to 9 minutes (38 commuters, 32.5%) for females.
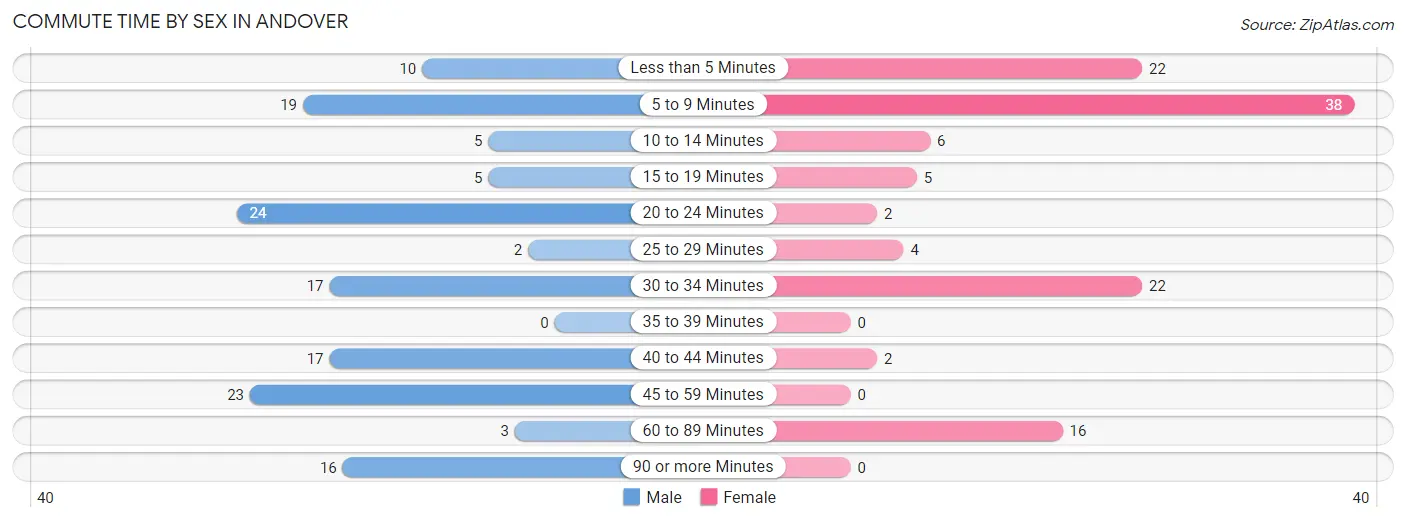
| Commute Time | Male | Female |
| Less than 5 Minutes | 10 (7.1%) | 22 (18.8%) |
| 5 to 9 Minutes | 19 (13.5%) | 38 (32.5%) |
| 10 to 14 Minutes | 5 (3.5%) | 6 (5.1%) |
| 15 to 19 Minutes | 5 (3.5%) | 5 (4.3%) |
| 20 to 24 Minutes | 24 (17.0%) | 2 (1.7%) |
| 25 to 29 Minutes | 2 (1.4%) | 4 (3.4%) |
| 30 to 34 Minutes | 17 (12.1%) | 22 (18.8%) |
| 35 to 39 Minutes | 0 (0.0%) | 0 (0.0%) |
| 40 to 44 Minutes | 17 (12.1%) | 2 (1.7%) |
| 45 to 59 Minutes | 23 (16.3%) | 0 (0.0%) |
| 60 to 89 Minutes | 3 (2.1%) | 16 (13.7%) |
| 90 or more Minutes | 16 (11.4%) | 0 (0.0%) |
Time of Departure to Work by Sex in Andover
The most frequent times of departure to work in Andover are 7:00 AM to 7:29 AM (39, 27.7%) for males and 9:00 AM to 9:59 AM (28, 23.9%) for females.
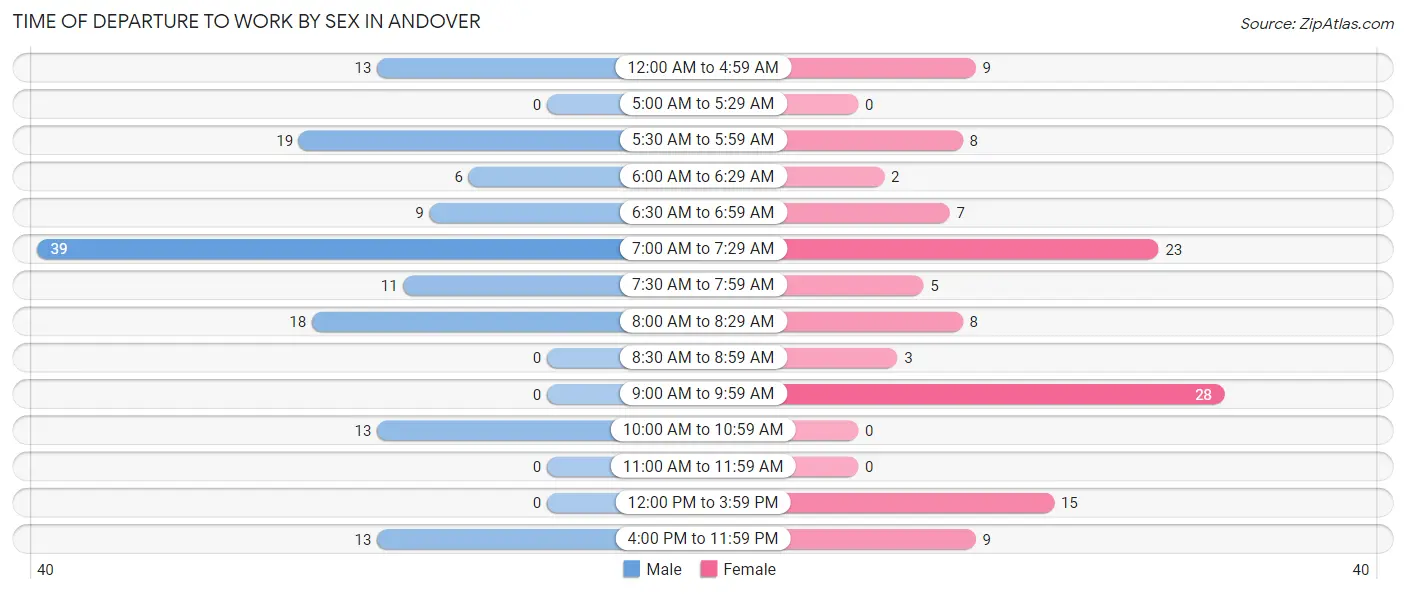
| Time of Departure | Male | Female |
| 12:00 AM to 4:59 AM | 13 (9.2%) | 9 (7.7%) |
| 5:00 AM to 5:29 AM | 0 (0.0%) | 0 (0.0%) |
| 5:30 AM to 5:59 AM | 19 (13.5%) | 8 (6.8%) |
| 6:00 AM to 6:29 AM | 6 (4.3%) | 2 (1.7%) |
| 6:30 AM to 6:59 AM | 9 (6.4%) | 7 (6.0%) |
| 7:00 AM to 7:29 AM | 39 (27.7%) | 23 (19.7%) |
| 7:30 AM to 7:59 AM | 11 (7.8%) | 5 (4.3%) |
| 8:00 AM to 8:29 AM | 18 (12.8%) | 8 (6.8%) |
| 8:30 AM to 8:59 AM | 0 (0.0%) | 3 (2.6%) |
| 9:00 AM to 9:59 AM | 0 (0.0%) | 28 (23.9%) |
| 10:00 AM to 10:59 AM | 13 (9.2%) | 0 (0.0%) |
| 11:00 AM to 11:59 AM | 0 (0.0%) | 0 (0.0%) |
| 12:00 PM to 3:59 PM | 0 (0.0%) | 15 (12.8%) |
| 4:00 PM to 11:59 PM | 13 (9.2%) | 9 (7.7%) |
| Total | 141 (100.0%) | 117 (100.0%) |
Housing Occupancy in Andover
Occupancy by Ownership in Andover
Of the total 287 dwellings in Andover, owner-occupied units account for 182 (63.4%), while renter-occupied units make up 105 (36.6%).
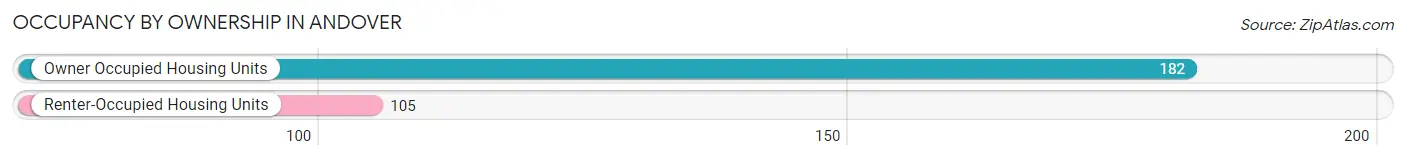
| Occupancy | # Housing Units | % Housing Units |
| Owner Occupied Housing Units | 182 | 63.4% |
| Renter-Occupied Housing Units | 105 | 36.6% |
| Total Occupied Housing Units | 287 | 100.0% |
Occupancy by Household Size in Andover
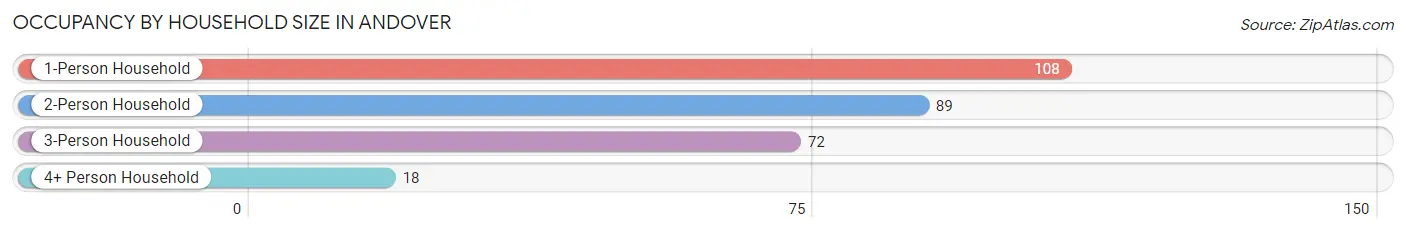
| Household Size | # Housing Units | % Housing Units |
| 1-Person Household | 108 | 37.6% |
| 2-Person Household | 89 | 31.0% |
| 3-Person Household | 72 | 25.1% |
| 4+ Person Household | 18 | 6.3% |
| Total Housing Units | 287 | 100.0% |
Occupancy by Ownership by Household Size in Andover
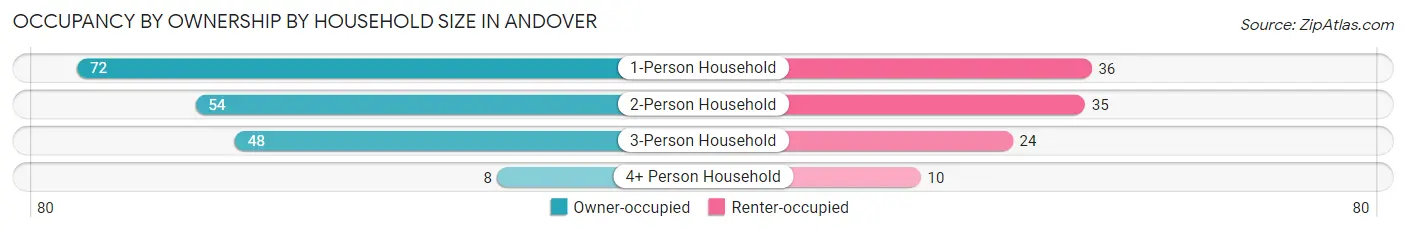
| Household Size | Owner-occupied | Renter-occupied |
| 1-Person Household | 72 (66.7%) | 36 (33.3%) |
| 2-Person Household | 54 (60.7%) | 35 (39.3%) |
| 3-Person Household | 48 (66.7%) | 24 (33.3%) |
| 4+ Person Household | 8 (44.4%) | 10 (55.6%) |
| Total Housing Units | 182 (63.4%) | 105 (36.6%) |
Occupancy by Educational Attainment in Andover
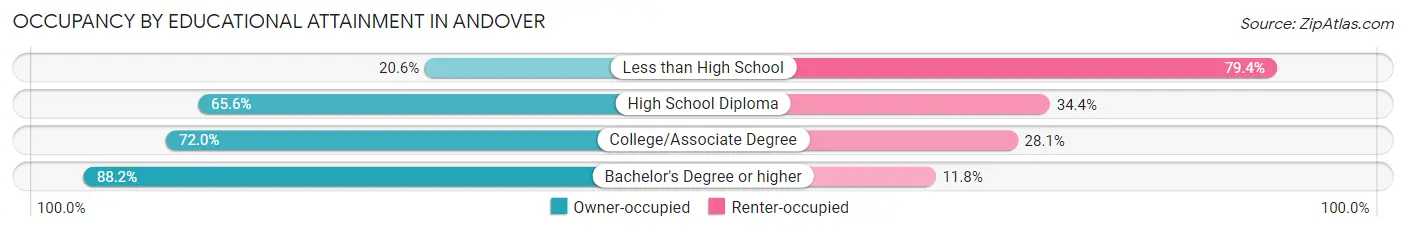
| Household Size | Owner-occupied | Renter-occupied |
| Less than High School | 7 (20.6%) | 27 (79.4%) |
| High School Diploma | 101 (65.6%) | 53 (34.4%) |
| College/Associate Degree | 59 (72.0%) | 23 (28.1%) |
| Bachelor's Degree or higher | 15 (88.2%) | 2 (11.8%) |
Occupancy by Age of Householder in Andover
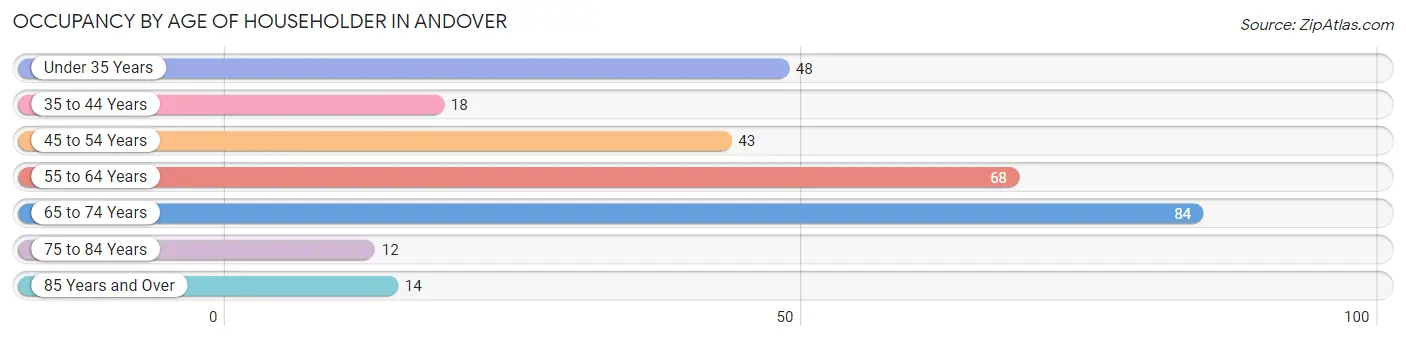
| Age Bracket | # Households | % Households |
| Under 35 Years | 48 | 16.7% |
| 35 to 44 Years | 18 | 6.3% |
| 45 to 54 Years | 43 | 15.0% |
| 55 to 64 Years | 68 | 23.7% |
| 65 to 74 Years | 84 | 29.3% |
| 75 to 84 Years | 12 | 4.2% |
| 85 Years and Over | 14 | 4.9% |
| Total | 287 | 100.0% |
Housing Finances in Andover
Median Income by Occupancy in Andover
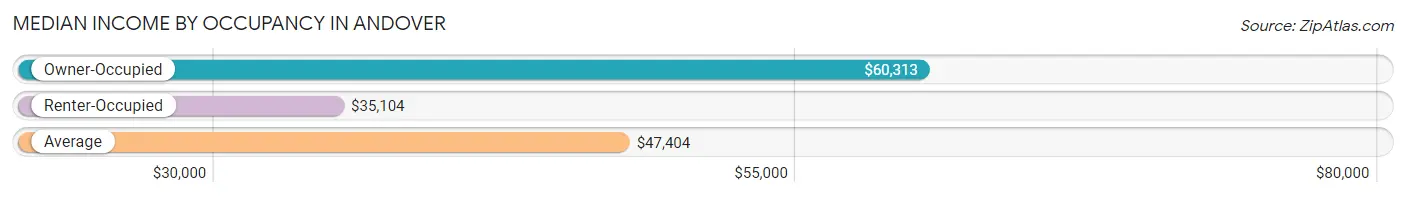
| Occupancy Type | # Households | Median Income |
| Owner-Occupied | 182 (63.4%) | $60,313 |
| Renter-Occupied | 105 (36.6%) | $35,104 |
| Average | 287 (100.0%) | $47,404 |
Occupancy by Householder Income Bracket in Andover
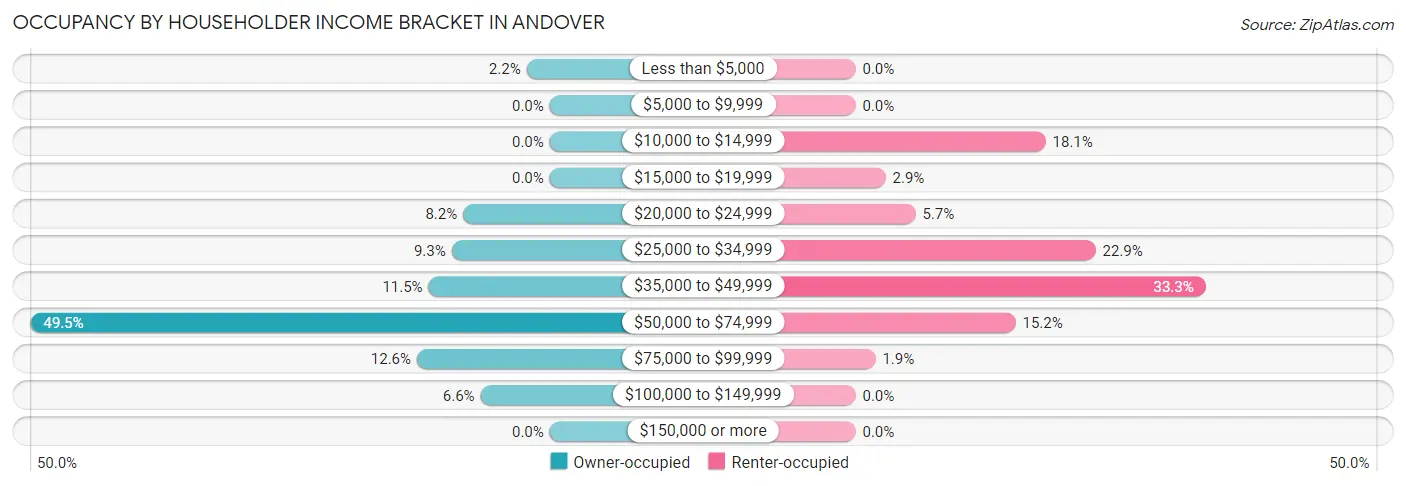
| Income Bracket | Owner-occupied | Renter-occupied |
| Less than $5,000 | 4 (2.2%) | 0 (0.0%) |
| $5,000 to $9,999 | 0 (0.0%) | 0 (0.0%) |
| $10,000 to $14,999 | 0 (0.0%) | 19 (18.1%) |
| $15,000 to $19,999 | 0 (0.0%) | 3 (2.9%) |
| $20,000 to $24,999 | 15 (8.2%) | 6 (5.7%) |
| $25,000 to $34,999 | 17 (9.3%) | 24 (22.9%) |
| $35,000 to $49,999 | 21 (11.5%) | 35 (33.3%) |
| $50,000 to $74,999 | 90 (49.4%) | 16 (15.2%) |
| $75,000 to $99,999 | 23 (12.6%) | 2 (1.9%) |
| $100,000 to $149,999 | 12 (6.6%) | 0 (0.0%) |
| $150,000 or more | 0 (0.0%) | 0 (0.0%) |
| Total | 182 (100.0%) | 105 (100.0%) |
Monthly Housing Cost Tiers in Andover
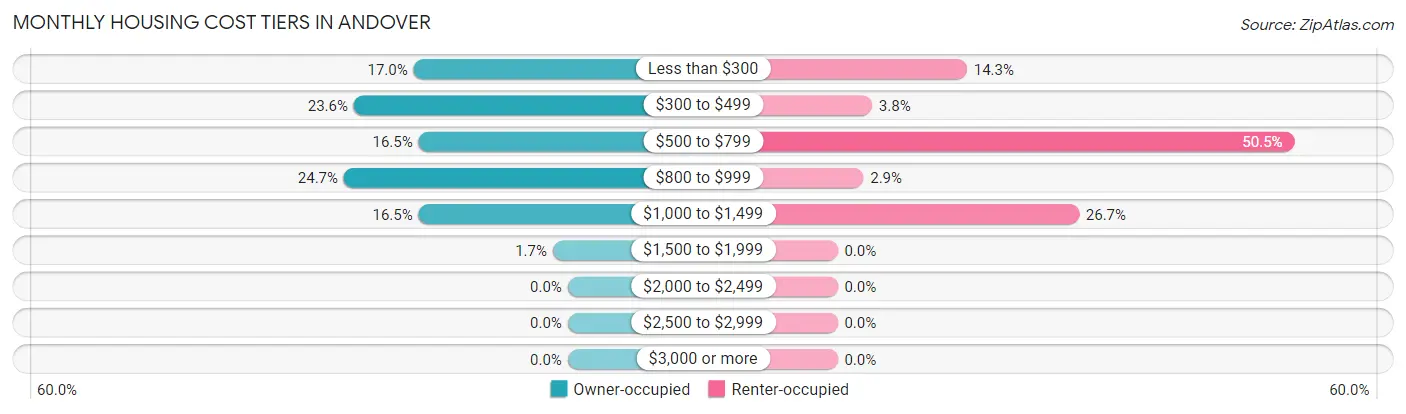
| Monthly Cost | Owner-occupied | Renter-occupied |
| Less than $300 | 31 (17.0%) | 15 (14.3%) |
| $300 to $499 | 43 (23.6%) | 4 (3.8%) |
| $500 to $799 | 30 (16.5%) | 53 (50.5%) |
| $800 to $999 | 45 (24.7%) | 3 (2.9%) |
| $1,000 to $1,499 | 30 (16.5%) | 28 (26.7%) |
| $1,500 to $1,999 | 3 (1.7%) | 0 (0.0%) |
| $2,000 to $2,499 | 0 (0.0%) | 0 (0.0%) |
| $2,500 to $2,999 | 0 (0.0%) | 0 (0.0%) |
| $3,000 or more | 0 (0.0%) | 0 (0.0%) |
| Total | 182 (100.0%) | 105 (100.0%) |
Physical Housing Characteristics in Andover
Housing Structures in Andover
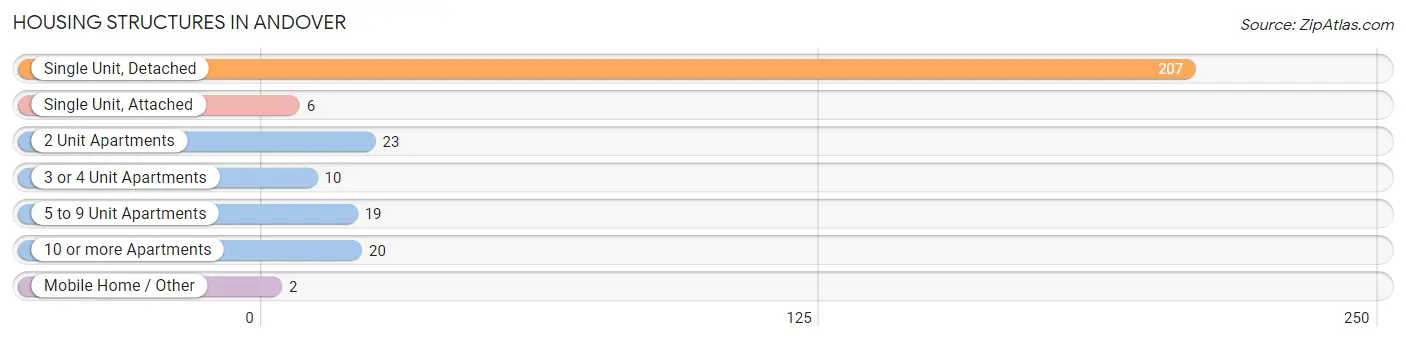
| Structure Type | # Housing Units | % Housing Units |
| Single Unit, Detached | 207 | 72.1% |
| Single Unit, Attached | 6 | 2.1% |
| 2 Unit Apartments | 23 | 8.0% |
| 3 or 4 Unit Apartments | 10 | 3.5% |
| 5 to 9 Unit Apartments | 19 | 6.6% |
| 10 or more Apartments | 20 | 7.0% |
| Mobile Home / Other | 2 | 0.7% |
| Total | 287 | 100.0% |
Housing Structures by Occupancy in Andover
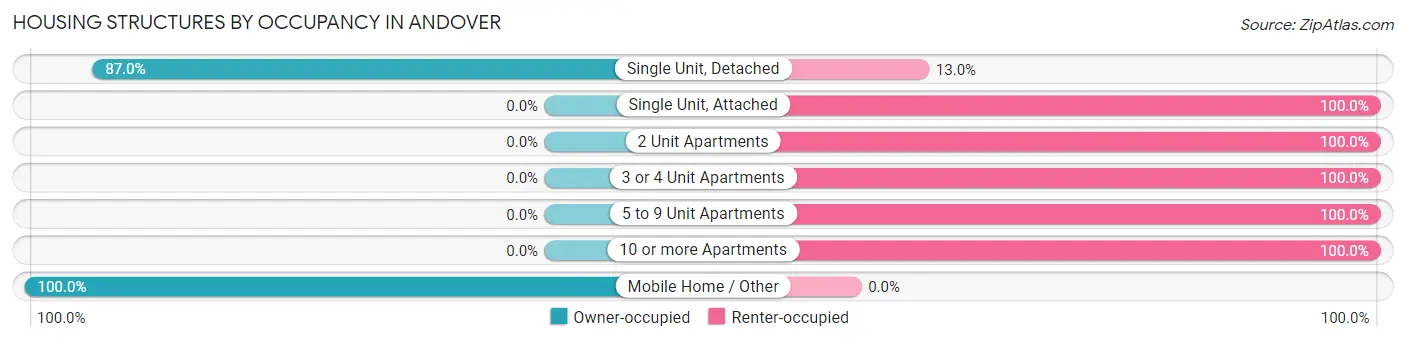
| Structure Type | Owner-occupied | Renter-occupied |
| Single Unit, Detached | 180 (87.0%) | 27 (13.0%) |
| Single Unit, Attached | 0 (0.0%) | 6 (100.0%) |
| 2 Unit Apartments | 0 (0.0%) | 23 (100.0%) |
| 3 or 4 Unit Apartments | 0 (0.0%) | 10 (100.0%) |
| 5 to 9 Unit Apartments | 0 (0.0%) | 19 (100.0%) |
| 10 or more Apartments | 0 (0.0%) | 20 (100.0%) |
| Mobile Home / Other | 2 (100.0%) | 0 (0.0%) |
| Total | 182 (63.4%) | 105 (36.6%) |
Housing Structures by Number of Rooms in Andover
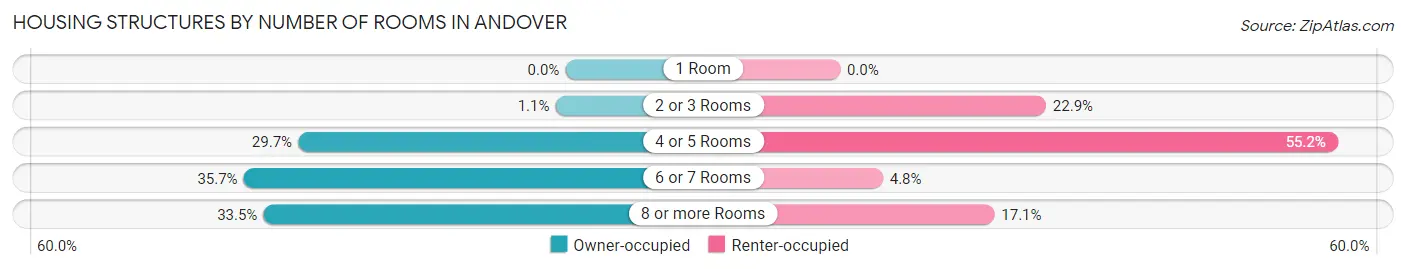
| Number of Rooms | Owner-occupied | Renter-occupied |
| 1 Room | 0 (0.0%) | 0 (0.0%) |
| 2 or 3 Rooms | 2 (1.1%) | 24 (22.9%) |
| 4 or 5 Rooms | 54 (29.7%) | 58 (55.2%) |
| 6 or 7 Rooms | 65 (35.7%) | 5 (4.8%) |
| 8 or more Rooms | 61 (33.5%) | 18 (17.1%) |
| Total | 182 (100.0%) | 105 (100.0%) |
Housing Structure by Heating Type in Andover
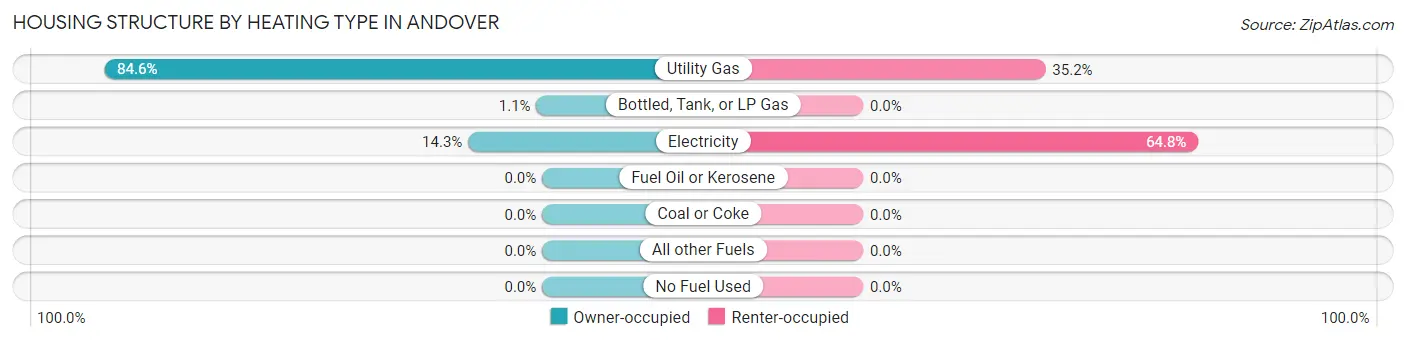
| Heating Type | Owner-occupied | Renter-occupied |
| Utility Gas | 154 (84.6%) | 37 (35.2%) |
| Bottled, Tank, or LP Gas | 2 (1.1%) | 0 (0.0%) |
| Electricity | 26 (14.3%) | 68 (64.8%) |
| Fuel Oil or Kerosene | 0 (0.0%) | 0 (0.0%) |
| Coal or Coke | 0 (0.0%) | 0 (0.0%) |
| All other Fuels | 0 (0.0%) | 0 (0.0%) |
| No Fuel Used | 0 (0.0%) | 0 (0.0%) |
| Total | 182 (100.0%) | 105 (100.0%) |
Household Vehicle Usage in Andover
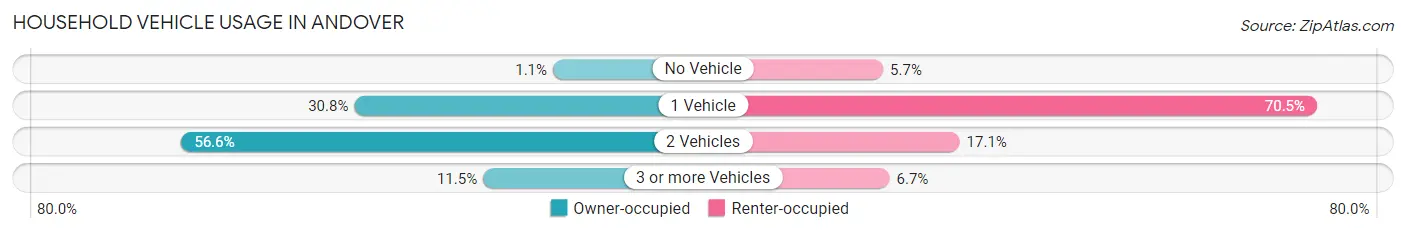
| Vehicles per Household | Owner-occupied | Renter-occupied |
| No Vehicle | 2 (1.1%) | 6 (5.7%) |
| 1 Vehicle | 56 (30.8%) | 74 (70.5%) |
| 2 Vehicles | 103 (56.6%) | 18 (17.1%) |
| 3 or more Vehicles | 21 (11.5%) | 7 (6.7%) |
| Total | 182 (100.0%) | 105 (100.0%) |
Real Estate & Mortgages in Andover
Real Estate and Mortgage Overview in Andover
| Characteristic | Without Mortgage | With Mortgage |
| Housing Units | 85 | 97 |
| Median Property Value | $79,000 | $119,000 |
| Median Household Income | $54,750 | $0 |
| Monthly Housing Costs | $321 | $0 |
| Real Estate Taxes | $944 | $6 |
Property Value by Mortgage Status in Andover
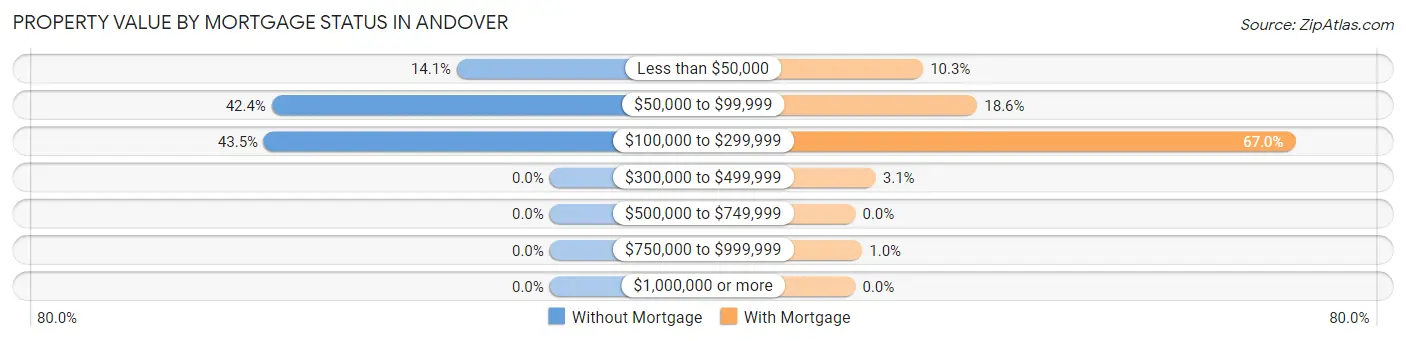
| Property Value | Without Mortgage | With Mortgage |
| Less than $50,000 | 12 (14.1%) | 10 (10.3%) |
| $50,000 to $99,999 | 36 (42.3%) | 18 (18.6%) |
| $100,000 to $299,999 | 37 (43.5%) | 65 (67.0%) |
| $300,000 to $499,999 | 0 (0.0%) | 3 (3.1%) |
| $500,000 to $749,999 | 0 (0.0%) | 0 (0.0%) |
| $750,000 to $999,999 | 0 (0.0%) | 1 (1.0%) |
| $1,000,000 or more | 0 (0.0%) | 0 (0.0%) |
| Total | 85 (100.0%) | 97 (100.0%) |
Household Income by Mortgage Status in Andover
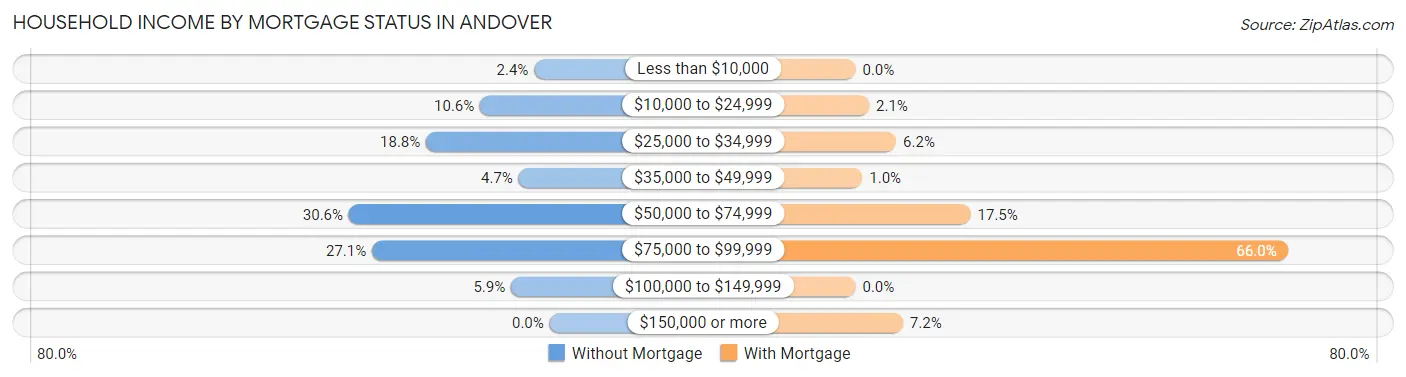
| Household Income | Without Mortgage | With Mortgage |
| Less than $10,000 | 2 (2.4%) | 0 (0.0%) |
| $10,000 to $24,999 | 9 (10.6%) | 2 (2.1%) |
| $25,000 to $34,999 | 16 (18.8%) | 6 (6.2%) |
| $35,000 to $49,999 | 4 (4.7%) | 1 (1.0%) |
| $50,000 to $74,999 | 26 (30.6%) | 17 (17.5%) |
| $75,000 to $99,999 | 23 (27.1%) | 64 (66.0%) |
| $100,000 to $149,999 | 5 (5.9%) | 0 (0.0%) |
| $150,000 or more | 0 (0.0%) | 7 (7.2%) |
| Total | 85 (100.0%) | 97 (100.0%) |
Property Value to Household Income Ratio in Andover
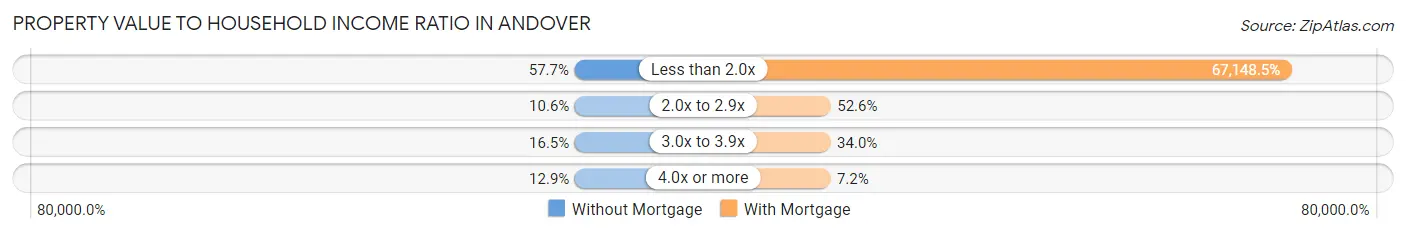
| Value-to-Income Ratio | Without Mortgage | With Mortgage |
| Less than 2.0x | 49 (57.7%) | 65,134 (67,148.5%) |
| 2.0x to 2.9x | 9 (10.6%) | 51 (52.6%) |
| 3.0x to 3.9x | 14 (16.5%) | 33 (34.0%) |
| 4.0x or more | 11 (12.9%) | 7 (7.2%) |
| Total | 85 (100.0%) | 97 (100.0%) |
Real Estate Taxes by Mortgage Status in Andover
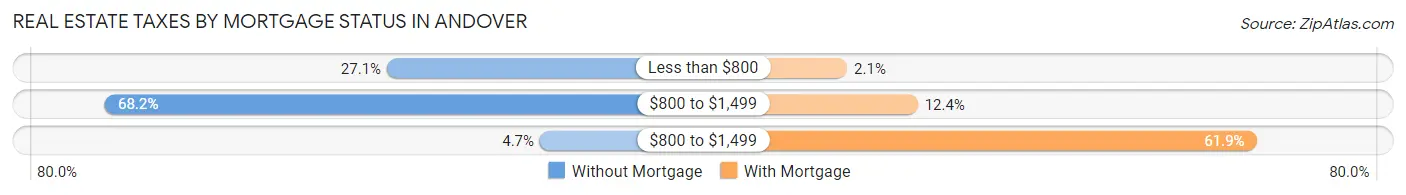
| Property Taxes | Without Mortgage | With Mortgage |
| Less than $800 | 23 (27.1%) | 2 (2.1%) |
| $800 to $1,499 | 58 (68.2%) | 12 (12.4%) |
| $800 to $1,499 | 4 (4.7%) | 60 (61.9%) |
| Total | 85 (100.0%) | 97 (100.0%) |
Health & Disability in Andover
Health Insurance Coverage by Age in Andover
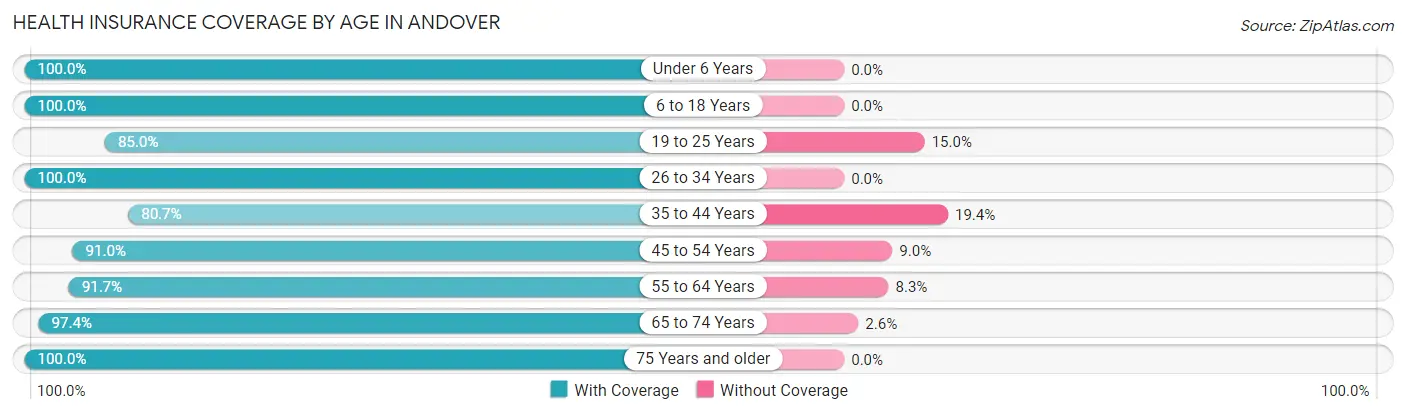
| Age Bracket | With Coverage | Without Coverage |
| Under 6 Years | 72 (100.0%) | 0 (0.0%) |
| 6 to 18 Years | 52 (100.0%) | 0 (0.0%) |
| 19 to 25 Years | 51 (85.0%) | 9 (15.0%) |
| 26 to 34 Years | 56 (100.0%) | 0 (0.0%) |
| 35 to 44 Years | 25 (80.6%) | 6 (19.4%) |
| 45 to 54 Years | 71 (91.0%) | 7 (9.0%) |
| 55 to 64 Years | 111 (91.7%) | 10 (8.3%) |
| 65 to 74 Years | 111 (97.4%) | 3 (2.6%) |
| 75 Years and older | 26 (100.0%) | 0 (0.0%) |
| Total | 575 (94.3%) | 35 (5.7%) |
Health Insurance Coverage by Citizenship Status in Andover
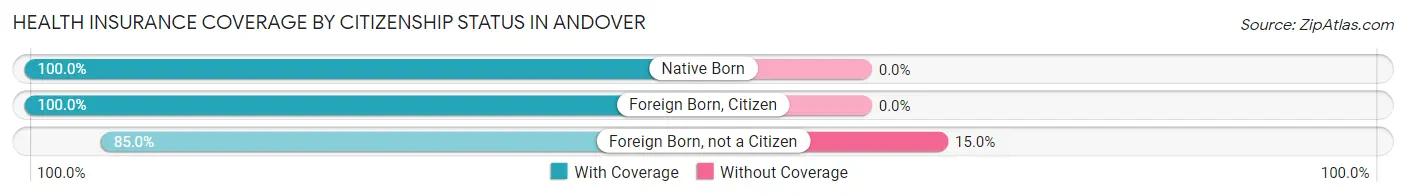
| Citizenship Status | With Coverage | Without Coverage |
| Native Born | 72 (100.0%) | 0 (0.0%) |
| Foreign Born, Citizen | 52 (100.0%) | 0 (0.0%) |
| Foreign Born, not a Citizen | 51 (85.0%) | 9 (15.0%) |
Health Insurance Coverage by Household Income in Andover
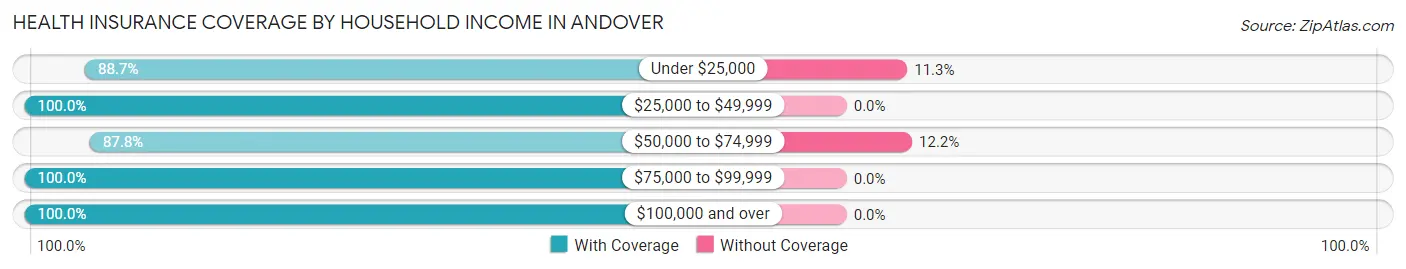
| Household Income | With Coverage | Without Coverage |
| Under $25,000 | 86 (88.7%) | 11 (11.3%) |
| $25,000 to $49,999 | 195 (100.0%) | 0 (0.0%) |
| $50,000 to $74,999 | 172 (87.8%) | 24 (12.2%) |
| $75,000 to $99,999 | 79 (100.0%) | 0 (0.0%) |
| $100,000 and over | 43 (100.0%) | 0 (0.0%) |
Public vs Private Health Insurance Coverage by Age in Andover
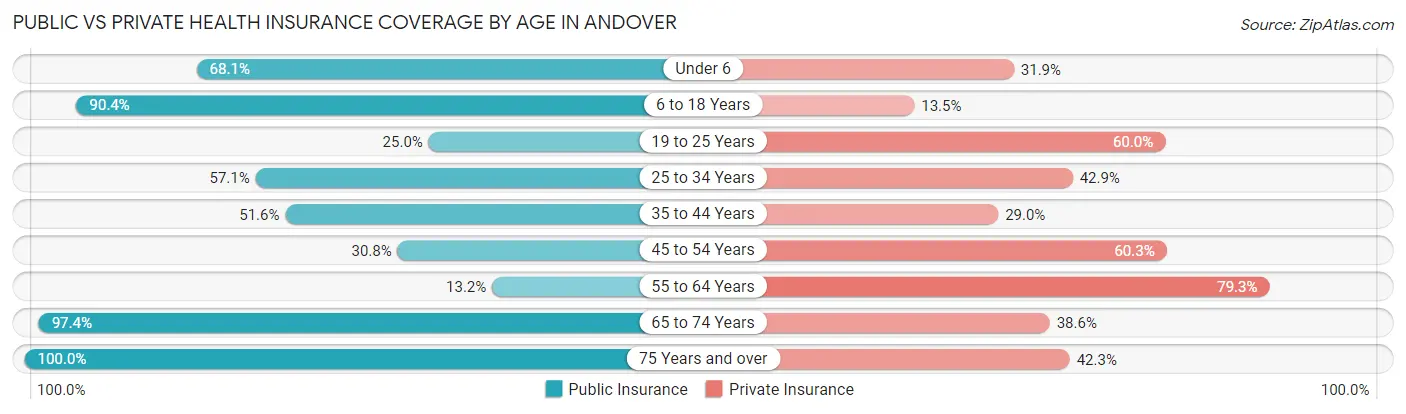
| Age Bracket | Public Insurance | Private Insurance |
| Under 6 | 49 (68.1%) | 23 (31.9%) |
| 6 to 18 Years | 47 (90.4%) | 7 (13.5%) |
| 19 to 25 Years | 15 (25.0%) | 36 (60.0%) |
| 25 to 34 Years | 32 (57.1%) | 24 (42.9%) |
| 35 to 44 Years | 16 (51.6%) | 9 (29.0%) |
| 45 to 54 Years | 24 (30.8%) | 47 (60.3%) |
| 55 to 64 Years | 16 (13.2%) | 96 (79.3%) |
| 65 to 74 Years | 111 (97.4%) | 44 (38.6%) |
| 75 Years and over | 26 (100.0%) | 11 (42.3%) |
| Total | 336 (55.1%) | 297 (48.7%) |
Disability Status by Sex by Age in Andover
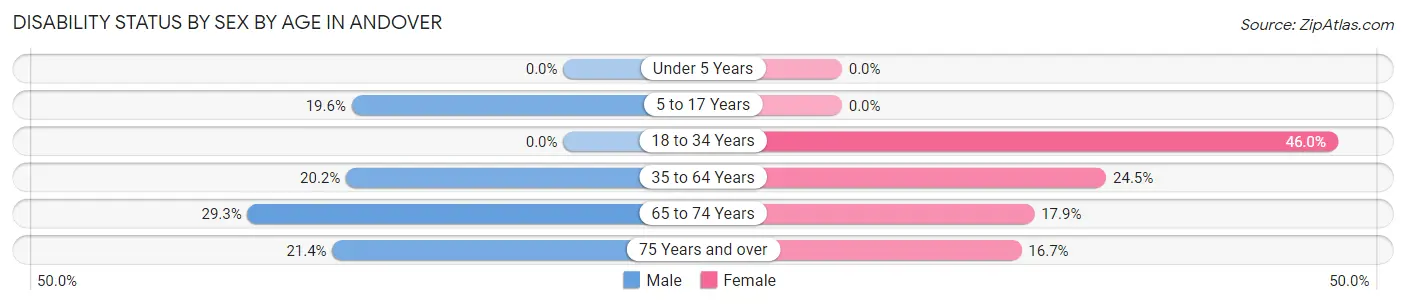
| Age Bracket | Male | Female |
| Under 5 Years | 0 (0.0%) | 0 (0.0%) |
| 5 to 17 Years | 11 (19.6%) | 0 (0.0%) |
| 18 to 34 Years | 0 (0.0%) | 29 (46.0%) |
| 35 to 64 Years | 25 (20.2%) | 26 (24.5%) |
| 65 to 74 Years | 17 (29.3%) | 10 (17.9%) |
| 75 Years and over | 3 (21.4%) | 2 (16.7%) |
Disability Class by Sex by Age in Andover
Disability Class: Hearing Difficulty
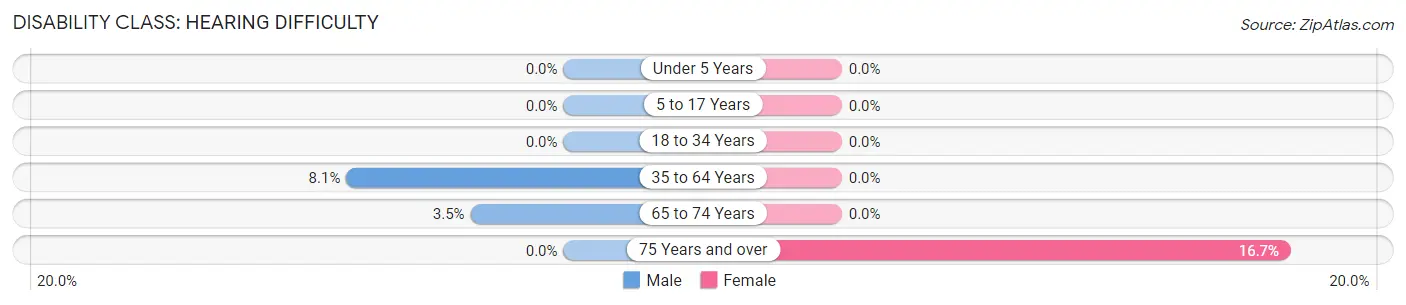
| Age Bracket | Male | Female |
| Under 5 Years | 0 (0.0%) | 0 (0.0%) |
| 5 to 17 Years | 0 (0.0%) | 0 (0.0%) |
| 18 to 34 Years | 0 (0.0%) | 0 (0.0%) |
| 35 to 64 Years | 10 (8.1%) | 0 (0.0%) |
| 65 to 74 Years | 2 (3.5%) | 0 (0.0%) |
| 75 Years and over | 0 (0.0%) | 2 (16.7%) |
Disability Class: Vision Difficulty
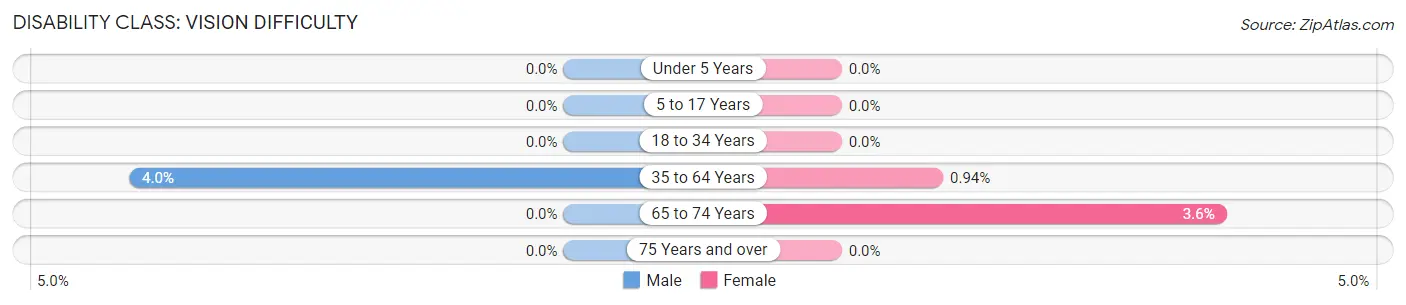
| Age Bracket | Male | Female |
| Under 5 Years | 0 (0.0%) | 0 (0.0%) |
| 5 to 17 Years | 0 (0.0%) | 0 (0.0%) |
| 18 to 34 Years | 0 (0.0%) | 0 (0.0%) |
| 35 to 64 Years | 5 (4.0%) | 1 (0.9%) |
| 65 to 74 Years | 0 (0.0%) | 2 (3.6%) |
| 75 Years and over | 0 (0.0%) | 0 (0.0%) |
Disability Class: Cognitive Difficulty
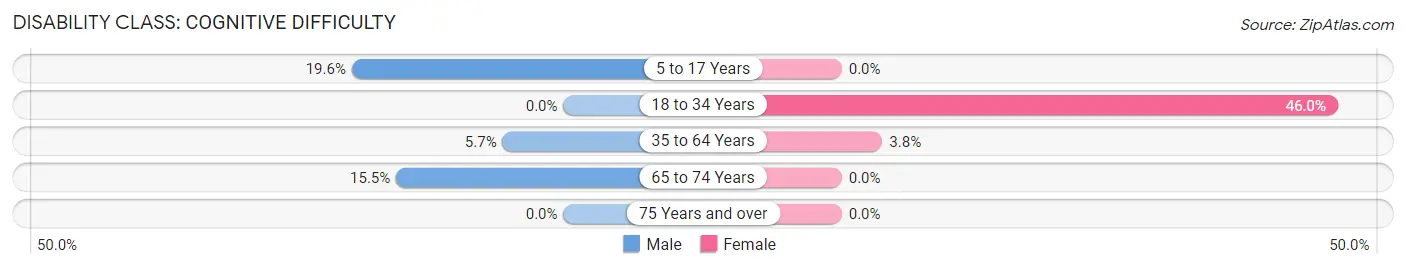
| Age Bracket | Male | Female |
| 5 to 17 Years | 11 (19.6%) | 0 (0.0%) |
| 18 to 34 Years | 0 (0.0%) | 29 (46.0%) |
| 35 to 64 Years | 7 (5.7%) | 4 (3.8%) |
| 65 to 74 Years | 9 (15.5%) | 0 (0.0%) |
| 75 Years and over | 0 (0.0%) | 0 (0.0%) |
Disability Class: Ambulatory Difficulty
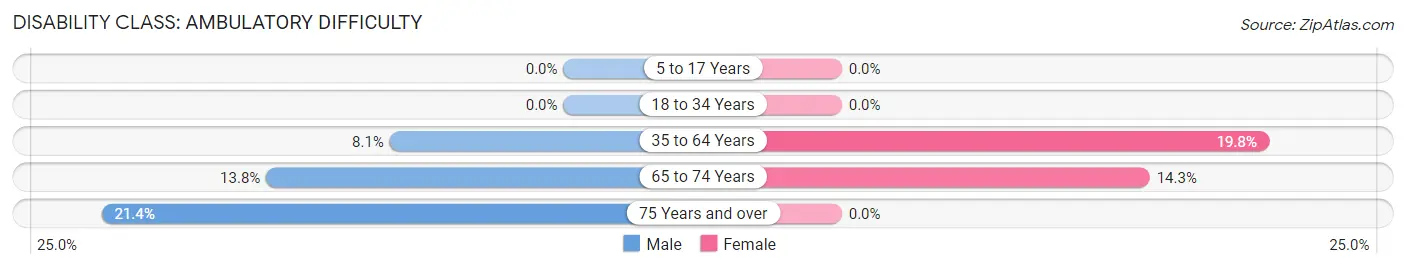
| Age Bracket | Male | Female |
| 5 to 17 Years | 0 (0.0%) | 0 (0.0%) |
| 18 to 34 Years | 0 (0.0%) | 0 (0.0%) |
| 35 to 64 Years | 10 (8.1%) | 21 (19.8%) |
| 65 to 74 Years | 8 (13.8%) | 8 (14.3%) |
| 75 Years and over | 3 (21.4%) | 0 (0.0%) |
Disability Class: Self-Care Difficulty
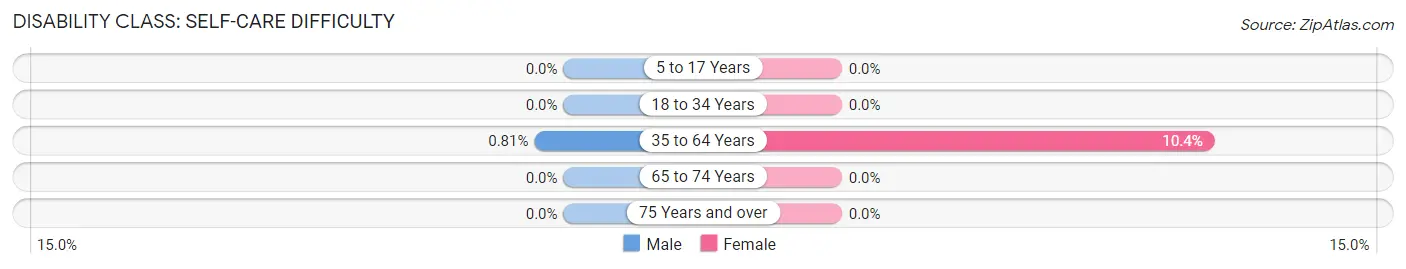
| Age Bracket | Male | Female |
| 5 to 17 Years | 0 (0.0%) | 0 (0.0%) |
| 18 to 34 Years | 0 (0.0%) | 0 (0.0%) |
| 35 to 64 Years | 1 (0.8%) | 11 (10.4%) |
| 65 to 74 Years | 0 (0.0%) | 0 (0.0%) |
| 75 Years and over | 0 (0.0%) | 0 (0.0%) |
Technology Access in Andover
Computing Device Access in Andover
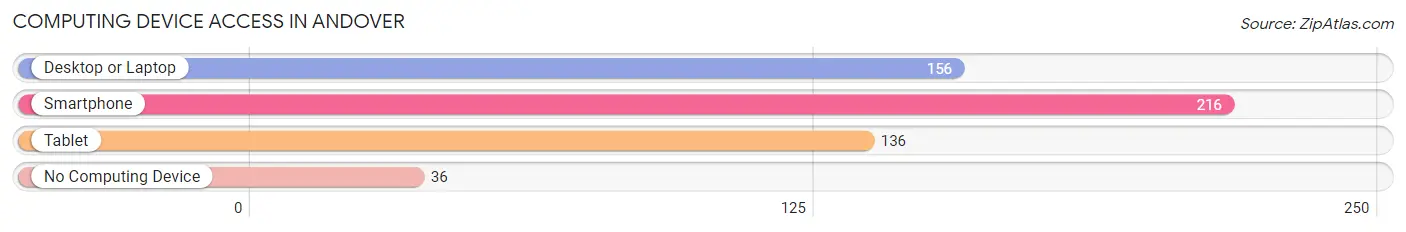
| Device Type | # Households | % Households |
| Desktop or Laptop | 156 | 54.4% |
| Smartphone | 216 | 75.3% |
| Tablet | 136 | 47.4% |
| No Computing Device | 36 | 12.5% |
| Total | 287 | 100.0% |
Internet Access in Andover
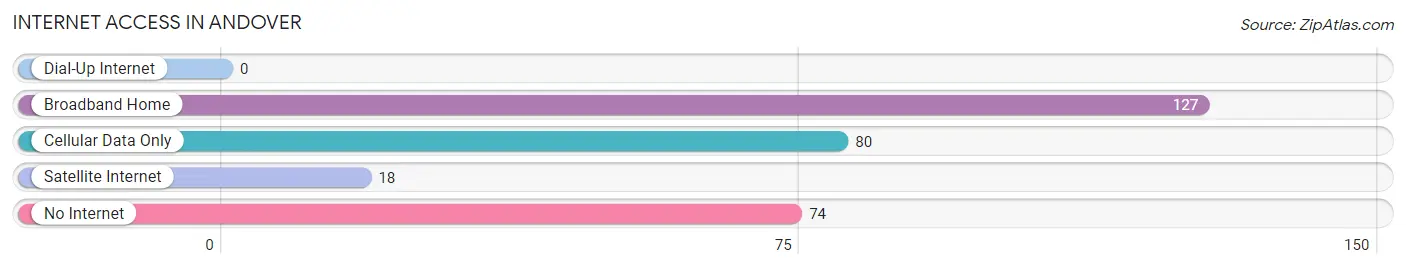
| Internet Type | # Households | % Households |
| Dial-Up Internet | 0 | 0.0% |
| Broadband Home | 127 | 44.3% |
| Cellular Data Only | 80 | 27.9% |
| Satellite Internet | 18 | 6.3% |
| No Internet | 74 | 25.8% |
| Total | 287 | 100.0% |
Andover Summary
Andover, Ohio is a small village located in Ashtabula County, Ohio. It is situated on the banks of the Grand River, approximately 30 miles east of Cleveland. The village has a population of approximately 1,000 people and is part of the Ashtabula Metropolitan Statistical Area.
History
The area that is now Andover was first settled in 1810 by a group of settlers from Connecticut. The village was originally known as "Connecticut Settlement" and was later renamed "Andover" after the town of Andover, Connecticut. The village was officially incorporated in 1837.
In the late 19th century, Andover was a thriving agricultural community. The village was home to several mills, including a grist mill, a saw mill, and a woolen mill. The village also had a number of stores, a post office, and a hotel.
In the early 20th century, Andover began to decline as the local economy shifted away from agriculture. The village's population decreased and many of the businesses closed. In the late 20th century, the village began to experience a resurgence as new businesses opened and the population began to grow.
Geography
Andover is located in northeastern Ohio, approximately 30 miles east of Cleveland. The village is situated on the banks of the Grand River and is surrounded by rolling hills and farmland. The village is located in the Ashtabula County, Ohio, and is part of the Ashtabula Metropolitan Statistical Area.
Economy
Andover's economy is largely based on agriculture and tourism. The village is home to several farms, which produce a variety of crops, including corn, soybeans, and wheat. The village is also home to several wineries, which produce a variety of wines.
The village is also home to several small businesses, including restaurants, shops, and a bed and breakfast. The village is also home to a number of antique stores, which attract visitors from all over the region.
Demographics
As of the 2010 census, the population of Andover was 1,000. The village is predominantly white, with approximately 95% of the population identifying as white. The median household income is $41,250 and the median home value is $117,000.
Conclusion
Andover, Ohio is a small village located in Ashtabula County, Ohio. It is situated on the banks of the Grand River, approximately 30 miles east of Cleveland. The village has a population of approximately 1,000 people and is part of the Ashtabula Metropolitan Statistical Area. The village's economy is largely based on agriculture and tourism, and the village is home to several farms, wineries, restaurants, shops, and a bed and breakfast. The village is predominantly white, with approximately 95% of the population identifying as white. The median household income is $41,250 and the median home value is $117,000.
Common Questions
What is Per Capita Income in Andover?
Per Capita income in Andover is $21,660.
What is the Median Family Income in Andover?
Median Family Income in Andover is $50,515.
What is the Median Household income in Andover?
Median Household Income in Andover is $47,404.
What is Income or Wage Gap in Andover?
Income or Wage Gap in Andover is 65.3%.
Women in Andover earn 34.7 cents for every dollar earned by a man.
What is Inequality or Gini Index in Andover?
Inequality or Gini Index in Andover is 0.30.
What is the Total Population of Andover?
Total Population of Andover is 708.
What is the Total Male Population of Andover?
Total Male Population of Andover is 346.
What is the Total Female Population of Andover?
Total Female Population of Andover is 362.
What is the Ratio of Males per 100 Females in Andover?
There are 95.58 Males per 100 Females in Andover.
What is the Ratio of Females per 100 Males in Andover?
There are 104.62 Females per 100 Males in Andover.
What is the Median Population Age in Andover?
Median Population Age in Andover is 56.0 Years.
What is the Average Family Size in Andover
Average Family Size in Andover is 2.7 People.
What is the Average Household Size in Andover
Average Household Size in Andover is 2.1 People.
How Large is the Labor Force in Andover?
There are 274 People in the Labor Forcein in Andover.
What is the Percentage of People in the Labor Force in Andover?
46.4% of People are in the Labor Force in Andover.
What is the Unemployment Rate in Andover?
Unemployment Rate in Andover is 4.7%.