Zip Codes with the Highest Percentage of Population Employed in Professional & Scientific Services in Pahrump, NV
RELATED REPORTS & OPTIONS
Professional & Scientific Services
Pahrump
Compare Zip Codes
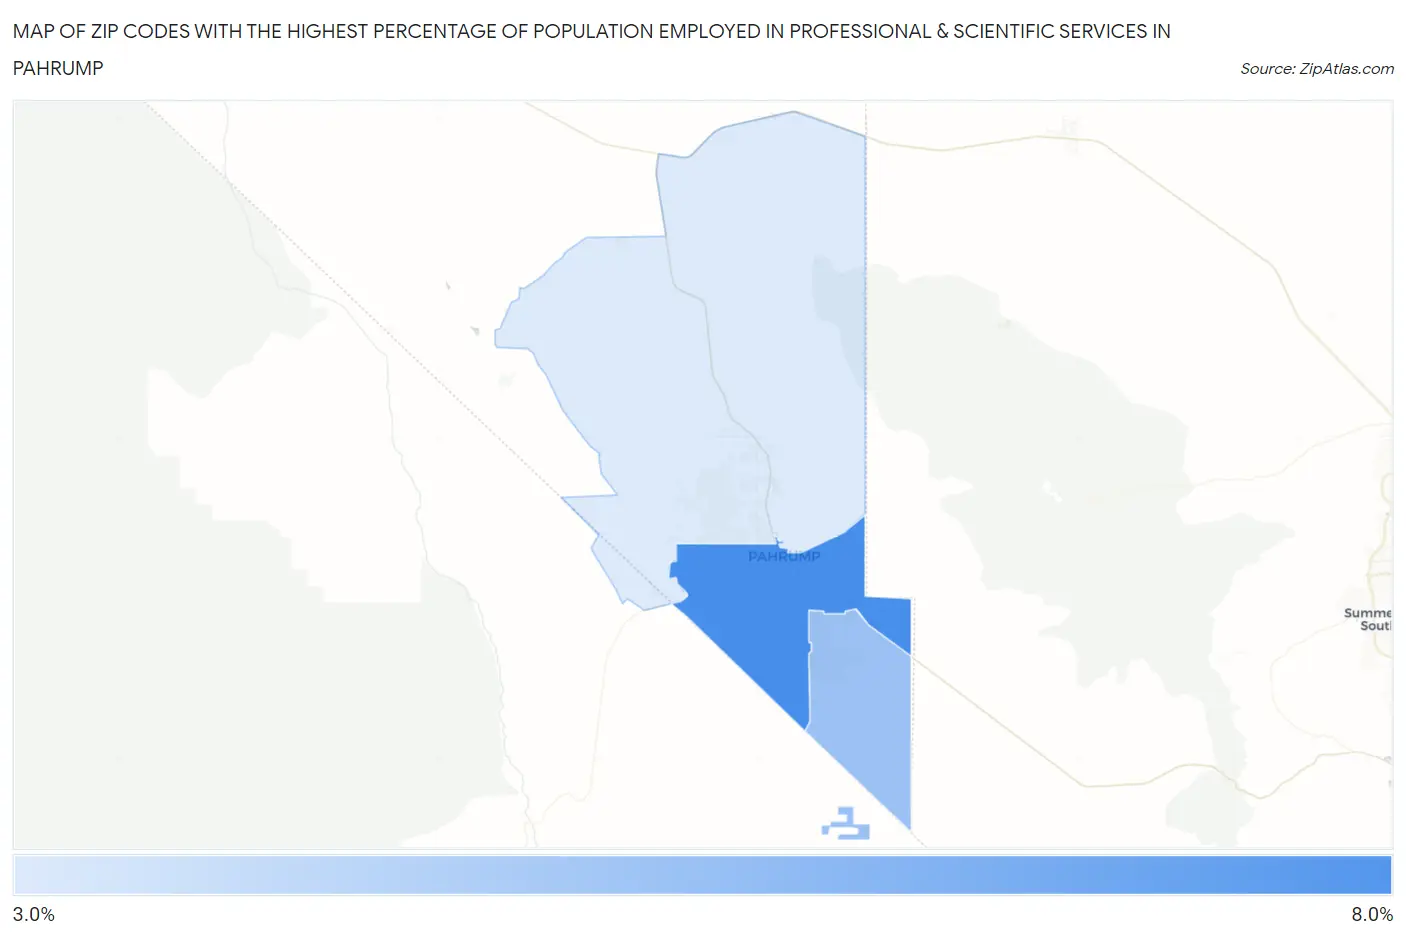
Map of Zip Codes with the Highest Percentage of Population Employed in Professional & Scientific Services in Pahrump
3.4%
6.1%
Zip Codes with the Highest Percentage of Population Employed in Professional & Scientific Services in Pahrump, NV
| Zip Code | % Employed | vs State | vs National | |
| 1. | 89048 | 6.1% | 6.3%(-0.196)#60 | 7.8%(-1.72)#9,729 |
| 2. | 89061 | 4.6% | 6.3%(-1.71)#89 | 7.8%(-3.23)#13,316 |
| 3. | 89060 | 3.4% | 6.3%(-2.90)#106 | 7.8%(-4.43)#17,000 |
1
Common Questions
What are the Top Zip Codes with the Highest Percentage of Population Employed in Professional & Scientific Services in Pahrump, NV?
Top Zip Codes with the Highest Percentage of Population Employed in Professional & Scientific Services in Pahrump, NV are:
What zip code has the Highest Percentage of Population Employed in Professional & Scientific Services in Pahrump, NV?
89048 has the Highest Percentage of Population Employed in Professional & Scientific Services in Pahrump, NV with 6.1%.
What is the Percentage of Population Employed in Professional & Scientific Services in Pahrump, NV?
Percentage of Population Employed in Professional & Scientific Services in Pahrump is 5.1%.
What is the Percentage of Population Employed in Professional & Scientific Services in Nevada?
Percentage of Population Employed in Professional & Scientific Services in Nevada is 6.3%.
What is the Percentage of Population Employed in Professional & Scientific Services in the United States?
Percentage of Population Employed in Professional & Scientific Services in the United States is 7.8%.