Zip Codes with the Highest Percentage of Population Taking Taxi / Cab to Work in Pahrump, NV
RELATED REPORTS & OPTIONS
Taxi / Cab
Pahrump
Compare Zip Codes
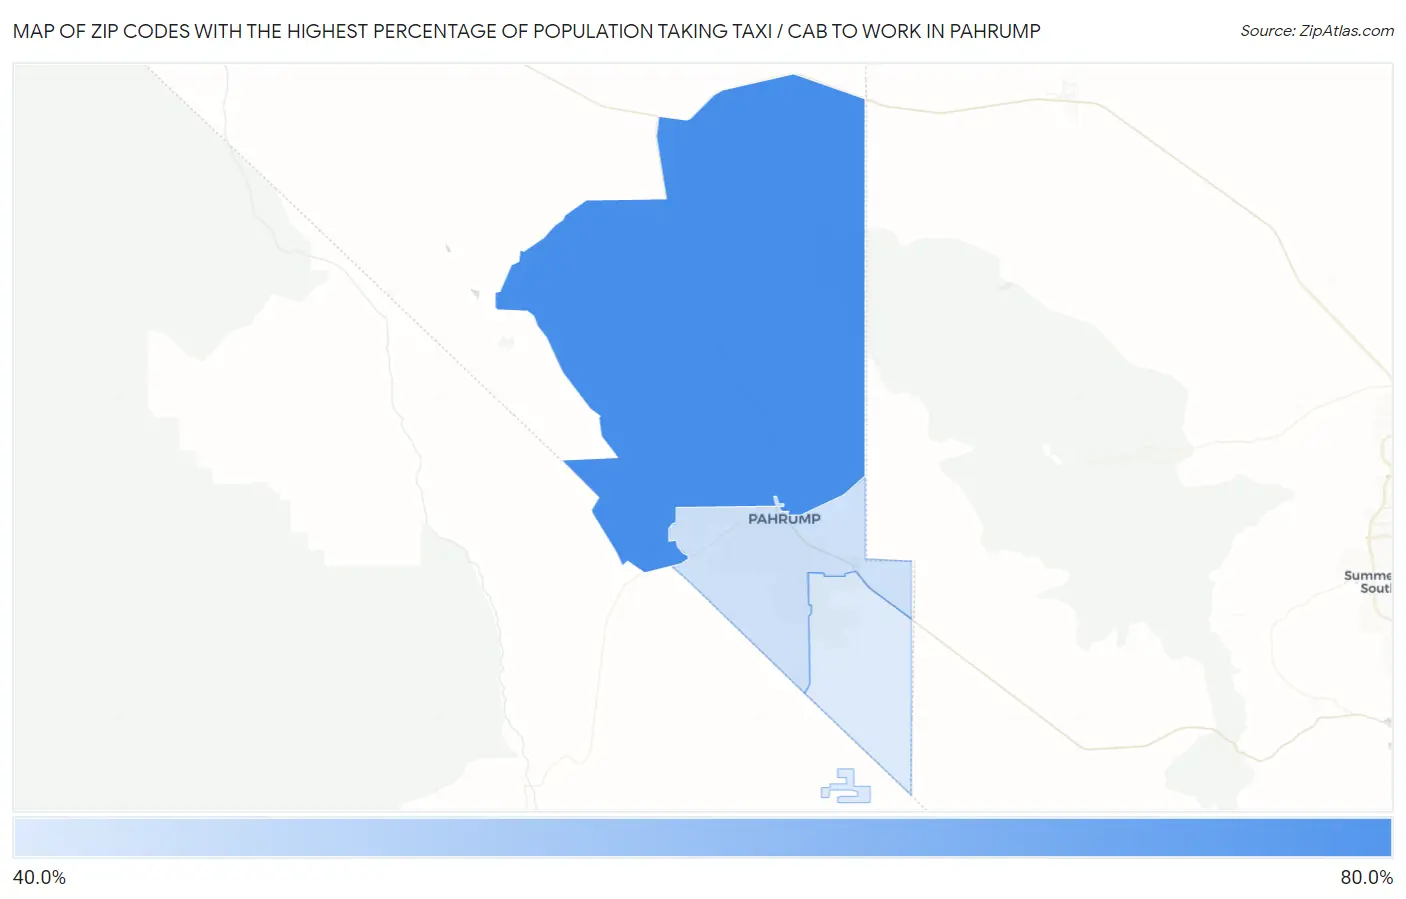
Map of Zip Codes with the Highest Percentage of Population Taking Taxi / Cab to Work in Pahrump
44.7%
65.2%
Zip Codes with the Highest Percentage of Population Taking Taxi / Cab to Work in Pahrump, NV
| Zip Code | % Take Taxi / Cab | vs State | vs National | |
| 1. | 89060 | 65.2% | 38.4%(+26.8)#2 | 38.2%(+27.0)#228 |
| 2. | 89048 | 46.6% | 38.4%(+8.20)#23 | 38.2%(+8.40)#4,075 |
| 3. | 89061 | 44.7% | 38.4%(+6.30)#25 | 38.2%(+6.50)#4,769 |
1
Common Questions
What are the Top Zip Codes with the Highest Percentage of Population Taking Taxi / Cab to Work in Pahrump, NV?
Top Zip Codes with the Highest Percentage of Population Taking Taxi / Cab to Work in Pahrump, NV are:
What zip code has the Highest Percentage of Population Taking Taxi / Cab to Work in Pahrump, NV?
89060 has the Highest Percentage of Population Taking Taxi / Cab to Work in Pahrump, NV with 65.2%.
What is the Percentage of Population Taking Taxi / Cab to Work in Pahrump, NV?
Percentage of Population Taking Taxi / Cab to Work in Pahrump is 50.5%.
What is the Percentage of Population Taking Taxi / Cab to Work in Nevada?
Percentage of Population Taking Taxi / Cab to Work in Nevada is 38.4%.
What is the Percentage of Population Taking Taxi / Cab to Work in the United States?
Percentage of Population Taking Taxi / Cab to Work in the United States is 38.2%.