Zip Codes with the Highest Percentage of Population Employed in Real Estate, Rental & Leasing in Blue Springs, MO
RELATED REPORTS & OPTIONS
Real Estate, Rental & Leasing
Blue Springs
Compare Zip Codes
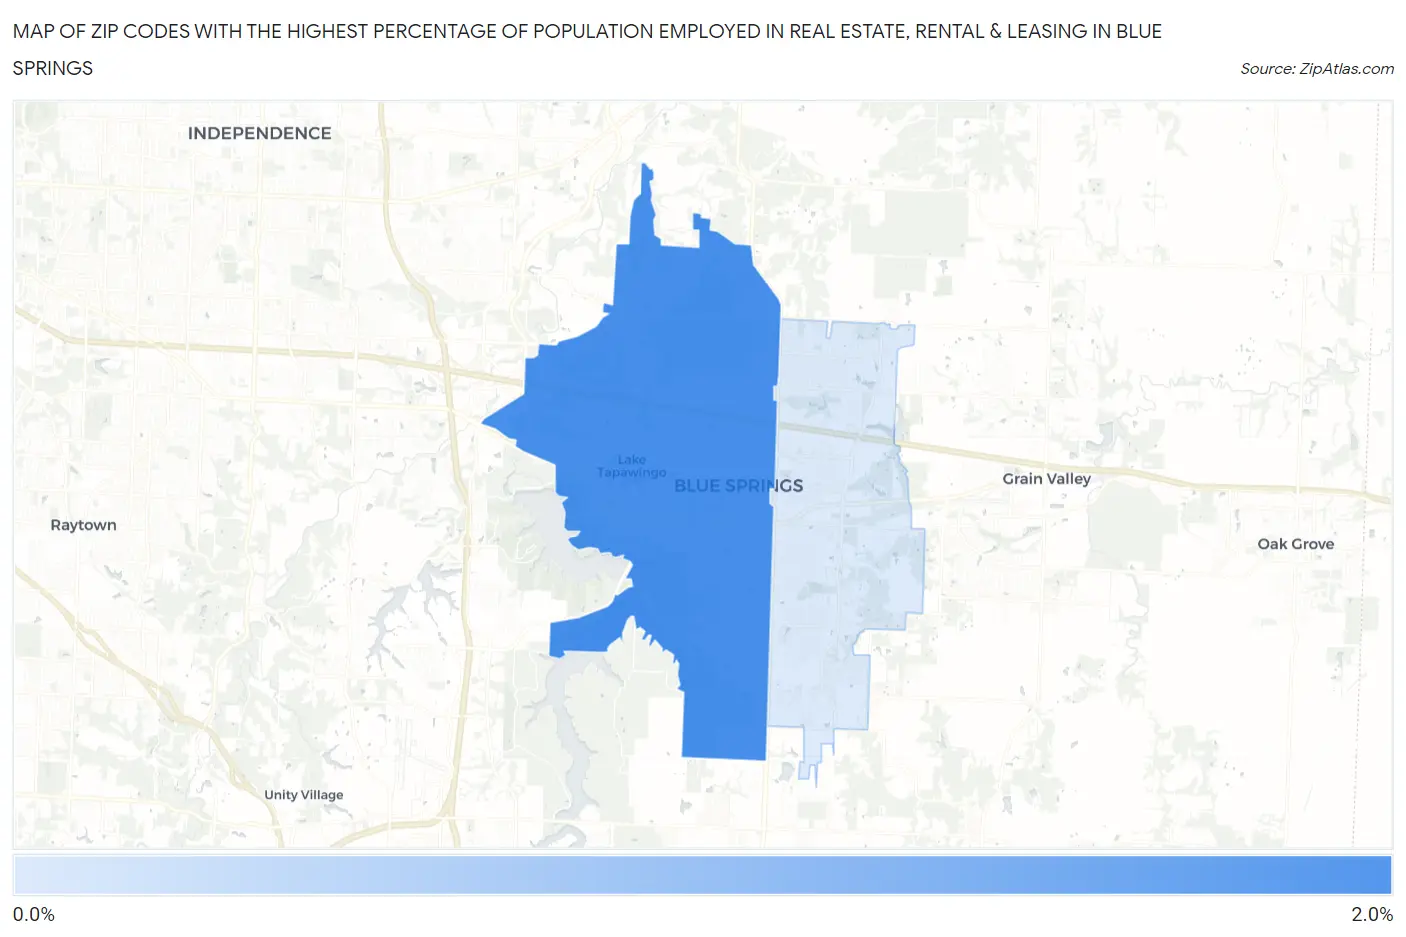
Map of Zip Codes with the Highest Percentage of Population Employed in Real Estate, Rental & Leasing in Blue Springs
0.95%
1.5%
Zip Codes with the Highest Percentage of Population Employed in Real Estate, Rental & Leasing in Blue Springs, MO
| Zip Code | % Employed | vs State | vs National | |
| 1. | 64015 | 1.5% | 1.6%(-0.120)#255 | 1.9%(-0.381)#11,072 |
| 2. | 64014 | 0.95% | 1.6%(-0.684)#373 | 1.9%(-0.945)#15,578 |
1
Common Questions
What are the Top Zip Codes with the Highest Percentage of Population Employed in Real Estate, Rental & Leasing in Blue Springs, MO?
Top Zip Codes with the Highest Percentage of Population Employed in Real Estate, Rental & Leasing in Blue Springs, MO are:
What zip code has the Highest Percentage of Population Employed in Real Estate, Rental & Leasing in Blue Springs, MO?
64015 has the Highest Percentage of Population Employed in Real Estate, Rental & Leasing in Blue Springs, MO with 1.5%.
What is the Percentage of Population Employed in Real Estate, Rental & Leasing in Blue Springs, MO?
Percentage of Population Employed in Real Estate, Rental & Leasing in Blue Springs is 1.2%.
What is the Percentage of Population Employed in Real Estate, Rental & Leasing in Missouri?
Percentage of Population Employed in Real Estate, Rental & Leasing in Missouri is 1.6%.
What is the Percentage of Population Employed in Real Estate, Rental & Leasing in the United States?
Percentage of Population Employed in Real Estate, Rental & Leasing in the United States is 1.9%.