Zip Codes with the Highest Percentage of Population Employed in Installation, Maintenance & Repair in Blue Springs, MO
RELATED REPORTS & OPTIONS
Installation, Maintenance & Repair
Blue Springs
Compare Zip Codes
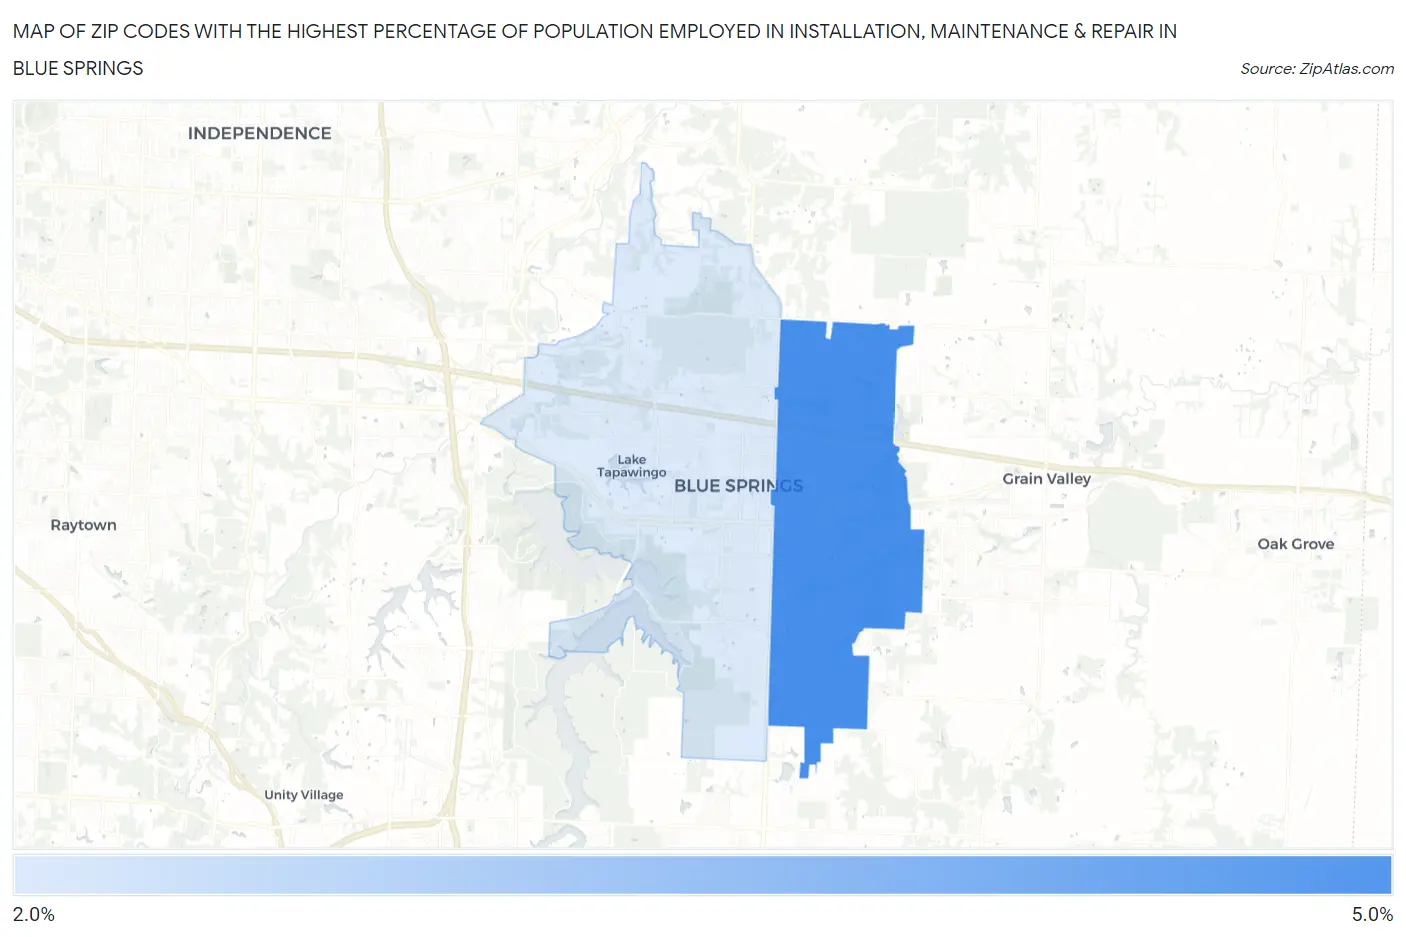
Map of Zip Codes with the Highest Percentage of Population Employed in Installation, Maintenance & Repair in Blue Springs
2.8%
4.3%
Zip Codes with the Highest Percentage of Population Employed in Installation, Maintenance & Repair in Blue Springs, MO
| Zip Code | % Employed | vs State | vs National | |
| 1. | 64014 | 4.3% | 3.2%(+1.14)#374 | 3.1%(+1.28)#10,989 |
| 2. | 64015 | 2.8% | 3.2%(-0.387)#575 | 3.1%(-0.251)#17,912 |
1
Common Questions
What are the Top Zip Codes with the Highest Percentage of Population Employed in Installation, Maintenance & Repair in Blue Springs, MO?
Top Zip Codes with the Highest Percentage of Population Employed in Installation, Maintenance & Repair in Blue Springs, MO are:
What zip code has the Highest Percentage of Population Employed in Installation, Maintenance & Repair in Blue Springs, MO?
64014 has the Highest Percentage of Population Employed in Installation, Maintenance & Repair in Blue Springs, MO with 4.3%.
What is the Percentage of Population Employed in Installation, Maintenance & Repair in Blue Springs, MO?
Percentage of Population Employed in Installation, Maintenance & Repair in Blue Springs is 3.3%.
What is the Percentage of Population Employed in Installation, Maintenance & Repair in Missouri?
Percentage of Population Employed in Installation, Maintenance & Repair in Missouri is 3.2%.
What is the Percentage of Population Employed in Installation, Maintenance & Repair in the United States?
Percentage of Population Employed in Installation, Maintenance & Repair in the United States is 3.1%.