Zip Codes with the Highest Percentage of Population with a Degree in Liberal Arts and History in Blue Springs, MO
RELATED REPORTS & OPTIONS
Liberal Arts and History
Blue Springs
Compare Zip Codes
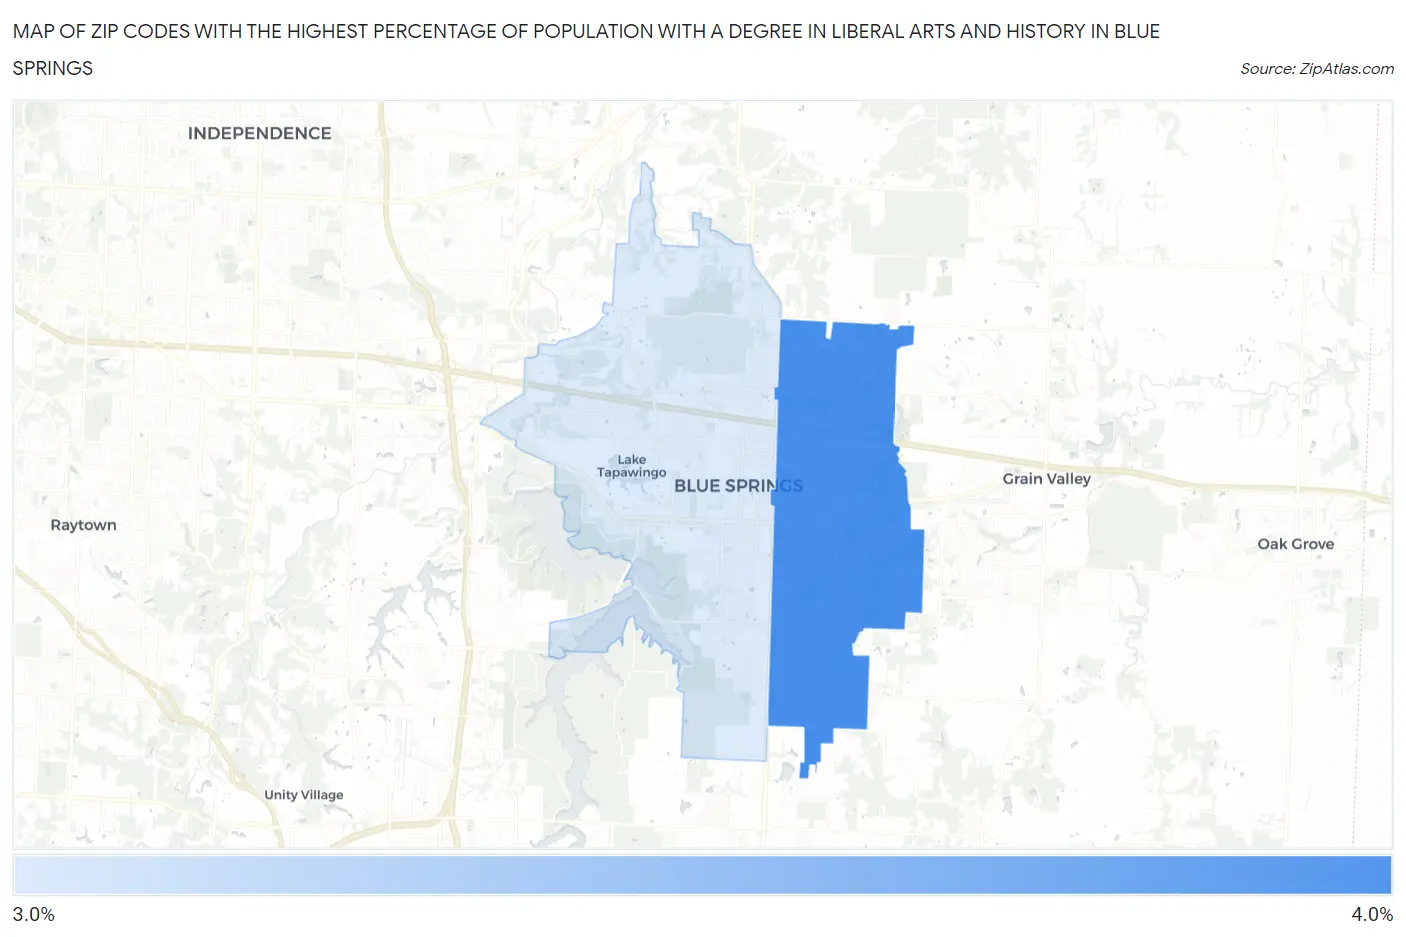
Map of Zip Codes with the Highest Percentage of Population with a Degree in Liberal Arts and History in Blue Springs
3.4%
3.5%
Zip Codes with the Highest Percentage of Population with a Degree in Liberal Arts and History in Blue Springs, MO
| Zip Code | % Graduates | vs State | vs National | |
| 1. | 64014 | 3.5% | 4.6%(-1.06)#427 | 4.9%(-1.36)#16,546 |
| 2. | 64015 | 3.4% | 4.6%(-1.15)#437 | 4.9%(-1.45)#16,899 |
1
Common Questions
What are the Top Zip Codes with the Highest Percentage of Population with a Degree in Liberal Arts and History in Blue Springs, MO?
Top Zip Codes with the Highest Percentage of Population with a Degree in Liberal Arts and History in Blue Springs, MO are:
What zip code has the Highest Percentage of Population with a Degree in Liberal Arts and History in Blue Springs, MO?
64014 has the Highest Percentage of Population with a Degree in Liberal Arts and History in Blue Springs, MO with 3.5%.
What is the Percentage of Population with a Degree in Liberal Arts and History in Blue Springs, MO?
Percentage of Population with a Degree in Liberal Arts and History in Blue Springs is 3.2%.
What is the Percentage of Population with a Degree in Liberal Arts and History in Missouri?
Percentage of Population with a Degree in Liberal Arts and History in Missouri is 4.6%.
What is the Percentage of Population with a Degree in Liberal Arts and History in the United States?
Percentage of Population with a Degree in Liberal Arts and History in the United States is 4.9%.