Zip Codes with the Highest Percentage of Population Employed in Computer, Engineering & Science in Livonia, MI
RELATED REPORTS & OPTIONS
Computer, Engineering & Science
Livonia
Compare Zip Codes
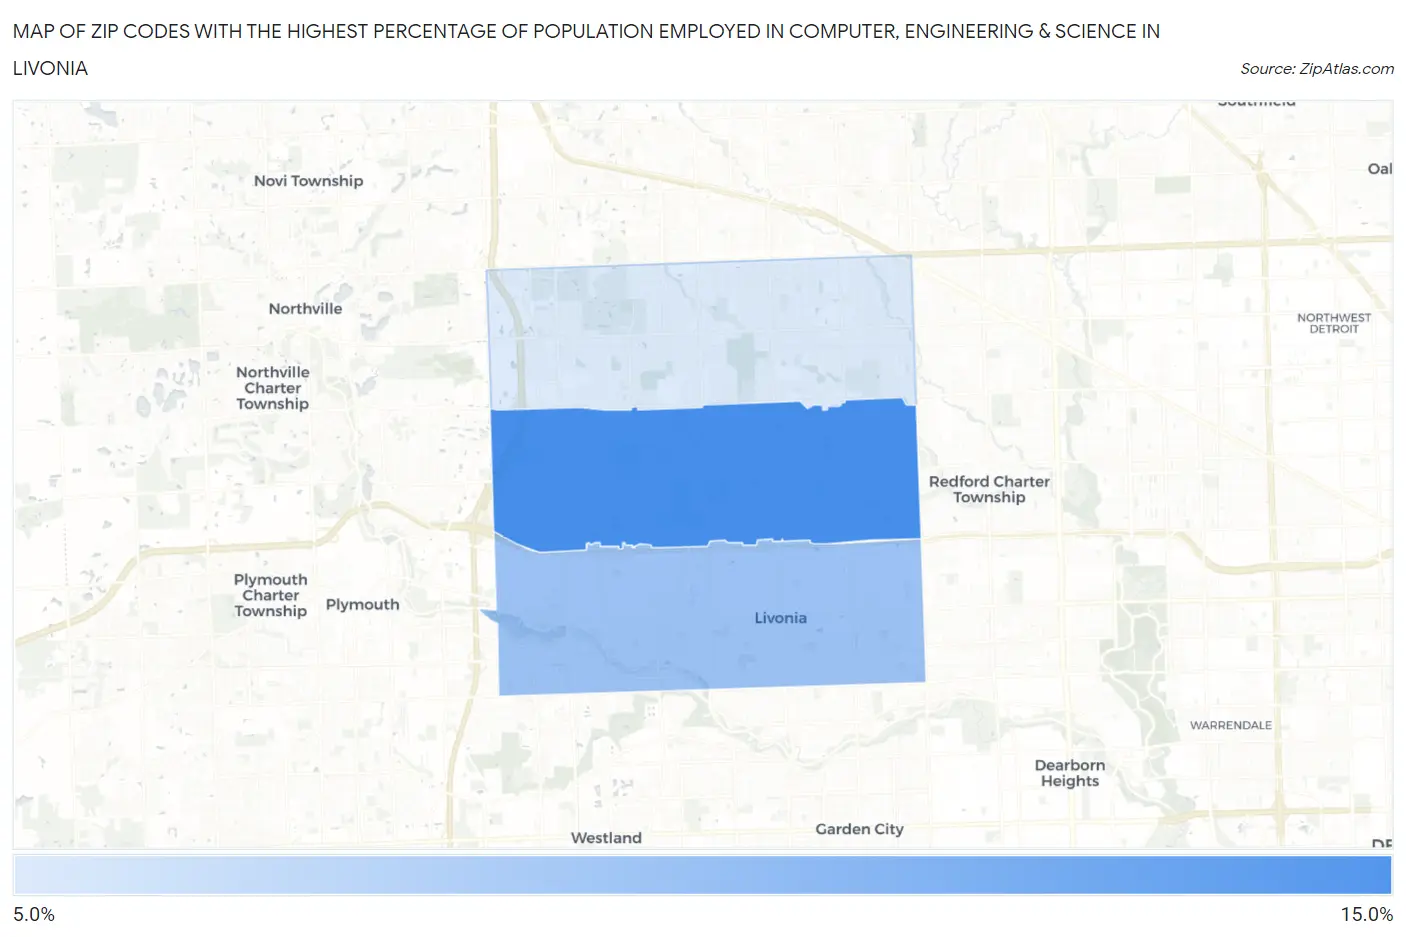
Map of Zip Codes with the Highest Percentage of Population Employed in Computer, Engineering & Science in Livonia
9.3%
12.3%
Zip Codes with the Highest Percentage of Population Employed in Computer, Engineering & Science in Livonia, MI
| Zip Code | % Employed | vs State | vs National | |
| 1. | 48154 | 12.3% | 7.2%(+5.14)#55 | 6.8%(+5.55)#1,891 |
| 2. | 48150 | 10.6% | 7.2%(+3.42)#86 | 6.8%(+3.83)#2,799 |
| 3. | 48152 | 9.3% | 7.2%(+2.15)#116 | 6.8%(+2.57)#3,757 |
1
Common Questions
What are the Top Zip Codes with the Highest Percentage of Population Employed in Computer, Engineering & Science in Livonia, MI?
Top Zip Codes with the Highest Percentage of Population Employed in Computer, Engineering & Science in Livonia, MI are:
What zip code has the Highest Percentage of Population Employed in Computer, Engineering & Science in Livonia, MI?
48154 has the Highest Percentage of Population Employed in Computer, Engineering & Science in Livonia, MI with 12.3%.
What is the Percentage of Population Employed in Computer, Engineering & Science in Livonia, MI?
Percentage of Population Employed in Computer, Engineering & Science in Livonia is 10.8%.
What is the Percentage of Population Employed in Computer, Engineering & Science in Michigan?
Percentage of Population Employed in Computer, Engineering & Science in Michigan is 7.2%.
What is the Percentage of Population Employed in Computer, Engineering & Science in the United States?
Percentage of Population Employed in Computer, Engineering & Science in the United States is 6.8%.