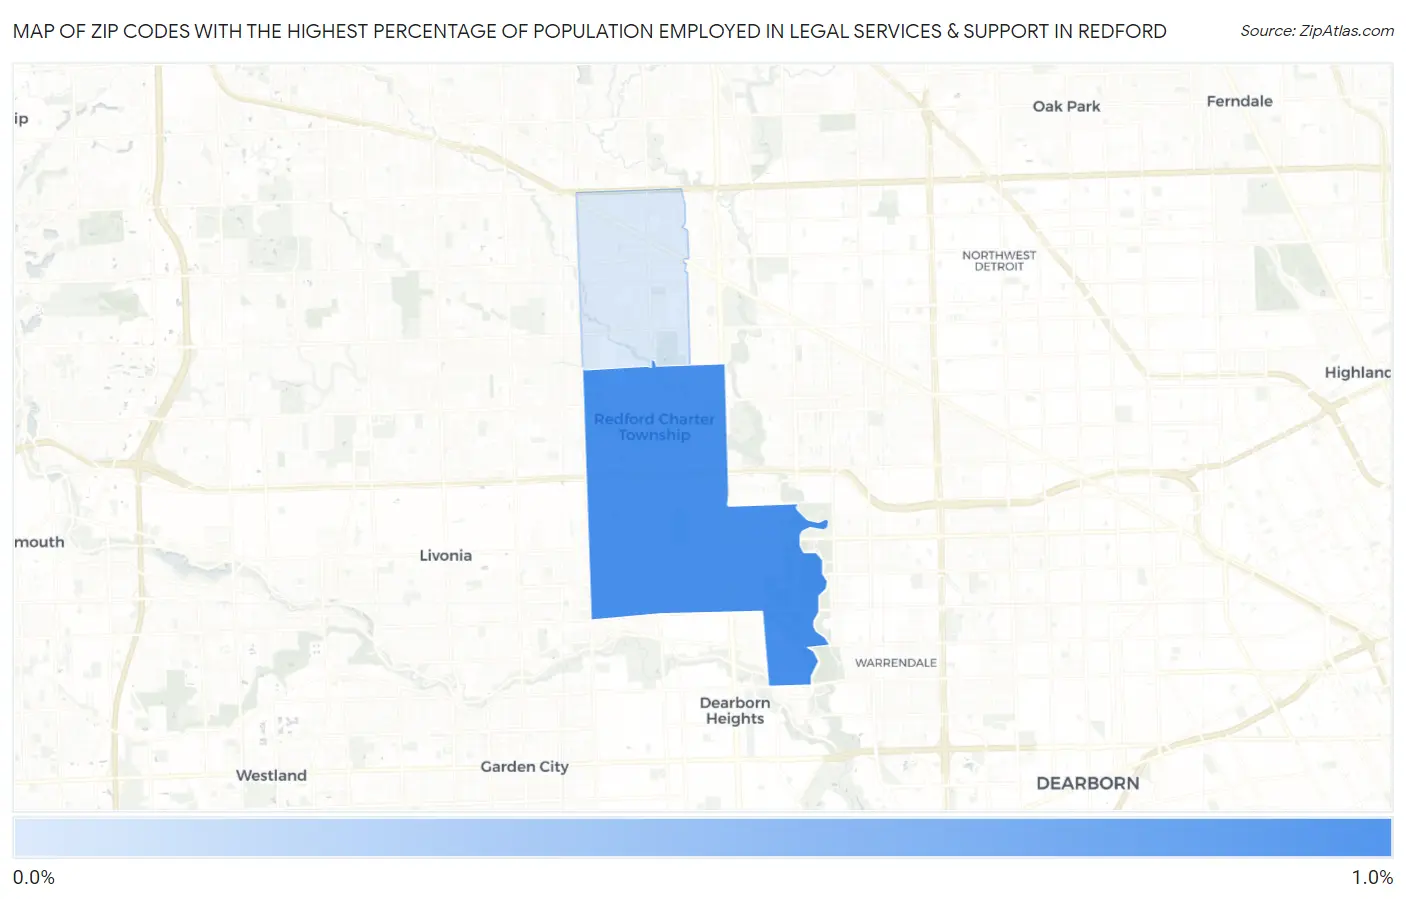
Zip Codes with the Highest Percentage of Population Employed in Legal Services & Support in Redford, MI
RELATED REPORTS & OPTIONS
Legal Services & Support
Redford
Compare Zip Codes
Map of Zip Codes with the Highest Percentage of Population Employed in Legal Services & Support in Redford
0.073%
0.92%
Zip Codes with the Highest Percentage of Population Employed in Legal Services & Support in Redford, MI
| Zip Code | % Employed | vs State | vs National | |
| 1. | 48239 | 0.92% | 0.89%(+0.031)#221 | 1.2%(-0.268)#8,467 |
| 2. | 48240 | 0.073% | 0.89%(-0.812)#608 | 1.2%(-1.11)#17,313 |
1
Common Questions
What are the Top Zip Codes with the Highest Percentage of Population Employed in Legal Services & Support in Redford, MI?
Top Zip Codes with the Highest Percentage of Population Employed in Legal Services & Support in Redford, MI are:
What zip code has the Highest Percentage of Population Employed in Legal Services & Support in Redford, MI?
48239 has the Highest Percentage of Population Employed in Legal Services & Support in Redford, MI with 0.92%.
What is the Percentage of Population Employed in Legal Services & Support in Michigan?
Percentage of Population Employed in Legal Services & Support in Michigan is 0.89%.
What is the Percentage of Population Employed in Legal Services & Support in the United States?
Percentage of Population Employed in Legal Services & Support in the United States is 1.2%.