Cities with the Highest Unemployment Rate Amomg Youth Under the Age of 25 in Maine
RELATED REPORTS & OPTIONS
Highest Unemployment | Youth < 25
Maine
Compare Cities
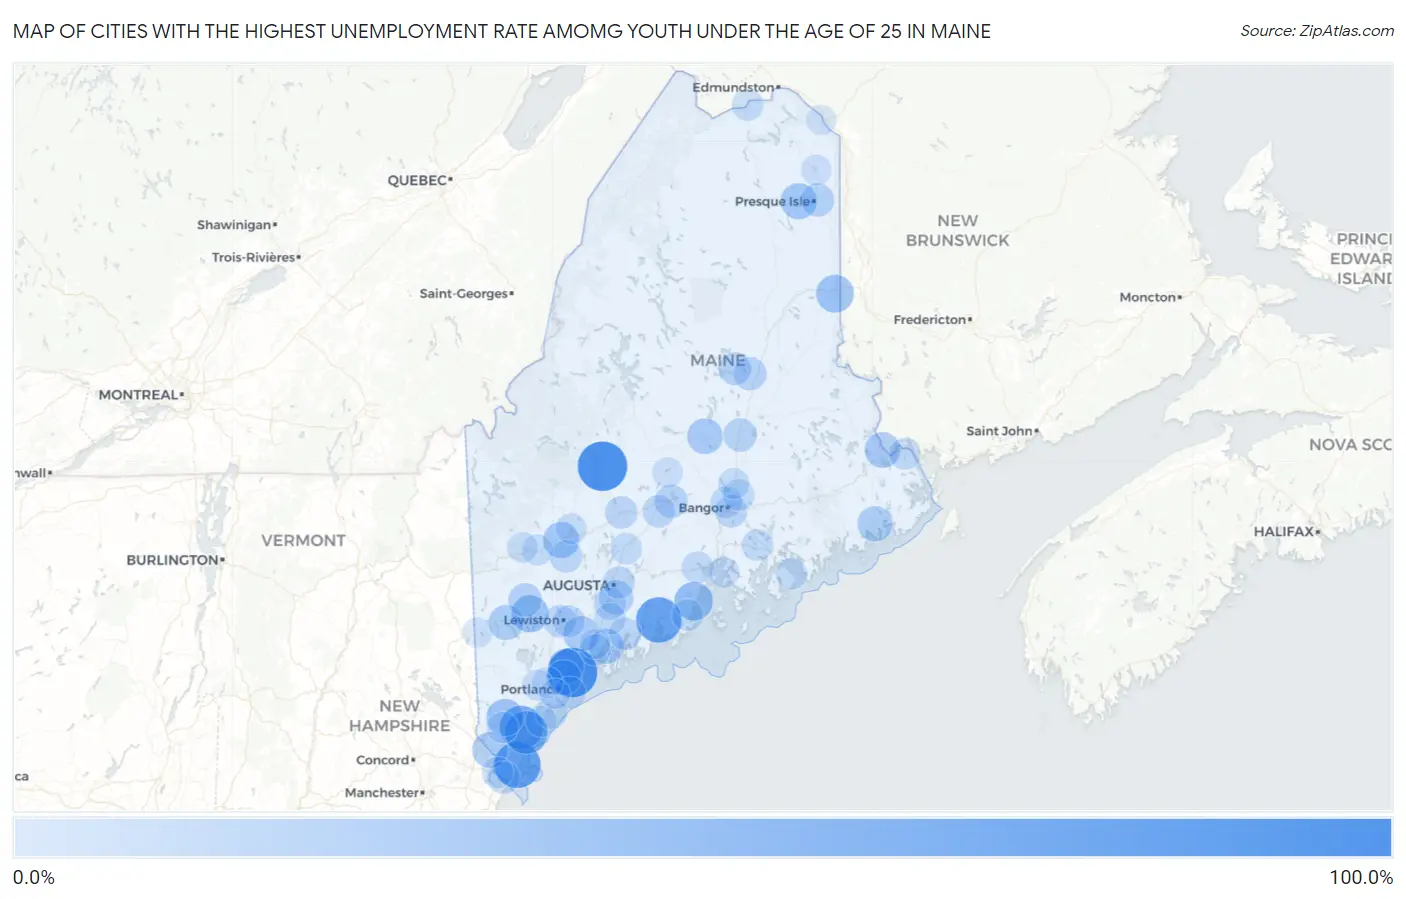
Map of Cities with the Highest Unemployment Rate Amomg Youth Under the Age of 25 in Maine
0.0%
100.0%
Cities with the Highest Unemployment Rate Amomg Youth Under the Age of 25 in Maine
| City | Youth Unemployment | vs State | vs National | |
| 1. | Bingham | 100.0% | 8.8%(+91.2)#1 | 10.9%(+89.1)#86 |
| 2. | Cousins Island | 100.0% | 8.8%(+91.2)#2 | 10.9%(+89.1)#105 |
| 3. | Cape Neddick | 82.1% | 8.8%(+73.3)#3 | 10.9%(+71.2)#445 |
| 4. | Waldoboro | 78.0% | 8.8%(+69.2)#4 | 10.9%(+67.1)#479 |
| 5. | West Kennebunk | 66.6% | 8.8%(+57.8)#5 | 10.9%(+55.7)#635 |
| 6. | Danforth | 66.6% | 8.8%(+57.8)#6 | 10.9%(+55.7)#637 |
| 7. | Kennebunk | 65.3% | 8.8%(+56.5)#7 | 10.9%(+54.4)#670 |
| 8. | Mattawamkeag | 57.0% | 8.8%(+48.2)#8 | 10.9%(+46.1)#866 |
| 9. | Grand Isle | 50.0% | 8.8%(+41.2)#9 | 10.9%(+39.1)#1,120 |
| 10. | Brownville Junction | 49.9% | 8.8%(+41.1)#10 | 10.9%(+39.0)#1,170 |
| 11. | Jonesport | 48.3% | 8.8%(+39.5)#11 | 10.9%(+37.4)#1,228 |
| 12. | Camden | 42.5% | 8.8%(+33.7)#12 | 10.9%(+31.6)#1,533 |
| 13. | Turner | 40.4% | 8.8%(+31.6)#13 | 10.9%(+29.5)#1,671 |
| 14. | Houlton | 37.7% | 8.8%(+28.9)#14 | 10.9%(+26.8)#1,869 |
| 15. | North Anson | 36.3% | 8.8%(+27.5)#15 | 10.9%(+25.4)#1,984 |
| 16. | Alfred | 35.4% | 8.8%(+26.6)#16 | 10.9%(+24.5)#2,068 |
| 17. | Oxford | 35.3% | 8.8%(+26.5)#17 | 10.9%(+24.4)#2,080 |
| 18. | Mapleton | 29.8% | 8.8%(+21.0)#18 | 10.9%(+18.9)#2,721 |
| 19. | Wilton | 29.7% | 8.8%(+20.9)#19 | 10.9%(+18.8)#2,729 |
| 20. | Berwick | 27.5% | 8.8%(+18.7)#20 | 10.9%(+16.6)#3,034 |
| 21. | Lisbon Falls | 27.0% | 8.8%(+18.2)#21 | 10.9%(+16.1)#3,114 |
| 22. | Milo | 26.9% | 8.8%(+18.1)#22 | 10.9%(+16.0)#3,136 |
| 23. | Woodland | 26.8% | 8.8%(+18.0)#23 | 10.9%(+15.9)#3,147 |
| 24. | Yarmouth | 26.3% | 8.8%(+17.5)#24 | 10.9%(+15.4)#3,233 |
| 25. | Falmouth Foreside | 25.4% | 8.8%(+16.6)#25 | 10.9%(+14.5)#3,403 |
| 26. | Bath | 25.2% | 8.8%(+16.4)#26 | 10.9%(+14.3)#3,432 |
| 27. | Rangeley | 24.9% | 8.8%(+16.1)#27 | 10.9%(+14.0)#3,533 |
| 28. | Bridgton | 24.5% | 8.8%(+15.7)#28 | 10.9%(+13.6)#3,605 |
| 29. | Machias | 24.5% | 8.8%(+15.7)#29 | 10.9%(+13.6)#3,609 |
| 30. | Randolph | 21.1% | 8.8%(+12.3)#30 | 10.9%(+10.2)#4,417 |
| 31. | Milbridge | 20.0% | 8.8%(+11.2)#31 | 10.9%(+9.10)#4,707 |
| 32. | Norway | 17.1% | 8.8%(+8.30)#32 | 10.9%(+6.20)#5,773 |
| 33. | Presque Isle | 16.5% | 8.8%(+7.70)#33 | 10.9%(+5.60)#6,036 |
| 34. | Howland | 16.3% | 8.8%(+7.50)#34 | 10.9%(+5.40)#6,104 |
| 35. | East Millinocket | 15.3% | 8.8%(+6.50)#35 | 10.9%(+4.40)#6,542 |
| 36. | Newport | 15.3% | 8.8%(+6.50)#36 | 10.9%(+4.40)#6,543 |
| 37. | Millinocket | 13.9% | 8.8%(+5.10)#37 | 10.9%(+3.00)#7,260 |
| 38. | Chisholm | 12.5% | 8.8%(+3.70)#38 | 10.9%(+1.60)#8,121 |
| 39. | Skowhegan | 11.9% | 8.8%(+3.10)#39 | 10.9%(+1.00)#8,474 |
| 40. | Auburn | 11.7% | 8.8%(+2.90)#40 | 10.9%(+0.800)#8,568 |
| 41. | Kittery | 11.7% | 8.8%(+2.90)#41 | 10.9%(+0.800)#8,586 |
| 42. | Brewer | 11.6% | 8.8%(+2.80)#42 | 10.9%(+0.700)#8,661 |
| 43. | Pittsfield | 11.5% | 8.8%(+2.70)#43 | 10.9%(+0.600)#8,735 |
| 44. | Gardiner | 10.4% | 8.8%(+1.60)#44 | 10.9%(-0.500)#9,505 |
| 45. | Wiscasset | 10.0% | 8.8%(+1.20)#45 | 10.9%(-0.900)#9,831 |
| 46. | Augusta | 9.9% | 8.8%(+1.10)#46 | 10.9%(-1.000)#9,878 |
| 47. | Old Orchard Beach | 9.7% | 8.8%(+0.900)#47 | 10.9%(-1.20)#10,046 |
| 48. | Lewiston | 9.0% | 8.8%(+0.200)#48 | 10.9%(-1.90)#10,555 |
| 49. | Portland | 8.7% | 8.8%(-0.100)#49 | 10.9%(-2.20)#10,822 |
| 50. | Bangor | 8.7% | 8.8%(-0.100)#50 | 10.9%(-2.20)#10,833 |
| 51. | Calais | 8.7% | 8.8%(-0.100)#51 | 10.9%(-2.20)#10,872 |
| 52. | Belfast | 8.6% | 8.8%(-0.200)#52 | 10.9%(-2.30)#10,935 |
| 53. | Ellsworth | 8.0% | 8.8%(-0.800)#53 | 10.9%(-2.90)#11,422 |
| 54. | Fort Kent | 7.7% | 8.8%(-1.10)#54 | 10.9%(-3.20)#11,663 |
| 55. | Waterville | 7.6% | 8.8%(-1.20)#55 | 10.9%(-3.30)#11,700 |
| 56. | Orono | 7.4% | 8.8%(-1.40)#56 | 10.9%(-3.50)#11,889 |
| 57. | Richmond | 7.3% | 8.8%(-1.50)#57 | 10.9%(-3.60)#12,003 |
| 58. | Rockland | 7.0% | 8.8%(-1.80)#58 | 10.9%(-3.90)#12,200 |
| 59. | Corinna | 6.8% | 8.8%(-2.00)#59 | 10.9%(-4.10)#12,382 |
| 60. | Bar Harbor | 6.4% | 8.8%(-2.40)#60 | 10.9%(-4.50)#12,668 |
| 61. | Sanford | 6.2% | 8.8%(-2.60)#61 | 10.9%(-4.70)#12,785 |
| 62. | Brunswick | 6.2% | 8.8%(-2.60)#62 | 10.9%(-4.70)#12,789 |
| 63. | South Eliot | 6.0% | 8.8%(-2.80)#63 | 10.9%(-4.90)#12,978 |
| 64. | Dixfield | 5.2% | 8.8%(-3.60)#64 | 10.9%(-5.70)#13,631 |
| 65. | Old Town | 5.1% | 8.8%(-3.70)#65 | 10.9%(-5.80)#13,691 |
| 66. | Biddeford | 4.8% | 8.8%(-4.00)#66 | 10.9%(-6.10)#13,867 |
| 67. | Westbrook | 4.7% | 8.8%(-4.10)#67 | 10.9%(-6.20)#13,941 |
| 68. | Gorham | 4.6% | 8.8%(-4.20)#68 | 10.9%(-6.30)#14,049 |
| 69. | Farmington | 4.6% | 8.8%(-4.20)#69 | 10.9%(-6.30)#14,055 |
| 70. | Veazie | 3.1% | 8.8%(-5.70)#70 | 10.9%(-7.80)#15,092 |
| 71. | Castine | 2.9% | 8.8%(-5.90)#71 | 10.9%(-8.00)#15,229 |
| 72. | Dexter | 2.6% | 8.8%(-6.20)#72 | 10.9%(-8.30)#15,424 |
| 73. | Caribou | 2.4% | 8.8%(-6.40)#73 | 10.9%(-8.50)#15,508 |
| 74. | Rumford | 2.1% | 8.8%(-6.70)#74 | 10.9%(-8.80)#15,682 |
| 75. | South Portland | 2.0% | 8.8%(-6.80)#75 | 10.9%(-8.90)#15,709 |
| 76. | Topsham | 1.3% | 8.8%(-7.50)#76 | 10.9%(-9.60)#15,986 |
| 77. | Van Buren | 0.70% | 8.8%(-8.10)#77 | 10.9%(-10.2)#16,121 |
| 78. | Fryeburg | 0.60% | 8.8%(-8.20)#78 | 10.9%(-10.3)#16,139 |
1
Common Questions
What are the Top 10 Cities with the Highest Unemployment Rate Amomg Youth Under the Age of 25 in Maine?
Top 10 Cities with the Highest Unemployment Rate Amomg Youth Under the Age of 25 in Maine are:
#1
100.0%
#2
100.0%
#3
82.1%
#4
78.0%
#5
66.6%
#6
65.3%
#7
42.5%
#8
37.7%
#9
35.4%
#10
35.3%
What city has the Highest Unemployment Rate Amomg Youth Under the Age of 25 in Maine?
Bingham has the Highest Unemployment Rate Amomg Youth Under the Age of 25 in Maine with 100.0%.
What is the Unemployment Rate Amomg Youth Under the Age of 25 in the State of Maine?
Unemployment Rate Amomg Youth Under the Age of 25 in Maine is 8.8%.
What is the Unemployment Rate Amomg Youth Under the Age of 25 in the United States?
Unemployment Rate Amomg Youth Under the Age of 25 in the United States is 10.9%.