Wiscasset, ME Map & Demographics
Wiscasset Map
Wiscasset Overview
$41,606
PER CAPITA INCOME
$81,612
AVG FAMILY INCOME
$102,792
AVG HOUSEHOLD INCOME
6.6%
WAGE / INCOME GAP [ % ]
93.4¢/ $1
WAGE / INCOME GAP [ $ ]
0.29
INEQUALITY / GINI INDEX
1,207
TOTAL POPULATION
667
MALE POPULATION
540
FEMALE POPULATION
123.52
MALES / 100 FEMALES
80.96
FEMALES / 100 MALES
47.8
MEDIAN AGE
3.0
AVG FAMILY SIZE
2.1
AVG HOUSEHOLD SIZE
732
LABOR FORCE [ PEOPLE ]
65.5%
PERCENT IN LABOR FORCE
3.3%
UNEMPLOYMENT RATE
Wiscasset Zip Codes
Wiscasset Area Codes
Income in Wiscasset
Income Overview in Wiscasset
Per Capita Income in Wiscasset is $41,606, while median incomes of families and households are $81,612 and $102,792 respectively.
| Characteristic | Number | Measure |
| Per Capita Income | 1,207 | $41,606 |
| Median Family Income | 194 | $81,612 |
| Mean Family Income | 194 | $83,972 |
| Median Household Income | 539 | $102,792 |
| Mean Household Income | 539 | $88,256 |
| Income Deficit | 194 | $0 |
| Wage / Income Gap (%) | 1,207 | 6.63% |
| Wage / Income Gap ($) | 1,207 | 93.37¢ per $1 |
| Gini / Inequality Index | 1,207 | 0.29 |
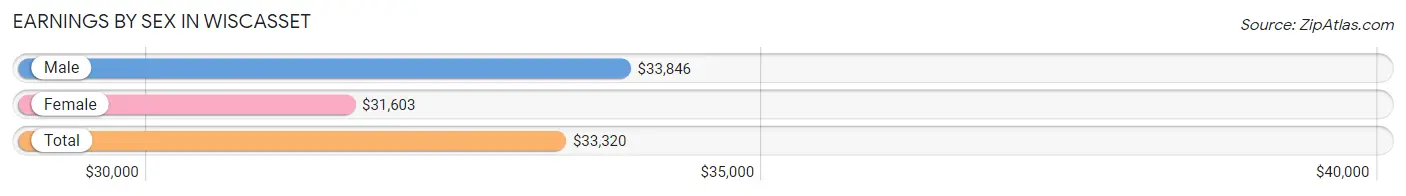
Earnings by Sex in Wiscasset
Average Earnings in Wiscasset are $33,320, $33,846 for men and $31,603 for women, a difference of 6.6%.
| Sex | Number | Average Earnings |
| Male | 357 (45.5%) | $33,846 |
| Female | 428 (54.5%) | $31,603 |
| Total | 785 (100.0%) | $33,320 |
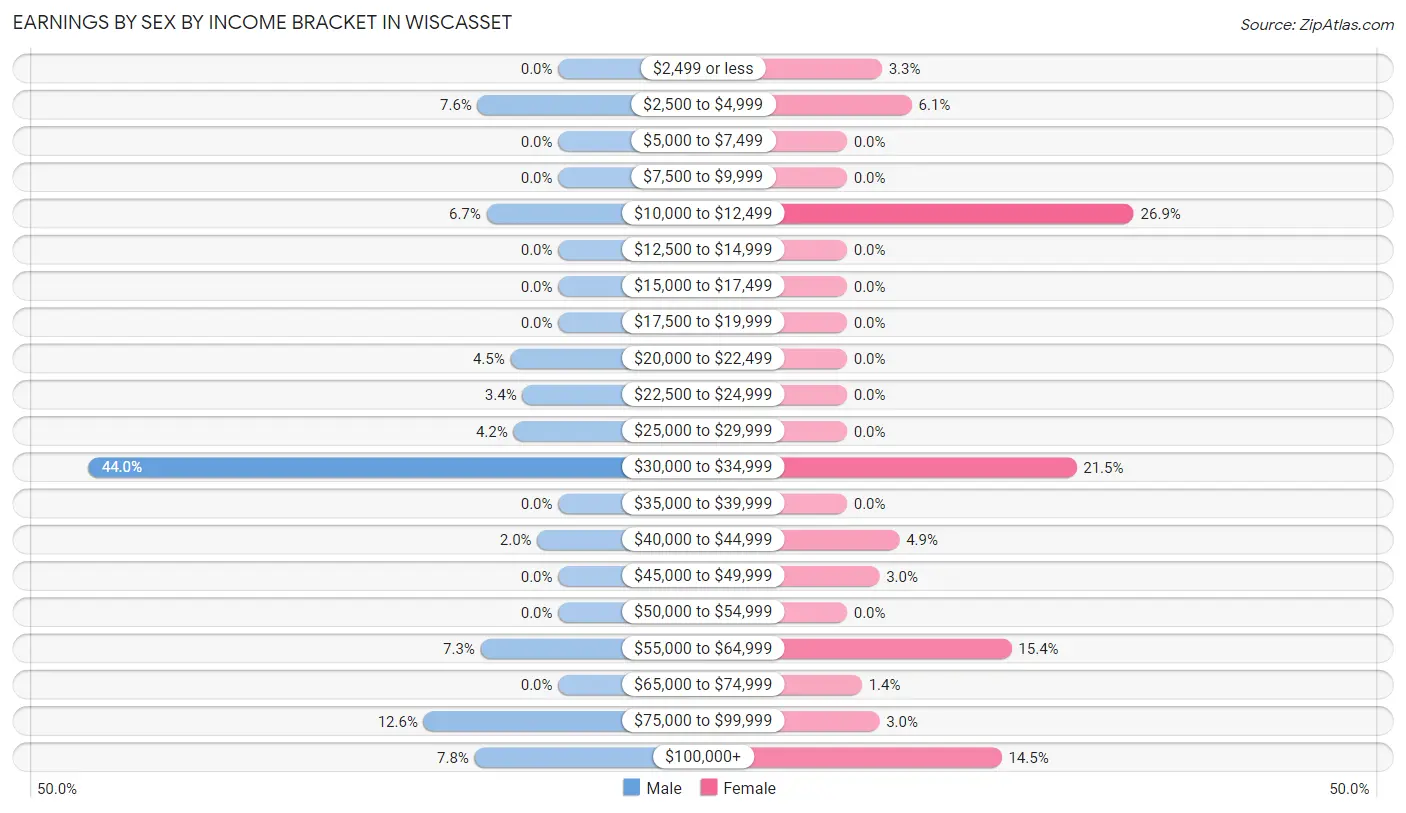
Earnings by Sex by Income Bracket in Wiscasset
The most common earnings brackets in Wiscasset are $30,000 to $34,999 for men (157 | 44.0%) and $10,000 to $12,499 for women (115 | 26.9%).
| Income | Male | Female |
| $2,499 or less | 0 (0.0%) | 14 (3.3%) |
| $2,500 to $4,999 | 27 (7.6%) | 26 (6.1%) |
| $5,000 to $7,499 | 0 (0.0%) | 0 (0.0%) |
| $7,500 to $9,999 | 0 (0.0%) | 0 (0.0%) |
| $10,000 to $12,499 | 24 (6.7%) | 115 (26.9%) |
| $12,500 to $14,999 | 0 (0.0%) | 0 (0.0%) |
| $15,000 to $17,499 | 0 (0.0%) | 0 (0.0%) |
| $17,500 to $19,999 | 0 (0.0%) | 0 (0.0%) |
| $20,000 to $22,499 | 16 (4.5%) | 0 (0.0%) |
| $22,500 to $24,999 | 12 (3.4%) | 0 (0.0%) |
| $25,000 to $29,999 | 15 (4.2%) | 0 (0.0%) |
| $30,000 to $34,999 | 157 (44.0%) | 92 (21.5%) |
| $35,000 to $39,999 | 0 (0.0%) | 0 (0.0%) |
| $40,000 to $44,999 | 7 (2.0%) | 21 (4.9%) |
| $45,000 to $49,999 | 0 (0.0%) | 13 (3.0%) |
| $50,000 to $54,999 | 0 (0.0%) | 0 (0.0%) |
| $55,000 to $64,999 | 26 (7.3%) | 66 (15.4%) |
| $65,000 to $74,999 | 0 (0.0%) | 6 (1.4%) |
| $75,000 to $99,999 | 45 (12.6%) | 13 (3.0%) |
| $100,000+ | 28 (7.8%) | 62 (14.5%) |
| Total | 357 (100.0%) | 428 (100.0%) |
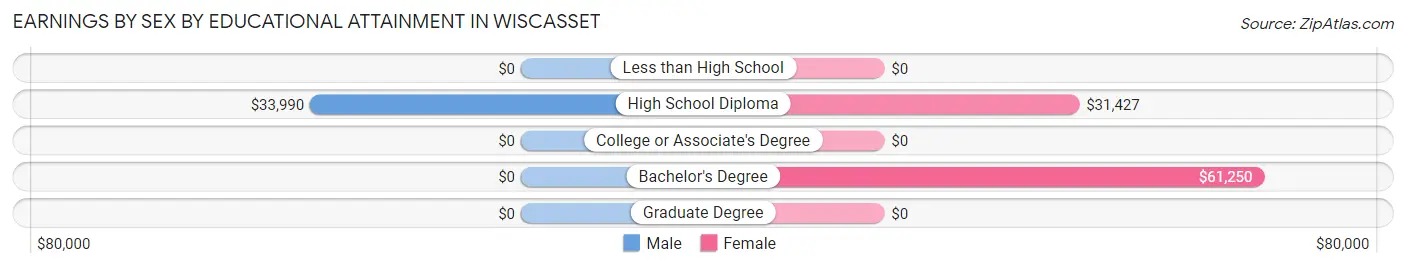
Earnings by Sex by Educational Attainment in Wiscasset
Average earnings in Wiscasset are $34,110 for men and $59,375 for women, a difference of 42.5%. Men with an educational attainment of high school diploma enjoy the highest average annual earnings of $33,990, while those with high school diploma education earn the least with $33,990. Women with an educational attainment of bachelor's degree earn the most with the average annual earnings of $61,250, while those with high school diploma education have the smallest earnings of $31,427.
| Educational Attainment | Male Income | Female Income |
| Less than High School | - | - |
| High School Diploma | $33,990 | $31,427 |
| College or Associate's Degree | - | - |
| Bachelor's Degree | - | - |
| Graduate Degree | - | - |
| Total | $34,110 | $59,375 |
Family Income in Wiscasset
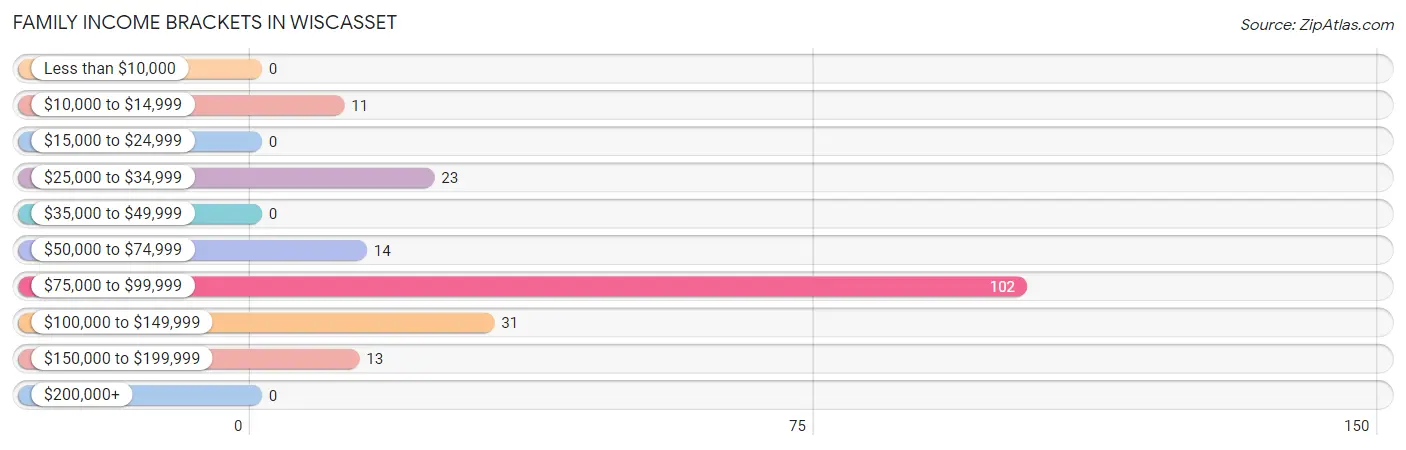
Family Income Brackets in Wiscasset
According to the Wiscasset family income data, there are 102 families falling into the $75,000 to $99,999 income range, which is the most common income bracket and makes up 52.6% of all families.
| Income Bracket | # Families | % Families |
| Less than $10,000 | 0 | 0.0% |
| $10,000 to $14,999 | 11 | 5.7% |
| $15,000 to $24,999 | 0 | 0.0% |
| $25,000 to $34,999 | 23 | 11.9% |
| $35,000 to $49,999 | 0 | 0.0% |
| $50,000 to $74,999 | 14 | 7.2% |
| $75,000 to $99,999 | 102 | 52.6% |
| $100,000 to $149,999 | 31 | 16.0% |
| $150,000 to $199,999 | 13 | 6.7% |
| $200,000+ | 0 | 0.0% |
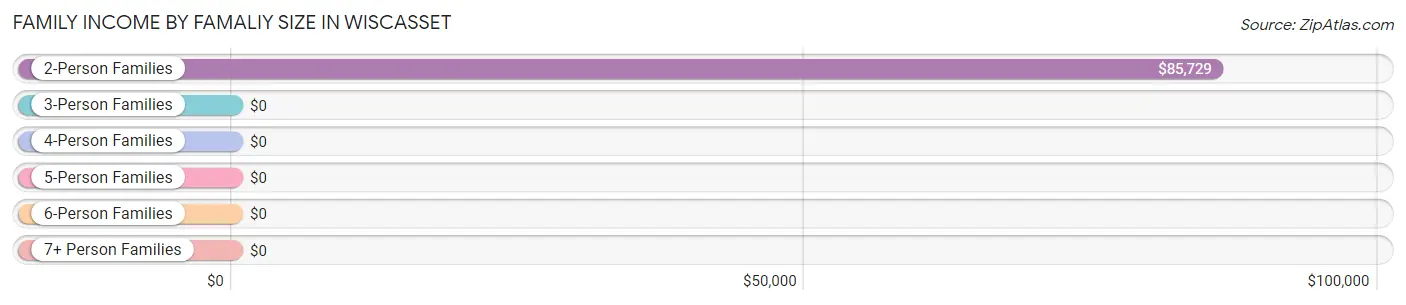
Family Income by Famaliy Size in Wiscasset
2-person families (103 | 53.1%) account for the highest median family income in Wiscasset with $85,729 per family, while 2-person families (103 | 53.1%) have the highest median income of $42,864 per family member.
| Income Bracket | # Families | Median Income |
| 2-Person Families | 103 (53.1%) | $85,729 |
| 3-Person Families | 15 (7.7%) | $0 |
| 4-Person Families | 76 (39.2%) | $0 |
| 5-Person Families | 0 (0.0%) | $0 |
| 6-Person Families | 0 (0.0%) | $0 |
| 7+ Person Families | 0 (0.0%) | $0 |
| Total | 194 (100.0%) | $81,612 |
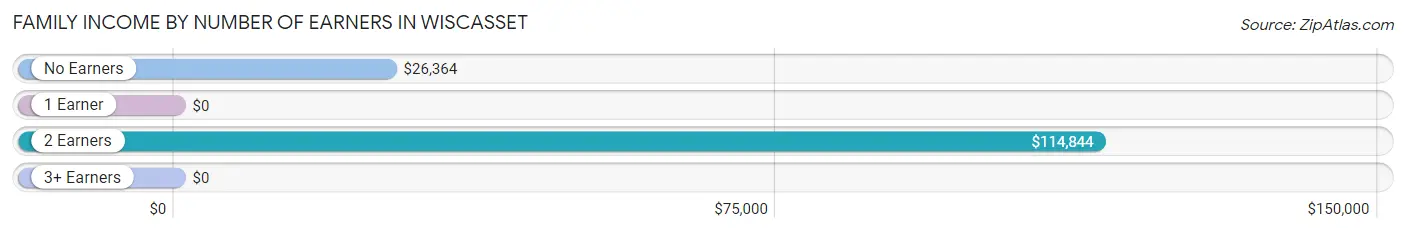
Family Income by Number of Earners in Wiscasset
| Number of Earners | # Families | Median Income |
| No Earners | 34 (17.5%) | $26,364 |
| 1 Earner | 26 (13.4%) | $0 |
| 2 Earners | 58 (29.9%) | $114,844 |
| 3+ Earners | 76 (39.2%) | $0 |
| Total | 194 (100.0%) | $81,612 |
Household Income in Wiscasset
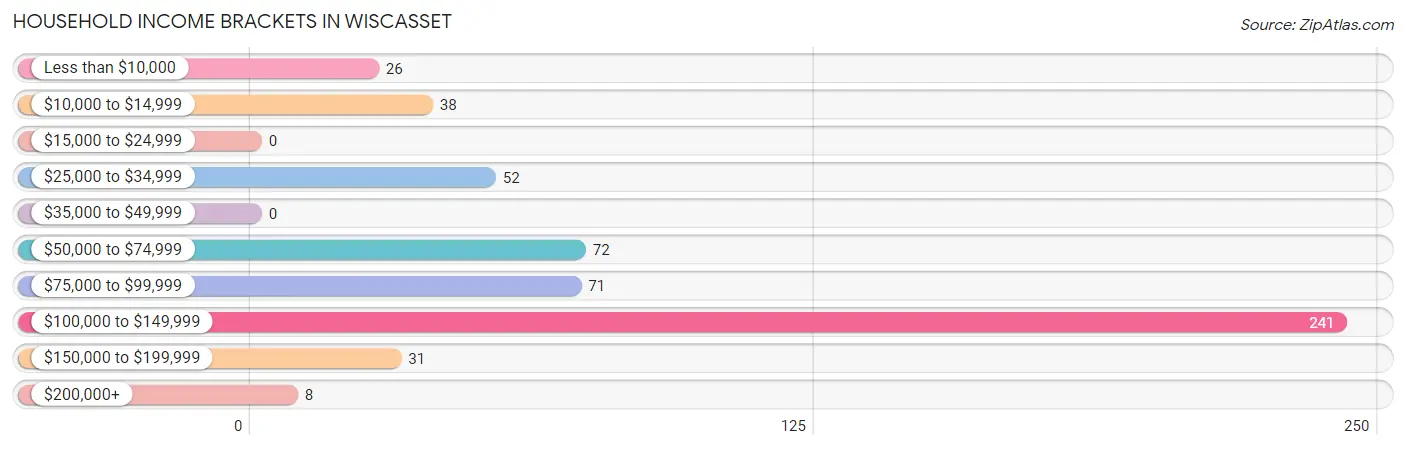
Household Income Brackets in Wiscasset
With 241 households falling in the category, the $100,000 to $149,999 income range is the most frequent in Wiscasset, accounting for 44.7% of all households.
| Income Bracket | # Households | % Households |
| Less than $10,000 | 26 | 4.8% |
| $10,000 to $14,999 | 38 | 7.1% |
| $15,000 to $24,999 | 0 | 0.0% |
| $25,000 to $34,999 | 52 | 9.6% |
| $35,000 to $49,999 | 0 | 0.0% |
| $50,000 to $74,999 | 72 | 13.4% |
| $75,000 to $99,999 | 71 | 13.2% |
| $100,000 to $149,999 | 241 | 44.7% |
| $150,000 to $199,999 | 31 | 5.8% |
| $200,000+ | 8 | 1.5% |
Household Income by Householder Age in Wiscasset
The median household income in Wiscasset is $102,792, with the highest median household income of $114,219 found in the 45 to 64 years age bracket for the primary householder. A total of 254 households (47.1%) fall into this category. Meanwhile, the 15 to 24 years age bracket for the primary householder has the lowest median household income of $0, with 26 households (4.8%) in this group.
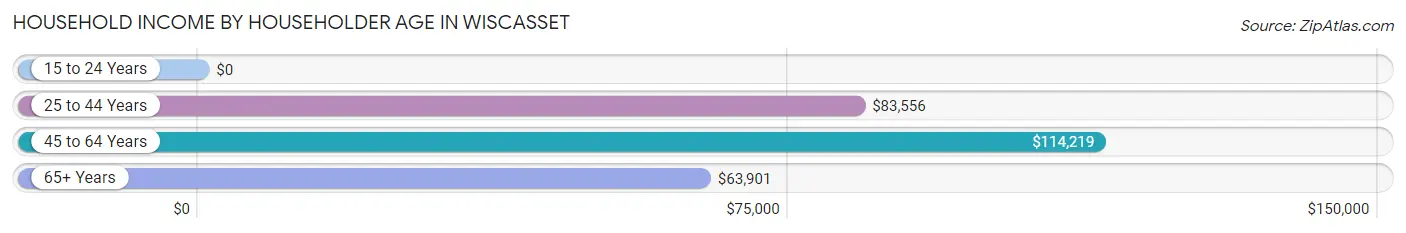
| Income Bracket | # Households | Median Income |
| 15 to 24 Years | 26 (4.8%) | $0 |
| 25 to 44 Years | 68 (12.6%) | $83,556 |
| 45 to 64 Years | 254 (47.1%) | $114,219 |
| 65+ Years | 191 (35.4%) | $63,901 |
| Total | 539 (100.0%) | $102,792 |
Poverty in Wiscasset
Income Below Poverty by Sex and Age in Wiscasset
With 12.4% poverty level for males and 10.9% for females among the residents of Wiscasset, 16 and 17 year old males and 35 to 44 year old females are the most vulnerable to poverty, with 9 males (100.0%) and 10 females (100.0%) in their respective age groups living below the poverty level.
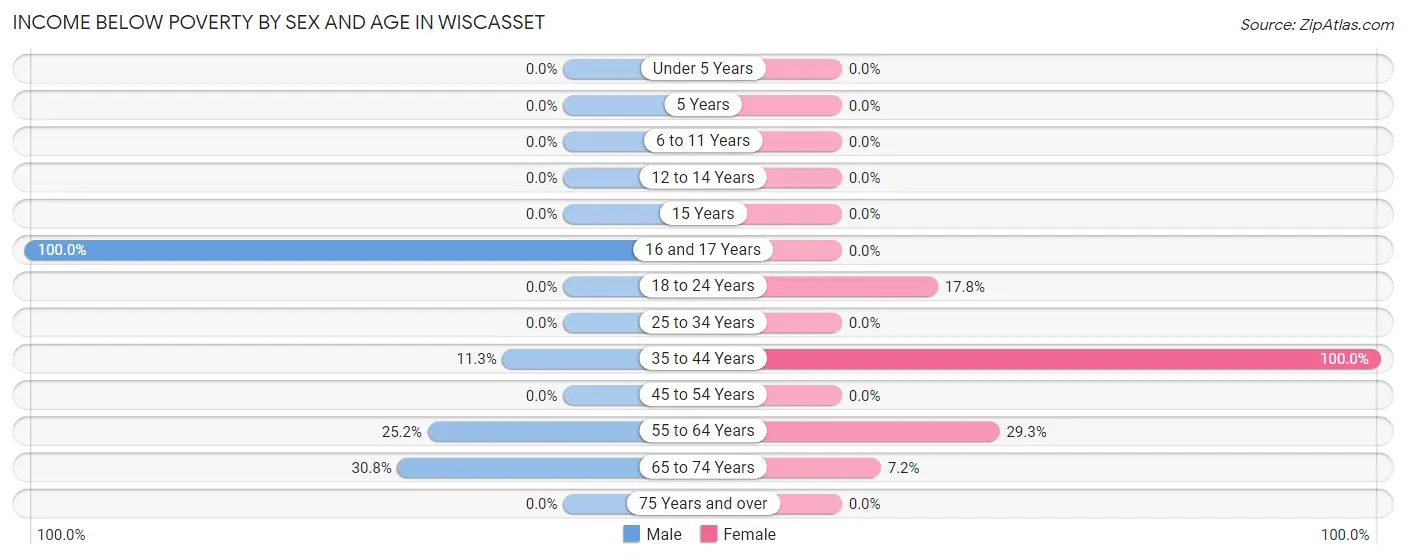
| Age Bracket | Male | Female |
| Under 5 Years | 0 (0.0%) | 0 (0.0%) |
| 5 Years | 0 (0.0%) | 0 (0.0%) |
| 6 to 11 Years | 0 (0.0%) | 0 (0.0%) |
| 12 to 14 Years | 0 (0.0%) | 0 (0.0%) |
| 15 Years | 0 (0.0%) | 0 (0.0%) |
| 16 and 17 Years | 9 (100.0%) | 0 (0.0%) |
| 18 to 24 Years | 0 (0.0%) | 26 (17.8%) |
| 25 to 34 Years | 0 (0.0%) | 0 (0.0%) |
| 35 to 44 Years | 15 (11.3%) | 10 (100.0%) |
| 45 to 54 Years | 0 (0.0%) | 0 (0.0%) |
| 55 to 64 Years | 40 (25.2%) | 12 (29.3%) |
| 65 to 74 Years | 12 (30.8%) | 11 (7.2%) |
| 75 Years and over | 0 (0.0%) | 0 (0.0%) |
| Total | 76 (12.4%) | 59 (10.9%) |
Income Above Poverty by Sex and Age in Wiscasset
According to the poverty statistics in Wiscasset, males aged 6 to 11 years and females aged 12 to 14 years are the age groups that are most secure financially, with 100.0% of males and 100.0% of females in these age groups living above the poverty line.
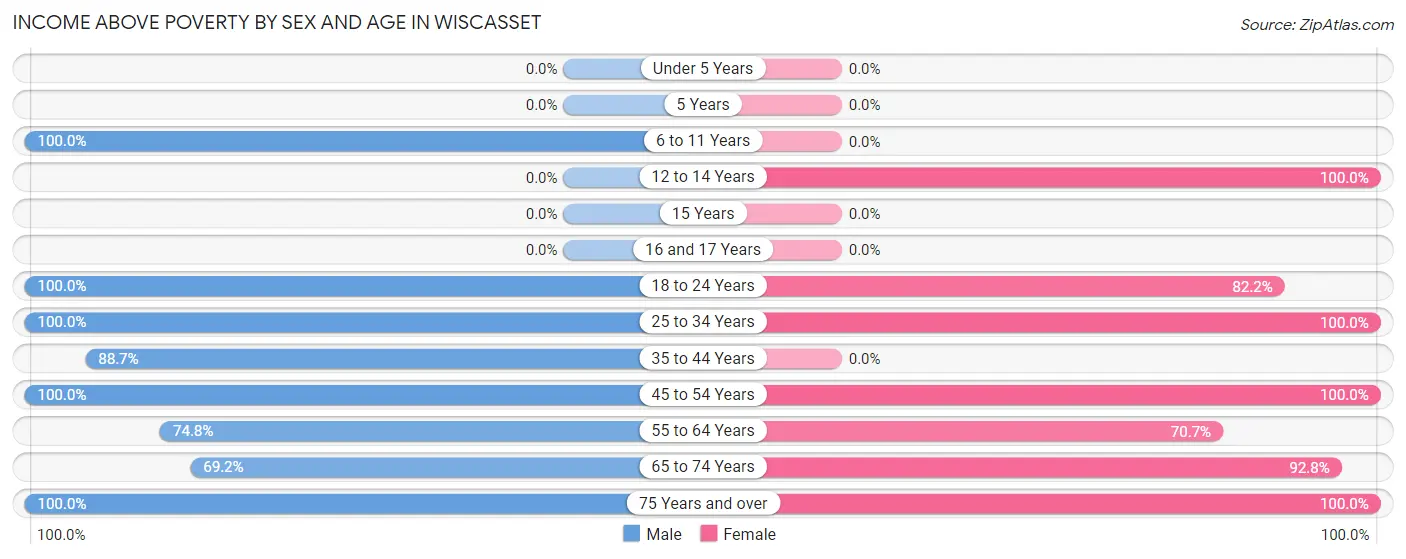
| Age Bracket | Male | Female |
| Under 5 Years | 0 (0.0%) | 0 (0.0%) |
| 5 Years | 0 (0.0%) | 0 (0.0%) |
| 6 to 11 Years | 73 (100.0%) | 0 (0.0%) |
| 12 to 14 Years | 0 (0.0%) | 17 (100.0%) |
| 15 Years | 0 (0.0%) | 0 (0.0%) |
| 16 and 17 Years | 0 (0.0%) | 0 (0.0%) |
| 18 to 24 Years | 84 (100.0%) | 120 (82.2%) |
| 25 to 34 Years | 7 (100.0%) | 14 (100.0%) |
| 35 to 44 Years | 118 (88.7%) | 0 (0.0%) |
| 45 to 54 Years | 88 (100.0%) | 137 (100.0%) |
| 55 to 64 Years | 119 (74.8%) | 29 (70.7%) |
| 65 to 74 Years | 27 (69.2%) | 141 (92.8%) |
| 75 Years and over | 22 (100.0%) | 23 (100.0%) |
| Total | 538 (87.6%) | 481 (89.1%) |
Income Below Poverty Among Married-Couple Families in Wiscasset
The poverty statistics for married-couple families in Wiscasset show that 12.2% or 11 of the total 90 families live below the poverty line. Families with no children have the highest poverty rate of 14.7%, comprising of 11 families. On the other hand, families with 1 or 2 children have the lowest poverty rate of 0.0%, which includes 0 families.
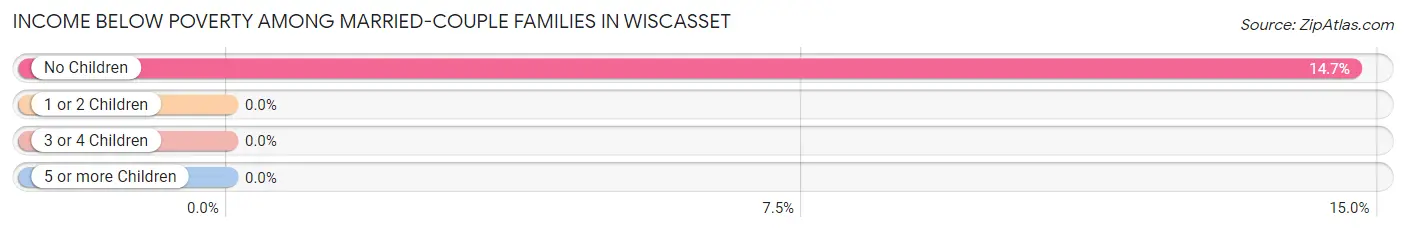
| Children | Above Poverty | Below Poverty |
| No Children | 64 (85.3%) | 11 (14.7%) |
| 1 or 2 Children | 15 (100.0%) | 0 (0.0%) |
| 3 or 4 Children | 0 (0.0%) | 0 (0.0%) |
| 5 or more Children | 0 (0.0%) | 0 (0.0%) |
| Total | 79 (87.8%) | 11 (12.2%) |
Income Below Poverty Among Single-Parent Households in Wiscasset
| Children | Single Father | Single Mother |
| No Children | 0 (0.0%) | 0 (0.0%) |
| 1 or 2 Children | 0 (0.0%) | 0 (0.0%) |
| 3 or 4 Children | 0 (0.0%) | 0 (0.0%) |
| 5 or more Children | 0 (0.0%) | 0 (0.0%) |
| Total | 0 (0.0%) | 0 (0.0%) |
Income Below Poverty Among Married-Couple vs Single-Parent Households in Wiscasset
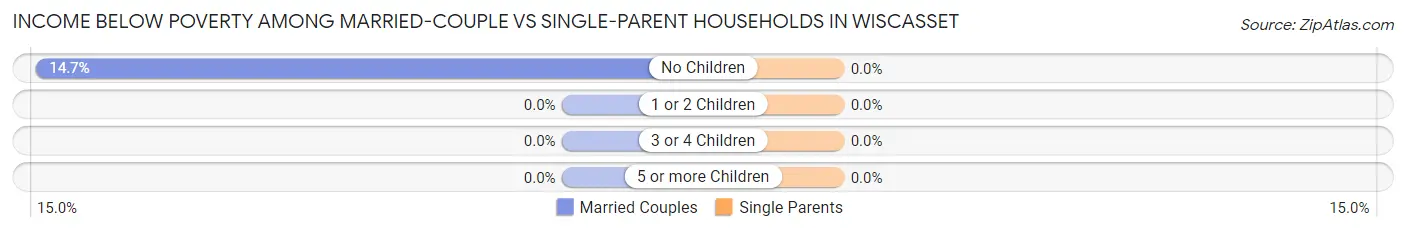
| Children | Married-Couple Families | Single-Parent Households |
| No Children | 11 (14.7%) | 0 (0.0%) |
| 1 or 2 Children | 0 (0.0%) | 0 (0.0%) |
| 3 or 4 Children | 0 (0.0%) | 0 (0.0%) |
| 5 or more Children | 0 (0.0%) | 0 (0.0%) |
| Total | 11 (12.2%) | 0 (0.0%) |
Race in Wiscasset
The most populous races in Wiscasset are White / Caucasian (1,123 | 93.0%), Black / African American (73 | 6.0%), and Two or more Races (11 | 0.9%).
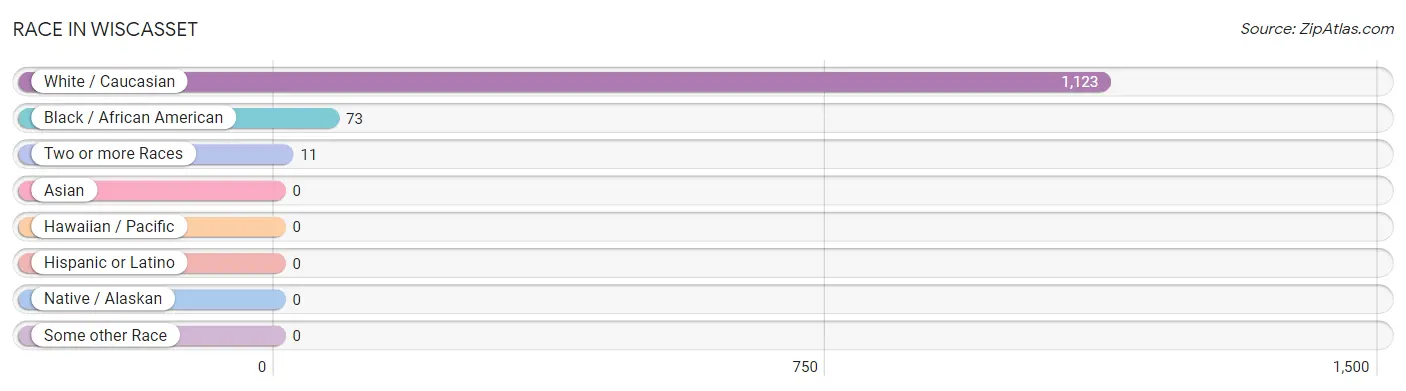
| Race | # Population | % Population |
| Asian | 0 | 0.0% |
| Black / African American | 73 | 6.0% |
| Hawaiian / Pacific | 0 | 0.0% |
| Hispanic or Latino | 0 | 0.0% |
| Native / Alaskan | 0 | 0.0% |
| White / Caucasian | 1,123 | 93.0% |
| Two or more Races | 11 | 0.9% |
| Some other Race | 0 | 0.0% |
| Total | 1,207 | 100.0% |
Ancestry in Wiscasset
The most populous ancestries reported in Wiscasset are English (371 | 30.7%), Dutch (322 | 26.7%), Irish (306 | 25.4%), French Canadian (96 | 8.0%), and French (66 | 5.5%), together accounting for 96.2% of all Wiscasset residents.
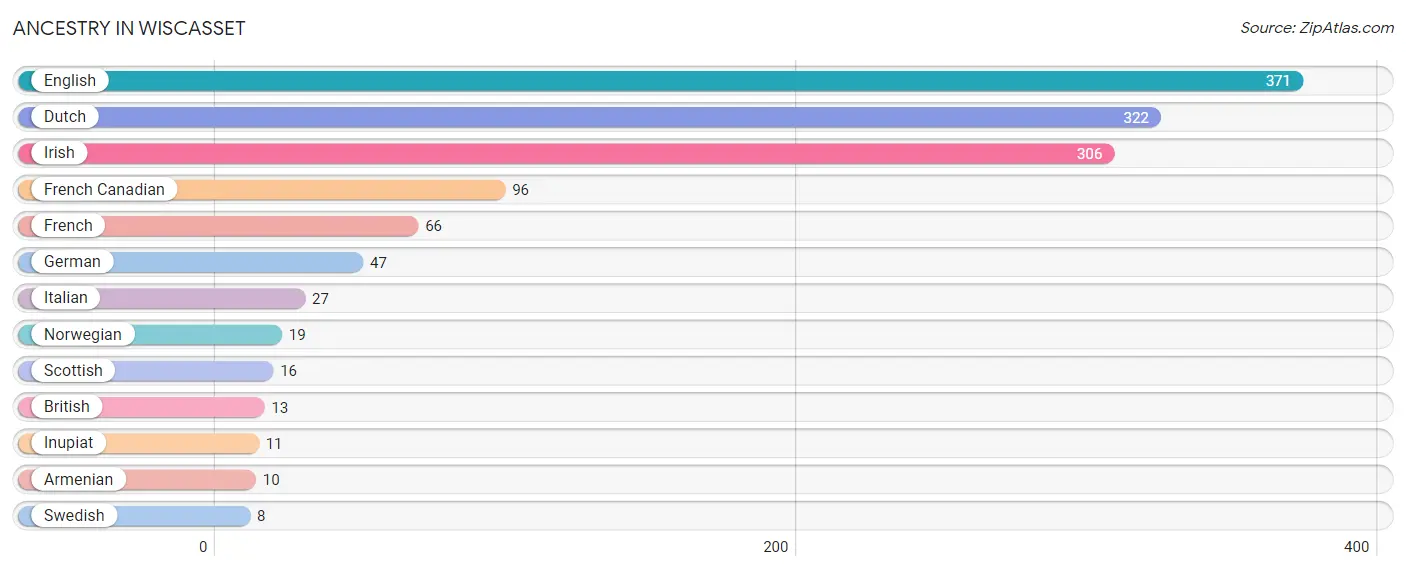
| Ancestry | # Population | % Population |
| Armenian | 10 | 0.8% |
| British | 13 | 1.1% |
| Dutch | 322 | 26.7% |
| English | 371 | 30.7% |
| French | 66 | 5.5% |
| French Canadian | 96 | 8.0% |
| German | 47 | 3.9% |
| Inupiat | 11 | 0.9% |
| Irish | 306 | 25.4% |
| Italian | 27 | 2.2% |
| Norwegian | 19 | 1.6% |
| Scottish | 16 | 1.3% |
| Swedish | 8 | 0.7% | View All 13 Rows |
Immigrants in Wiscasset

| Immigration Origin | # Population | % Population | View All 0 Rows |
Sex and Age in Wiscasset
Sex and Age in Wiscasset
The most populous age groups in Wiscasset are 40 to 44 Years (171 | 25.6%) for men and 20 to 24 Years (146 | 27.0%) for women.
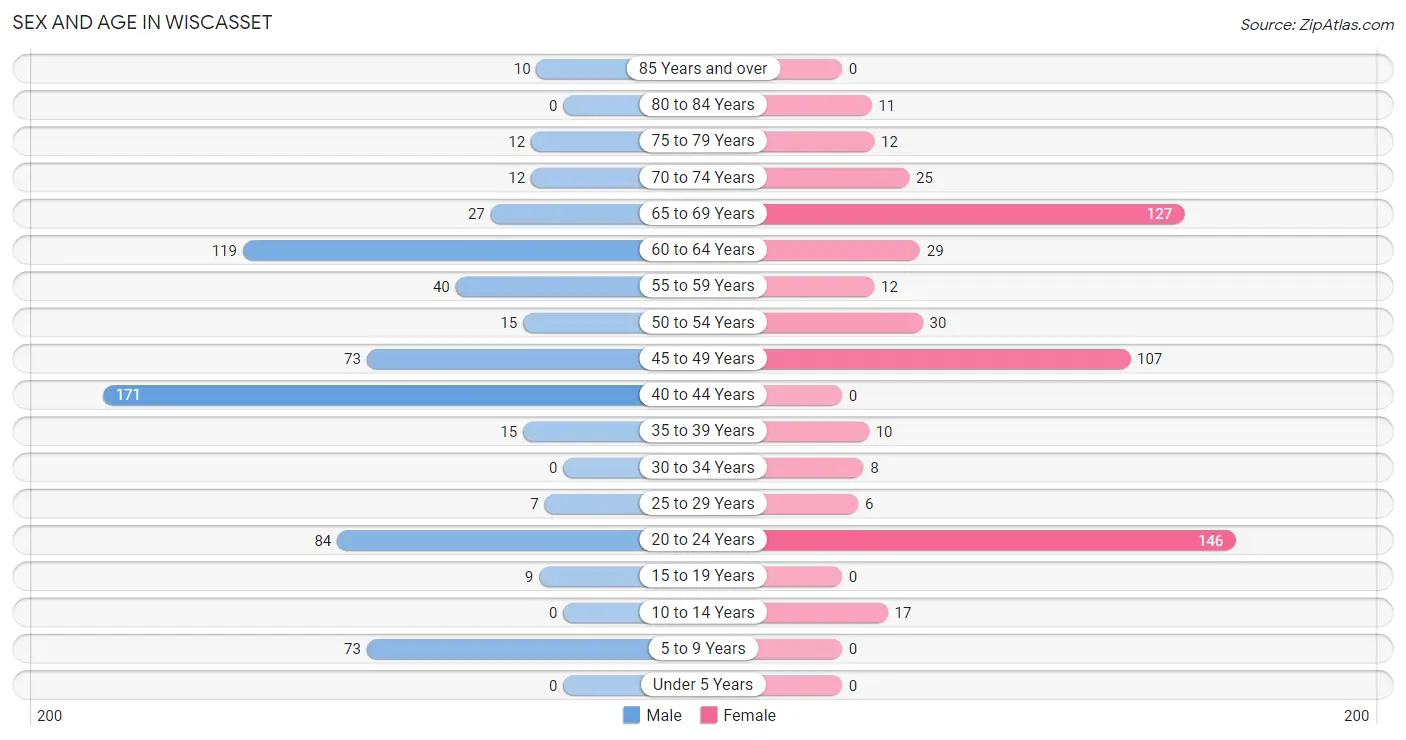
| Age Bracket | Male | Female |
| Under 5 Years | 0 (0.0%) | 0 (0.0%) |
| 5 to 9 Years | 73 (10.9%) | 0 (0.0%) |
| 10 to 14 Years | 0 (0.0%) | 17 (3.2%) |
| 15 to 19 Years | 9 (1.3%) | 0 (0.0%) |
| 20 to 24 Years | 84 (12.6%) | 146 (27.0%) |
| 25 to 29 Years | 7 (1.1%) | 6 (1.1%) |
| 30 to 34 Years | 0 (0.0%) | 8 (1.5%) |
| 35 to 39 Years | 15 (2.2%) | 10 (1.8%) |
| 40 to 44 Years | 171 (25.6%) | 0 (0.0%) |
| 45 to 49 Years | 73 (10.9%) | 107 (19.8%) |
| 50 to 54 Years | 15 (2.2%) | 30 (5.6%) |
| 55 to 59 Years | 40 (6.0%) | 12 (2.2%) |
| 60 to 64 Years | 119 (17.8%) | 29 (5.4%) |
| 65 to 69 Years | 27 (4.1%) | 127 (23.5%) |
| 70 to 74 Years | 12 (1.8%) | 25 (4.6%) |
| 75 to 79 Years | 12 (1.8%) | 12 (2.2%) |
| 80 to 84 Years | 0 (0.0%) | 11 (2.0%) |
| 85 Years and over | 10 (1.5%) | 0 (0.0%) |
| Total | 667 (100.0%) | 540 (100.0%) |
Families and Households in Wiscasset
Median Family Size in Wiscasset
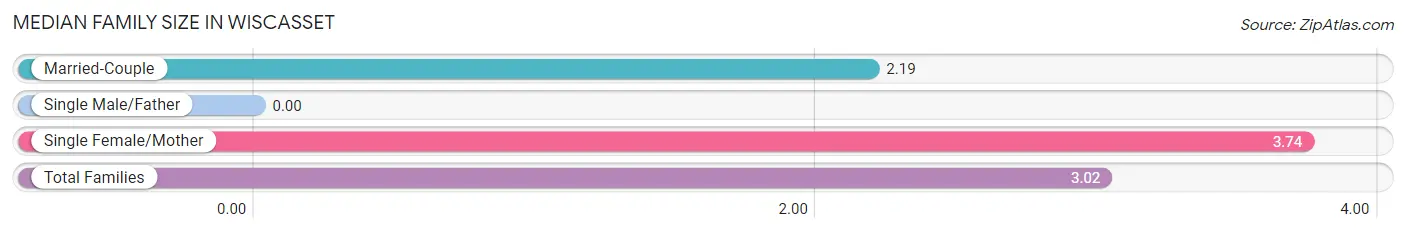
| Family Type | # Families | Family Size |
| Married-Couple | 90 (46.4%) | 2.19 |
| Single Male/Father | 0 (0.0%) | - |
| Single Female/Mother | 104 (53.6%) | 3.74 |
| Total Families | 194 (100.0%) | 3.02 |
Median Household Size in Wiscasset
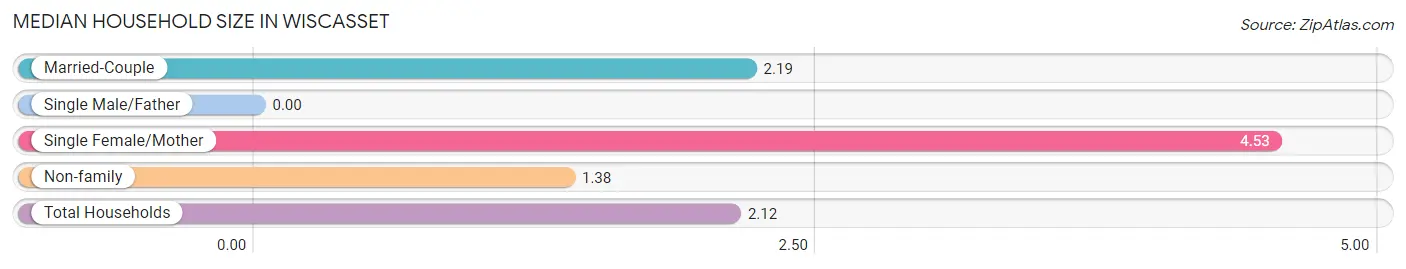
| Household Type | # Households | Household Size |
| Married-Couple | 90 (16.7%) | 2.19 |
| Single Male/Father | 0 (0.0%) | - |
| Single Female/Mother | 104 (19.3%) | 4.53 |
| Non-family | 345 (64.0%) | 1.38 |
| Total Households | 539 (100.0%) | 2.12 |
Household Size by Marriage Status in Wiscasset
Out of a total of 539 households in Wiscasset, 194 (36.0%) are family households, while 345 (64.0%) are nonfamily households. The most numerous type of family households are 2-person households, comprising 89, and the most common type of nonfamily households are 1-person households, comprising 275.
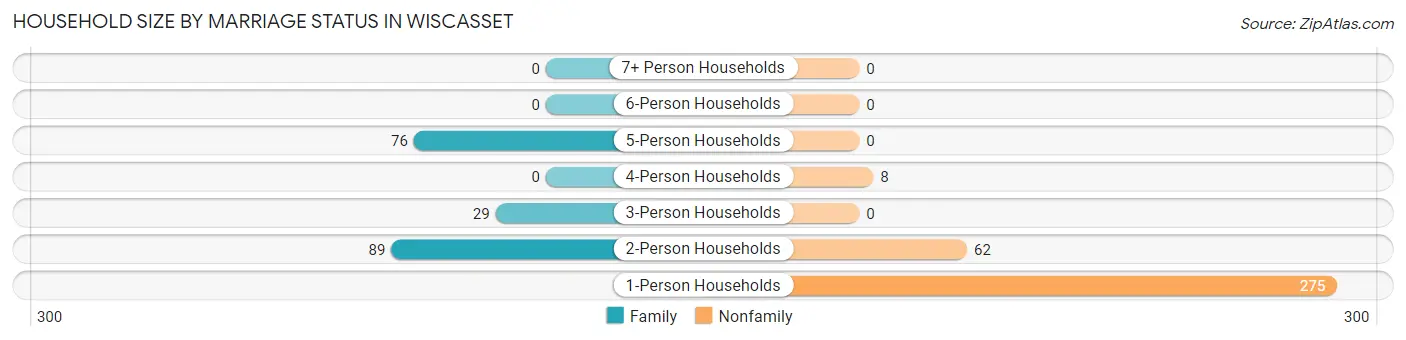
| Household Size | Family Households | Nonfamily Households |
| 1-Person Households | - | 275 (51.0%) |
| 2-Person Households | 89 (16.5%) | 62 (11.5%) |
| 3-Person Households | 29 (5.4%) | 0 (0.0%) |
| 4-Person Households | 0 (0.0%) | 8 (1.5%) |
| 5-Person Households | 76 (14.1%) | 0 (0.0%) |
| 6-Person Households | 0 (0.0%) | 0 (0.0%) |
| 7+ Person Households | 0 (0.0%) | 0 (0.0%) |
| Total | 194 (36.0%) | 345 (64.0%) |
Female Fertility in Wiscasset
Fertility by Age in Wiscasset
| Age Bracket | Women with Births | Births / 1,000 Women |
| 15 to 19 years | 0 (0.0%) | 0.0 |
| 20 to 34 years | 0 (0.0%) | 0.0 |
| 35 to 50 years | 0 (0.0%) | 0.0 |
| Total | 0 (0.0%) | 0.0 |
Fertility by Age by Marriage Status in Wiscasset
| Age Bracket | Married | Unmarried |
| 15 to 19 years | 0 (0.0%) | 0 (0.0%) |
| 20 to 34 years | 0 (0.0%) | 0 (0.0%) |
| 35 to 50 years | 0 (0.0%) | 0 (0.0%) |
| Total | 0 (0.0%) | 0 (0.0%) |
Fertility by Education in Wiscasset
| Educational Attainment | Women with Births | Births / 1,000 Women |
| Less than High School | 0 (0.0%) | 0.0 |
| High School Diploma | 0 (0.0%) | 0.0 |
| College or Associate's Degree | 0 (0.0%) | 0.0 |
| Bachelor's Degree | 0 (0.0%) | 0.0 |
| Graduate Degree | 0 (0.0%) | 0.0 |
| Total | 0 (0.0%) | 0.0 |
Fertility by Education by Marriage Status in Wiscasset
| Educational Attainment | Married | Unmarried |
| Less than High School | 0 (0.0%) | 0 (0.0%) |
| High School Diploma | 0 (0.0%) | 0 (0.0%) |
| College or Associate's Degree | 0 (0.0%) | 0 (0.0%) |
| Bachelor's Degree | 0 (0.0%) | 0 (0.0%) |
| Graduate Degree | 0 (0.0%) | 0 (0.0%) |
| Total | 0 (0.0%) | 0 (0.0%) |
Employment Characteristics in Wiscasset
Employment by Class of Employer in Wiscasset
Among the 694 employed individuals in Wiscasset, private company employees (453 | 65.3%), self-employed (not incorporated) (148 | 21.3%), and state government employees (58 | 8.4%) make up the most common classes of employment.
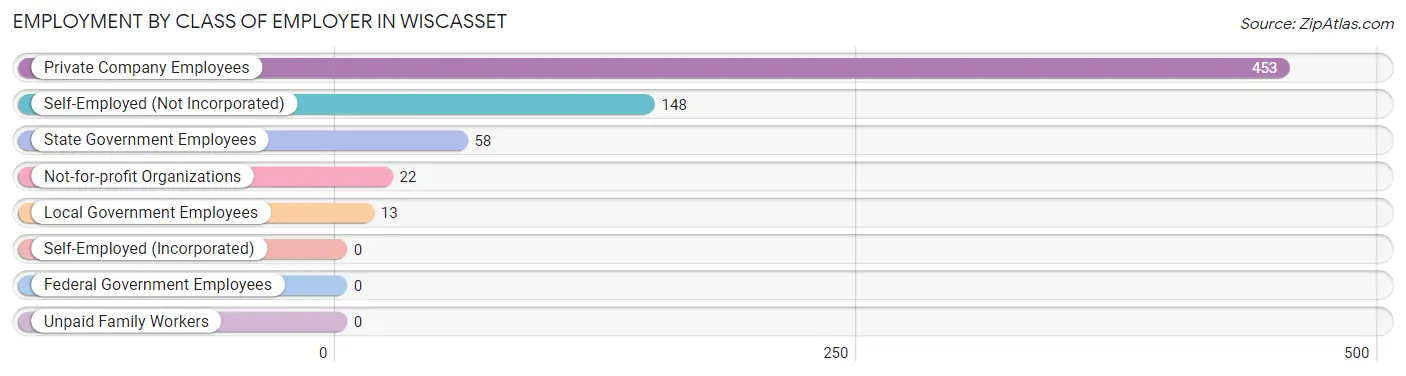
| Employer Class | # Employees | % Employees |
| Private Company Employees | 453 | 65.3% |
| Self-Employed (Incorporated) | 0 | 0.0% |
| Self-Employed (Not Incorporated) | 148 | 21.3% |
| Not-for-profit Organizations | 22 | 3.2% |
| Local Government Employees | 13 | 1.9% |
| State Government Employees | 58 | 8.4% |
| Federal Government Employees | 0 | 0.0% |
| Unpaid Family Workers | 0 | 0.0% |
| Total | 694 | 100.0% |
Employment Status by Age in Wiscasset
According to the labor force statistics for Wiscasset, out of the total population over 16 years of age (1,117), 65.5% or 732 individuals are in the labor force, with 3.3% or 24 of them unemployed. The age group with the highest labor force participation rate is 16 to 19 years, with 100.0% or 9 individuals in the labor force. Within the labor force, the 16 to 19 years age range has the highest percentage of unemployed individuals, with 100.0% or 9 of them being unemployed.
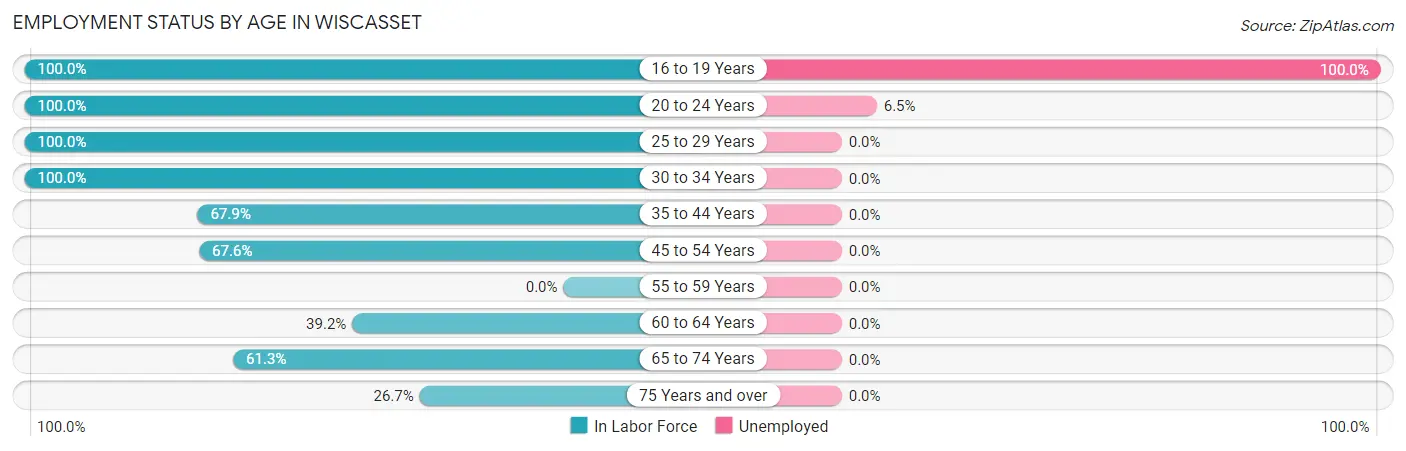
| Age Bracket | In Labor Force | Unemployed |
| 16 to 19 Years | 9 (100.0%) | 9 (100.0%) |
| 20 to 24 Years | 230 (100.0%) | 15 (6.5%) |
| 25 to 29 Years | 13 (100.0%) | 0 (0.0%) |
| 30 to 34 Years | 8 (100.0%) | 0 (0.0%) |
| 35 to 44 Years | 133 (67.9%) | 0 (0.0%) |
| 45 to 54 Years | 152 (67.6%) | 0 (0.0%) |
| 55 to 59 Years | 0 (0.0%) | 0 (0.0%) |
| 60 to 64 Years | 58 (39.2%) | 0 (0.0%) |
| 65 to 74 Years | 117 (61.3%) | 0 (0.0%) |
| 75 Years and over | 12 (26.7%) | 0 (0.0%) |
| Total | 732 (65.5%) | 24 (3.3%) |
Employment Status by Educational Attainment in Wiscasset
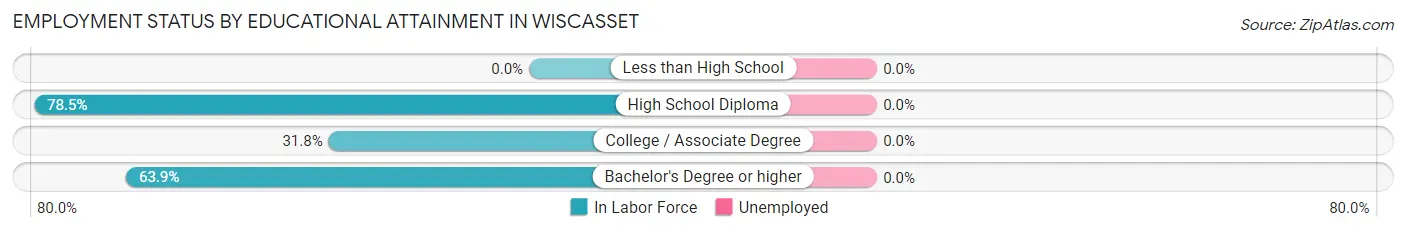
| Educational Attainment | In Labor Force | Unemployed |
| Less than High School | 0 (0.0%) | 0 (0.0%) |
| High School Diploma | 193 (78.5%) | 0 (0.0%) |
| College / Associate Degree | 42 (31.8%) | 0 (0.0%) |
| Bachelor's Degree or higher | 129 (63.9%) | 0 (0.0%) |
| Total | 364 (56.7%) | 0 (0.0%) |
Employment Occupations by Sex in Wiscasset
Management, Business, Science and Arts Occupations
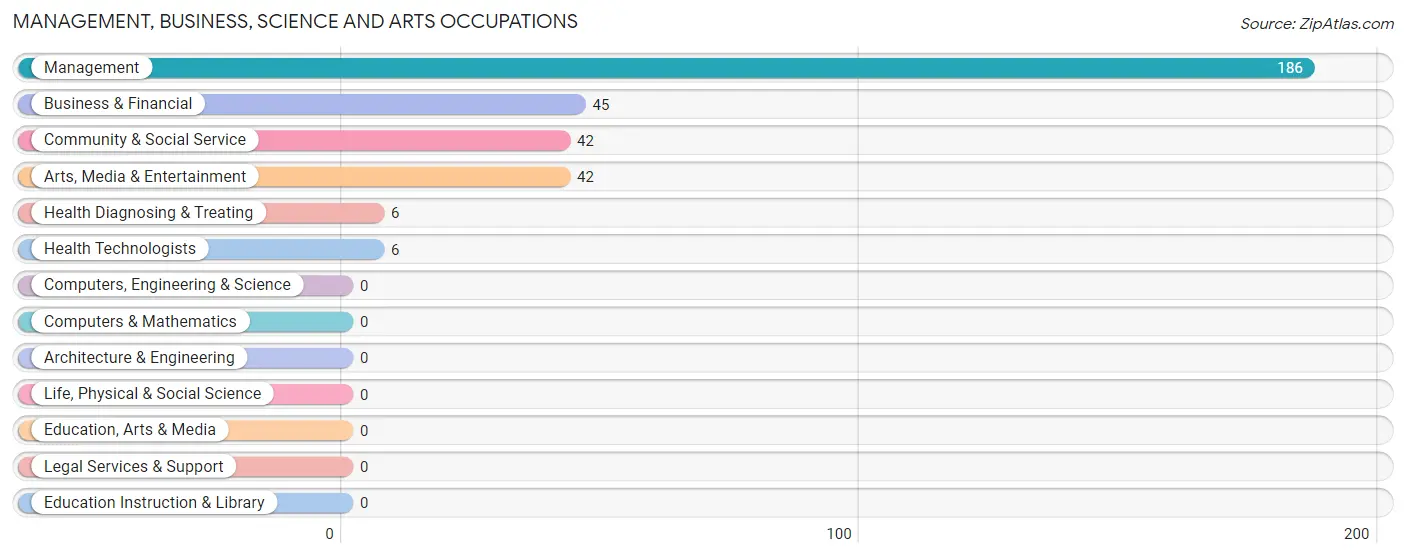
The most common Management, Business, Science and Arts occupations in Wiscasset are Management (186 | 26.3%), Business & Financial (45 | 6.4%), Community & Social Service (42 | 5.9%), Arts, Media & Entertainment (42 | 5.9%), and Health Diagnosing & Treating (6 | 0.9%).
Management, Business, Science and Arts Occupations by Sex
Within the Management, Business, Science and Arts occupations in Wiscasset, the most male-oriented occupations are Business & Financial (100.0%), Community & Social Service (38.1%), and Arts, Media & Entertainment (38.1%), while the most female-oriented occupations are Health Diagnosing & Treating (100.0%), Health Technologists (100.0%), and Management (81.2%).
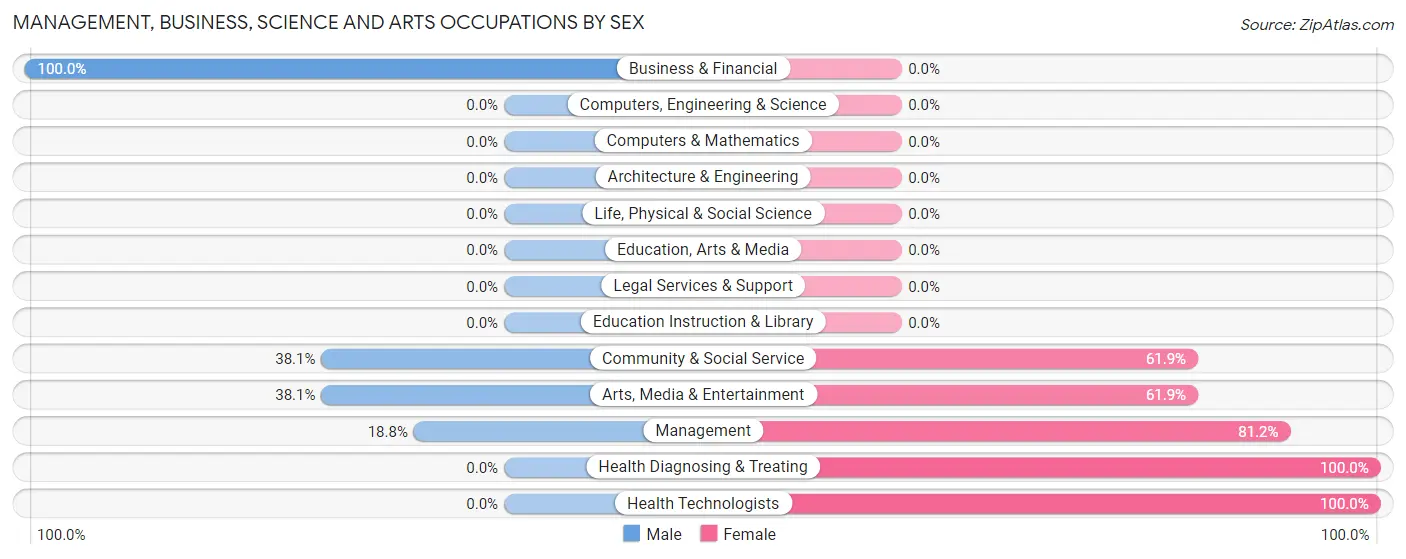
| Occupation | Male | Female |
| Management | 35 (18.8%) | 151 (81.2%) |
| Business & Financial | 45 (100.0%) | 0 (0.0%) |
| Computers, Engineering & Science | 0 (0.0%) | 0 (0.0%) |
| Computers & Mathematics | 0 (0.0%) | 0 (0.0%) |
| Architecture & Engineering | 0 (0.0%) | 0 (0.0%) |
| Life, Physical & Social Science | 0 (0.0%) | 0 (0.0%) |
| Community & Social Service | 16 (38.1%) | 26 (61.9%) |
| Education, Arts & Media | 0 (0.0%) | 0 (0.0%) |
| Legal Services & Support | 0 (0.0%) | 0 (0.0%) |
| Education Instruction & Library | 0 (0.0%) | 0 (0.0%) |
| Arts, Media & Entertainment | 16 (38.1%) | 26 (61.9%) |
| Health Diagnosing & Treating | 0 (0.0%) | 6 (100.0%) |
| Health Technologists | 0 (0.0%) | 6 (100.0%) |
| Total (Category) | 96 (34.4%) | 183 (65.6%) |
| Total (Overall) | 295 (41.7%) | 413 (58.3%) |
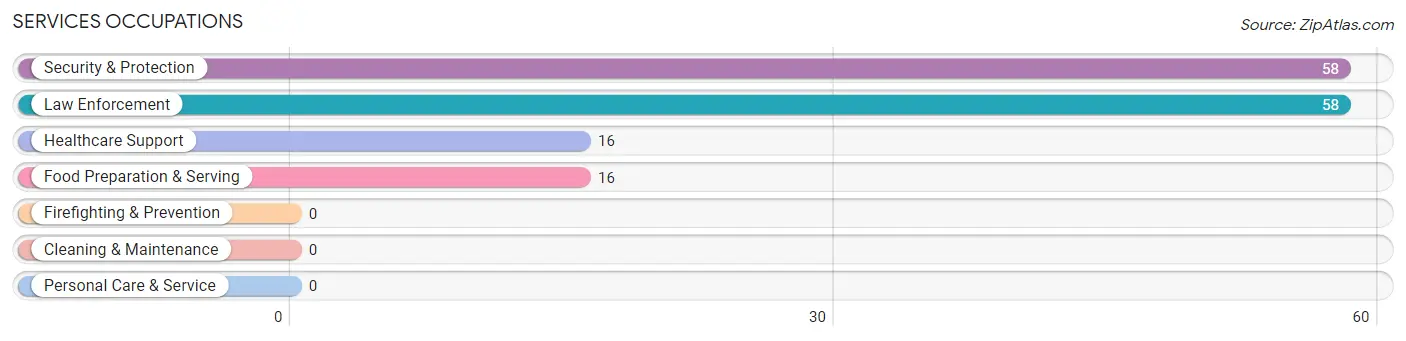
Services Occupations
The most common Services occupations in Wiscasset are Security & Protection (58 | 8.2%), Law Enforcement (58 | 8.2%), Healthcare Support (16 | 2.3%), and Food Preparation & Serving (16 | 2.3%).
Services Occupations by Sex
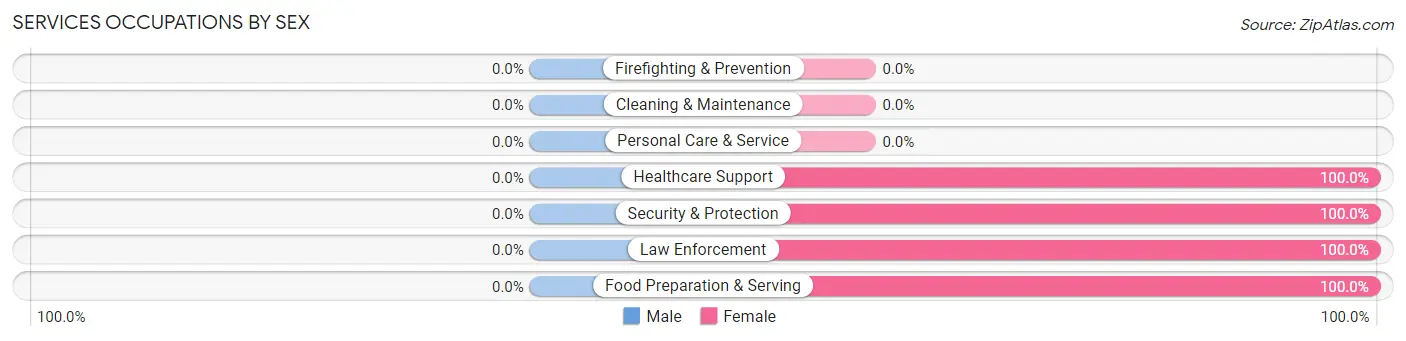
| Occupation | Male | Female |
| Healthcare Support | 0 (0.0%) | 16 (100.0%) |
| Security & Protection | 0 (0.0%) | 58 (100.0%) |
| Firefighting & Prevention | 0 (0.0%) | 0 (0.0%) |
| Law Enforcement | 0 (0.0%) | 58 (100.0%) |
| Food Preparation & Serving | 0 (0.0%) | 16 (100.0%) |
| Cleaning & Maintenance | 0 (0.0%) | 0 (0.0%) |
| Personal Care & Service | 0 (0.0%) | 0 (0.0%) |
| Total (Category) | 0 (0.0%) | 90 (100.0%) |
| Total (Overall) | 295 (41.7%) | 413 (58.3%) |
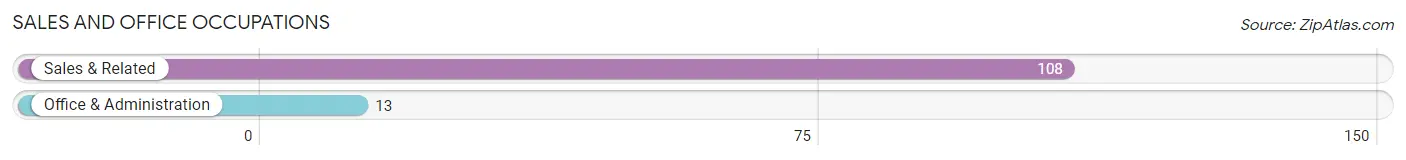
Sales and Office Occupations
The most common Sales and Office occupations in Wiscasset are Sales & Related (108 | 15.2%), and Office & Administration (13 | 1.8%).
Sales and Office Occupations by Sex
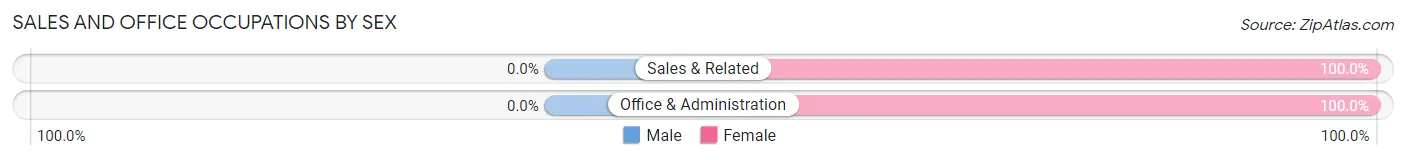
| Occupation | Male | Female |
| Sales & Related | 0 (0.0%) | 108 (100.0%) |
| Office & Administration | 0 (0.0%) | 13 (100.0%) |
| Total (Category) | 0 (0.0%) | 121 (100.0%) |
| Total (Overall) | 295 (41.7%) | 413 (58.3%) |
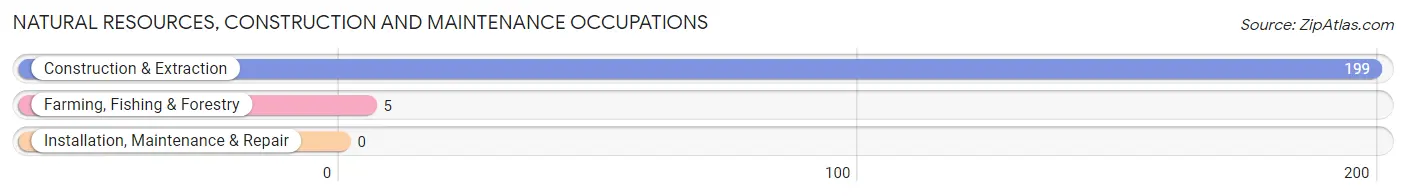
Natural Resources, Construction and Maintenance Occupations
The most common Natural Resources, Construction and Maintenance occupations in Wiscasset are Construction & Extraction (199 | 28.1%), and Farming, Fishing & Forestry (5 | 0.7%).
Natural Resources, Construction and Maintenance Occupations by Sex
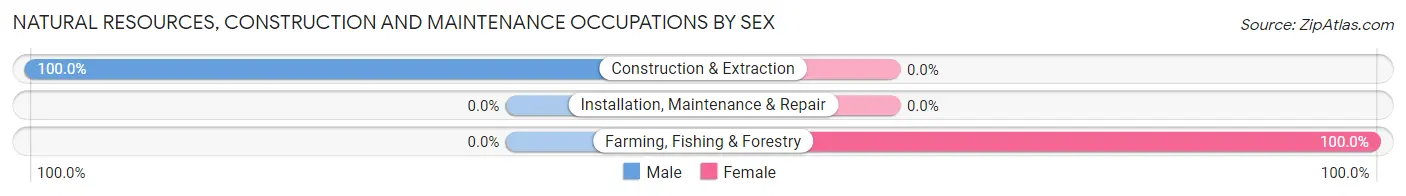
| Occupation | Male | Female |
| Farming, Fishing & Forestry | 0 (0.0%) | 5 (100.0%) |
| Construction & Extraction | 199 (100.0%) | 0 (0.0%) |
| Installation, Maintenance & Repair | 0 (0.0%) | 0 (0.0%) |
| Total (Category) | 199 (97.6%) | 5 (2.5%) |
| Total (Overall) | 295 (41.7%) | 413 (58.3%) |
Production, Transportation and Moving Occupations
The most common Production, Transportation and Moving occupations in Wiscasset are , and Production (14 | 2.0%).
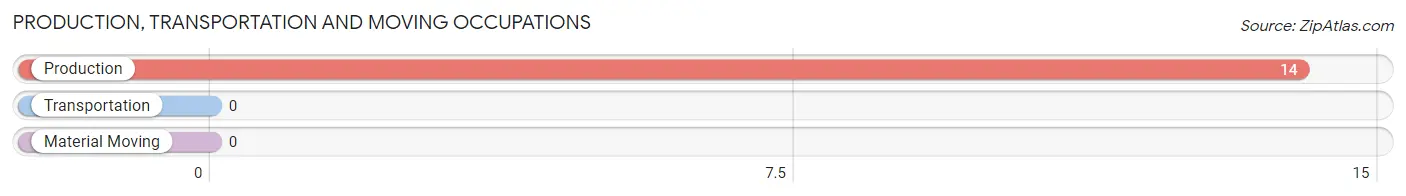
Production, Transportation and Moving Occupations by Sex
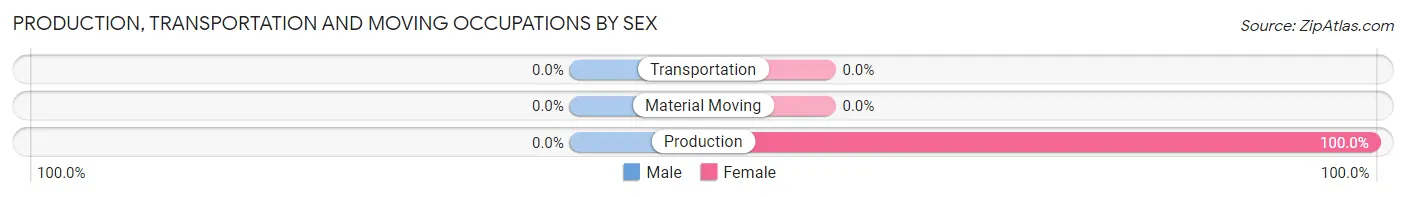
| Occupation | Male | Female |
| Production | 0 (0.0%) | 14 (100.0%) |
| Transportation | 0 (0.0%) | 0 (0.0%) |
| Material Moving | 0 (0.0%) | 0 (0.0%) |
| Total (Category) | 0 (0.0%) | 14 (100.0%) |
| Total (Overall) | 295 (41.7%) | 413 (58.3%) |
Employment Industries by Sex in Wiscasset
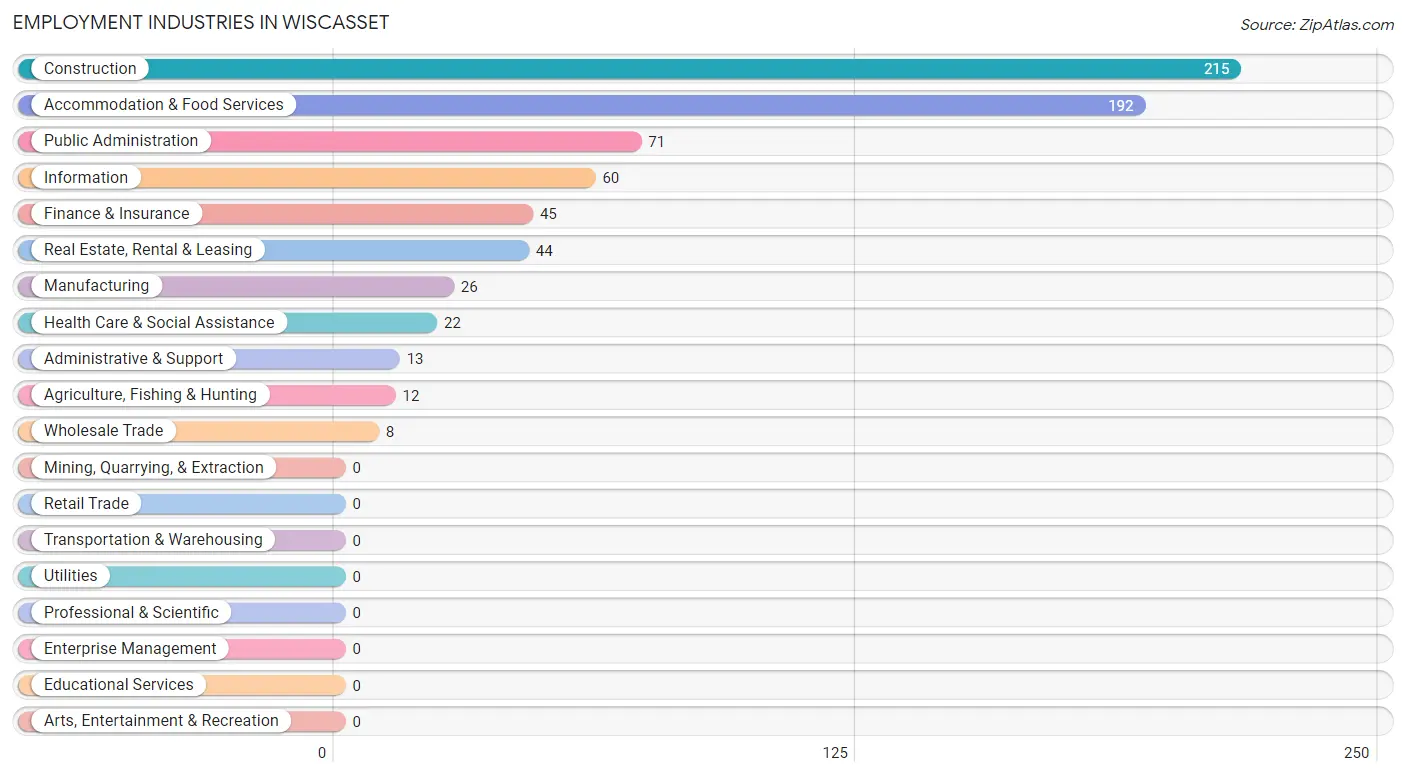
Employment Industries in Wiscasset
The major employment industries in Wiscasset include Construction (215 | 30.4%), Accommodation & Food Services (192 | 27.1%), Public Administration (71 | 10.0%), Information (60 | 8.5%), and Finance & Insurance (45 | 6.4%).
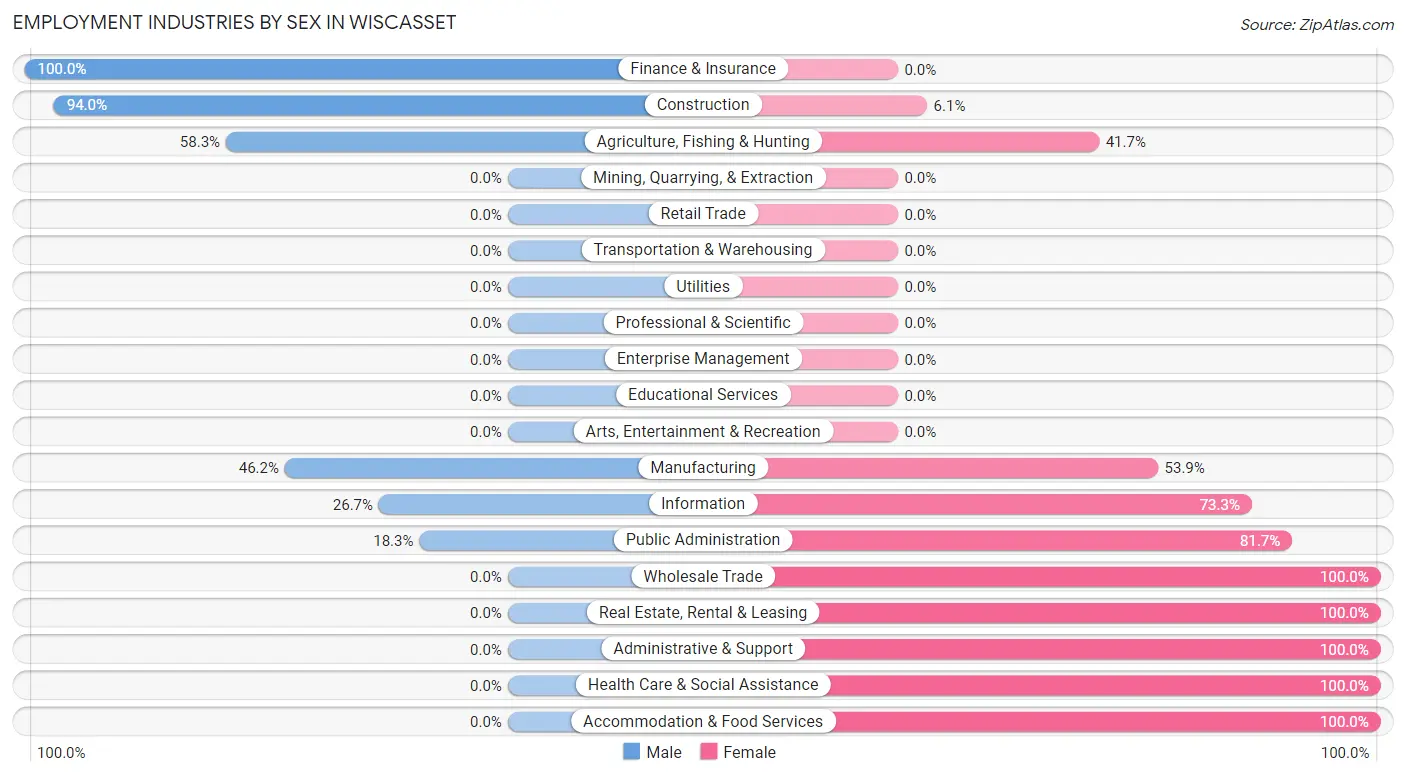
Employment Industries by Sex in Wiscasset
The Wiscasset industries that see more men than women are Finance & Insurance (100.0%), Construction (94.0%), and Agriculture, Fishing & Hunting (58.3%), whereas the industries that tend to have a higher number of women are Wholesale Trade (100.0%), Real Estate, Rental & Leasing (100.0%), and Administrative & Support (100.0%).
| Industry | Male | Female |
| Agriculture, Fishing & Hunting | 7 (58.3%) | 5 (41.7%) |
| Mining, Quarrying, & Extraction | 0 (0.0%) | 0 (0.0%) |
| Construction | 202 (94.0%) | 13 (6.0%) |
| Manufacturing | 12 (46.2%) | 14 (53.8%) |
| Wholesale Trade | 0 (0.0%) | 8 (100.0%) |
| Retail Trade | 0 (0.0%) | 0 (0.0%) |
| Transportation & Warehousing | 0 (0.0%) | 0 (0.0%) |
| Utilities | 0 (0.0%) | 0 (0.0%) |
| Information | 16 (26.7%) | 44 (73.3%) |
| Finance & Insurance | 45 (100.0%) | 0 (0.0%) |
| Real Estate, Rental & Leasing | 0 (0.0%) | 44 (100.0%) |
| Professional & Scientific | 0 (0.0%) | 0 (0.0%) |
| Enterprise Management | 0 (0.0%) | 0 (0.0%) |
| Administrative & Support | 0 (0.0%) | 13 (100.0%) |
| Educational Services | 0 (0.0%) | 0 (0.0%) |
| Health Care & Social Assistance | 0 (0.0%) | 22 (100.0%) |
| Arts, Entertainment & Recreation | 0 (0.0%) | 0 (0.0%) |
| Accommodation & Food Services | 0 (0.0%) | 192 (100.0%) |
| Public Administration | 13 (18.3%) | 58 (81.7%) |
| Total | 295 (41.7%) | 413 (58.3%) |
Education in Wiscasset
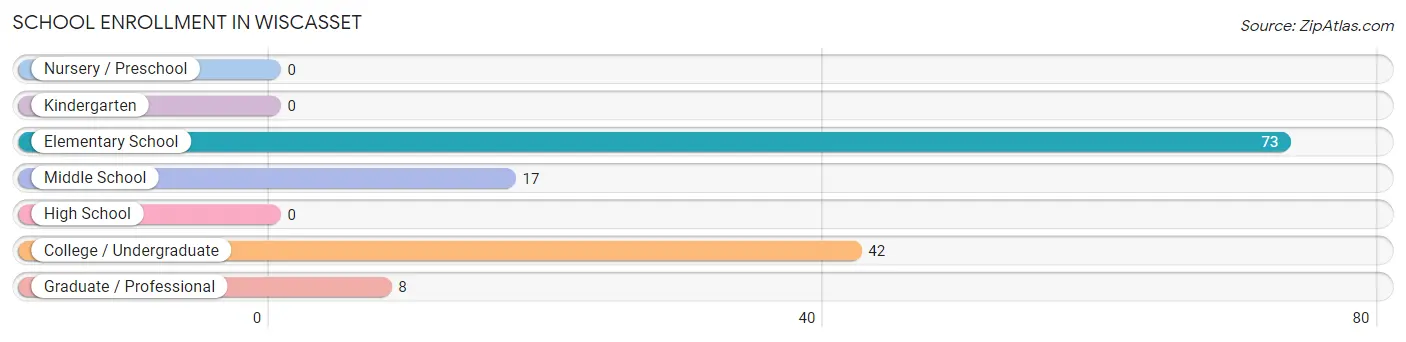
School Enrollment in Wiscasset
The most common levels of schooling among the 140 students in Wiscasset are elementary school (73 | 52.1%), college / undergraduate (42 | 30.0%), and middle school (17 | 12.1%).
| School Level | # Students | % Students |
| Nursery / Preschool | 0 | 0.0% |
| Kindergarten | 0 | 0.0% |
| Elementary School | 73 | 52.1% |
| Middle School | 17 | 12.1% |
| High School | 0 | 0.0% |
| College / Undergraduate | 42 | 30.0% |
| Graduate / Professional | 8 | 5.7% |
| Total | 140 | 100.0% |
School Enrollment by Age by Funding Source in Wiscasset
Out of a total of 140 students who are enrolled in schools in Wiscasset, 8 (5.7%) attend a private institution, while the remaining 132 (94.3%) are enrolled in public schools. The age group of 25 to 34 year olds has the highest likelihood of being enrolled in private schools, with 8 (100.0% in the age bracket) enrolled. Conversely, the age group of 5 to 9 year old has the lowest likelihood of being enrolled in a private school, with 73 (100.0% in the age bracket) attending a public institution.
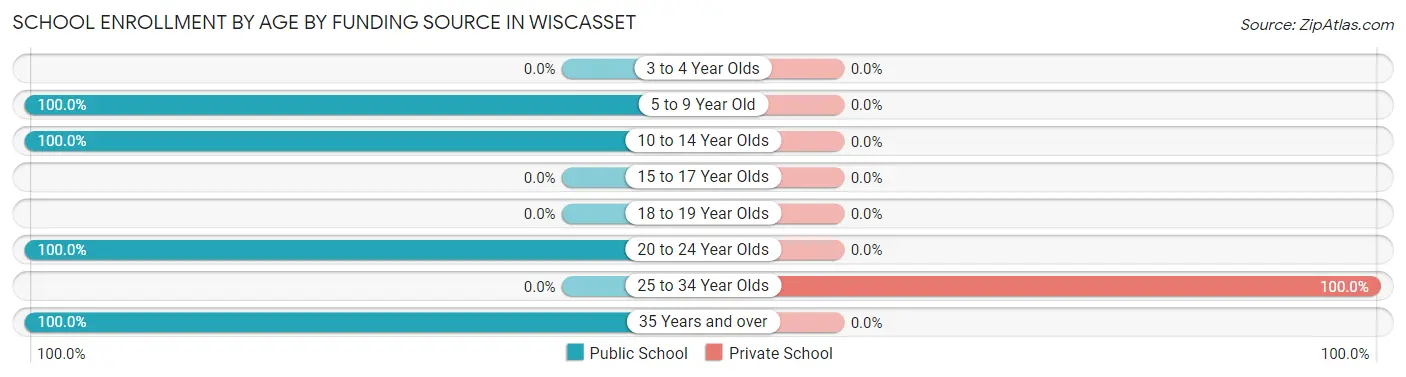
| Age Bracket | Public School | Private School |
| 3 to 4 Year Olds | 0 (0.0%) | 0 (0.0%) |
| 5 to 9 Year Old | 73 (100.0%) | 0 (0.0%) |
| 10 to 14 Year Olds | 17 (100.0%) | 0 (0.0%) |
| 15 to 17 Year Olds | 0 (0.0%) | 0 (0.0%) |
| 18 to 19 Year Olds | 0 (0.0%) | 0 (0.0%) |
| 20 to 24 Year Olds | 26 (100.0%) | 0 (0.0%) |
| 25 to 34 Year Olds | 0 (0.0%) | 8 (100.0%) |
| 35 Years and over | 16 (100.0%) | 0 (0.0%) |
| Total | 132 (94.3%) | 8 (5.7%) |
Educational Attainment by Field of Study in Wiscasset
Business (73 | 17.3%), psychology (69 | 16.4%), communications (61 | 14.4%), liberal arts & history (56 | 13.3%), and literature & languages (45 | 10.7%) are the most common fields of study among 422 individuals in Wiscasset who have obtained a bachelor's degree or higher.
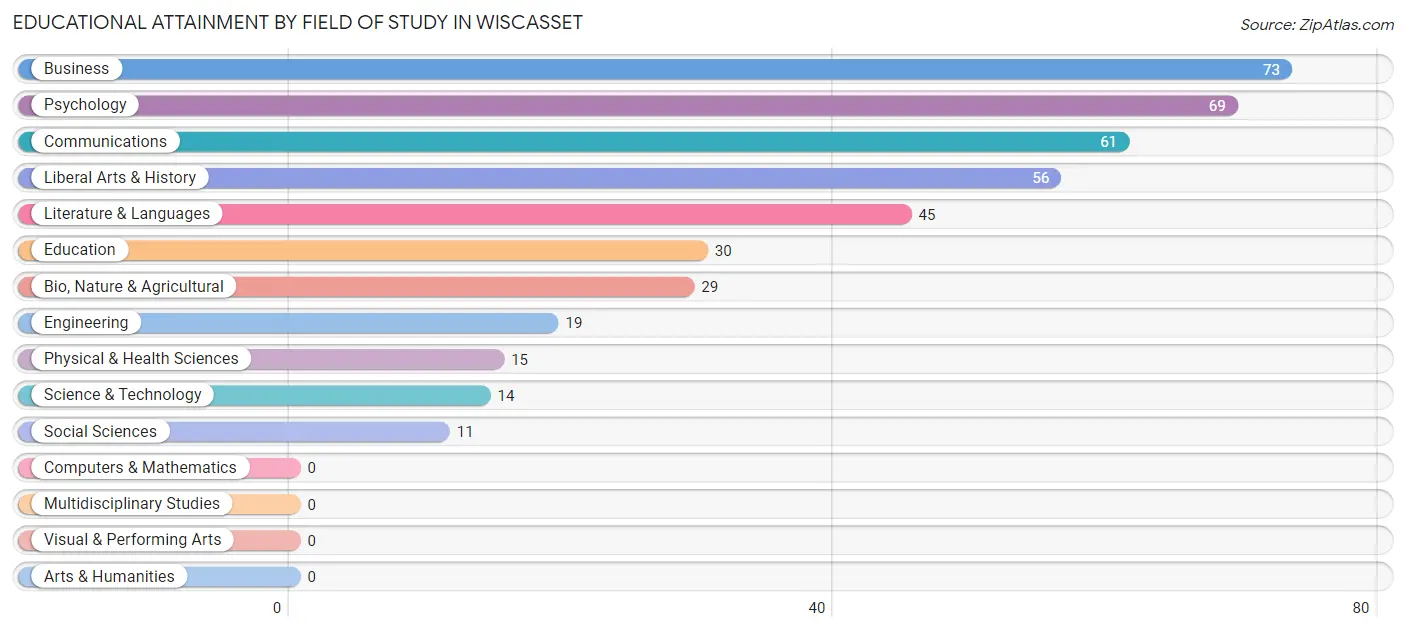
| Field of Study | # Graduates | % Graduates |
| Computers & Mathematics | 0 | 0.0% |
| Bio, Nature & Agricultural | 29 | 6.9% |
| Physical & Health Sciences | 15 | 3.5% |
| Psychology | 69 | 16.4% |
| Social Sciences | 11 | 2.6% |
| Engineering | 19 | 4.5% |
| Multidisciplinary Studies | 0 | 0.0% |
| Science & Technology | 14 | 3.3% |
| Business | 73 | 17.3% |
| Education | 30 | 7.1% |
| Literature & Languages | 45 | 10.7% |
| Liberal Arts & History | 56 | 13.3% |
| Visual & Performing Arts | 0 | 0.0% |
| Communications | 61 | 14.4% |
| Arts & Humanities | 0 | 0.0% |
| Total | 422 | 100.0% |
Transportation & Commute in Wiscasset
Vehicle Availability by Sex in Wiscasset
The most prevalent vehicle ownership categories in Wiscasset are males with 3 vehicles (164, accounting for 55.6%) and females with 3 vehicles (239, making up 41.1%).
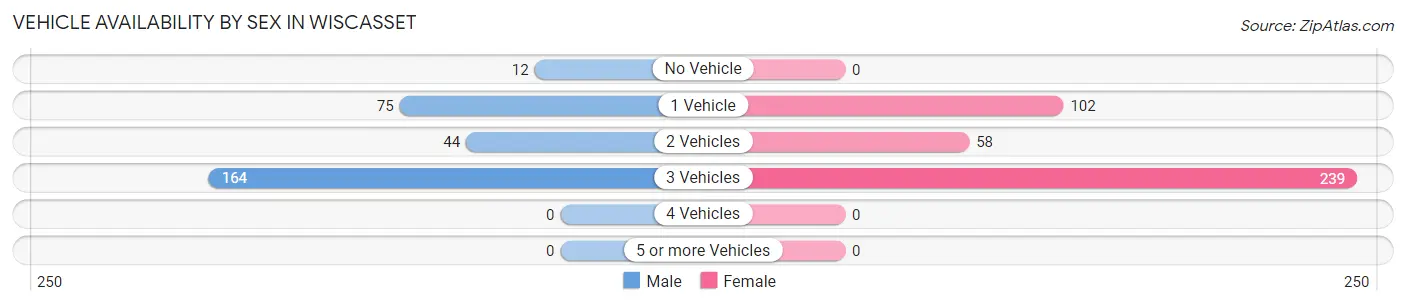
| Vehicles Available | Male | Female |
| No Vehicle | 12 (4.1%) | 0 (0.0%) |
| 1 Vehicle | 75 (25.4%) | 102 (25.6%) |
| 2 Vehicles | 44 (14.9%) | 58 (14.5%) |
| 3 Vehicles | 164 (55.6%) | 239 (59.9%) |
| 4 Vehicles | 0 (0.0%) | 0 (0.0%) |
| 5 or more Vehicles | 0 (0.0%) | 0 (0.0%) |
| Total | 295 (100.0%) | 399 (100.0%) |
Commute Time in Wiscasset
The most frequently occuring commute durations in Wiscasset are less than 5 minutes (176 commuters, 31.7%), 10 to 14 minutes (99 commuters, 17.8%), and 5 to 9 minutes (83 commuters, 14.9%).
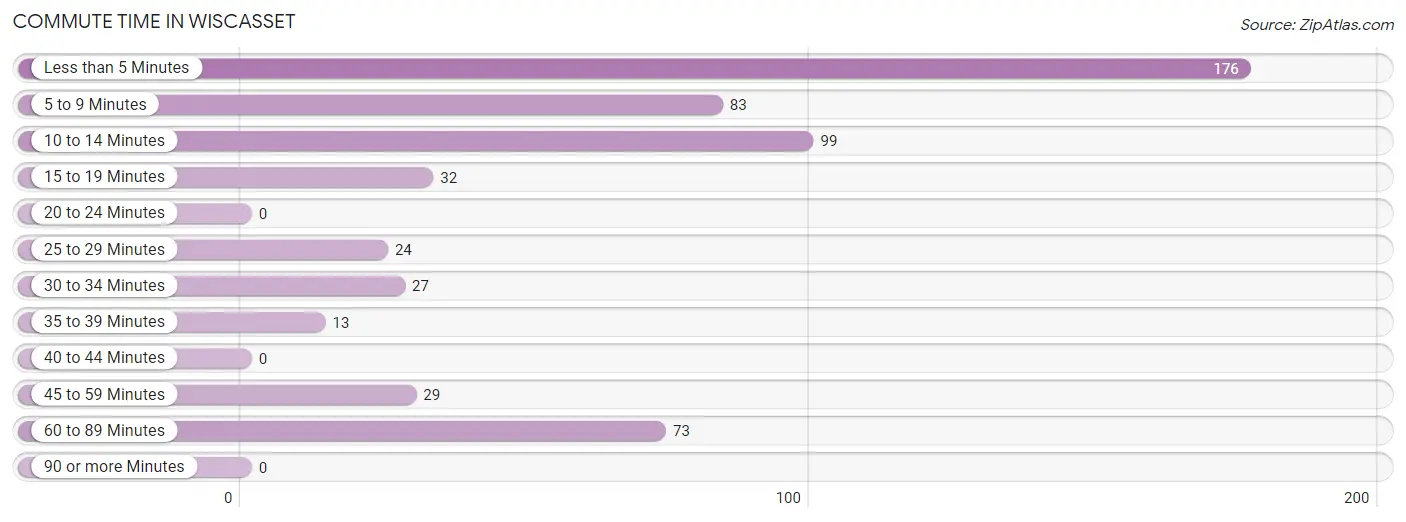
| Commute Time | # Commuters | % Commuters |
| Less than 5 Minutes | 176 | 31.7% |
| 5 to 9 Minutes | 83 | 14.9% |
| 10 to 14 Minutes | 99 | 17.8% |
| 15 to 19 Minutes | 32 | 5.8% |
| 20 to 24 Minutes | 0 | 0.0% |
| 25 to 29 Minutes | 24 | 4.3% |
| 30 to 34 Minutes | 27 | 4.9% |
| 35 to 39 Minutes | 13 | 2.3% |
| 40 to 44 Minutes | 0 | 0.0% |
| 45 to 59 Minutes | 29 | 5.2% |
| 60 to 89 Minutes | 73 | 13.1% |
| 90 or more Minutes | 0 | 0.0% |
Commute Time by Sex in Wiscasset
The most common commute times in Wiscasset are 10 to 14 minutes (99 commuters, 45.2%) for males and less than 5 minutes (176 commuters, 52.2%) for females.
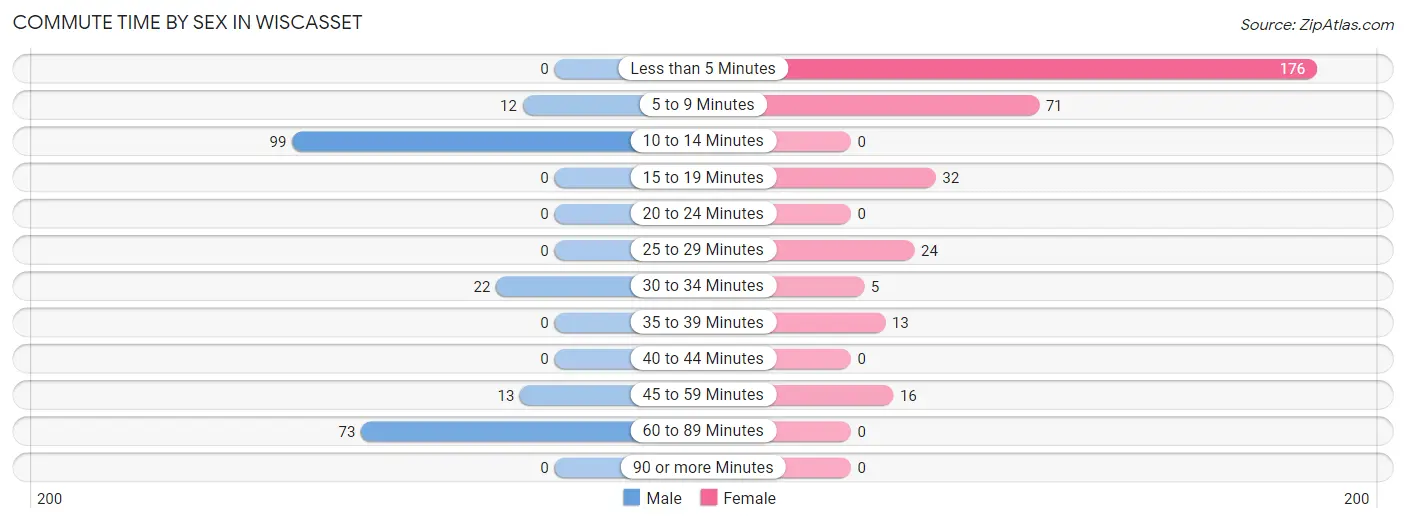
| Commute Time | Male | Female |
| Less than 5 Minutes | 0 (0.0%) | 176 (52.2%) |
| 5 to 9 Minutes | 12 (5.5%) | 71 (21.1%) |
| 10 to 14 Minutes | 99 (45.2%) | 0 (0.0%) |
| 15 to 19 Minutes | 0 (0.0%) | 32 (9.5%) |
| 20 to 24 Minutes | 0 (0.0%) | 0 (0.0%) |
| 25 to 29 Minutes | 0 (0.0%) | 24 (7.1%) |
| 30 to 34 Minutes | 22 (10.1%) | 5 (1.5%) |
| 35 to 39 Minutes | 0 (0.0%) | 13 (3.9%) |
| 40 to 44 Minutes | 0 (0.0%) | 0 (0.0%) |
| 45 to 59 Minutes | 13 (5.9%) | 16 (4.8%) |
| 60 to 89 Minutes | 73 (33.3%) | 0 (0.0%) |
| 90 or more Minutes | 0 (0.0%) | 0 (0.0%) |
Time of Departure to Work by Sex in Wiscasset
The most frequent times of departure to work in Wiscasset are 6:30 AM to 6:59 AM (97, 44.3%) for males and 10:00 AM to 10:59 AM (113, 33.5%) for females.
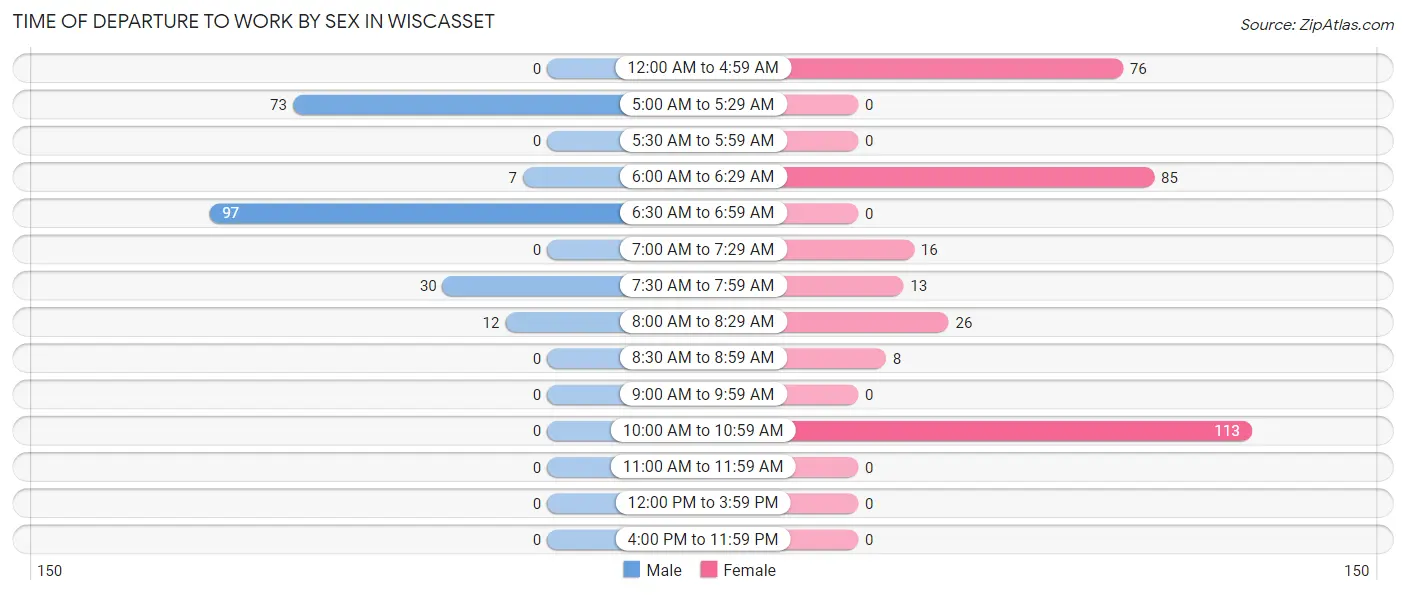
| Time of Departure | Male | Female |
| 12:00 AM to 4:59 AM | 0 (0.0%) | 76 (22.6%) |
| 5:00 AM to 5:29 AM | 73 (33.3%) | 0 (0.0%) |
| 5:30 AM to 5:59 AM | 0 (0.0%) | 0 (0.0%) |
| 6:00 AM to 6:29 AM | 7 (3.2%) | 85 (25.2%) |
| 6:30 AM to 6:59 AM | 97 (44.3%) | 0 (0.0%) |
| 7:00 AM to 7:29 AM | 0 (0.0%) | 16 (4.8%) |
| 7:30 AM to 7:59 AM | 30 (13.7%) | 13 (3.9%) |
| 8:00 AM to 8:29 AM | 12 (5.5%) | 26 (7.7%) |
| 8:30 AM to 8:59 AM | 0 (0.0%) | 8 (2.4%) |
| 9:00 AM to 9:59 AM | 0 (0.0%) | 0 (0.0%) |
| 10:00 AM to 10:59 AM | 0 (0.0%) | 113 (33.5%) |
| 11:00 AM to 11:59 AM | 0 (0.0%) | 0 (0.0%) |
| 12:00 PM to 3:59 PM | 0 (0.0%) | 0 (0.0%) |
| 4:00 PM to 11:59 PM | 0 (0.0%) | 0 (0.0%) |
| Total | 219 (100.0%) | 337 (100.0%) |
Housing Occupancy in Wiscasset
Occupancy by Ownership in Wiscasset
Of the total 539 dwellings in Wiscasset, owner-occupied units account for 381 (70.7%), while renter-occupied units make up 158 (29.3%).
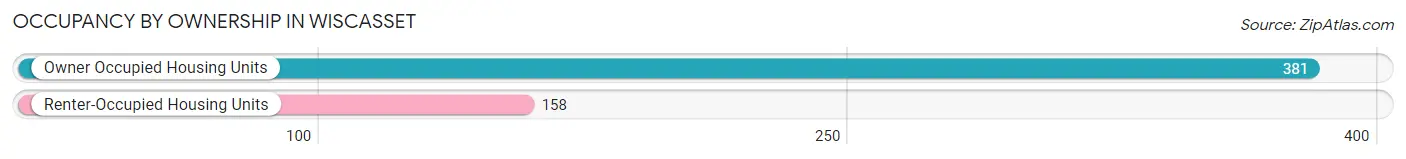
| Occupancy | # Housing Units | % Housing Units |
| Owner Occupied Housing Units | 381 | 70.7% |
| Renter-Occupied Housing Units | 158 | 29.3% |
| Total Occupied Housing Units | 539 | 100.0% |
Occupancy by Household Size in Wiscasset
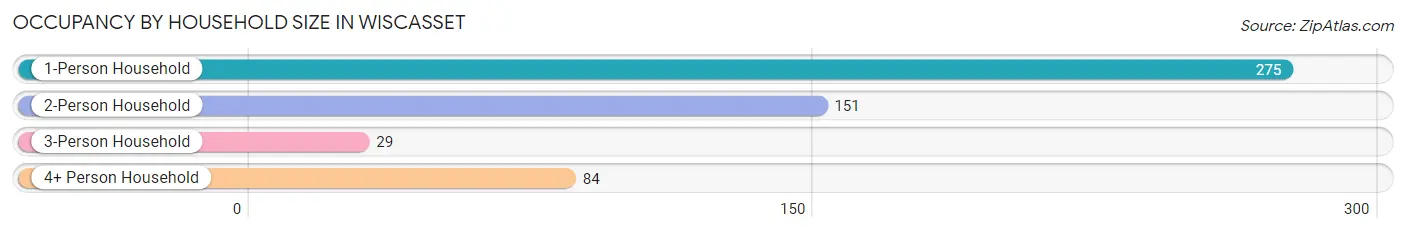
| Household Size | # Housing Units | % Housing Units |
| 1-Person Household | 275 | 51.0% |
| 2-Person Household | 151 | 28.0% |
| 3-Person Household | 29 | 5.4% |
| 4+ Person Household | 84 | 15.6% |
| Total Housing Units | 539 | 100.0% |
Occupancy by Ownership by Household Size in Wiscasset
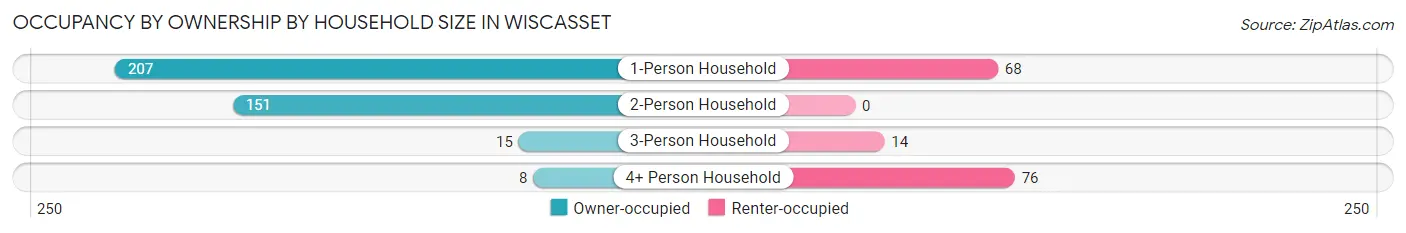
| Household Size | Owner-occupied | Renter-occupied |
| 1-Person Household | 207 (75.3%) | 68 (24.7%) |
| 2-Person Household | 151 (100.0%) | 0 (0.0%) |
| 3-Person Household | 15 (51.7%) | 14 (48.3%) |
| 4+ Person Household | 8 (9.5%) | 76 (90.5%) |
| Total Housing Units | 381 (70.7%) | 158 (29.3%) |
Occupancy by Educational Attainment in Wiscasset
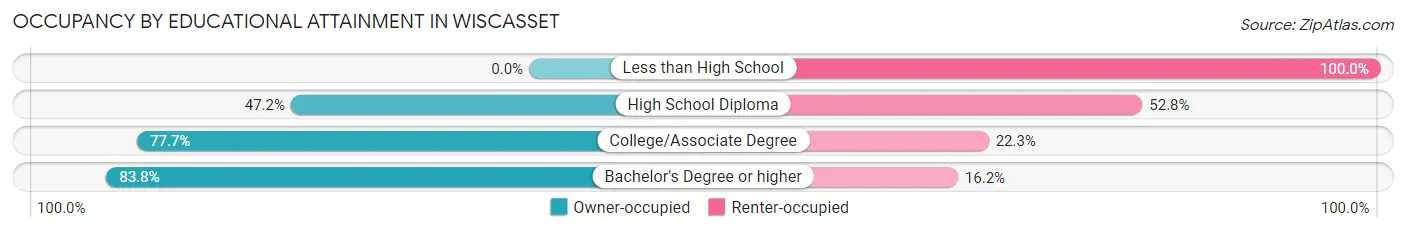
| Household Size | Owner-occupied | Renter-occupied |
| Less than High School | 0 (0.0%) | 12 (100.0%) |
| High School Diploma | 68 (47.2%) | 76 (52.8%) |
| College/Associate Degree | 101 (77.7%) | 29 (22.3%) |
| Bachelor's Degree or higher | 212 (83.8%) | 41 (16.2%) |
Occupancy by Age of Householder in Wiscasset
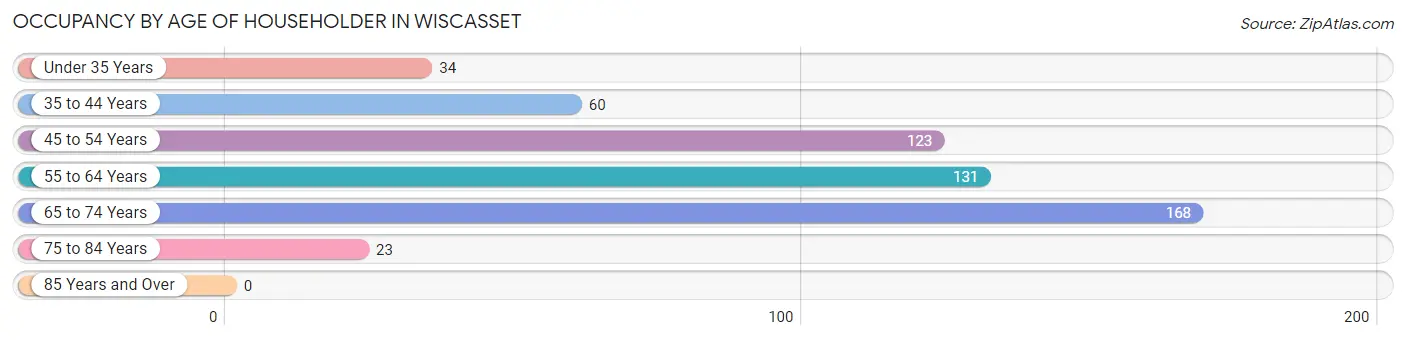
| Age Bracket | # Households | % Households |
| Under 35 Years | 34 | 6.3% |
| 35 to 44 Years | 60 | 11.1% |
| 45 to 54 Years | 123 | 22.8% |
| 55 to 64 Years | 131 | 24.3% |
| 65 to 74 Years | 168 | 31.2% |
| 75 to 84 Years | 23 | 4.3% |
| 85 Years and Over | 0 | 0.0% |
| Total | 539 | 100.0% |
Housing Finances in Wiscasset
Median Income by Occupancy in Wiscasset
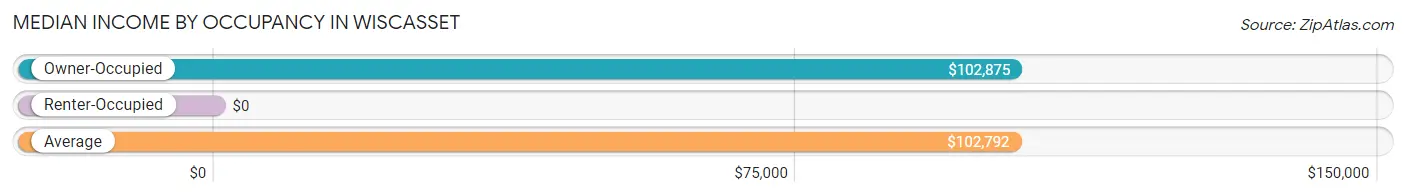
| Occupancy Type | # Households | Median Income |
| Owner-Occupied | 381 (70.7%) | $102,875 |
| Renter-Occupied | 158 (29.3%) | $0 |
| Average | 539 (100.0%) | $102,792 |
Occupancy by Householder Income Bracket in Wiscasset
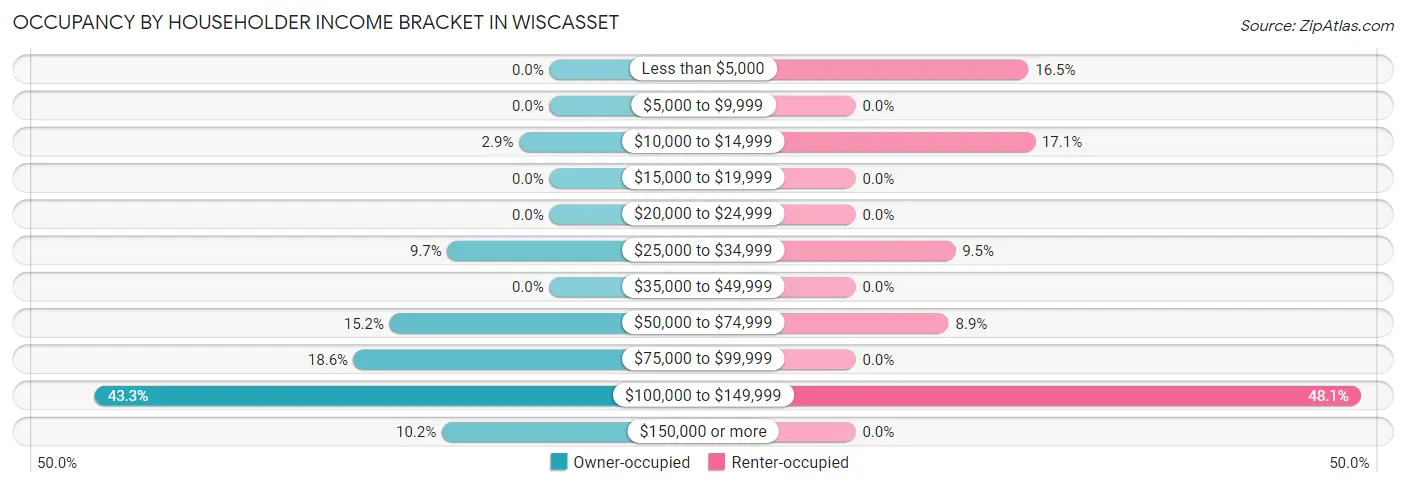
| Income Bracket | Owner-occupied | Renter-occupied |
| Less than $5,000 | 0 (0.0%) | 26 (16.5%) |
| $5,000 to $9,999 | 0 (0.0%) | 0 (0.0%) |
| $10,000 to $14,999 | 11 (2.9%) | 27 (17.1%) |
| $15,000 to $19,999 | 0 (0.0%) | 0 (0.0%) |
| $20,000 to $24,999 | 0 (0.0%) | 0 (0.0%) |
| $25,000 to $34,999 | 37 (9.7%) | 15 (9.5%) |
| $35,000 to $49,999 | 0 (0.0%) | 0 (0.0%) |
| $50,000 to $74,999 | 58 (15.2%) | 14 (8.9%) |
| $75,000 to $99,999 | 71 (18.6%) | 0 (0.0%) |
| $100,000 to $149,999 | 165 (43.3%) | 76 (48.1%) |
| $150,000 or more | 39 (10.2%) | 0 (0.0%) |
| Total | 381 (100.0%) | 158 (100.0%) |
Monthly Housing Cost Tiers in Wiscasset
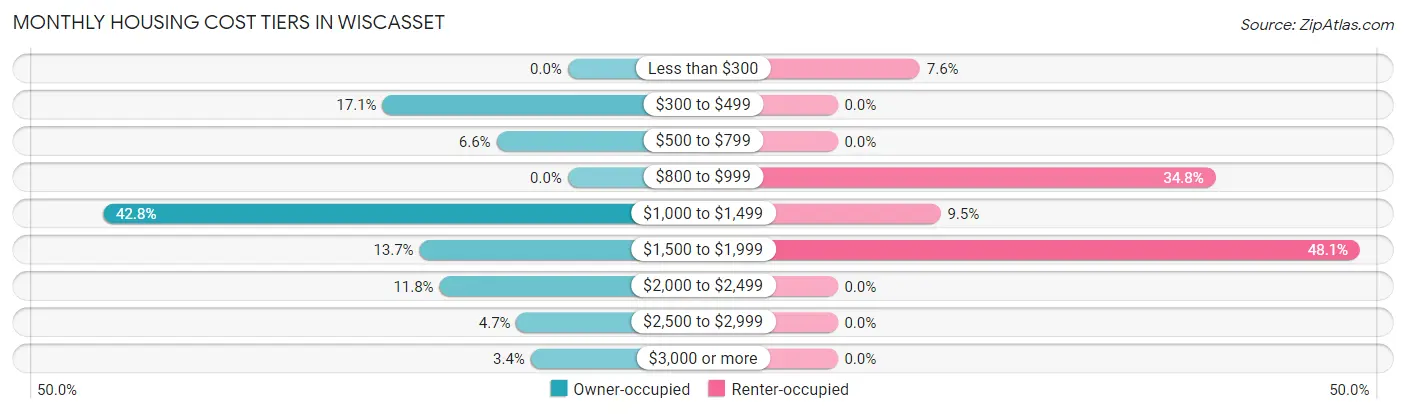
| Monthly Cost | Owner-occupied | Renter-occupied |
| Less than $300 | 0 (0.0%) | 12 (7.6%) |
| $300 to $499 | 65 (17.1%) | 0 (0.0%) |
| $500 to $799 | 25 (6.6%) | 0 (0.0%) |
| $800 to $999 | 0 (0.0%) | 55 (34.8%) |
| $1,000 to $1,499 | 163 (42.8%) | 15 (9.5%) |
| $1,500 to $1,999 | 52 (13.7%) | 76 (48.1%) |
| $2,000 to $2,499 | 45 (11.8%) | 0 (0.0%) |
| $2,500 to $2,999 | 18 (4.7%) | 0 (0.0%) |
| $3,000 or more | 13 (3.4%) | 0 (0.0%) |
| Total | 381 (100.0%) | 158 (100.0%) |
Physical Housing Characteristics in Wiscasset
Housing Structures in Wiscasset
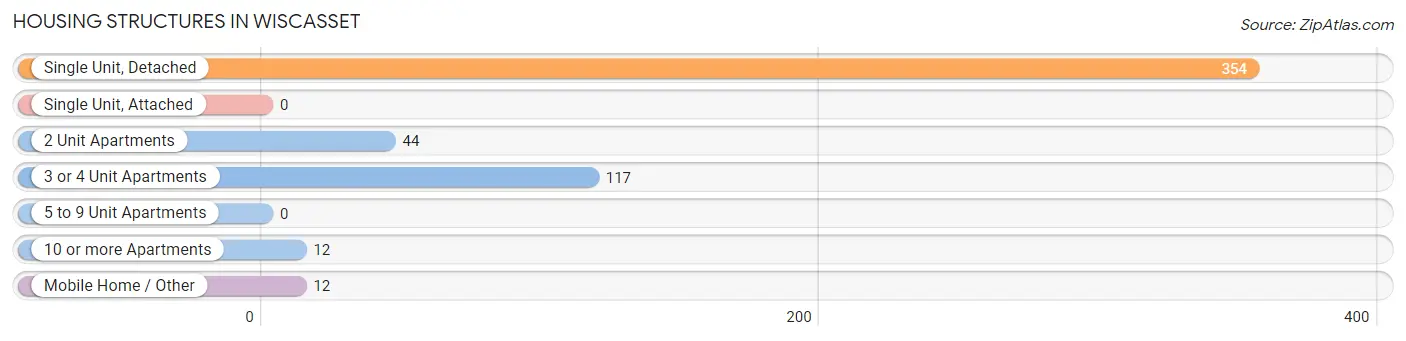
| Structure Type | # Housing Units | % Housing Units |
| Single Unit, Detached | 354 | 65.7% |
| Single Unit, Attached | 0 | 0.0% |
| 2 Unit Apartments | 44 | 8.2% |
| 3 or 4 Unit Apartments | 117 | 21.7% |
| 5 to 9 Unit Apartments | 0 | 0.0% |
| 10 or more Apartments | 12 | 2.2% |
| Mobile Home / Other | 12 | 2.2% |
| Total | 539 | 100.0% |
Housing Structures by Occupancy in Wiscasset
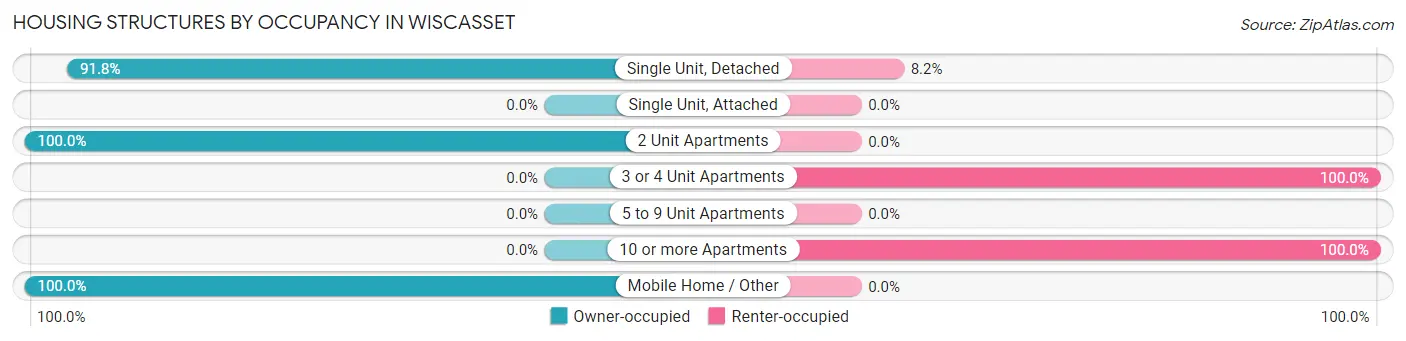
| Structure Type | Owner-occupied | Renter-occupied |
| Single Unit, Detached | 325 (91.8%) | 29 (8.2%) |
| Single Unit, Attached | 0 (0.0%) | 0 (0.0%) |
| 2 Unit Apartments | 44 (100.0%) | 0 (0.0%) |
| 3 or 4 Unit Apartments | 0 (0.0%) | 117 (100.0%) |
| 5 to 9 Unit Apartments | 0 (0.0%) | 0 (0.0%) |
| 10 or more Apartments | 0 (0.0%) | 12 (100.0%) |
| Mobile Home / Other | 12 (100.0%) | 0 (0.0%) |
| Total | 381 (70.7%) | 158 (29.3%) |
Housing Structures by Number of Rooms in Wiscasset
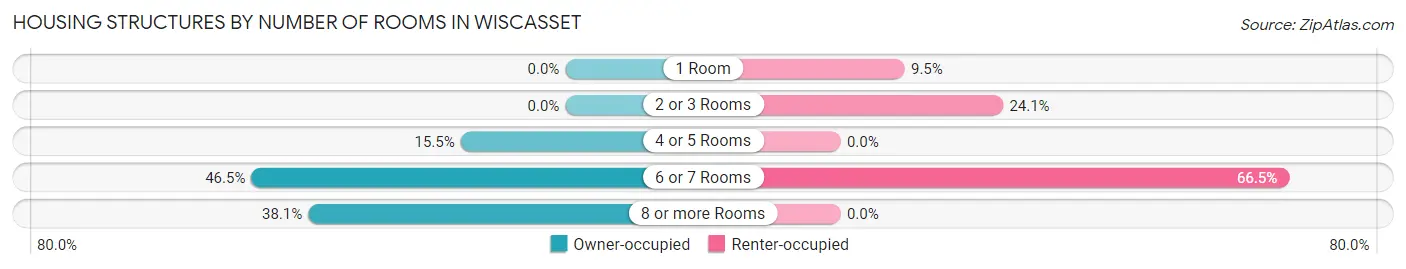
| Number of Rooms | Owner-occupied | Renter-occupied |
| 1 Room | 0 (0.0%) | 15 (9.5%) |
| 2 or 3 Rooms | 0 (0.0%) | 38 (24.0%) |
| 4 or 5 Rooms | 59 (15.5%) | 0 (0.0%) |
| 6 or 7 Rooms | 177 (46.5%) | 105 (66.5%) |
| 8 or more Rooms | 145 (38.1%) | 0 (0.0%) |
| Total | 381 (100.0%) | 158 (100.0%) |
Housing Structure by Heating Type in Wiscasset
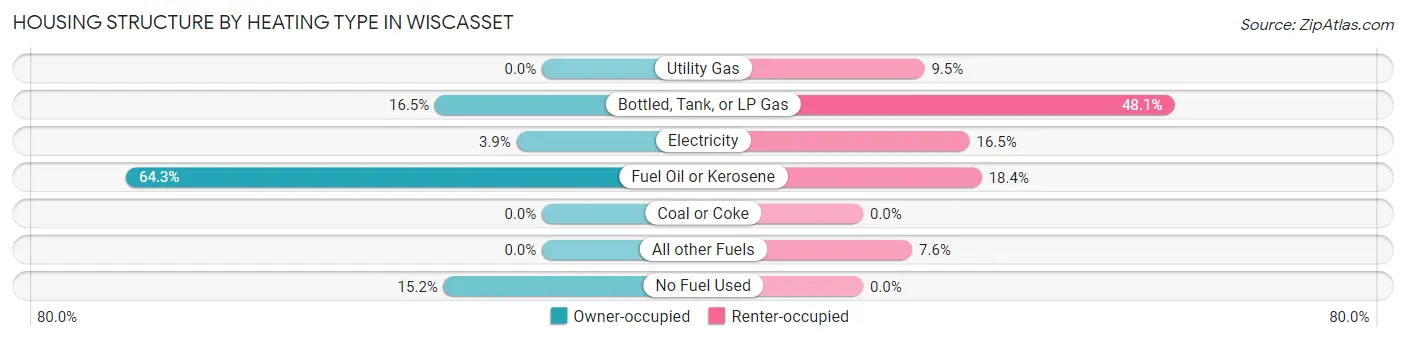
| Heating Type | Owner-occupied | Renter-occupied |
| Utility Gas | 0 (0.0%) | 15 (9.5%) |
| Bottled, Tank, or LP Gas | 63 (16.5%) | 76 (48.1%) |
| Electricity | 15 (3.9%) | 26 (16.5%) |
| Fuel Oil or Kerosene | 245 (64.3%) | 29 (18.3%) |
| Coal or Coke | 0 (0.0%) | 0 (0.0%) |
| All other Fuels | 0 (0.0%) | 12 (7.6%) |
| No Fuel Used | 58 (15.2%) | 0 (0.0%) |
| Total | 381 (100.0%) | 158 (100.0%) |
Household Vehicle Usage in Wiscasset
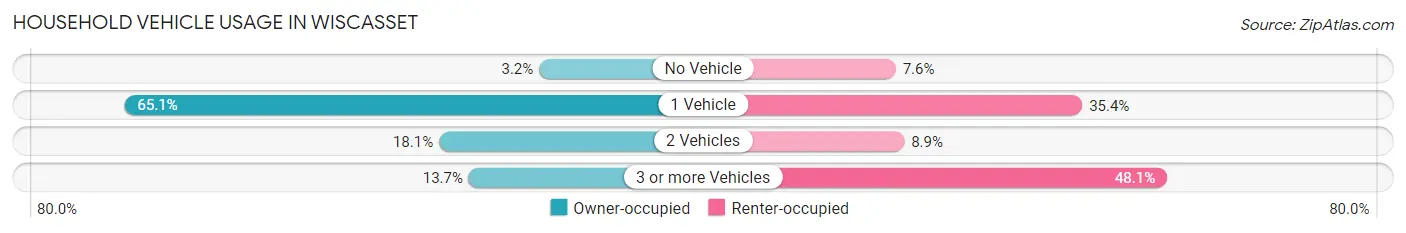
| Vehicles per Household | Owner-occupied | Renter-occupied |
| No Vehicle | 12 (3.2%) | 12 (7.6%) |
| 1 Vehicle | 248 (65.1%) | 56 (35.4%) |
| 2 Vehicles | 69 (18.1%) | 14 (8.9%) |
| 3 or more Vehicles | 52 (13.7%) | 76 (48.1%) |
| Total | 381 (100.0%) | 158 (100.0%) |
Real Estate & Mortgages in Wiscasset
Real Estate and Mortgage Overview in Wiscasset
| Characteristic | Without Mortgage | With Mortgage |
| Housing Units | 166 | 215 |
| Median Property Value | $307,800 | $261,000 |
| Median Household Income | $103,139 | $39 |
| Monthly Housing Costs | $1,008 | $13 |
| Real Estate Taxes | $5,194 | $0 |
Property Value by Mortgage Status in Wiscasset
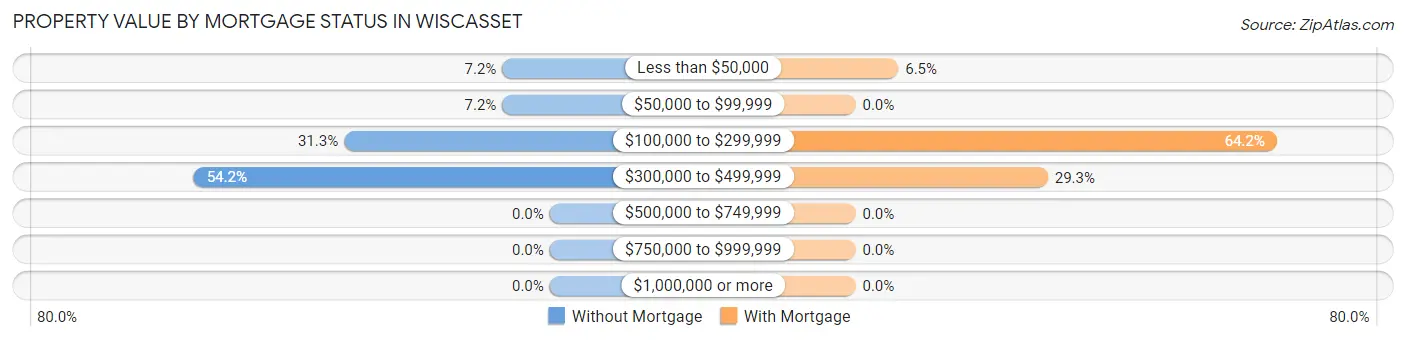
| Property Value | Without Mortgage | With Mortgage |
| Less than $50,000 | 12 (7.2%) | 14 (6.5%) |
| $50,000 to $99,999 | 12 (7.2%) | 0 (0.0%) |
| $100,000 to $299,999 | 52 (31.3%) | 138 (64.2%) |
| $300,000 to $499,999 | 90 (54.2%) | 63 (29.3%) |
| $500,000 to $749,999 | 0 (0.0%) | 0 (0.0%) |
| $750,000 to $999,999 | 0 (0.0%) | 0 (0.0%) |
| $1,000,000 or more | 0 (0.0%) | 0 (0.0%) |
| Total | 166 (100.0%) | 215 (100.0%) |
Household Income by Mortgage Status in Wiscasset
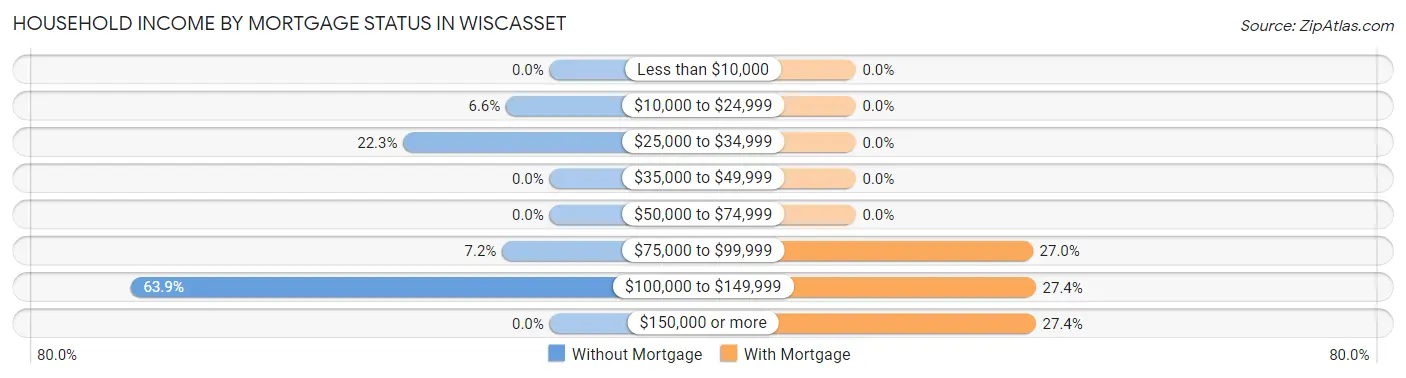
| Household Income | Without Mortgage | With Mortgage |
| Less than $10,000 | 0 (0.0%) | 0 (0.0%) |
| $10,000 to $24,999 | 11 (6.6%) | 0 (0.0%) |
| $25,000 to $34,999 | 37 (22.3%) | 0 (0.0%) |
| $35,000 to $49,999 | 0 (0.0%) | 0 (0.0%) |
| $50,000 to $74,999 | 0 (0.0%) | 0 (0.0%) |
| $75,000 to $99,999 | 12 (7.2%) | 58 (27.0%) |
| $100,000 to $149,999 | 106 (63.9%) | 59 (27.4%) |
| $150,000 or more | 0 (0.0%) | 59 (27.4%) |
| Total | 166 (100.0%) | 215 (100.0%) |
Property Value to Household Income Ratio in Wiscasset
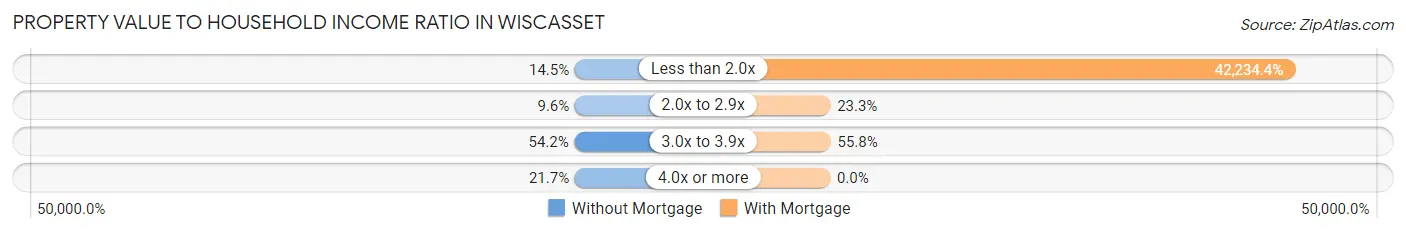
| Value-to-Income Ratio | Without Mortgage | With Mortgage |
| Less than 2.0x | 24 (14.5%) | 90,804 (42,234.4%) |
| 2.0x to 2.9x | 16 (9.6%) | 50 (23.3%) |
| 3.0x to 3.9x | 90 (54.2%) | 120 (55.8%) |
| 4.0x or more | 36 (21.7%) | 0 (0.0%) |
| Total | 166 (100.0%) | 215 (100.0%) |
Real Estate Taxes by Mortgage Status in Wiscasset
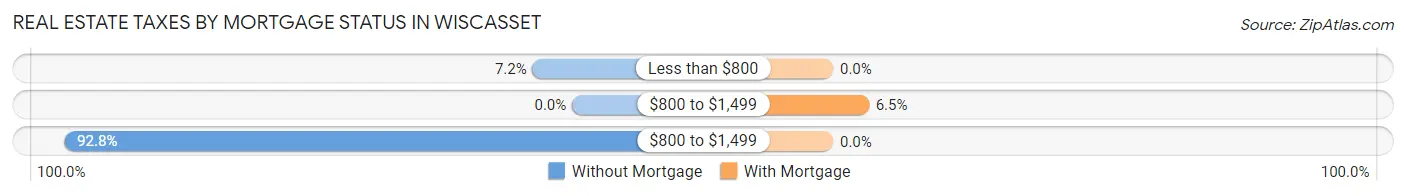
| Property Taxes | Without Mortgage | With Mortgage |
| Less than $800 | 12 (7.2%) | 0 (0.0%) |
| $800 to $1,499 | 0 (0.0%) | 14 (6.5%) |
| $800 to $1,499 | 154 (92.8%) | 0 (0.0%) |
| Total | 166 (100.0%) | 215 (100.0%) |
Health & Disability in Wiscasset
Health Insurance Coverage by Age in Wiscasset
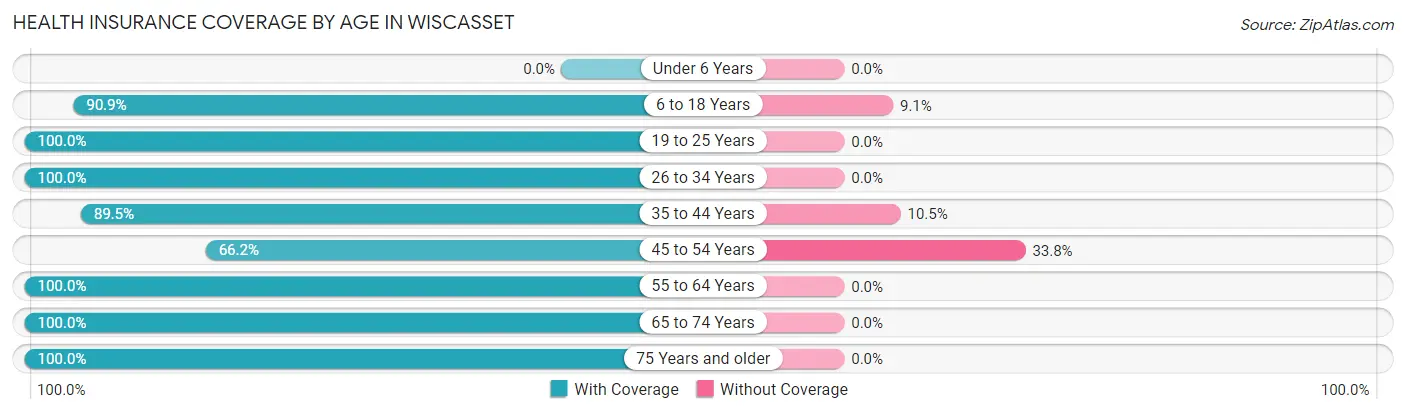
| Age Bracket | With Coverage | Without Coverage |
| Under 6 Years | 0 (0.0%) | 0 (0.0%) |
| 6 to 18 Years | 90 (90.9%) | 9 (9.1%) |
| 19 to 25 Years | 243 (100.0%) | 0 (0.0%) |
| 26 to 34 Years | 8 (100.0%) | 0 (0.0%) |
| 35 to 44 Years | 128 (89.5%) | 15 (10.5%) |
| 45 to 54 Years | 149 (66.2%) | 76 (33.8%) |
| 55 to 64 Years | 200 (100.0%) | 0 (0.0%) |
| 65 to 74 Years | 191 (100.0%) | 0 (0.0%) |
| 75 Years and older | 45 (100.0%) | 0 (0.0%) |
| Total | 1,054 (91.3%) | 100 (8.7%) |
Health Insurance Coverage by Citizenship Status in Wiscasset
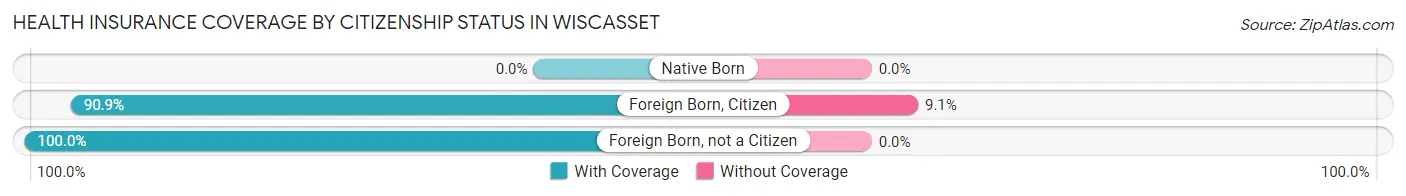
| Citizenship Status | With Coverage | Without Coverage |
| Native Born | 0 (0.0%) | 0 (0.0%) |
| Foreign Born, Citizen | 90 (90.9%) | 9 (9.1%) |
| Foreign Born, not a Citizen | 243 (100.0%) | 0 (0.0%) |
Health Insurance Coverage by Household Income in Wiscasset
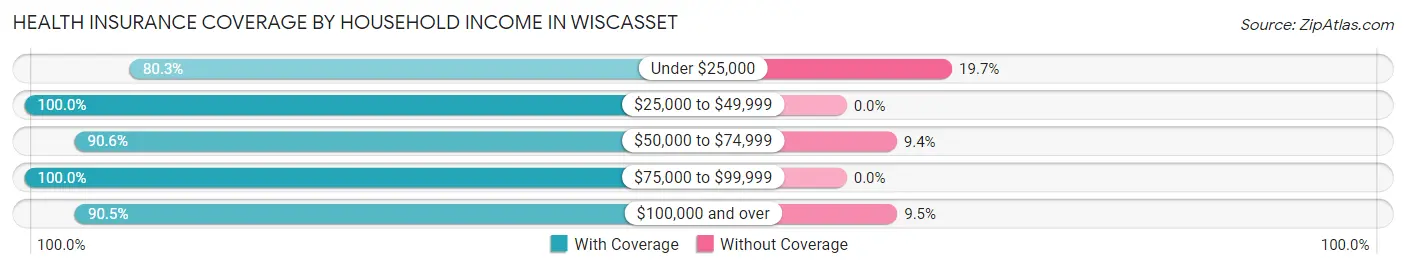
| Household Income | With Coverage | Without Coverage |
| Under $25,000 | 61 (80.3%) | 15 (19.7%) |
| $25,000 to $49,999 | 73 (100.0%) | 0 (0.0%) |
| $50,000 to $74,999 | 87 (90.6%) | 9 (9.4%) |
| $75,000 to $99,999 | 96 (100.0%) | 0 (0.0%) |
| $100,000 and over | 727 (90.5%) | 76 (9.5%) |
Public vs Private Health Insurance Coverage by Age in Wiscasset
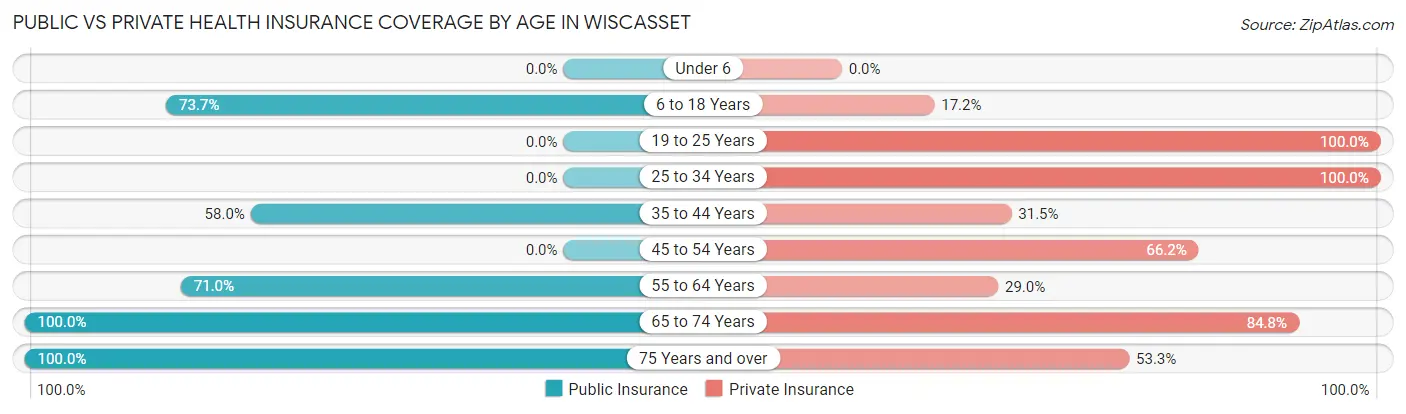
| Age Bracket | Public Insurance | Private Insurance |
| Under 6 | 0 (0.0%) | 0 (0.0%) |
| 6 to 18 Years | 73 (73.7%) | 17 (17.2%) |
| 19 to 25 Years | 0 (0.0%) | 243 (100.0%) |
| 25 to 34 Years | 0 (0.0%) | 8 (100.0%) |
| 35 to 44 Years | 83 (58.0%) | 45 (31.5%) |
| 45 to 54 Years | 0 (0.0%) | 149 (66.2%) |
| 55 to 64 Years | 142 (71.0%) | 58 (29.0%) |
| 65 to 74 Years | 191 (100.0%) | 162 (84.8%) |
| 75 Years and over | 45 (100.0%) | 24 (53.3%) |
| Total | 534 (46.3%) | 706 (61.2%) |
Disability Status by Sex by Age in Wiscasset
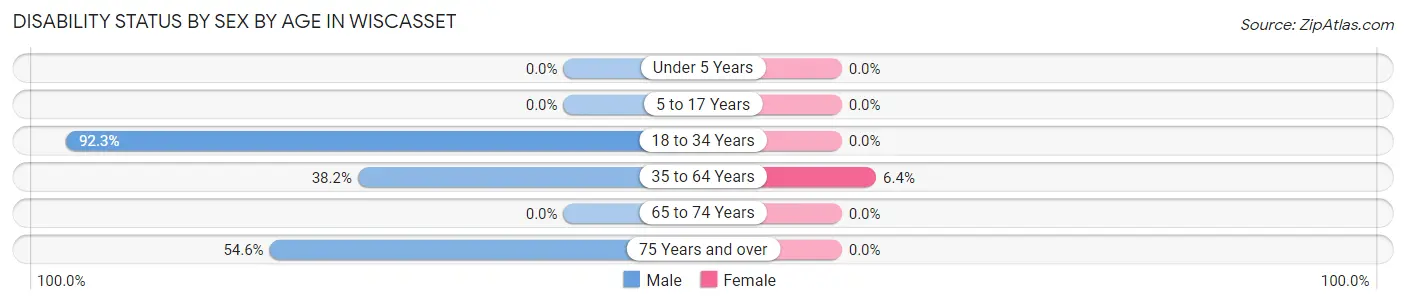
| Age Bracket | Male | Female |
| Under 5 Years | 0 (0.0%) | 0 (0.0%) |
| 5 to 17 Years | 0 (0.0%) | 0 (0.0%) |
| 18 to 34 Years | 84 (92.3%) | 0 (0.0%) |
| 35 to 64 Years | 145 (38.2%) | 12 (6.4%) |
| 65 to 74 Years | 0 (0.0%) | 0 (0.0%) |
| 75 Years and over | 12 (54.5%) | 0 (0.0%) |
Disability Class by Sex by Age in Wiscasset
Disability Class: Hearing Difficulty
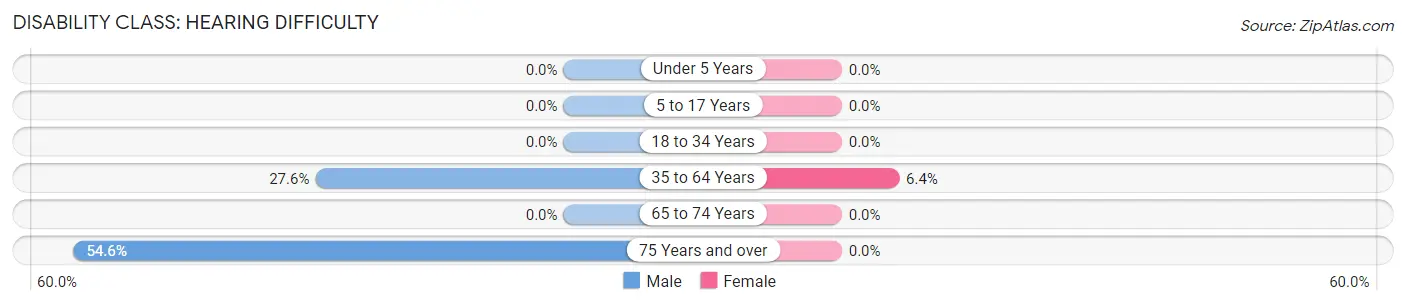
| Age Bracket | Male | Female |
| Under 5 Years | 0 (0.0%) | 0 (0.0%) |
| 5 to 17 Years | 0 (0.0%) | 0 (0.0%) |
| 18 to 34 Years | 0 (0.0%) | 0 (0.0%) |
| 35 to 64 Years | 105 (27.6%) | 12 (6.4%) |
| 65 to 74 Years | 0 (0.0%) | 0 (0.0%) |
| 75 Years and over | 12 (54.5%) | 0 (0.0%) |
Disability Class: Vision Difficulty
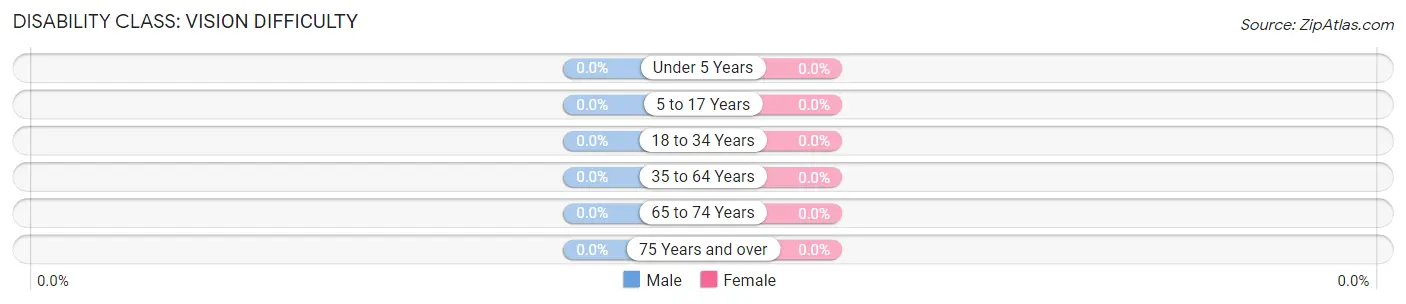
| Age Bracket | Male | Female |
| Under 5 Years | 0 (0.0%) | 0 (0.0%) |
| 5 to 17 Years | 0 (0.0%) | 0 (0.0%) |
| 18 to 34 Years | 0 (0.0%) | 0 (0.0%) |
| 35 to 64 Years | 0 (0.0%) | 0 (0.0%) |
| 65 to 74 Years | 0 (0.0%) | 0 (0.0%) |
| 75 Years and over | 0 (0.0%) | 0 (0.0%) |
Disability Class: Cognitive Difficulty
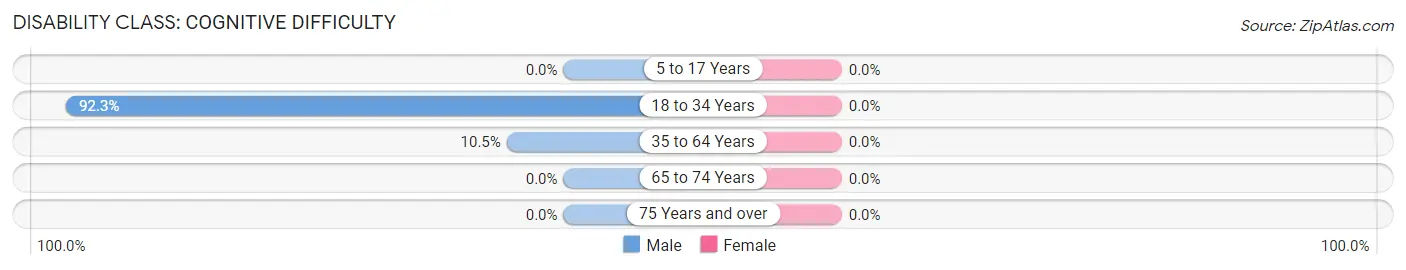
| Age Bracket | Male | Female |
| 5 to 17 Years | 0 (0.0%) | 0 (0.0%) |
| 18 to 34 Years | 84 (92.3%) | 0 (0.0%) |
| 35 to 64 Years | 40 (10.5%) | 0 (0.0%) |
| 65 to 74 Years | 0 (0.0%) | 0 (0.0%) |
| 75 Years and over | 0 (0.0%) | 0 (0.0%) |
Disability Class: Ambulatory Difficulty
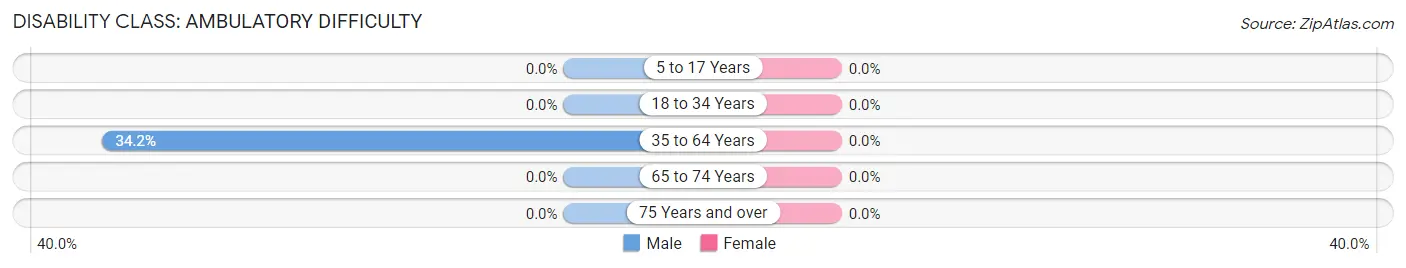
| Age Bracket | Male | Female |
| 5 to 17 Years | 0 (0.0%) | 0 (0.0%) |
| 18 to 34 Years | 0 (0.0%) | 0 (0.0%) |
| 35 to 64 Years | 130 (34.2%) | 0 (0.0%) |
| 65 to 74 Years | 0 (0.0%) | 0 (0.0%) |
| 75 Years and over | 0 (0.0%) | 0 (0.0%) |
Disability Class: Self-Care Difficulty
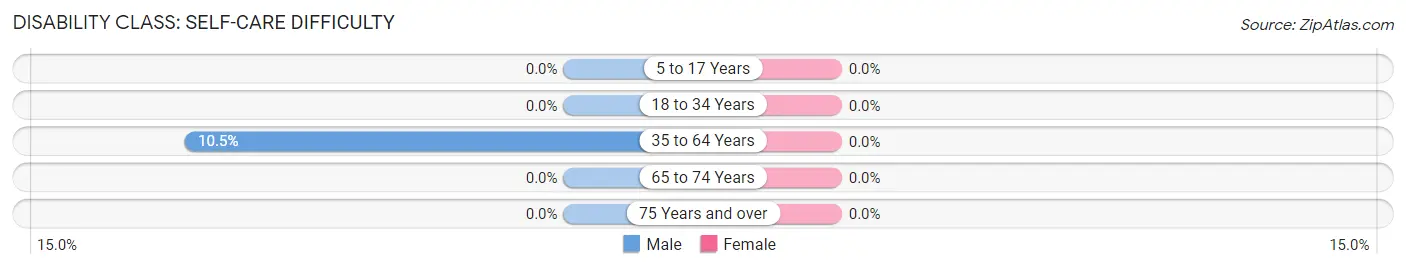
| Age Bracket | Male | Female |
| 5 to 17 Years | 0 (0.0%) | 0 (0.0%) |
| 18 to 34 Years | 0 (0.0%) | 0 (0.0%) |
| 35 to 64 Years | 40 (10.5%) | 0 (0.0%) |
| 65 to 74 Years | 0 (0.0%) | 0 (0.0%) |
| 75 Years and over | 0 (0.0%) | 0 (0.0%) |
Technology Access in Wiscasset
Computing Device Access in Wiscasset
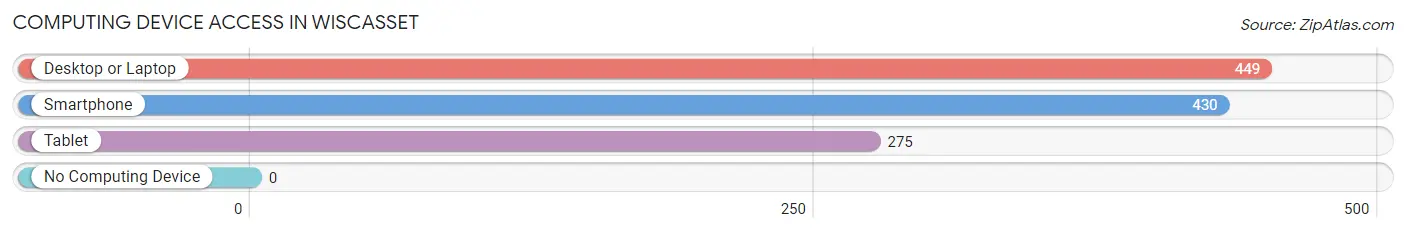
| Device Type | # Households | % Households |
| Desktop or Laptop | 449 | 83.3% |
| Smartphone | 430 | 79.8% |
| Tablet | 275 | 51.0% |
| No Computing Device | 0 | 0.0% |
| Total | 539 | 100.0% |
Internet Access in Wiscasset
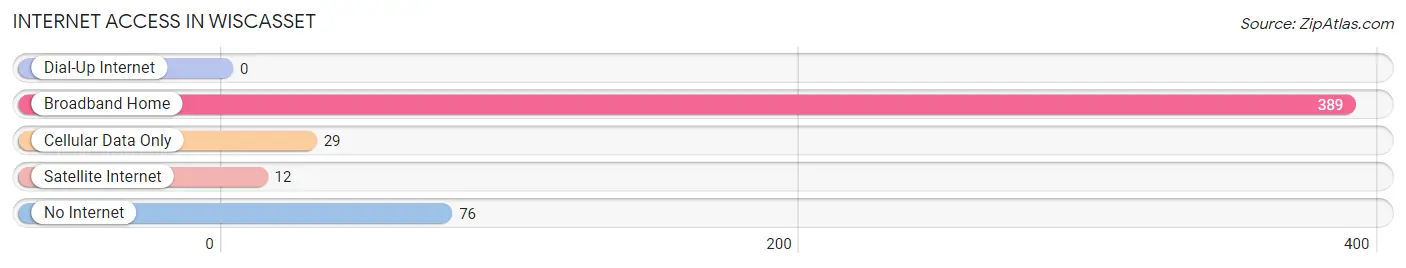
| Internet Type | # Households | % Households |
| Dial-Up Internet | 0 | 0.0% |
| Broadband Home | 389 | 72.2% |
| Cellular Data Only | 29 | 5.4% |
| Satellite Internet | 12 | 2.2% |
| No Internet | 76 | 14.1% |
| Total | 539 | 100.0% |
Wiscasset Summary
Wiscasset is a town located in Lincoln County, Maine, United States. It is situated on the Sheepscot River, approximately 28 miles northeast of Augusta, the state capital. As of the 2010 census, the town had a population of 3,732.
History
Wiscasset was first settled in 1663 by Europeans, and was incorporated in 1760. It was the first town in the United States to be incorporated by the legislature of a state. The town was named after the Wiscasset Native American tribe, which had inhabited the area for centuries prior to European settlement.
During the American Revolution, Wiscasset was a major port for the Continental Navy. The town was also the site of the first naval battle of the war, when the British frigate HMS Falcon attacked the American sloop Unity in 1775.
In the 19th century, Wiscasset was a major shipbuilding center, and was home to several prominent shipyards. The town was also a major port for the export of lumber and other goods.
Geography
Wiscasset is located at 44°3′N 69°41′W (44.05, -69.68). According to the United States Census Bureau, the town has a total area of 11.2 square miles, of which 10.9 square miles is land and 0.3 square miles is water.
The town is situated on the Sheepscot River, which flows into the Atlantic Ocean. The town is bordered by Edgecomb to the north, Alna to the east, Dresden to the south, and Westport Island to the west.
Economy
Wiscasset is a small, rural town with a largely agricultural economy. The town is home to several small farms, as well as a few larger operations. The town is also home to several small businesses, including restaurants, shops, and galleries.
The town is also home to the Maine State Ferry Service, which operates a ferry between Wiscasset and Boothbay Harbor. The ferry service is a major source of tourism for the town, as it provides access to the many attractions of the Boothbay region.
Demographics
As of the 2010 census, there were 3,732 people, 1,541 households, and 1,039 families residing in the town. The population density was 341.2 people per square mile. There were 1,717 housing units at an average density of 157.7 per square mile. The racial makeup of the town was 97.2% White, 0.3% African American, 0.4% Native American, 0.4% Asian, 0.1% Pacific Islander, 0.3% from other races, and 1.3% from two or more races. Hispanic or Latino of any race were 1.2% of the population.
There were 1,541 households, out of which 28.2% had children under the age of 18 living with them, 54.2% were married couples living together, 9.7% had a female householder with no husband present, and 32.2% were non-families. 26.2% of all households were made up of individuals, and 11.2% had someone living alone who was 65 years of age or older. The average household size was 2.41 and the average family size was 2.90.
In the town, the population was spread out, with 23.2% under the age of 18, 6.2% from 18 to 24, 25.2% from 25 to 44, 29.2% from 45 to 64, and 16.2% who were 65 years of age or older. The median age was 42 years. For every 100 females, there were 93.2 males. For every 100 females age 18 and over, there were 90.2 males.
The median income for a household in the town was $41,944, and the median income for a family was $50,000. Males had a median income of $36,250 versus $25,000 for females. The per capita income for the town was $20,945. About 6.2% of families and 8.7% of the population were below the poverty line, including 10.2% of those under age 18 and 8.2% of those age 65 or over.
Common Questions
What is Per Capita Income in Wiscasset?
Per Capita income in Wiscasset is $41,606.
What is the Median Family Income in Wiscasset?
Median Family Income in Wiscasset is $81,612.
What is the Median Household income in Wiscasset?
Median Household Income in Wiscasset is $102,792.
What is Income or Wage Gap in Wiscasset?
Income or Wage Gap in Wiscasset is 6.6%.
Women in Wiscasset earn 93.4 cents for every dollar earned by a man.
What is Inequality or Gini Index in Wiscasset?
Inequality or Gini Index in Wiscasset is 0.29.
What is the Total Population of Wiscasset?
Total Population of Wiscasset is 1,207.
What is the Total Male Population of Wiscasset?
Total Male Population of Wiscasset is 667.
What is the Total Female Population of Wiscasset?
Total Female Population of Wiscasset is 540.
What is the Ratio of Males per 100 Females in Wiscasset?
There are 123.52 Males per 100 Females in Wiscasset.
What is the Ratio of Females per 100 Males in Wiscasset?
There are 80.96 Females per 100 Males in Wiscasset.
What is the Median Population Age in Wiscasset?
Median Population Age in Wiscasset is 47.8 Years.
What is the Average Family Size in Wiscasset
Average Family Size in Wiscasset is 3.0 People.
What is the Average Household Size in Wiscasset
Average Household Size in Wiscasset is 2.1 People.
How Large is the Labor Force in Wiscasset?
There are 732 People in the Labor Forcein in Wiscasset.
What is the Percentage of People in the Labor Force in Wiscasset?
65.5% of People are in the Labor Force in Wiscasset.
What is the Unemployment Rate in Wiscasset?
Unemployment Rate in Wiscasset is 3.3%.