Norway, ME Map & Demographics
Norway Map
Norway Overview
$21,703
PER CAPITA INCOME
$50,461
AVG FAMILY INCOME
$38,381
AVG HOUSEHOLD INCOME
18.1%
WAGE / INCOME GAP [ % ]
81.9¢/ $1
WAGE / INCOME GAP [ $ ]
0.41
INEQUALITY / GINI INDEX
2,698
TOTAL POPULATION
1,286
MALE POPULATION
1,412
FEMALE POPULATION
91.08
MALES / 100 FEMALES
109.80
FEMALES / 100 MALES
45.8
MEDIAN AGE
2.9
AVG FAMILY SIZE
2.4
AVG HOUSEHOLD SIZE
879
LABOR FORCE [ PEOPLE ]
37.7%
PERCENT IN LABOR FORCE
7.5%
UNEMPLOYMENT RATE
Norway Zip Codes
Norway Area Codes
Income in Norway
Income Overview in Norway
Per Capita Income in Norway is $21,703, while median incomes of families and households are $50,461 and $38,381 respectively.
| Characteristic | Number | Measure |
| Per Capita Income | 2,698 | $21,703 |
| Median Family Income | 641 | $50,461 |
| Mean Family Income | 641 | $63,655 |
| Median Household Income | 1,072 | $38,381 |
| Mean Household Income | 1,072 | $52,748 |
| Income Deficit | 641 | $0 |
| Wage / Income Gap (%) | 2,698 | 18.13% |
| Wage / Income Gap ($) | 2,698 | 81.87¢ per $1 |
| Gini / Inequality Index | 2,698 | 0.41 |
Earnings by Sex in Norway
Average Earnings in Norway are $24,497, $29,375 for men and $24,049 for women, a difference of 18.1%.

| Sex | Number | Average Earnings |
| Male | 336 (34.7%) | $29,375 |
| Female | 631 (65.2%) | $24,049 |
| Total | 967 (100.0%) | $24,497 |
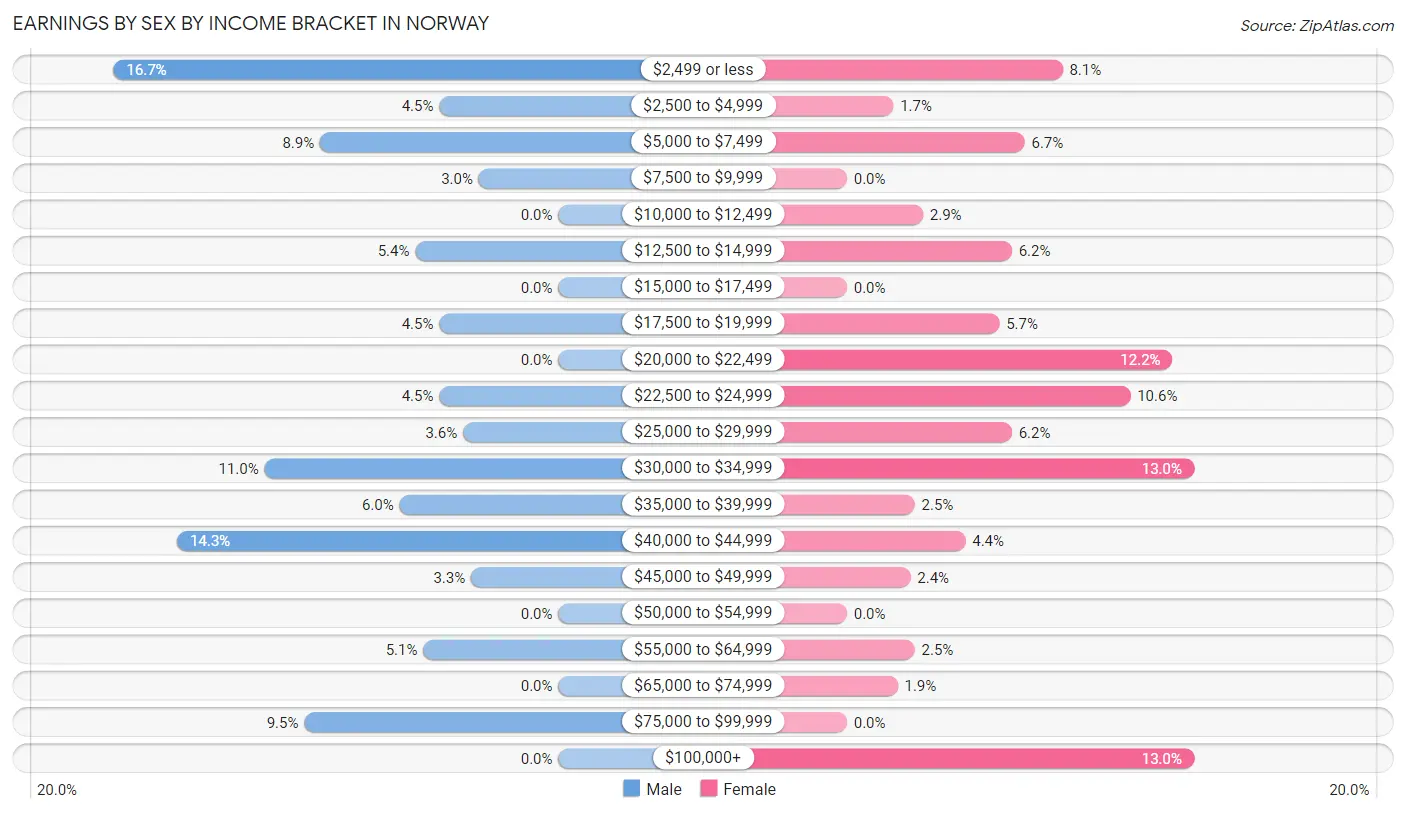
Earnings by Sex by Income Bracket in Norway
The most common earnings brackets in Norway are $2,499 or less for men (56 | 16.7%) and $30,000 to $34,999 for women (82 | 13.0%).
| Income | Male | Female |
| $2,499 or less | 56 (16.7%) | 51 (8.1%) |
| $2,500 to $4,999 | 15 (4.5%) | 11 (1.7%) |
| $5,000 to $7,499 | 30 (8.9%) | 42 (6.7%) |
| $7,500 to $9,999 | 10 (3.0%) | 0 (0.0%) |
| $10,000 to $12,499 | 0 (0.0%) | 18 (2.9%) |
| $12,500 to $14,999 | 18 (5.4%) | 39 (6.2%) |
| $15,000 to $17,499 | 0 (0.0%) | 0 (0.0%) |
| $17,500 to $19,999 | 15 (4.5%) | 36 (5.7%) |
| $20,000 to $22,499 | 0 (0.0%) | 77 (12.2%) |
| $22,500 to $24,999 | 15 (4.5%) | 67 (10.6%) |
| $25,000 to $29,999 | 12 (3.6%) | 39 (6.2%) |
| $30,000 to $34,999 | 37 (11.0%) | 82 (13.0%) |
| $35,000 to $39,999 | 20 (5.9%) | 16 (2.5%) |
| $40,000 to $44,999 | 48 (14.3%) | 28 (4.4%) |
| $45,000 to $49,999 | 11 (3.3%) | 15 (2.4%) |
| $50,000 to $54,999 | 0 (0.0%) | 0 (0.0%) |
| $55,000 to $64,999 | 17 (5.1%) | 16 (2.5%) |
| $65,000 to $74,999 | 0 (0.0%) | 12 (1.9%) |
| $75,000 to $99,999 | 32 (9.5%) | 0 (0.0%) |
| $100,000+ | 0 (0.0%) | 82 (13.0%) |
| Total | 336 (100.0%) | 631 (100.0%) |
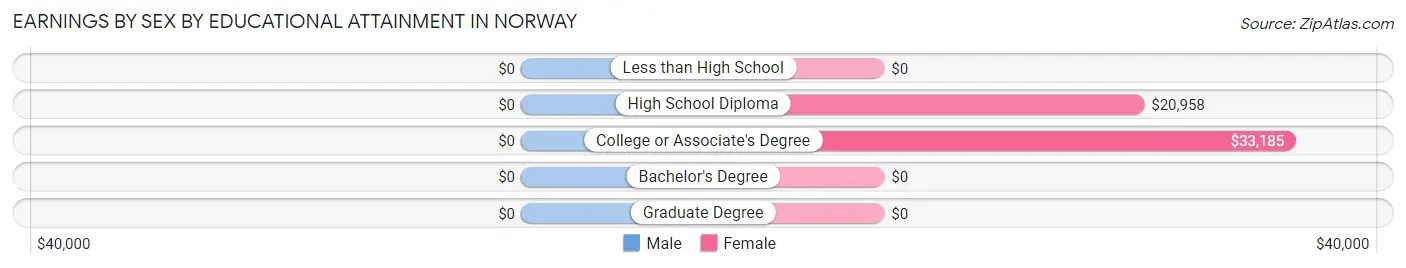
Earnings by Sex by Educational Attainment in Norway
| Educational Attainment | Male Income | Female Income |
| Less than High School | - | - |
| High School Diploma | - | - |
| College or Associate's Degree | - | - |
| Bachelor's Degree | - | - |
| Graduate Degree | - | - |
| Total | $24,167 | $24,907 |
Family Income in Norway
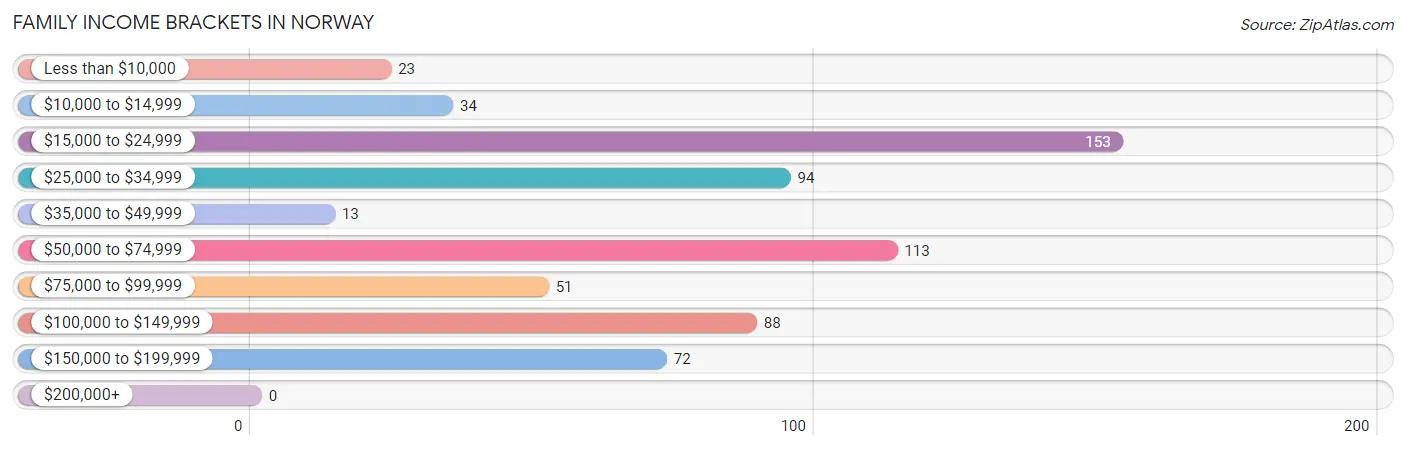
Family Income Brackets in Norway
According to the Norway family income data, there are 153 families falling into the $15,000 to $24,999 income range, which is the most common income bracket and makes up 23.9% of all families.
| Income Bracket | # Families | % Families |
| Less than $10,000 | 23 | 3.6% |
| $10,000 to $14,999 | 34 | 5.3% |
| $15,000 to $24,999 | 153 | 23.9% |
| $25,000 to $34,999 | 94 | 14.7% |
| $35,000 to $49,999 | 13 | 2.0% |
| $50,000 to $74,999 | 113 | 17.6% |
| $75,000 to $99,999 | 51 | 8.0% |
| $100,000 to $149,999 | 88 | 13.7% |
| $150,000 to $199,999 | 72 | 11.2% |
| $200,000+ | 0 | 0.0% |
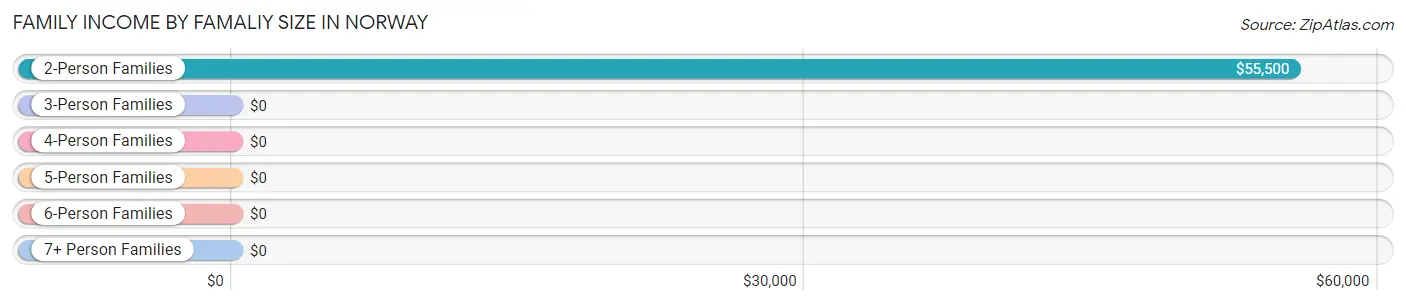
Family Income by Famaliy Size in Norway
2-person families (472 | 73.6%) account for the highest median family income in Norway with $55,500 per family, while 2-person families (472 | 73.6%) have the highest median income of $27,750 per family member.
| Income Bracket | # Families | Median Income |
| 2-Person Families | 472 (73.6%) | $55,500 |
| 3-Person Families | 62 (9.7%) | $0 |
| 4-Person Families | 26 (4.1%) | $0 |
| 5-Person Families | 40 (6.2%) | $0 |
| 6-Person Families | 41 (6.4%) | $0 |
| 7+ Person Families | 0 (0.0%) | $0 |
| Total | 641 (100.0%) | $50,461 |
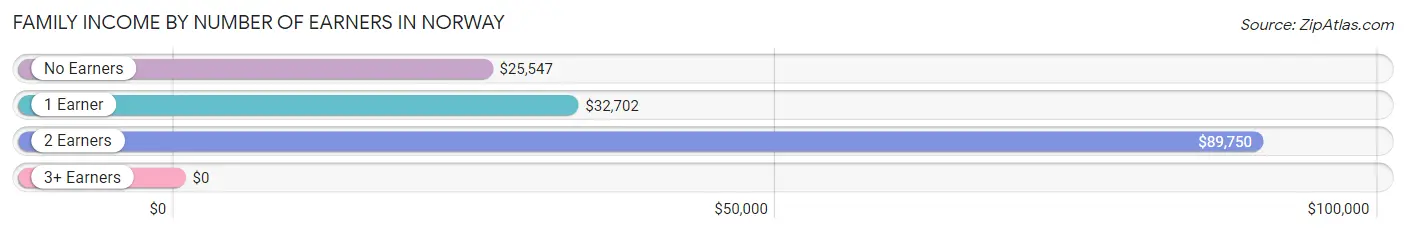
Family Income by Number of Earners in Norway
| Number of Earners | # Families | Median Income |
| No Earners | 231 (36.0%) | $25,547 |
| 1 Earner | 245 (38.2%) | $32,702 |
| 2 Earners | 145 (22.6%) | $89,750 |
| 3+ Earners | 20 (3.1%) | $0 |
| Total | 641 (100.0%) | $50,461 |
Household Income in Norway
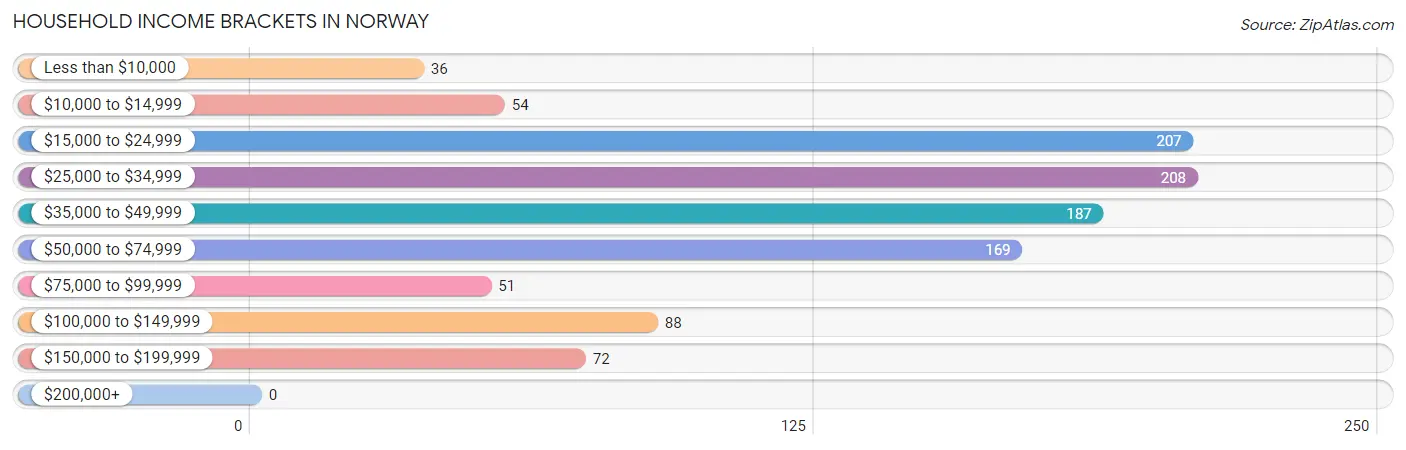
Household Income Brackets in Norway
With 208 households falling in the category, the $25,000 to $34,999 income range is the most frequent in Norway, accounting for 19.4% of all households.
| Income Bracket | # Households | % Households |
| Less than $10,000 | 36 | 3.4% |
| $10,000 to $14,999 | 54 | 5.0% |
| $15,000 to $24,999 | 207 | 19.3% |
| $25,000 to $34,999 | 208 | 19.4% |
| $35,000 to $49,999 | 187 | 17.4% |
| $50,000 to $74,999 | 169 | 15.8% |
| $75,000 to $99,999 | 51 | 4.8% |
| $100,000 to $149,999 | 88 | 8.2% |
| $150,000 to $199,999 | 72 | 6.7% |
| $200,000+ | 0 | 0.0% |
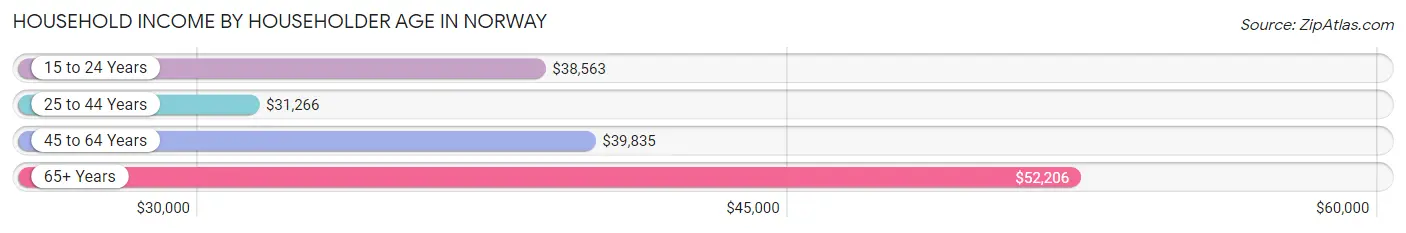
Household Income by Householder Age in Norway
The median household income in Norway is $38,381, with the highest median household income of $52,206 found in the 65+ years age bracket for the primary householder. A total of 384 households (35.8%) fall into this category. Meanwhile, the 25 to 44 years age bracket for the primary householder has the lowest median household income of $31,266, with 234 households (21.8%) in this group.
| Income Bracket | # Households | Median Income |
| 15 to 24 Years | 45 (4.2%) | $38,563 |
| 25 to 44 Years | 234 (21.8%) | $31,266 |
| 45 to 64 Years | 409 (38.2%) | $39,835 |
| 65+ Years | 384 (35.8%) | $52,206 |
| Total | 1,072 (100.0%) | $38,381 |
Poverty in Norway
Income Below Poverty by Sex and Age in Norway
With 34.3% poverty level for males and 34.8% for females among the residents of Norway, 6 to 11 year old males and 5 year old females are the most vulnerable to poverty, with 90 males (100.0%) and 32 females (100.0%) in their respective age groups living below the poverty level.
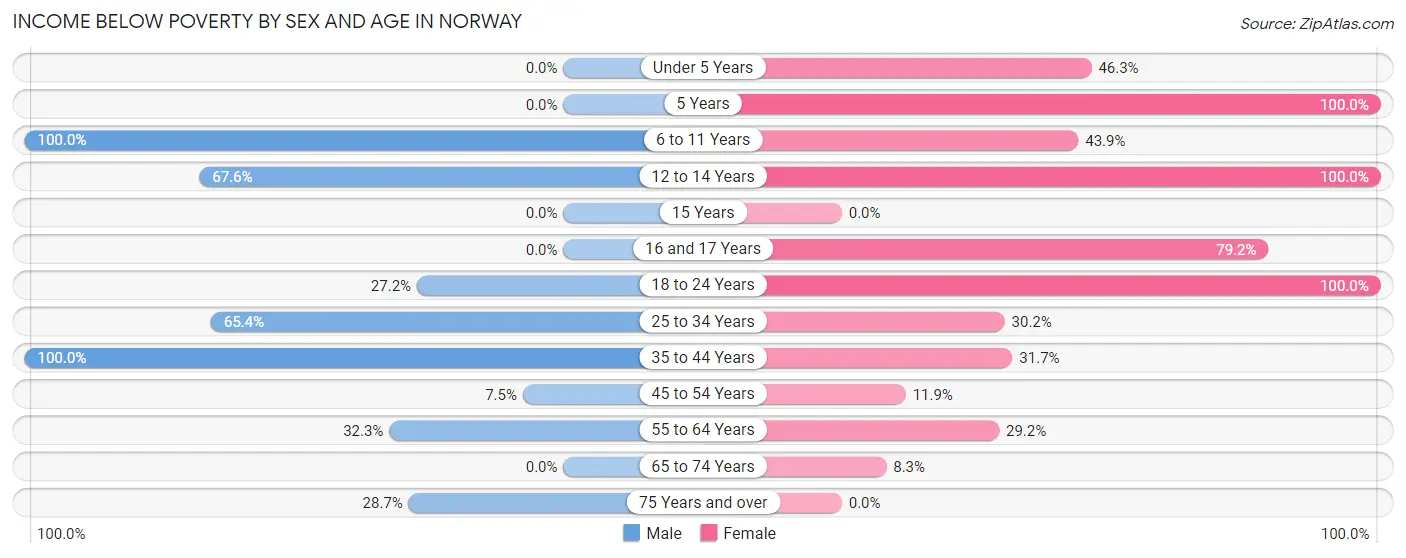
| Age Bracket | Male | Female |
| Under 5 Years | 0 (0.0%) | 19 (46.3%) |
| 5 Years | 0 (0.0%) | 32 (100.0%) |
| 6 to 11 Years | 90 (100.0%) | 54 (43.9%) |
| 12 to 14 Years | 25 (67.6%) | 23 (100.0%) |
| 15 Years | 0 (0.0%) | 0 (0.0%) |
| 16 and 17 Years | 0 (0.0%) | 57 (79.2%) |
| 18 to 24 Years | 28 (27.2%) | 98 (100.0%) |
| 25 to 34 Years | 142 (65.4%) | 68 (30.2%) |
| 35 to 44 Years | 43 (100.0%) | 38 (31.7%) |
| 45 to 54 Years | 24 (7.5%) | 7 (11.9%) |
| 55 to 64 Years | 43 (32.3%) | 68 (29.2%) |
| 65 to 74 Years | 0 (0.0%) | 18 (8.3%) |
| 75 Years and over | 29 (28.7%) | 0 (0.0%) |
| Total | 424 (34.3%) | 482 (34.8%) |
Income Above Poverty by Sex and Age in Norway
According to the poverty statistics in Norway, males aged under 5 years and females aged 75 years and over are the age groups that are most secure financially, with 100.0% of males and 100.0% of females in these age groups living above the poverty line.
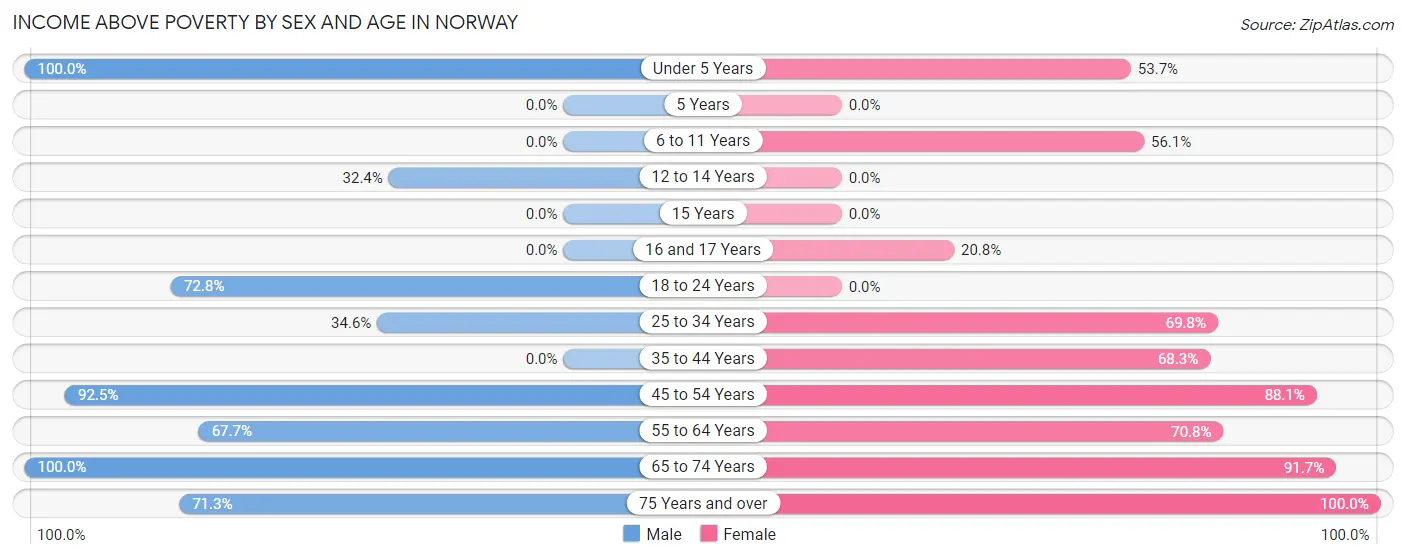
| Age Bracket | Male | Female |
| Under 5 Years | 20 (100.0%) | 22 (53.7%) |
| 5 Years | 0 (0.0%) | 0 (0.0%) |
| 6 to 11 Years | 0 (0.0%) | 69 (56.1%) |
| 12 to 14 Years | 12 (32.4%) | 0 (0.0%) |
| 15 Years | 0 (0.0%) | 0 (0.0%) |
| 16 and 17 Years | 0 (0.0%) | 15 (20.8%) |
| 18 to 24 Years | 75 (72.8%) | 0 (0.0%) |
| 25 to 34 Years | 75 (34.6%) | 157 (69.8%) |
| 35 to 44 Years | 0 (0.0%) | 82 (68.3%) |
| 45 to 54 Years | 295 (92.5%) | 52 (88.1%) |
| 55 to 64 Years | 90 (67.7%) | 165 (70.8%) |
| 65 to 74 Years | 172 (100.0%) | 200 (91.7%) |
| 75 Years and over | 72 (71.3%) | 142 (100.0%) |
| Total | 811 (65.7%) | 904 (65.2%) |
Income Below Poverty Among Married-Couple Families in Norway
The poverty statistics for married-couple families in Norway show that 13.9% or 54 of the total 390 families live below the poverty line. Families with 3 or 4 children have the highest poverty rate of 100.0%, comprising of 31 families. On the other hand, families with 1 or 2 children have the lowest poverty rate of 0.0%, which includes 0 families.
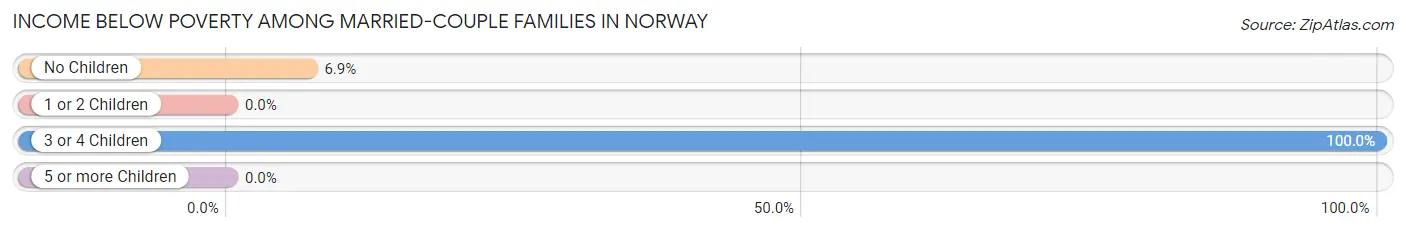
| Children | Above Poverty | Below Poverty |
| No Children | 310 (93.1%) | 23 (6.9%) |
| 1 or 2 Children | 26 (100.0%) | 0 (0.0%) |
| 3 or 4 Children | 0 (0.0%) | 31 (100.0%) |
| 5 or more Children | 0 (0.0%) | 0 (0.0%) |
| Total | 336 (86.2%) | 54 (13.9%) |
Income Below Poverty Among Single-Parent Households in Norway
According to the poverty data in Norway, 100.0% or 47 single-father households and 49.0% or 100 single-mother households are living below the poverty line. Among single-father households, those with 1 or 2 children have the highest poverty rate, with 24 households (100.0%) experiencing poverty. Likewise, among single-mother households, those with no children have the highest poverty rate, with 82 households (60.3%) falling below the poverty line.
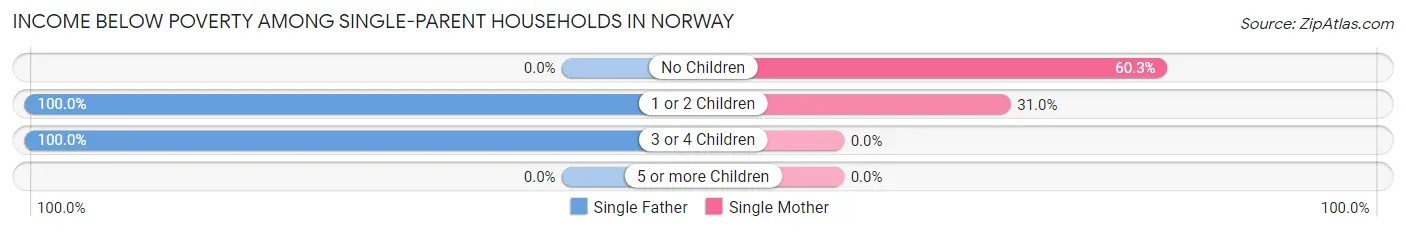
| Children | Single Father | Single Mother |
| No Children | 0 (0.0%) | 82 (60.3%) |
| 1 or 2 Children | 24 (100.0%) | 18 (31.0%) |
| 3 or 4 Children | 23 (100.0%) | 0 (0.0%) |
| 5 or more Children | 0 (0.0%) | 0 (0.0%) |
| Total | 47 (100.0%) | 100 (49.0%) |
Income Below Poverty Among Married-Couple vs Single-Parent Households in Norway
The poverty data for Norway shows that 54 of the married-couple family households (13.9%) and 147 of the single-parent households (58.6%) are living below the poverty level. Within the married-couple family households, those with 3 or 4 children have the highest poverty rate, with 31 households (100.0%) falling below the poverty line. Among the single-parent households, those with 3 or 4 children have the highest poverty rate, with 23 household (69.7%) living below poverty.
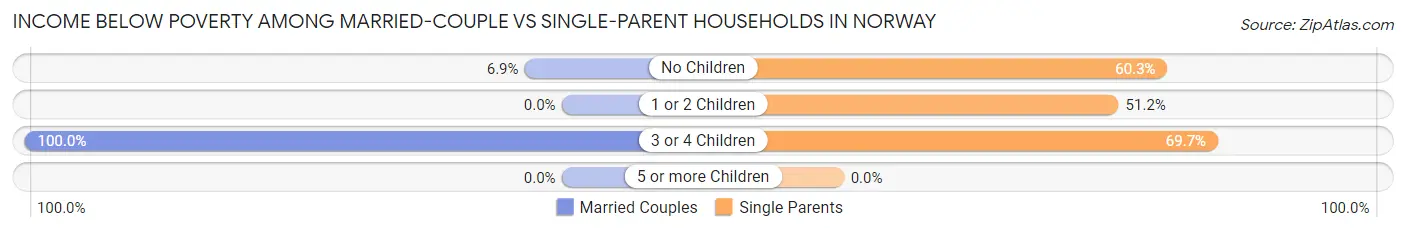
| Children | Married-Couple Families | Single-Parent Households |
| No Children | 23 (6.9%) | 82 (60.3%) |
| 1 or 2 Children | 0 (0.0%) | 42 (51.2%) |
| 3 or 4 Children | 31 (100.0%) | 23 (69.7%) |
| 5 or more Children | 0 (0.0%) | 0 (0.0%) |
| Total | 54 (13.9%) | 147 (58.6%) |
Race in Norway
The most populous races in Norway are White / Caucasian (2,351 | 87.1%), Two or more Races (289 | 10.7%), and Hispanic or Latino (78 | 2.9%).
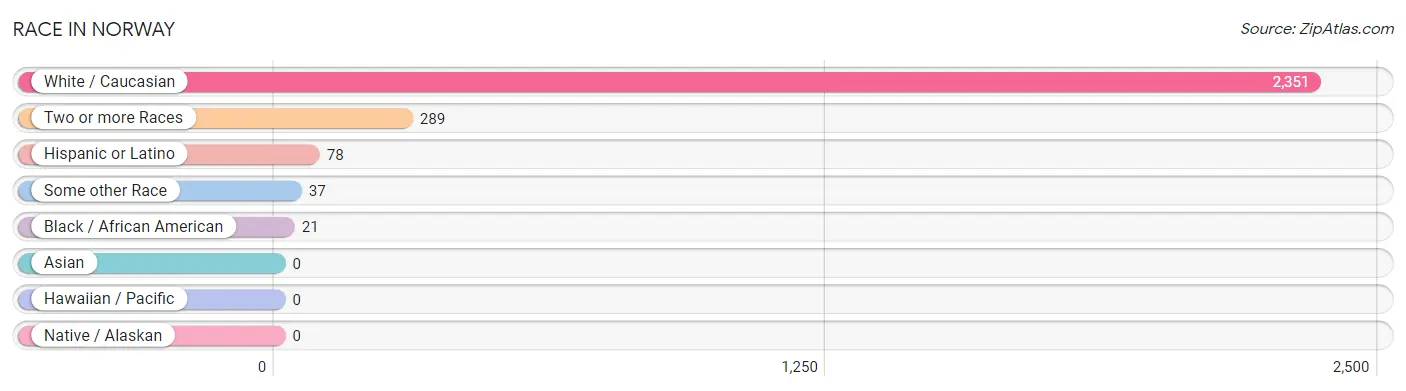
| Race | # Population | % Population |
| Asian | 0 | 0.0% |
| Black / African American | 21 | 0.8% |
| Hawaiian / Pacific | 0 | 0.0% |
| Hispanic or Latino | 78 | 2.9% |
| Native / Alaskan | 0 | 0.0% |
| White / Caucasian | 2,351 | 87.1% |
| Two or more Races | 289 | 10.7% |
| Some other Race | 37 | 1.4% |
| Total | 2,698 | 100.0% |
Ancestry in Norway
The most populous ancestries reported in Norway are English (496 | 18.4%), French (450 | 16.7%), Irish (272 | 10.1%), German (169 | 6.3%), and French Canadian (159 | 5.9%), together accounting for 57.3% of all Norway residents.
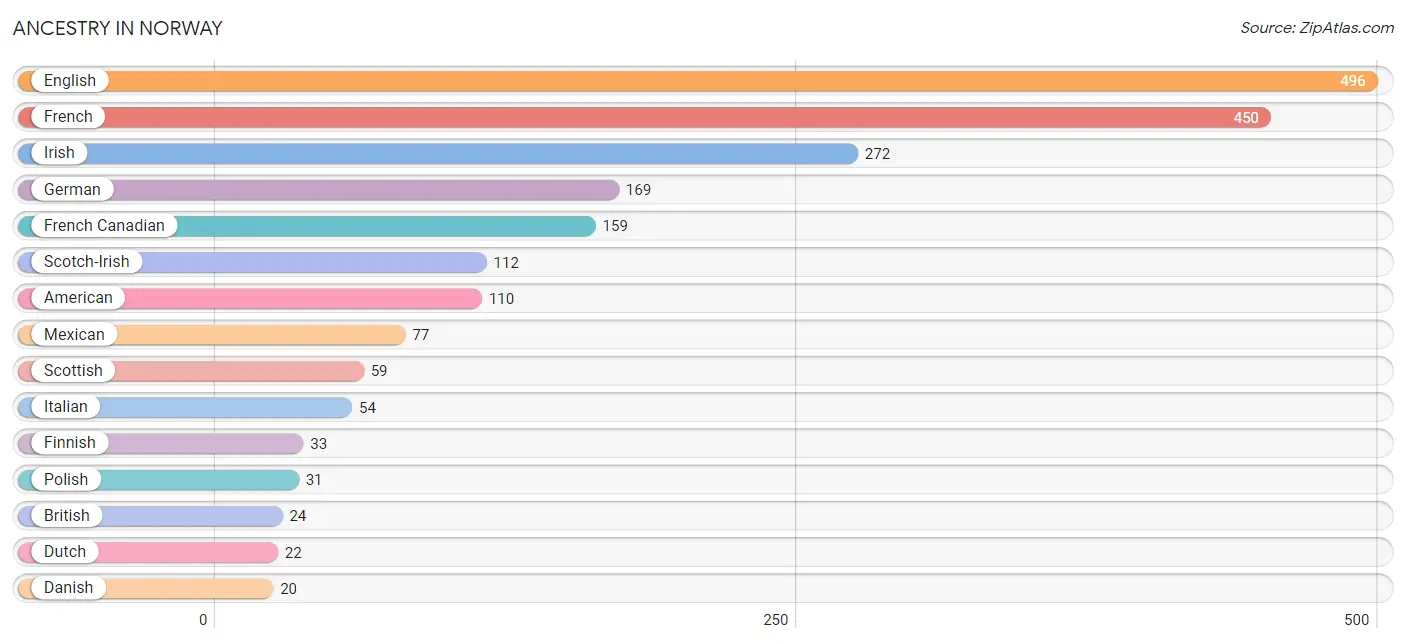
| Ancestry | # Population | % Population |
| American | 110 | 4.1% |
| British | 24 | 0.9% |
| Choctaw | 8 | 0.3% |
| Creek | 8 | 0.3% |
| Danish | 20 | 0.7% |
| Dutch | 22 | 0.8% |
| English | 496 | 18.4% |
| European | 13 | 0.5% |
| Finnish | 33 | 1.2% |
| French | 450 | 16.7% |
| French Canadian | 159 | 5.9% |
| German | 169 | 6.3% |
| Irish | 272 | 10.1% |
| Italian | 54 | 2.0% |
| Mexican | 77 | 2.9% |
| Norwegian | 19 | 0.7% |
| Polish | 31 | 1.1% |
| Portuguese | 18 | 0.7% |
| Scotch-Irish | 112 | 4.2% |
| Scottish | 59 | 2.2% |
| Somali | 2 | 0.1% |
| Subsaharan African | 2 | 0.1% |
| Swedish | 20 | 0.7% | View All 23 Rows |
Immigrants in Norway
The most numerous immigrant groups reported in Norway came from Europe (24 | 0.9%), Northern Europe (24 | 0.9%), and Canada (23 | 0.9%), together accounting for 2.6% of all Norway residents.
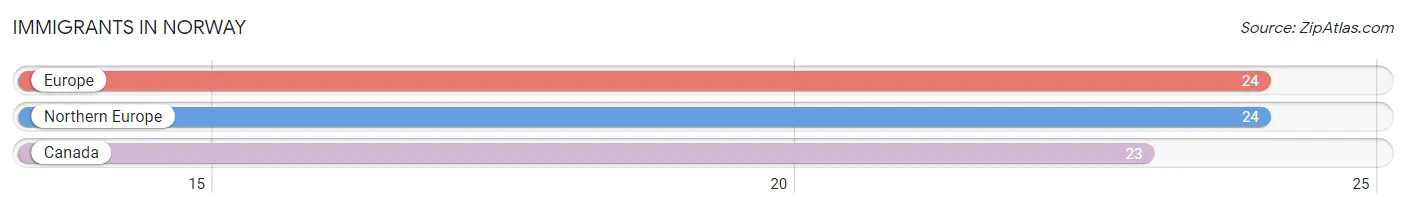
| Immigration Origin | # Population | % Population |
| Canada | 23 | 0.9% |
| Europe | 24 | 0.9% |
| Northern Europe | 24 | 0.9% | View All 3 Rows |
Sex and Age in Norway
Sex and Age in Norway
The most populous age groups in Norway are 50 to 54 Years (214 | 16.6%) for men and 5 to 9 Years (152 | 10.8%) for women.
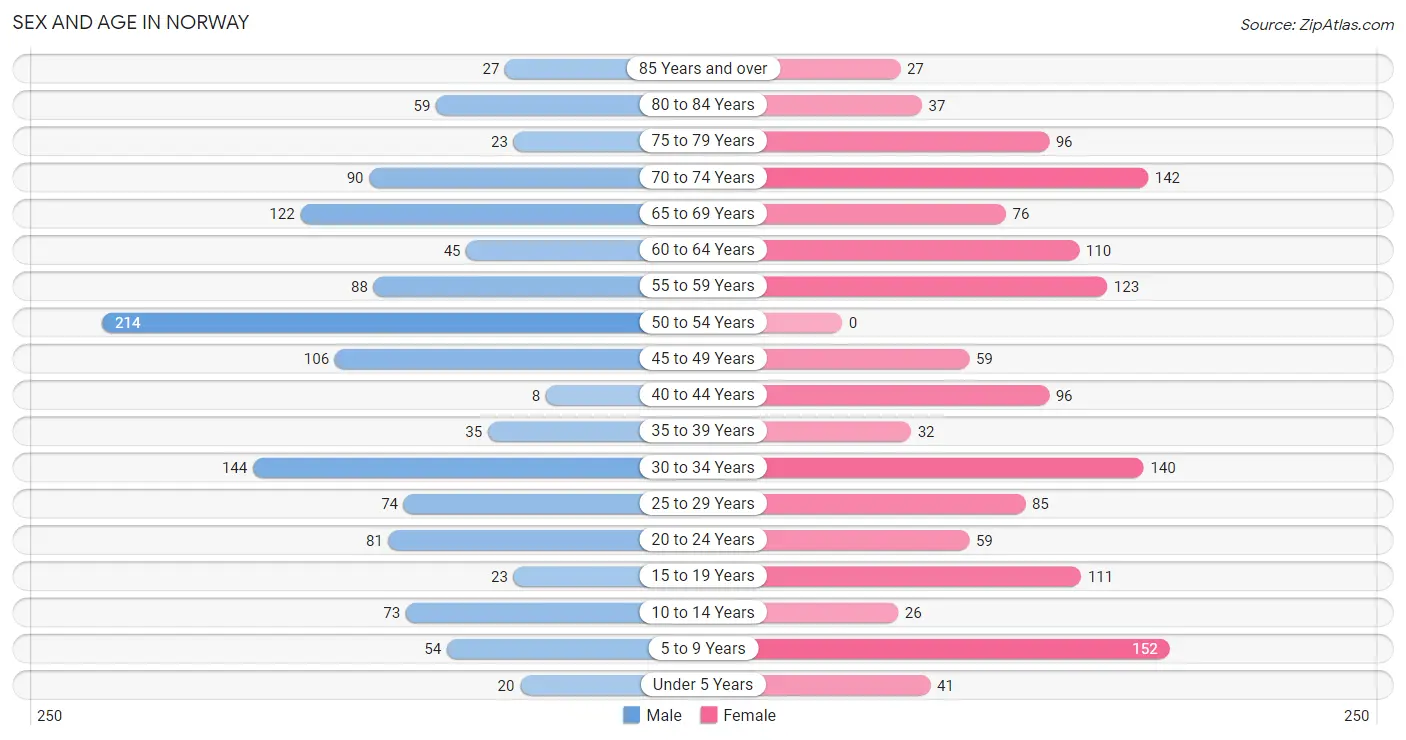
| Age Bracket | Male | Female |
| Under 5 Years | 20 (1.6%) | 41 (2.9%) |
| 5 to 9 Years | 54 (4.2%) | 152 (10.8%) |
| 10 to 14 Years | 73 (5.7%) | 26 (1.8%) |
| 15 to 19 Years | 23 (1.8%) | 111 (7.9%) |
| 20 to 24 Years | 81 (6.3%) | 59 (4.2%) |
| 25 to 29 Years | 74 (5.8%) | 85 (6.0%) |
| 30 to 34 Years | 144 (11.2%) | 140 (9.9%) |
| 35 to 39 Years | 35 (2.7%) | 32 (2.3%) |
| 40 to 44 Years | 8 (0.6%) | 96 (6.8%) |
| 45 to 49 Years | 106 (8.2%) | 59 (4.2%) |
| 50 to 54 Years | 214 (16.6%) | 0 (0.0%) |
| 55 to 59 Years | 88 (6.8%) | 123 (8.7%) |
| 60 to 64 Years | 45 (3.5%) | 110 (7.8%) |
| 65 to 69 Years | 122 (9.5%) | 76 (5.4%) |
| 70 to 74 Years | 90 (7.0%) | 142 (10.1%) |
| 75 to 79 Years | 23 (1.8%) | 96 (6.8%) |
| 80 to 84 Years | 59 (4.6%) | 37 (2.6%) |
| 85 Years and over | 27 (2.1%) | 27 (1.9%) |
| Total | 1,286 (100.0%) | 1,412 (100.0%) |
Families and Households in Norway
Median Family Size in Norway
The median family size in Norway is 2.89 persons per family, with single male/father families (47 | 7.3%) accounting for the largest median family size of 4.53 persons per family. On the other hand, single female/mother families (204 | 31.8%) represent the smallest median family size with 2.58 persons per family.
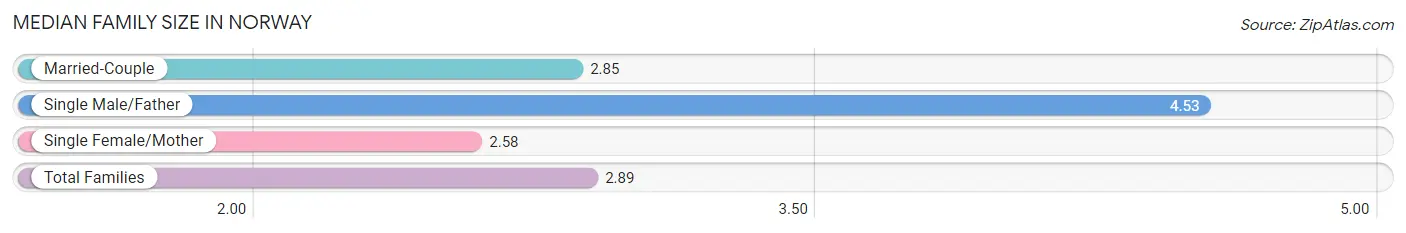
| Family Type | # Families | Family Size |
| Married-Couple | 390 (60.8%) | 2.85 |
| Single Male/Father | 47 (7.3%) | 4.53 |
| Single Female/Mother | 204 (31.8%) | 2.58 |
| Total Families | 641 (100.0%) | 2.89 |
Median Household Size in Norway
The median household size in Norway is 2.41 persons per household, with single male/father households (47 | 4.4%) accounting for the largest median household size of 4.53 persons per household. non-family households (431 | 40.2%) represent the smallest median household size with 1.36 persons per household.
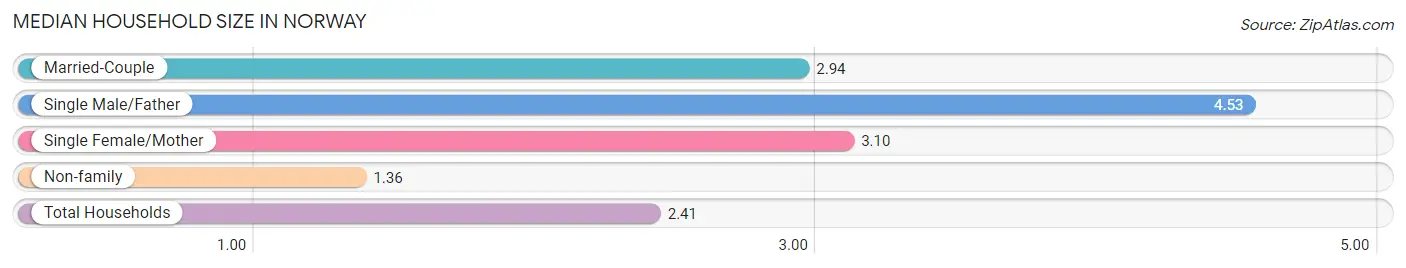
| Household Type | # Households | Household Size |
| Married-Couple | 390 (36.4%) | 2.94 |
| Single Male/Father | 47 (4.4%) | 4.53 |
| Single Female/Mother | 204 (19.0%) | 3.10 |
| Non-family | 431 (40.2%) | 1.36 |
| Total Households | 1,072 (100.0%) | 2.41 |
Household Size by Marriage Status in Norway
Out of a total of 1,072 households in Norway, 641 (59.8%) are family households, while 431 (40.2%) are nonfamily households. The most numerous type of family households are 2-person households, comprising 381, and the most common type of nonfamily households are 1-person households, comprising 260.
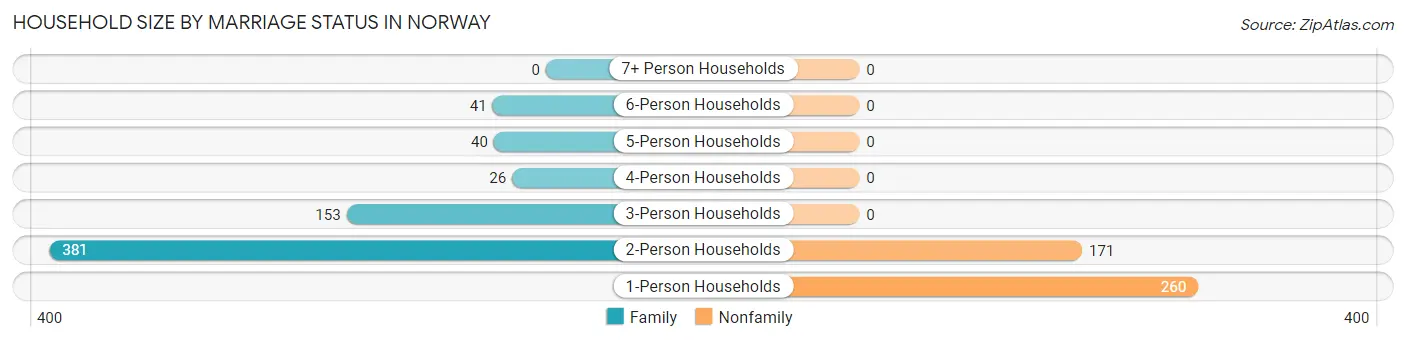
| Household Size | Family Households | Nonfamily Households |
| 1-Person Households | - | 260 (24.2%) |
| 2-Person Households | 381 (35.5%) | 171 (16.0%) |
| 3-Person Households | 153 (14.3%) | 0 (0.0%) |
| 4-Person Households | 26 (2.4%) | 0 (0.0%) |
| 5-Person Households | 40 (3.7%) | 0 (0.0%) |
| 6-Person Households | 41 (3.8%) | 0 (0.0%) |
| 7+ Person Households | 0 (0.0%) | 0 (0.0%) |
| Total | 641 (59.8%) | 431 (40.2%) |
Female Fertility in Norway
Fertility by Age in Norway
| Age Bracket | Women with Births | Births / 1,000 Women |
| 15 to 19 years | 0 (0.0%) | 0.0 |
| 20 to 34 years | 0 (0.0%) | 0.0 |
| 35 to 50 years | 0 (0.0%) | 0.0 |
| Total | 0 (0.0%) | 0.0 |
Fertility by Age by Marriage Status in Norway
| Age Bracket | Married | Unmarried |
| 15 to 19 years | 0 (0.0%) | 0 (0.0%) |
| 20 to 34 years | 0 (0.0%) | 0 (0.0%) |
| 35 to 50 years | 0 (0.0%) | 0 (0.0%) |
| Total | 0 (0.0%) | 0 (0.0%) |
Fertility by Education in Norway
| Educational Attainment | Women with Births | Births / 1,000 Women |
| Less than High School | 0 (0.0%) | 0.0 |
| High School Diploma | 0 (0.0%) | 0.0 |
| College or Associate's Degree | 0 (0.0%) | 0.0 |
| Bachelor's Degree | 0 (0.0%) | 0.0 |
| Graduate Degree | 0 (0.0%) | 0.0 |
| Total | 0 (0.0%) | 0.0 |
Fertility by Education by Marriage Status in Norway
| Educational Attainment | Married | Unmarried |
| Less than High School | 0 (0.0%) | 0 (0.0%) |
| High School Diploma | 0 (0.0%) | 0 (0.0%) |
| College or Associate's Degree | 0 (0.0%) | 0 (0.0%) |
| Bachelor's Degree | 0 (0.0%) | 0 (0.0%) |
| Graduate Degree | 0 (0.0%) | 0 (0.0%) |
| Total | 0 (0.0%) | 0 (0.0%) |
Employment Characteristics in Norway
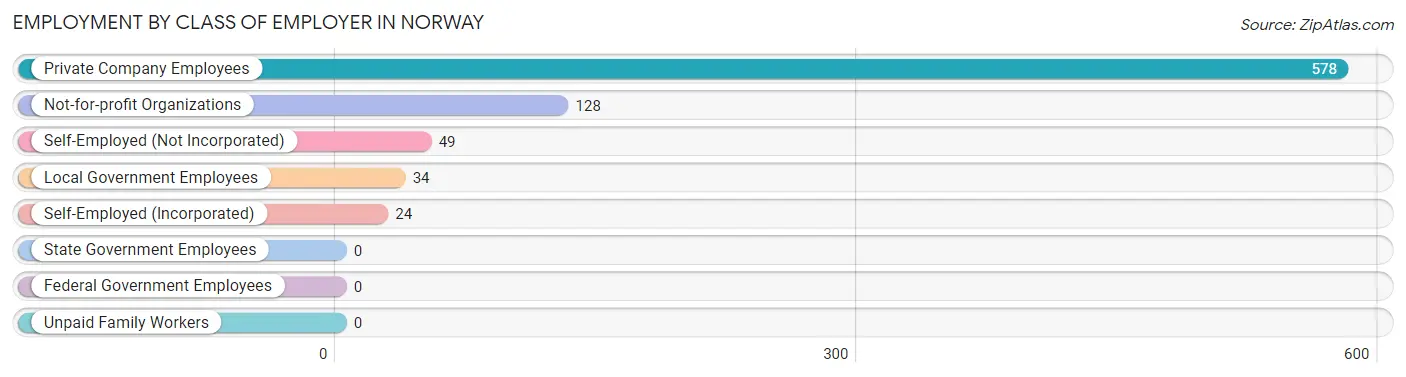
Employment by Class of Employer in Norway
Among the 813 employed individuals in Norway, private company employees (578 | 71.1%), not-for-profit organizations (128 | 15.7%), and self-employed (not incorporated) (49 | 6.0%) make up the most common classes of employment.
| Employer Class | # Employees | % Employees |
| Private Company Employees | 578 | 71.1% |
| Self-Employed (Incorporated) | 24 | 2.9% |
| Self-Employed (Not Incorporated) | 49 | 6.0% |
| Not-for-profit Organizations | 128 | 15.7% |
| Local Government Employees | 34 | 4.2% |
| State Government Employees | 0 | 0.0% |
| Federal Government Employees | 0 | 0.0% |
| Unpaid Family Workers | 0 | 0.0% |
| Total | 813 | 100.0% |
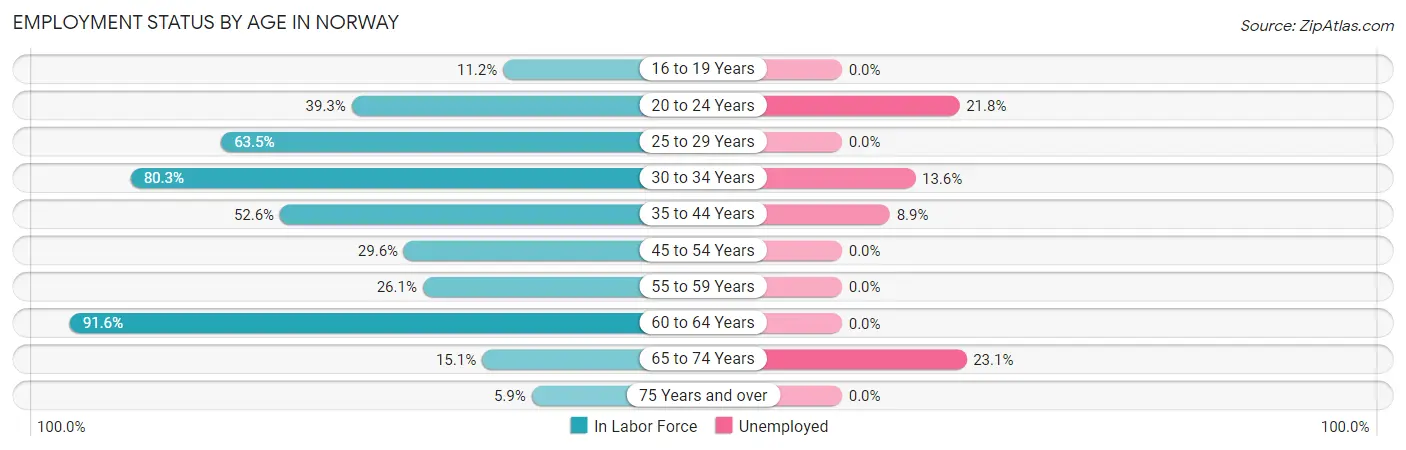
Employment Status by Age in Norway
According to the labor force statistics for Norway, out of the total population over 16 years of age (2,332), 37.7% or 879 individuals are in the labor force, with 7.5% or 66 of them unemployed. The age group with the highest labor force participation rate is 60 to 64 years, with 91.6% or 142 individuals in the labor force. Within the labor force, the 65 to 74 years age range has the highest percentage of unemployed individuals, with 23.1% or 15 of them being unemployed.
| Age Bracket | In Labor Force | Unemployed |
| 16 to 19 Years | 15 (11.2%) | 0 (0.0%) |
| 20 to 24 Years | 55 (39.3%) | 12 (21.8%) |
| 25 to 29 Years | 101 (63.5%) | 0 (0.0%) |
| 30 to 34 Years | 228 (80.3%) | 31 (13.6%) |
| 35 to 44 Years | 90 (52.6%) | 8 (8.9%) |
| 45 to 54 Years | 112 (29.6%) | 0 (0.0%) |
| 55 to 59 Years | 55 (26.1%) | 0 (0.0%) |
| 60 to 64 Years | 142 (91.6%) | 0 (0.0%) |
| 65 to 74 Years | 65 (15.1%) | 15 (23.1%) |
| 75 Years and over | 16 (5.9%) | 0 (0.0%) |
| Total | 879 (37.7%) | 66 (7.5%) |
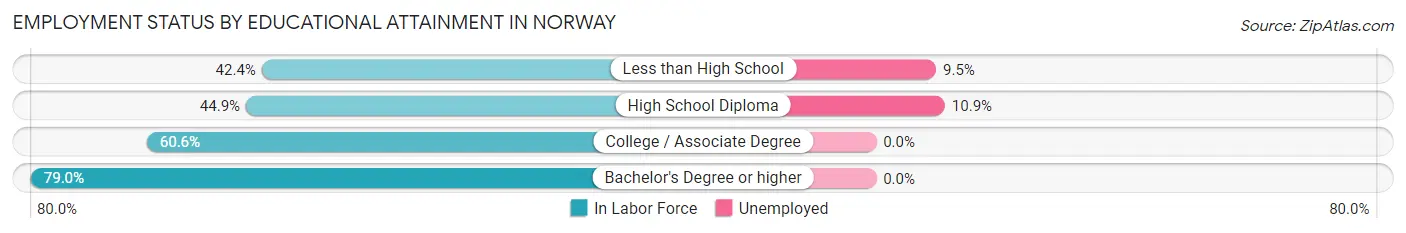
Employment Status by Educational Attainment in Norway
According to labor force statistics for Norway, 53.6% of individuals (728) out of the total population between 25 and 64 years of age (1,359) are in the labor force, with 5.4% or 39 of them being unemployed. The group with the highest labor force participation rate are those with the educational attainment of bachelor's degree or higher, with 79.0% or 173 individuals in the labor force. Within the labor force, individuals with high school diploma education have the highest percentage of unemployment, with 10.9% or 31 of them being unemployed.
| Educational Attainment | In Labor Force | Unemployed |
| Less than High School | 84 (42.4%) | 19 (9.5%) |
| High School Diploma | 285 (44.9%) | 69 (10.9%) |
| College / Associate Degree | 186 (60.6%) | 0 (0.0%) |
| Bachelor's Degree or higher | 173 (79.0%) | 0 (0.0%) |
| Total | 728 (53.6%) | 73 (5.4%) |
Employment Occupations by Sex in Norway
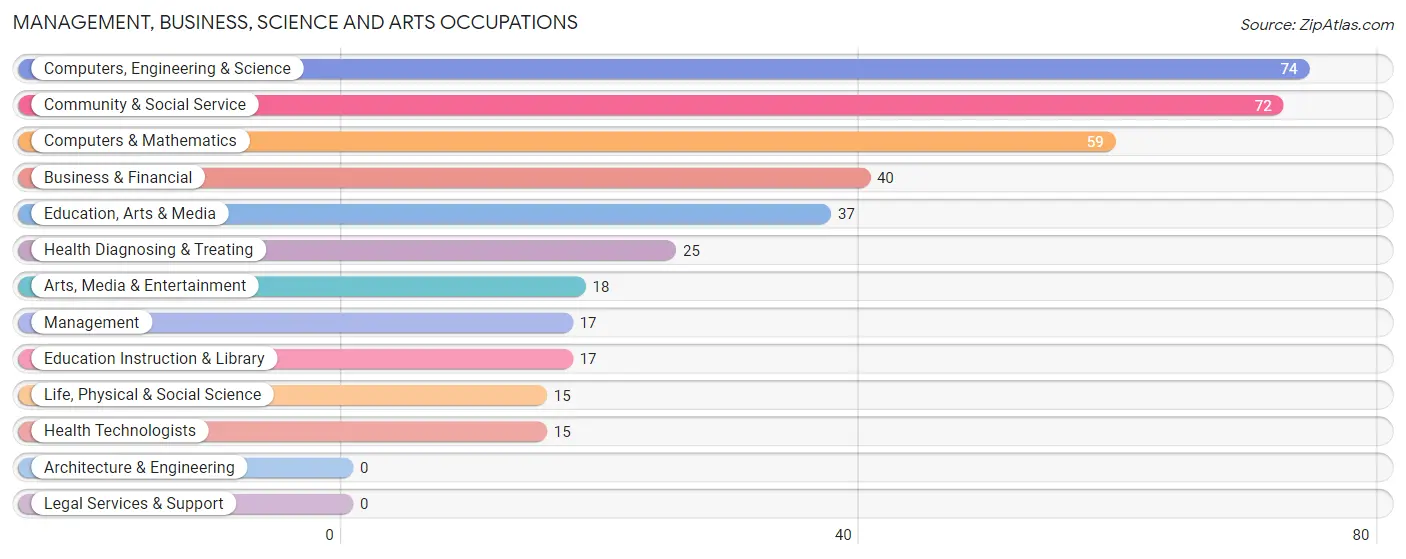
Management, Business, Science and Arts Occupations
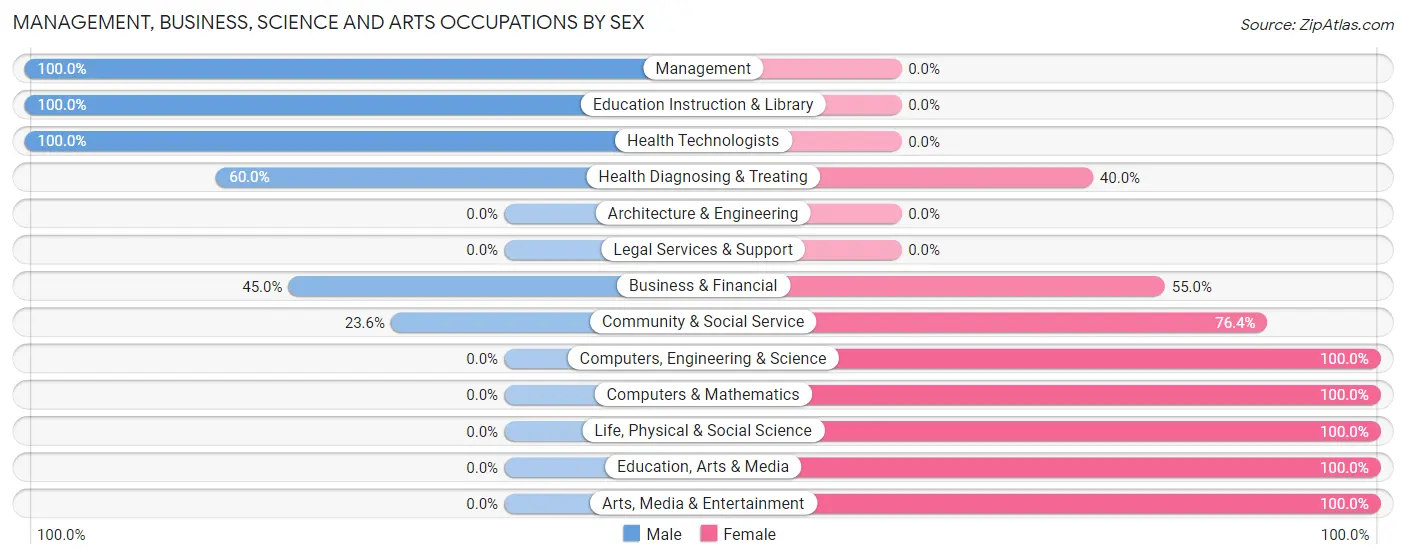
The most common Management, Business, Science and Arts occupations in Norway are Computers, Engineering & Science (74 | 9.1%), Community & Social Service (72 | 8.9%), Computers & Mathematics (59 | 7.3%), Business & Financial (40 | 4.9%), and Education, Arts & Media (37 | 4.5%).
Management, Business, Science and Arts Occupations by Sex
Within the Management, Business, Science and Arts occupations in Norway, the most male-oriented occupations are Management (100.0%), Education Instruction & Library (100.0%), and Health Technologists (100.0%), while the most female-oriented occupations are Computers, Engineering & Science (100.0%), Computers & Mathematics (100.0%), and Life, Physical & Social Science (100.0%).
| Occupation | Male | Female |
| Management | 17 (100.0%) | 0 (0.0%) |
| Business & Financial | 18 (45.0%) | 22 (55.0%) |
| Computers, Engineering & Science | 0 (0.0%) | 74 (100.0%) |
| Computers & Mathematics | 0 (0.0%) | 59 (100.0%) |
| Architecture & Engineering | 0 (0.0%) | 0 (0.0%) |
| Life, Physical & Social Science | 0 (0.0%) | 15 (100.0%) |
| Community & Social Service | 17 (23.6%) | 55 (76.4%) |
| Education, Arts & Media | 0 (0.0%) | 37 (100.0%) |
| Legal Services & Support | 0 (0.0%) | 0 (0.0%) |
| Education Instruction & Library | 17 (100.0%) | 0 (0.0%) |
| Arts, Media & Entertainment | 0 (0.0%) | 18 (100.0%) |
| Health Diagnosing & Treating | 15 (60.0%) | 10 (40.0%) |
| Health Technologists | 15 (100.0%) | 0 (0.0%) |
| Total (Category) | 67 (29.4%) | 161 (70.6%) |
| Total (Overall) | 267 (32.8%) | 546 (67.2%) |
Services Occupations
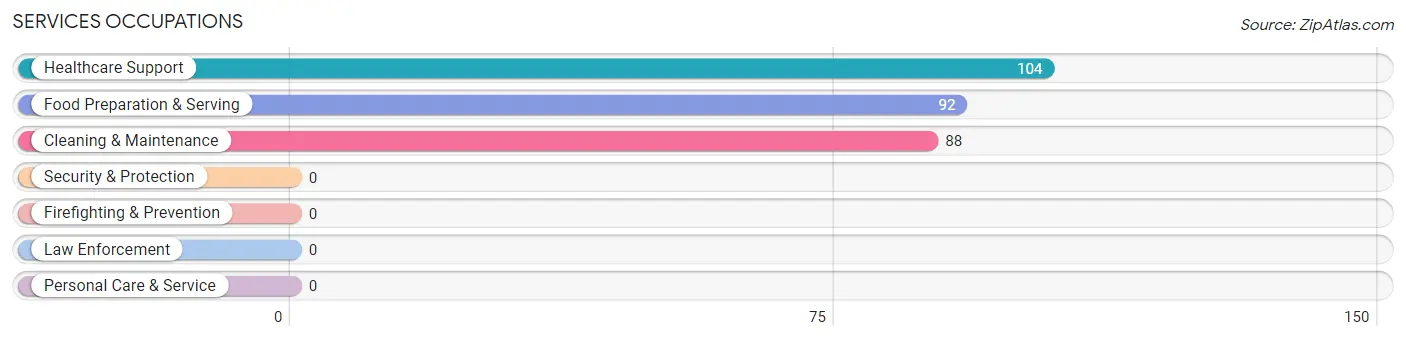
The most common Services occupations in Norway are Healthcare Support (104 | 12.8%), Food Preparation & Serving (92 | 11.3%), and Cleaning & Maintenance (88 | 10.8%).
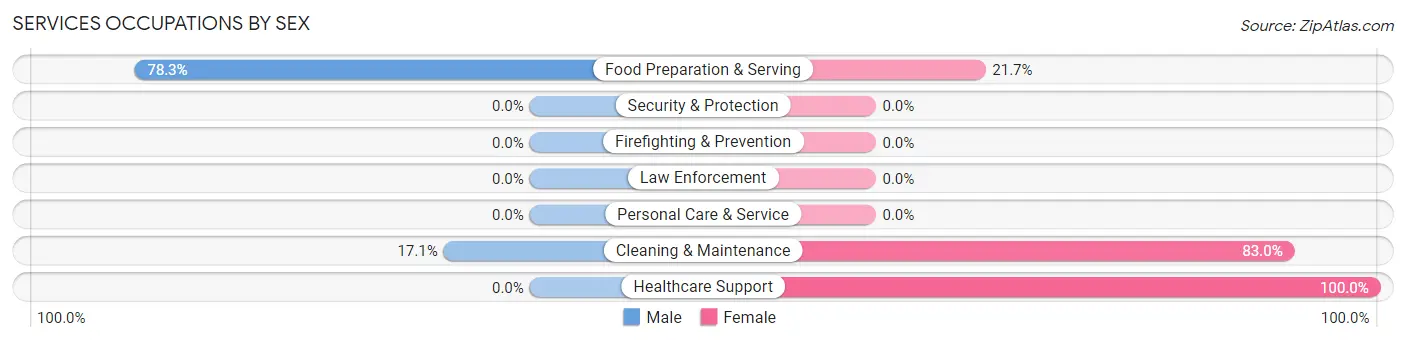
Services Occupations by Sex
Within the Services occupations in Norway, the most male-oriented occupations are Food Preparation & Serving (78.3%), and Cleaning & Maintenance (17.1%), while the most female-oriented occupations are Healthcare Support (100.0%), Cleaning & Maintenance (83.0%), and Food Preparation & Serving (21.7%).
| Occupation | Male | Female |
| Healthcare Support | 0 (0.0%) | 104 (100.0%) |
| Security & Protection | 0 (0.0%) | 0 (0.0%) |
| Firefighting & Prevention | 0 (0.0%) | 0 (0.0%) |
| Law Enforcement | 0 (0.0%) | 0 (0.0%) |
| Food Preparation & Serving | 72 (78.3%) | 20 (21.7%) |
| Cleaning & Maintenance | 15 (17.1%) | 73 (83.0%) |
| Personal Care & Service | 0 (0.0%) | 0 (0.0%) |
| Total (Category) | 87 (30.6%) | 197 (69.4%) |
| Total (Overall) | 267 (32.8%) | 546 (67.2%) |
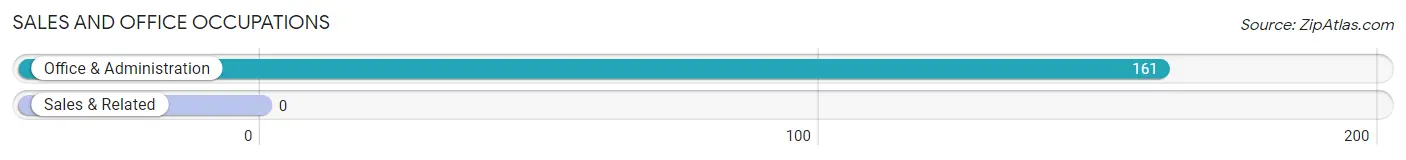
Sales and Office Occupations
The most common Sales and Office occupations in Norway are , and Office & Administration (161 | 19.8%).
Sales and Office Occupations by Sex
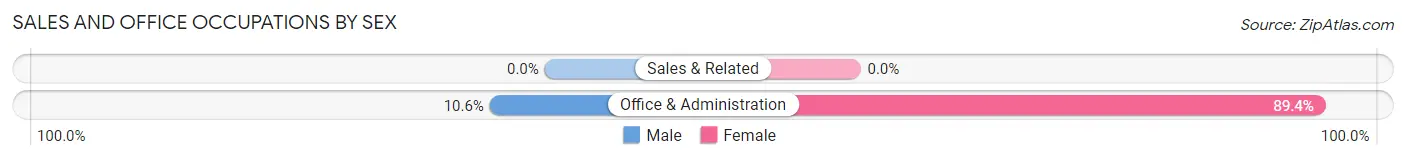
| Occupation | Male | Female |
| Sales & Related | 0 (0.0%) | 0 (0.0%) |
| Office & Administration | 17 (10.6%) | 144 (89.4%) |
| Total (Category) | 17 (10.6%) | 144 (89.4%) |
| Total (Overall) | 267 (32.8%) | 546 (67.2%) |
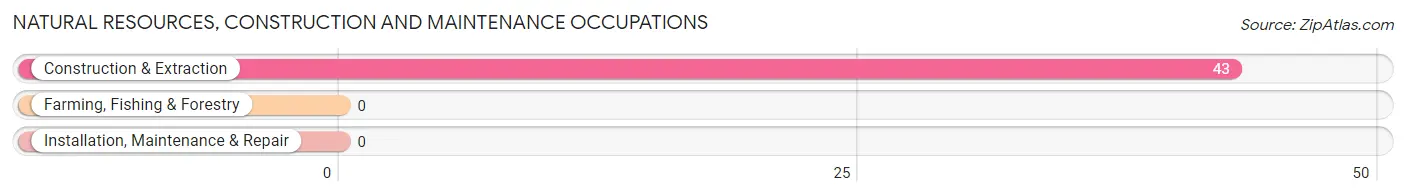
Natural Resources, Construction and Maintenance Occupations
The most common Natural Resources, Construction and Maintenance occupations in Norway are , and Construction & Extraction (43 | 5.3%).
Natural Resources, Construction and Maintenance Occupations by Sex
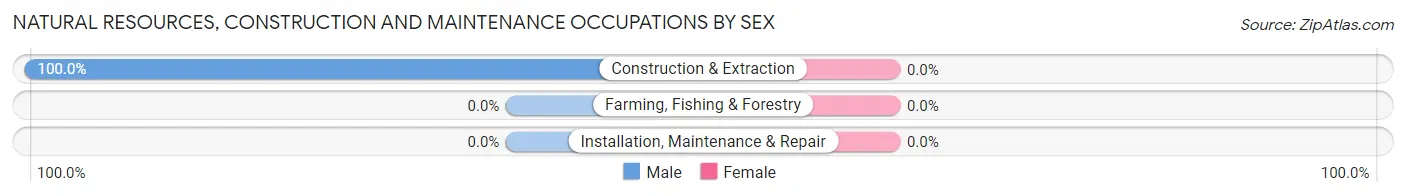
| Occupation | Male | Female |
| Farming, Fishing & Forestry | 0 (0.0%) | 0 (0.0%) |
| Construction & Extraction | 43 (100.0%) | 0 (0.0%) |
| Installation, Maintenance & Repair | 0 (0.0%) | 0 (0.0%) |
| Total (Category) | 43 (100.0%) | 0 (0.0%) |
| Total (Overall) | 267 (32.8%) | 546 (67.2%) |
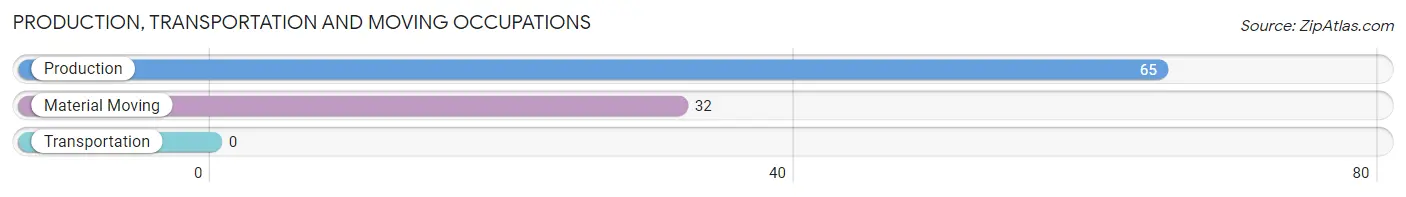
Production, Transportation and Moving Occupations
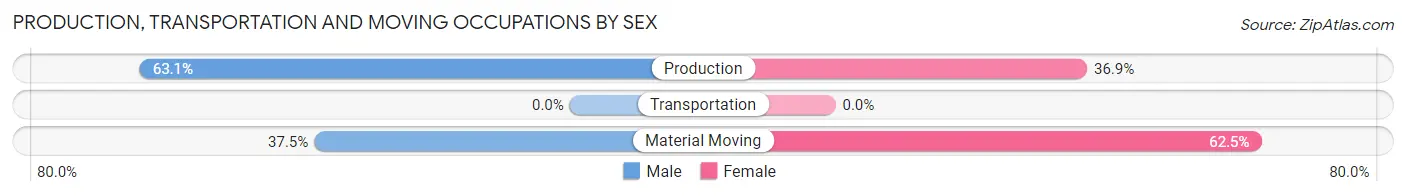
The most common Production, Transportation and Moving occupations in Norway are Production (65 | 8.0%), and Material Moving (32 | 3.9%).
Production, Transportation and Moving Occupations by Sex
| Occupation | Male | Female |
| Production | 41 (63.1%) | 24 (36.9%) |
| Transportation | 0 (0.0%) | 0 (0.0%) |
| Material Moving | 12 (37.5%) | 20 (62.5%) |
| Total (Category) | 53 (54.6%) | 44 (45.4%) |
| Total (Overall) | 267 (32.8%) | 546 (67.2%) |
Employment Industries by Sex in Norway
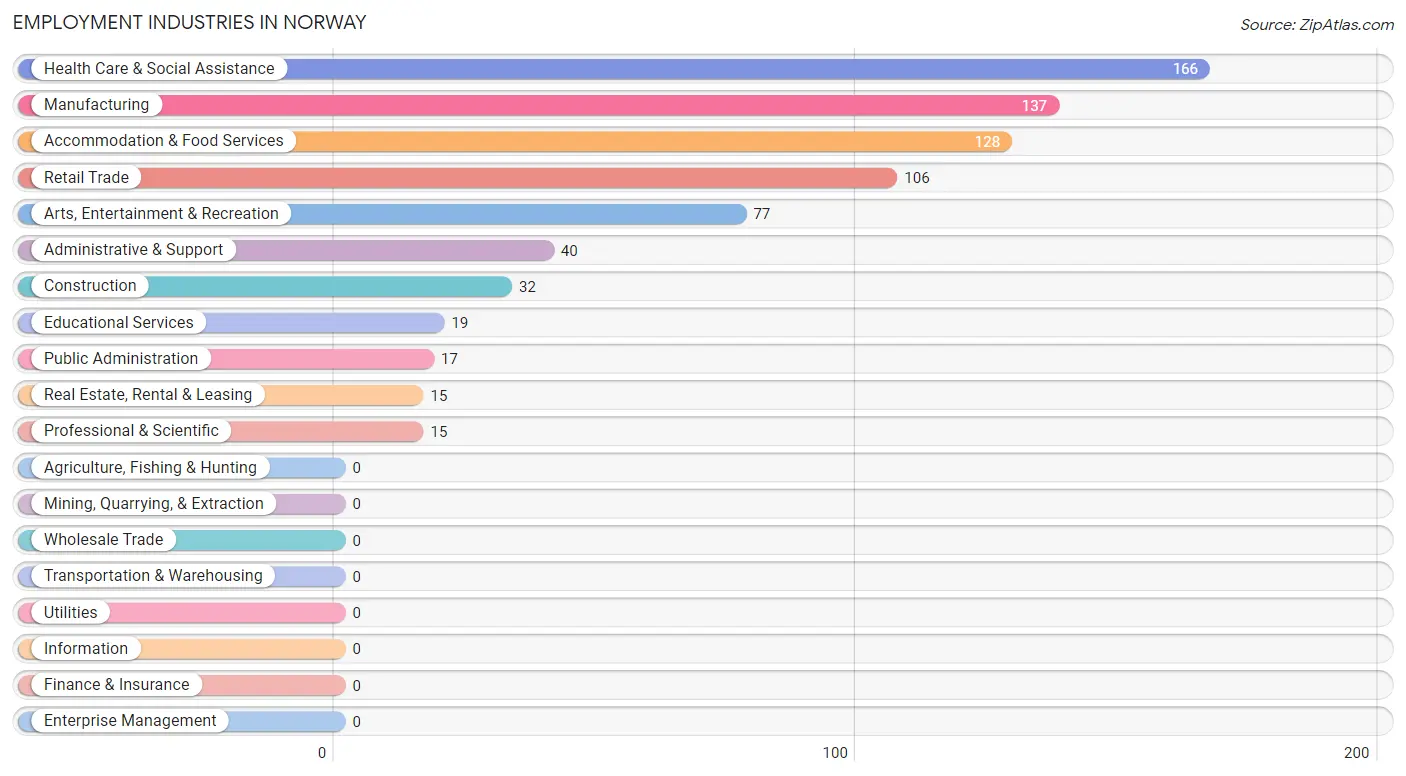
Employment Industries in Norway
The major employment industries in Norway include Health Care & Social Assistance (166 | 20.4%), Manufacturing (137 | 16.9%), Accommodation & Food Services (128 | 15.7%), Retail Trade (106 | 13.0%), and Arts, Entertainment & Recreation (77 | 9.5%).
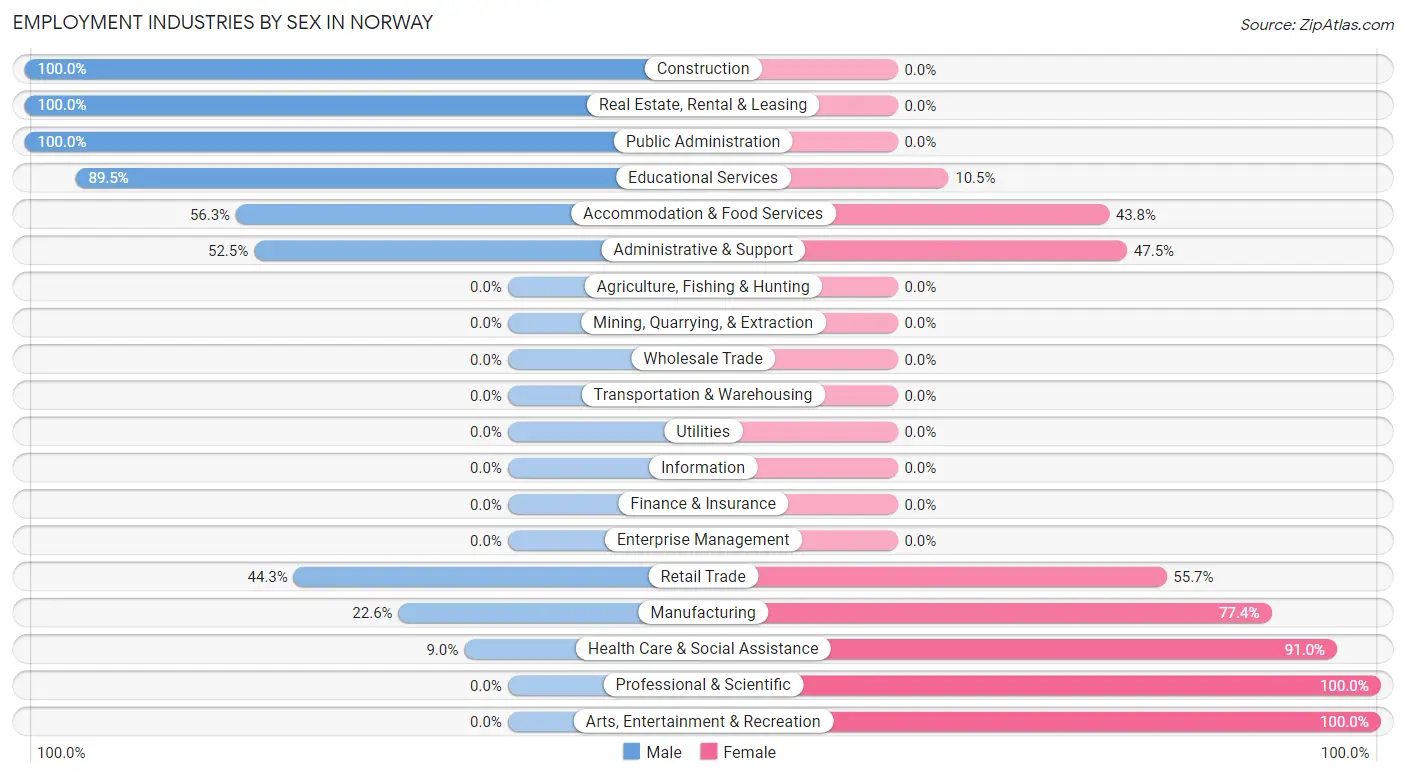
Employment Industries by Sex in Norway
The Norway industries that see more men than women are Construction (100.0%), Real Estate, Rental & Leasing (100.0%), and Public Administration (100.0%), whereas the industries that tend to have a higher number of women are Professional & Scientific (100.0%), Arts, Entertainment & Recreation (100.0%), and Health Care & Social Assistance (91.0%).
| Industry | Male | Female |
| Agriculture, Fishing & Hunting | 0 (0.0%) | 0 (0.0%) |
| Mining, Quarrying, & Extraction | 0 (0.0%) | 0 (0.0%) |
| Construction | 32 (100.0%) | 0 (0.0%) |
| Manufacturing | 31 (22.6%) | 106 (77.4%) |
| Wholesale Trade | 0 (0.0%) | 0 (0.0%) |
| Retail Trade | 47 (44.3%) | 59 (55.7%) |
| Transportation & Warehousing | 0 (0.0%) | 0 (0.0%) |
| Utilities | 0 (0.0%) | 0 (0.0%) |
| Information | 0 (0.0%) | 0 (0.0%) |
| Finance & Insurance | 0 (0.0%) | 0 (0.0%) |
| Real Estate, Rental & Leasing | 15 (100.0%) | 0 (0.0%) |
| Professional & Scientific | 0 (0.0%) | 15 (100.0%) |
| Enterprise Management | 0 (0.0%) | 0 (0.0%) |
| Administrative & Support | 21 (52.5%) | 19 (47.5%) |
| Educational Services | 17 (89.5%) | 2 (10.5%) |
| Health Care & Social Assistance | 15 (9.0%) | 151 (91.0%) |
| Arts, Entertainment & Recreation | 0 (0.0%) | 77 (100.0%) |
| Accommodation & Food Services | 72 (56.2%) | 56 (43.8%) |
| Public Administration | 17 (100.0%) | 0 (0.0%) |
| Total | 267 (32.8%) | 546 (67.2%) |
Education in Norway
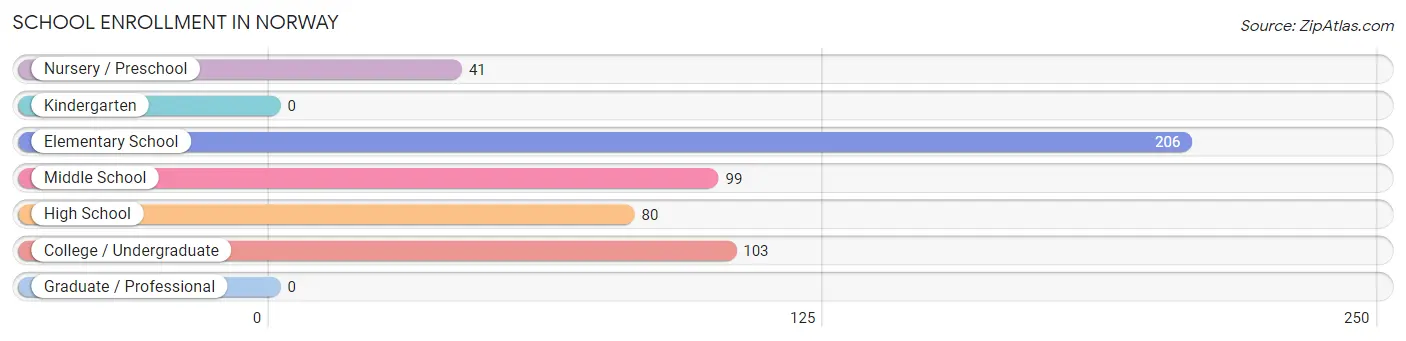
School Enrollment in Norway
The most common levels of schooling among the 529 students in Norway are elementary school (206 | 38.9%), college / undergraduate (103 | 19.5%), and middle school (99 | 18.7%).
| School Level | # Students | % Students |
| Nursery / Preschool | 41 | 7.7% |
| Kindergarten | 0 | 0.0% |
| Elementary School | 206 | 38.9% |
| Middle School | 99 | 18.7% |
| High School | 80 | 15.1% |
| College / Undergraduate | 103 | 19.5% |
| Graduate / Professional | 0 | 0.0% |
| Total | 529 | 100.0% |
School Enrollment by Age by Funding Source in Norway
Out of a total of 529 students who are enrolled in schools in Norway, 40 (7.6%) attend a private institution, while the remaining 489 (92.4%) are enrolled in public schools. The age group of 35 years and over has the highest likelihood of being enrolled in private schools, with 18 (100.0% in the age bracket) enrolled. Conversely, the age group of 3 to 4 year olds has the lowest likelihood of being enrolled in a private school, with 41 (100.0% in the age bracket) attending a public institution.
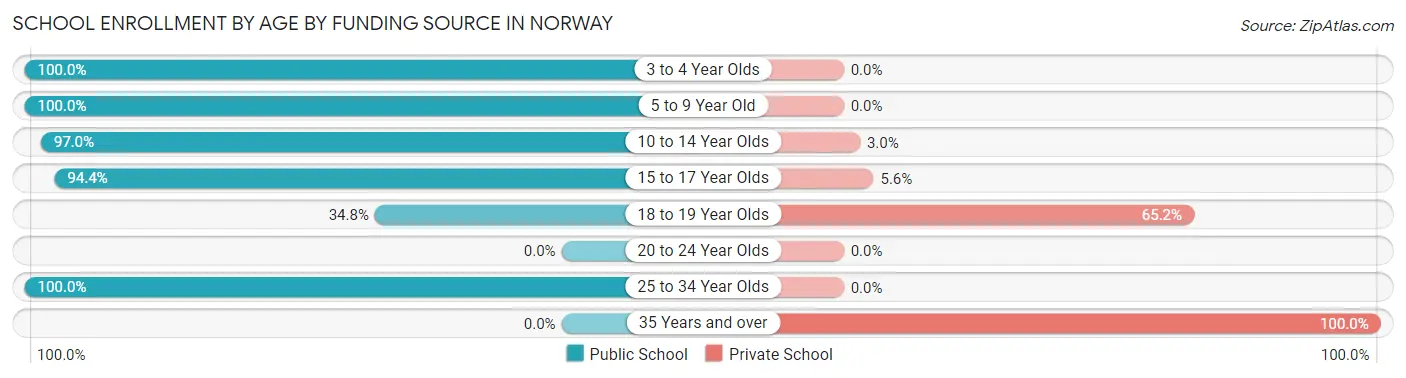
| Age Bracket | Public School | Private School |
| 3 to 4 Year Olds | 41 (100.0%) | 0 (0.0%) |
| 5 to 9 Year Old | 206 (100.0%) | 0 (0.0%) |
| 10 to 14 Year Olds | 96 (97.0%) | 3 (3.0%) |
| 15 to 17 Year Olds | 68 (94.4%) | 4 (5.6%) |
| 18 to 19 Year Olds | 8 (34.8%) | 15 (65.2%) |
| 20 to 24 Year Olds | 0 (0.0%) | 0 (0.0%) |
| 25 to 34 Year Olds | 70 (100.0%) | 0 (0.0%) |
| 35 Years and over | 0 (0.0%) | 18 (100.0%) |
| Total | 489 (92.4%) | 40 (7.6%) |
Educational Attainment by Field of Study in Norway
Business (105 | 25.2%), science & technology (73 | 17.5%), literature & languages (66 | 15.8%), liberal arts & history (65 | 15.6%), and social sciences (49 | 11.7%) are the most common fields of study among 417 individuals in Norway who have obtained a bachelor's degree or higher.
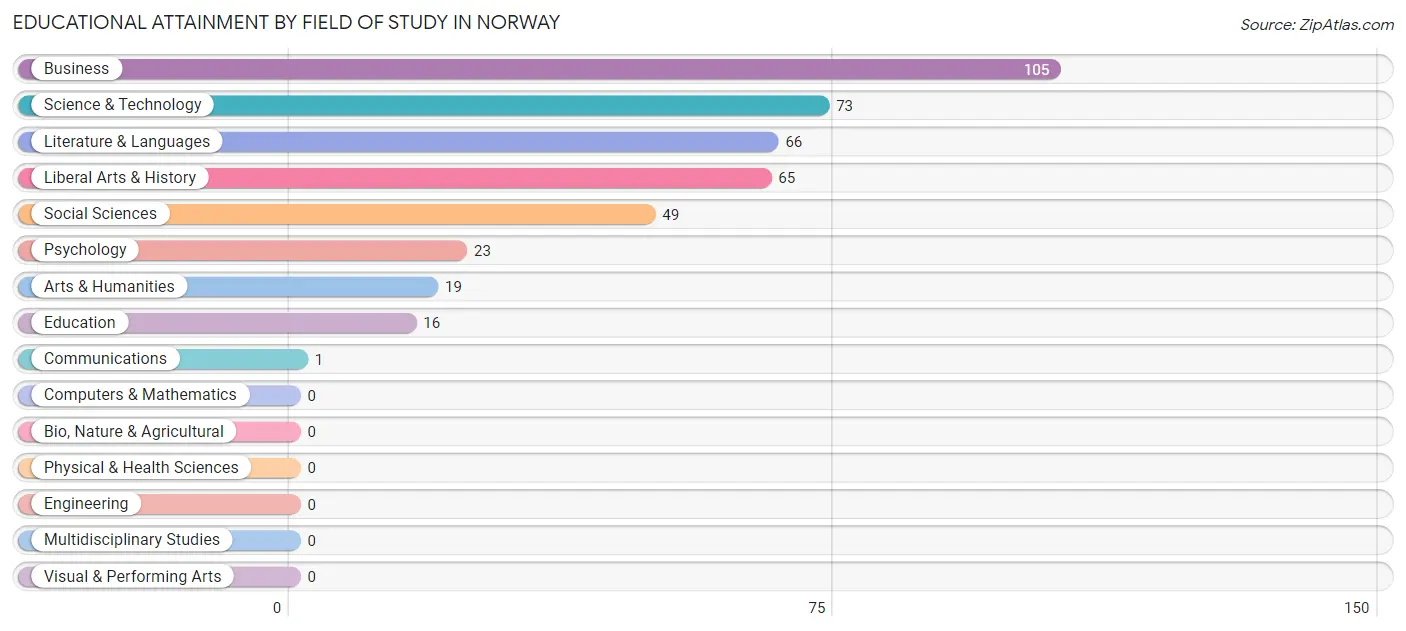
| Field of Study | # Graduates | % Graduates |
| Computers & Mathematics | 0 | 0.0% |
| Bio, Nature & Agricultural | 0 | 0.0% |
| Physical & Health Sciences | 0 | 0.0% |
| Psychology | 23 | 5.5% |
| Social Sciences | 49 | 11.7% |
| Engineering | 0 | 0.0% |
| Multidisciplinary Studies | 0 | 0.0% |
| Science & Technology | 73 | 17.5% |
| Business | 105 | 25.2% |
| Education | 16 | 3.8% |
| Literature & Languages | 66 | 15.8% |
| Liberal Arts & History | 65 | 15.6% |
| Visual & Performing Arts | 0 | 0.0% |
| Communications | 1 | 0.2% |
| Arts & Humanities | 19 | 4.6% |
| Total | 417 | 100.0% |
Transportation & Commute in Norway
Vehicle Availability by Sex in Norway
The most prevalent vehicle ownership categories in Norway are males with 2 vehicles (172, accounting for 66.9%) and females with 2 vehicles (235, making up 31.5%).
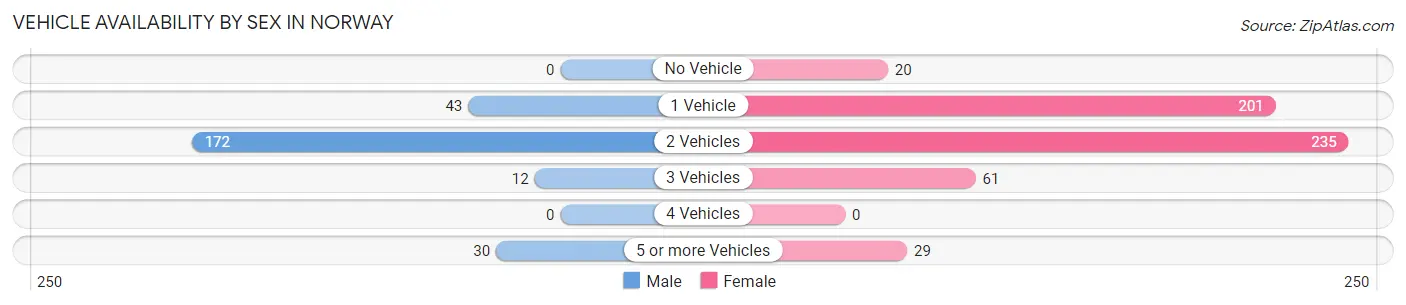
| Vehicles Available | Male | Female |
| No Vehicle | 0 (0.0%) | 20 (3.7%) |
| 1 Vehicle | 43 (16.7%) | 201 (36.8%) |
| 2 Vehicles | 172 (66.9%) | 235 (43.0%) |
| 3 Vehicles | 12 (4.7%) | 61 (11.2%) |
| 4 Vehicles | 0 (0.0%) | 0 (0.0%) |
| 5 or more Vehicles | 30 (11.7%) | 29 (5.3%) |
| Total | 257 (100.0%) | 546 (100.0%) |
Commute Time in Norway
The most frequently occuring commute durations in Norway are 40 to 44 minutes (150 commuters, 21.0%), 60 to 89 minutes (118 commuters, 16.5%), and 15 to 19 minutes (102 commuters, 14.3%).
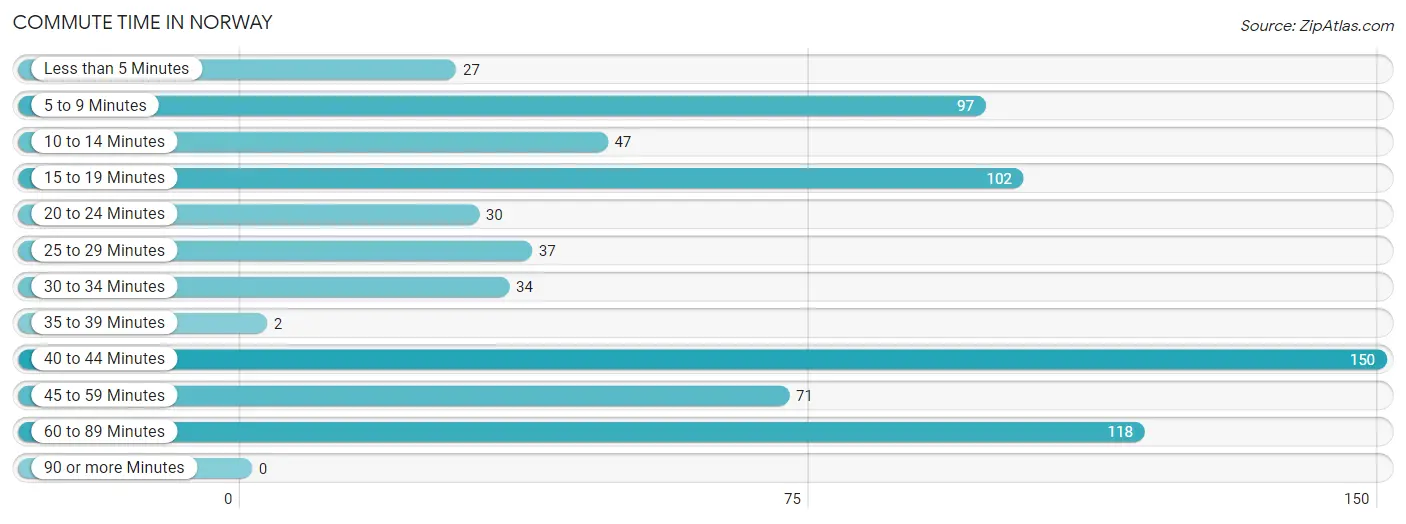
| Commute Time | # Commuters | % Commuters |
| Less than 5 Minutes | 27 | 3.8% |
| 5 to 9 Minutes | 97 | 13.6% |
| 10 to 14 Minutes | 47 | 6.6% |
| 15 to 19 Minutes | 102 | 14.3% |
| 20 to 24 Minutes | 30 | 4.2% |
| 25 to 29 Minutes | 37 | 5.2% |
| 30 to 34 Minutes | 34 | 4.8% |
| 35 to 39 Minutes | 2 | 0.3% |
| 40 to 44 Minutes | 150 | 21.0% |
| 45 to 59 Minutes | 71 | 9.9% |
| 60 to 89 Minutes | 118 | 16.5% |
| 90 or more Minutes | 0 | 0.0% |
Commute Time by Sex in Norway
The most common commute times in Norway are 60 to 89 minutes (88 commuters, 33.0%) for males and 40 to 44 minutes (139 commuters, 31.0%) for females.
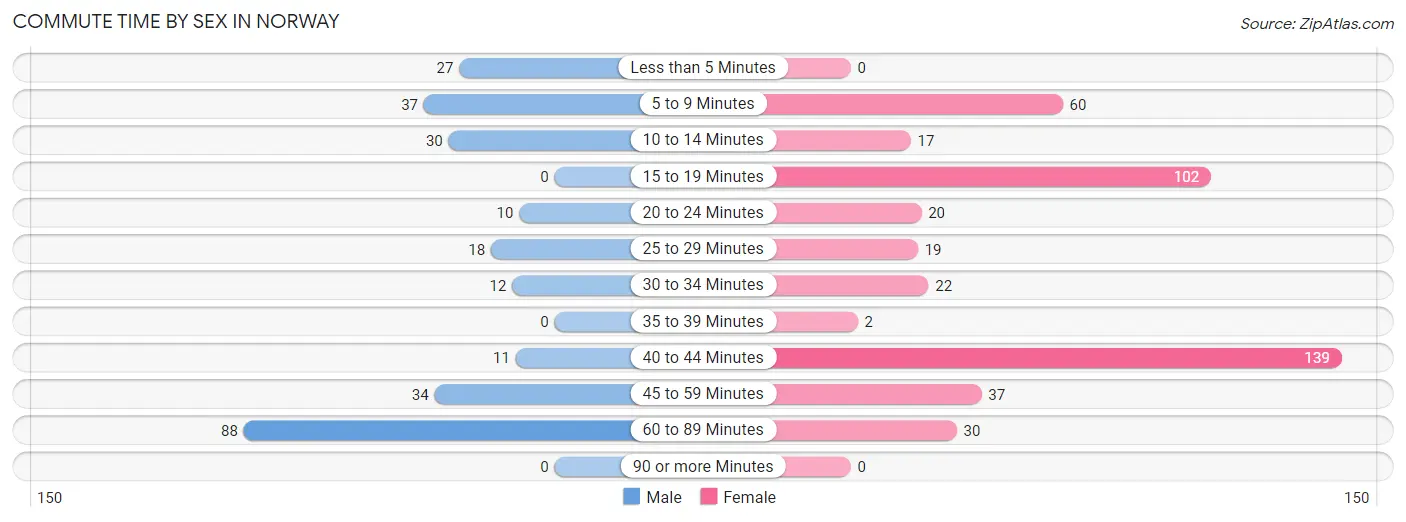
| Commute Time | Male | Female |
| Less than 5 Minutes | 27 (10.1%) | 0 (0.0%) |
| 5 to 9 Minutes | 37 (13.9%) | 60 (13.4%) |
| 10 to 14 Minutes | 30 (11.2%) | 17 (3.8%) |
| 15 to 19 Minutes | 0 (0.0%) | 102 (22.8%) |
| 20 to 24 Minutes | 10 (3.7%) | 20 (4.5%) |
| 25 to 29 Minutes | 18 (6.7%) | 19 (4.2%) |
| 30 to 34 Minutes | 12 (4.5%) | 22 (4.9%) |
| 35 to 39 Minutes | 0 (0.0%) | 2 (0.4%) |
| 40 to 44 Minutes | 11 (4.1%) | 139 (31.0%) |
| 45 to 59 Minutes | 34 (12.7%) | 37 (8.3%) |
| 60 to 89 Minutes | 88 (33.0%) | 30 (6.7%) |
| 90 or more Minutes | 0 (0.0%) | 0 (0.0%) |
Time of Departure to Work by Sex in Norway
The most frequent times of departure to work in Norway are 7:30 AM to 7:59 AM (61, 22.9%) for males and 4:00 PM to 11:59 PM (77, 17.2%) for females.
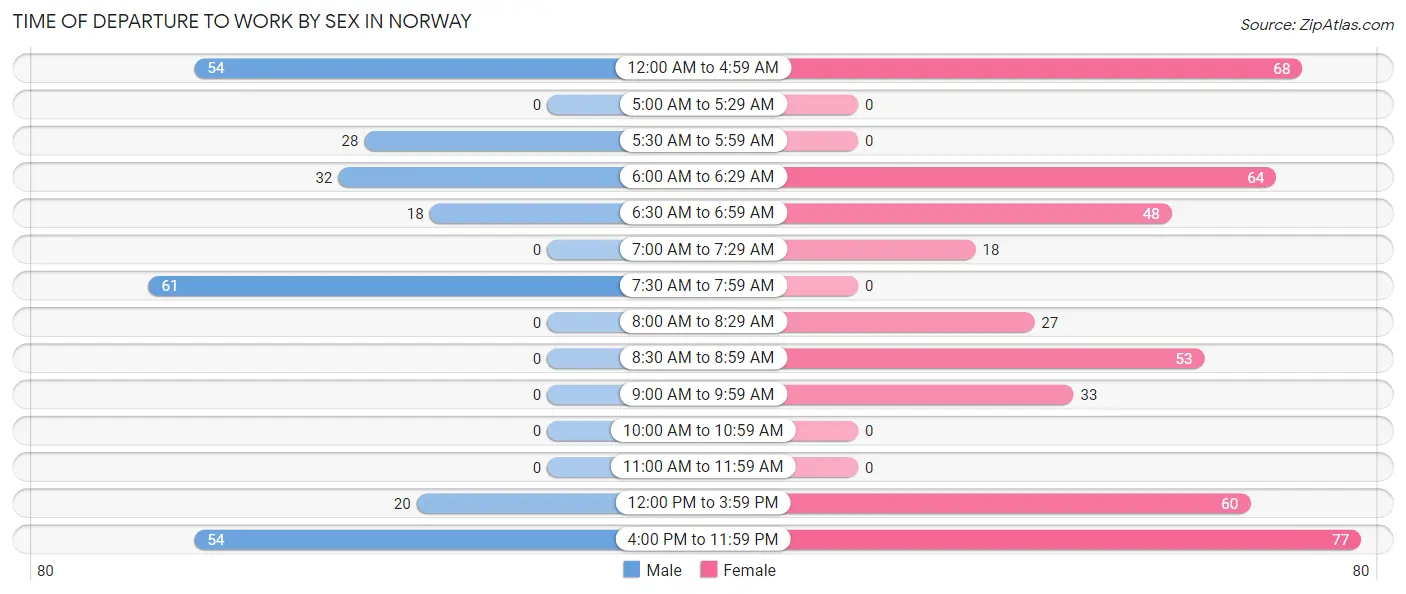
| Time of Departure | Male | Female |
| 12:00 AM to 4:59 AM | 54 (20.2%) | 68 (15.2%) |
| 5:00 AM to 5:29 AM | 0 (0.0%) | 0 (0.0%) |
| 5:30 AM to 5:59 AM | 28 (10.5%) | 0 (0.0%) |
| 6:00 AM to 6:29 AM | 32 (12.0%) | 64 (14.3%) |
| 6:30 AM to 6:59 AM | 18 (6.7%) | 48 (10.7%) |
| 7:00 AM to 7:29 AM | 0 (0.0%) | 18 (4.0%) |
| 7:30 AM to 7:59 AM | 61 (22.9%) | 0 (0.0%) |
| 8:00 AM to 8:29 AM | 0 (0.0%) | 27 (6.0%) |
| 8:30 AM to 8:59 AM | 0 (0.0%) | 53 (11.8%) |
| 9:00 AM to 9:59 AM | 0 (0.0%) | 33 (7.4%) |
| 10:00 AM to 10:59 AM | 0 (0.0%) | 0 (0.0%) |
| 11:00 AM to 11:59 AM | 0 (0.0%) | 0 (0.0%) |
| 12:00 PM to 3:59 PM | 20 (7.5%) | 60 (13.4%) |
| 4:00 PM to 11:59 PM | 54 (20.2%) | 77 (17.2%) |
| Total | 267 (100.0%) | 448 (100.0%) |
Housing Occupancy in Norway
Occupancy by Ownership in Norway
Of the total 1,072 dwellings in Norway, owner-occupied units account for 567 (52.9%), while renter-occupied units make up 505 (47.1%).
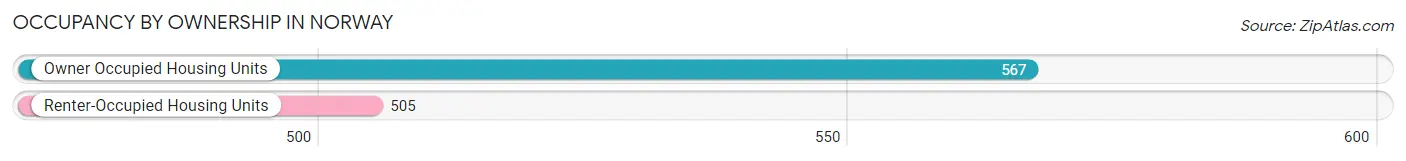
| Occupancy | # Housing Units | % Housing Units |
| Owner Occupied Housing Units | 567 | 52.9% |
| Renter-Occupied Housing Units | 505 | 47.1% |
| Total Occupied Housing Units | 1,072 | 100.0% |
Occupancy by Household Size in Norway
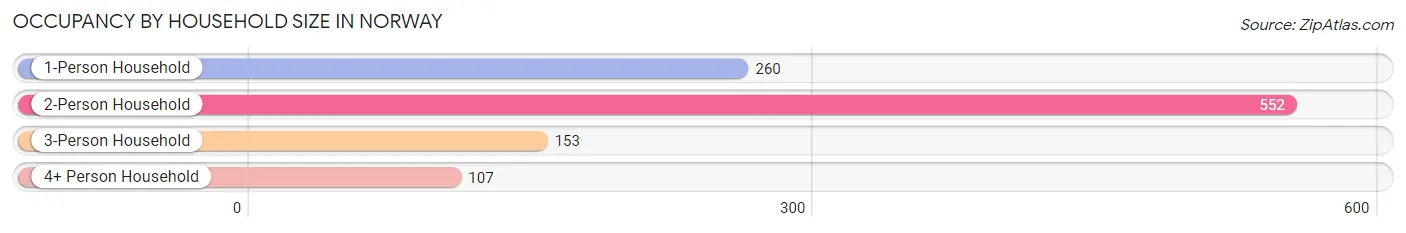
| Household Size | # Housing Units | % Housing Units |
| 1-Person Household | 260 | 24.2% |
| 2-Person Household | 552 | 51.5% |
| 3-Person Household | 153 | 14.3% |
| 4+ Person Household | 107 | 10.0% |
| Total Housing Units | 1,072 | 100.0% |
Occupancy by Ownership by Household Size in Norway
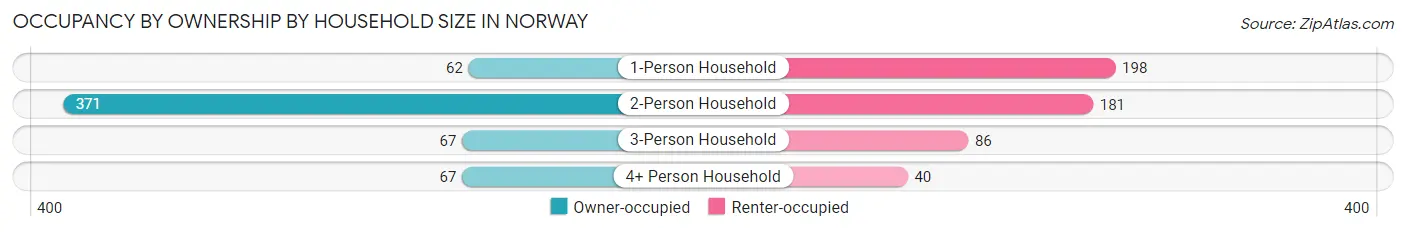
| Household Size | Owner-occupied | Renter-occupied |
| 1-Person Household | 62 (23.8%) | 198 (76.1%) |
| 2-Person Household | 371 (67.2%) | 181 (32.8%) |
| 3-Person Household | 67 (43.8%) | 86 (56.2%) |
| 4+ Person Household | 67 (62.6%) | 40 (37.4%) |
| Total Housing Units | 567 (52.9%) | 505 (47.1%) |
Occupancy by Educational Attainment in Norway
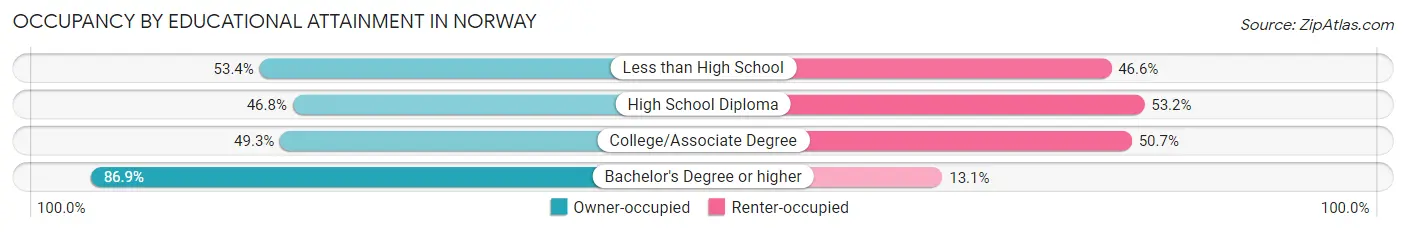
| Household Size | Owner-occupied | Renter-occupied |
| Less than High School | 55 (53.4%) | 48 (46.6%) |
| High School Diploma | 222 (46.8%) | 252 (53.2%) |
| College/Associate Degree | 184 (49.3%) | 189 (50.7%) |
| Bachelor's Degree or higher | 106 (86.9%) | 16 (13.1%) |
Occupancy by Age of Householder in Norway
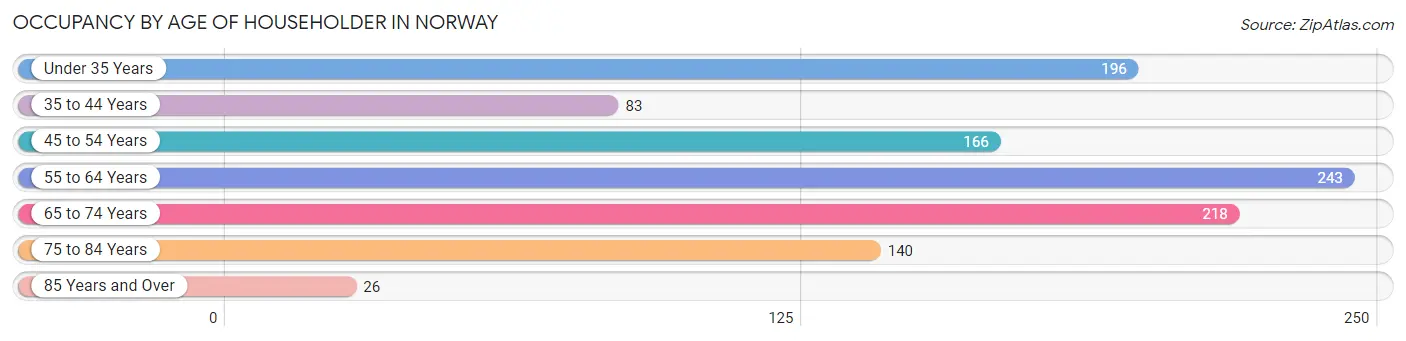
| Age Bracket | # Households | % Households |
| Under 35 Years | 196 | 18.3% |
| 35 to 44 Years | 83 | 7.7% |
| 45 to 54 Years | 166 | 15.5% |
| 55 to 64 Years | 243 | 22.7% |
| 65 to 74 Years | 218 | 20.3% |
| 75 to 84 Years | 140 | 13.1% |
| 85 Years and Over | 26 | 2.4% |
| Total | 1,072 | 100.0% |
Housing Finances in Norway
Median Income by Occupancy in Norway
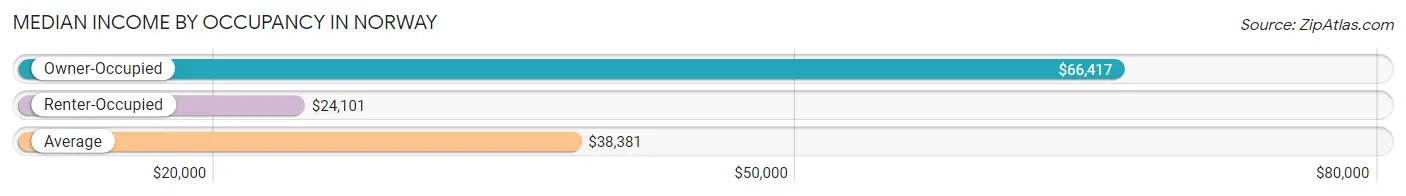
| Occupancy Type | # Households | Median Income |
| Owner-Occupied | 567 (52.9%) | $66,417 |
| Renter-Occupied | 505 (47.1%) | $24,101 |
| Average | 1,072 (100.0%) | $38,381 |
Occupancy by Householder Income Bracket in Norway
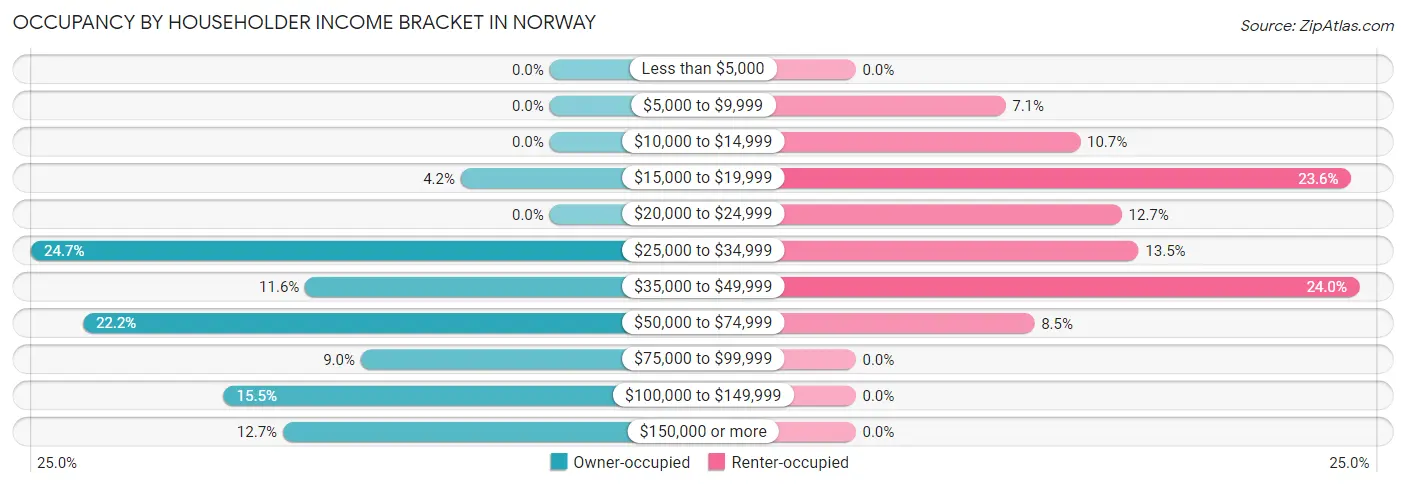
| Income Bracket | Owner-occupied | Renter-occupied |
| Less than $5,000 | 0 (0.0%) | 0 (0.0%) |
| $5,000 to $9,999 | 0 (0.0%) | 36 (7.1%) |
| $10,000 to $14,999 | 0 (0.0%) | 54 (10.7%) |
| $15,000 to $19,999 | 24 (4.2%) | 119 (23.6%) |
| $20,000 to $24,999 | 0 (0.0%) | 64 (12.7%) |
| $25,000 to $34,999 | 140 (24.7%) | 68 (13.5%) |
| $35,000 to $49,999 | 66 (11.6%) | 121 (24.0%) |
| $50,000 to $74,999 | 126 (22.2%) | 43 (8.5%) |
| $75,000 to $99,999 | 51 (9.0%) | 0 (0.0%) |
| $100,000 to $149,999 | 88 (15.5%) | 0 (0.0%) |
| $150,000 or more | 72 (12.7%) | 0 (0.0%) |
| Total | 567 (100.0%) | 505 (100.0%) |
Monthly Housing Cost Tiers in Norway
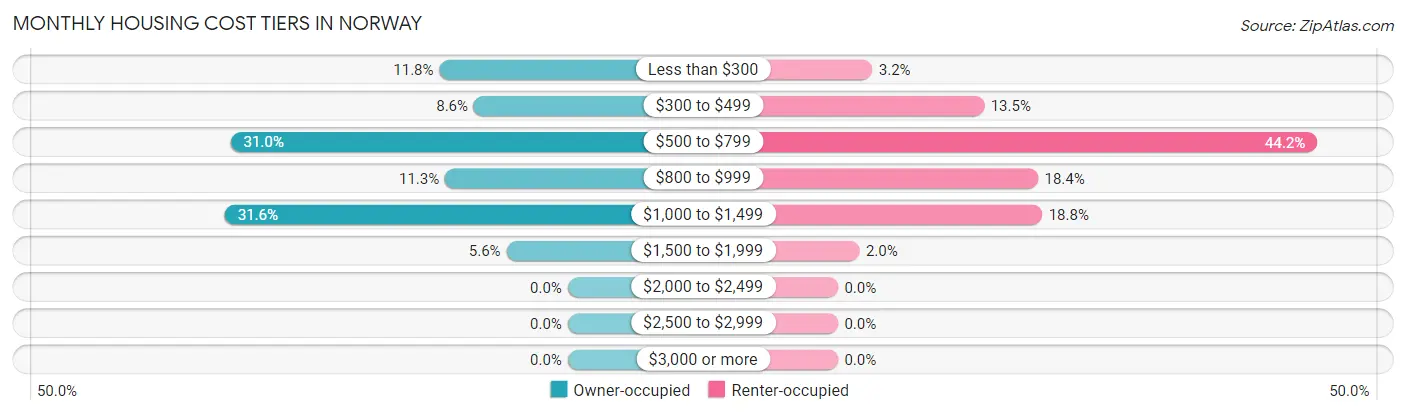
| Monthly Cost | Owner-occupied | Renter-occupied |
| Less than $300 | 67 (11.8%) | 16 (3.2%) |
| $300 to $499 | 49 (8.6%) | 68 (13.5%) |
| $500 to $799 | 176 (31.0%) | 223 (44.2%) |
| $800 to $999 | 64 (11.3%) | 93 (18.4%) |
| $1,000 to $1,499 | 179 (31.6%) | 95 (18.8%) |
| $1,500 to $1,999 | 32 (5.6%) | 10 (2.0%) |
| $2,000 to $2,499 | 0 (0.0%) | 0 (0.0%) |
| $2,500 to $2,999 | 0 (0.0%) | 0 (0.0%) |
| $3,000 or more | 0 (0.0%) | 0 (0.0%) |
| Total | 567 (100.0%) | 505 (100.0%) |
Physical Housing Characteristics in Norway
Housing Structures in Norway
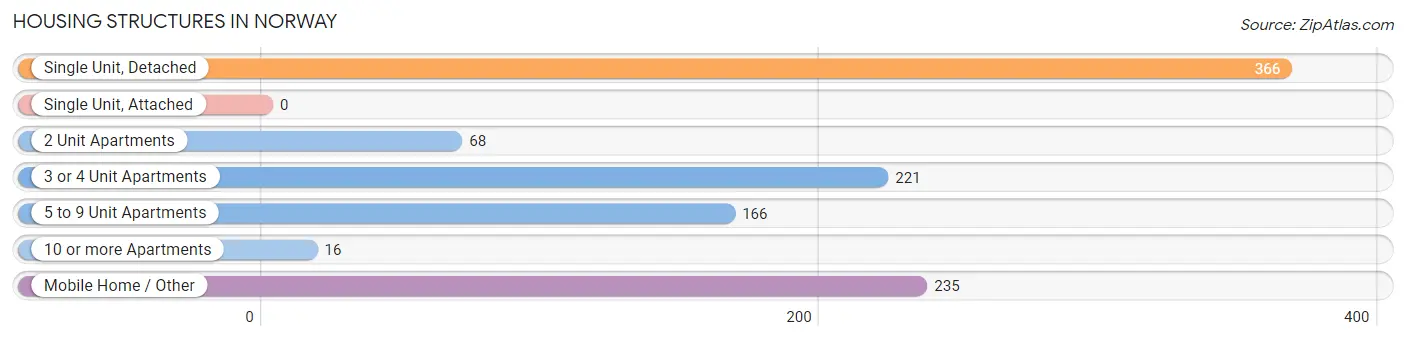
| Structure Type | # Housing Units | % Housing Units |
| Single Unit, Detached | 366 | 34.1% |
| Single Unit, Attached | 0 | 0.0% |
| 2 Unit Apartments | 68 | 6.3% |
| 3 or 4 Unit Apartments | 221 | 20.6% |
| 5 to 9 Unit Apartments | 166 | 15.5% |
| 10 or more Apartments | 16 | 1.5% |
| Mobile Home / Other | 235 | 21.9% |
| Total | 1,072 | 100.0% |
Housing Structures by Occupancy in Norway
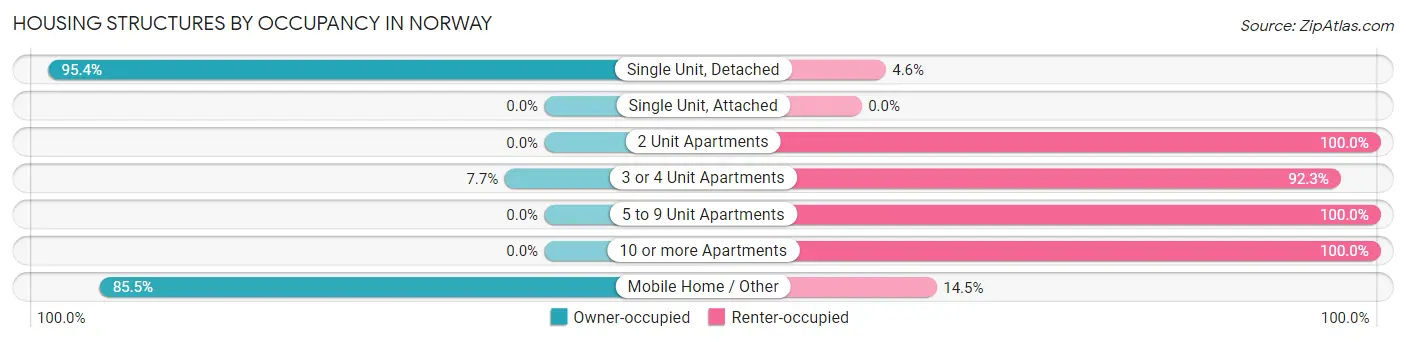
| Structure Type | Owner-occupied | Renter-occupied |
| Single Unit, Detached | 349 (95.4%) | 17 (4.6%) |
| Single Unit, Attached | 0 (0.0%) | 0 (0.0%) |
| 2 Unit Apartments | 0 (0.0%) | 68 (100.0%) |
| 3 or 4 Unit Apartments | 17 (7.7%) | 204 (92.3%) |
| 5 to 9 Unit Apartments | 0 (0.0%) | 166 (100.0%) |
| 10 or more Apartments | 0 (0.0%) | 16 (100.0%) |
| Mobile Home / Other | 201 (85.5%) | 34 (14.5%) |
| Total | 567 (52.9%) | 505 (47.1%) |
Housing Structures by Number of Rooms in Norway
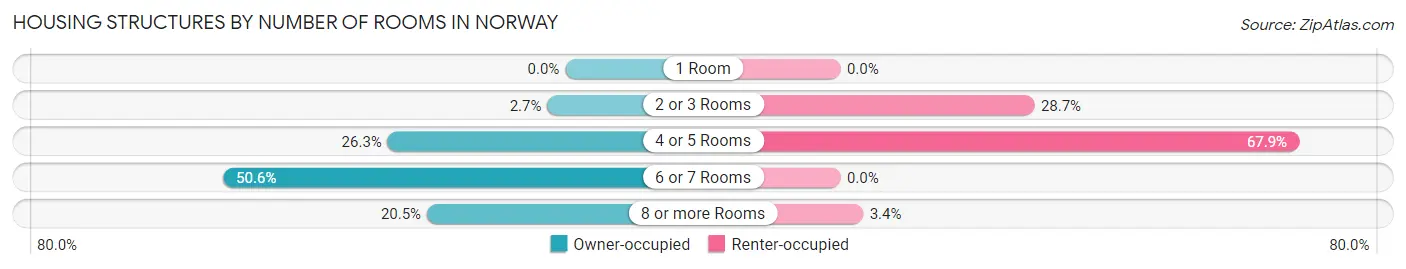
| Number of Rooms | Owner-occupied | Renter-occupied |
| 1 Room | 0 (0.0%) | 0 (0.0%) |
| 2 or 3 Rooms | 15 (2.6%) | 145 (28.7%) |
| 4 or 5 Rooms | 149 (26.3%) | 343 (67.9%) |
| 6 or 7 Rooms | 287 (50.6%) | 0 (0.0%) |
| 8 or more Rooms | 116 (20.5%) | 17 (3.4%) |
| Total | 567 (100.0%) | 505 (100.0%) |
Housing Structure by Heating Type in Norway
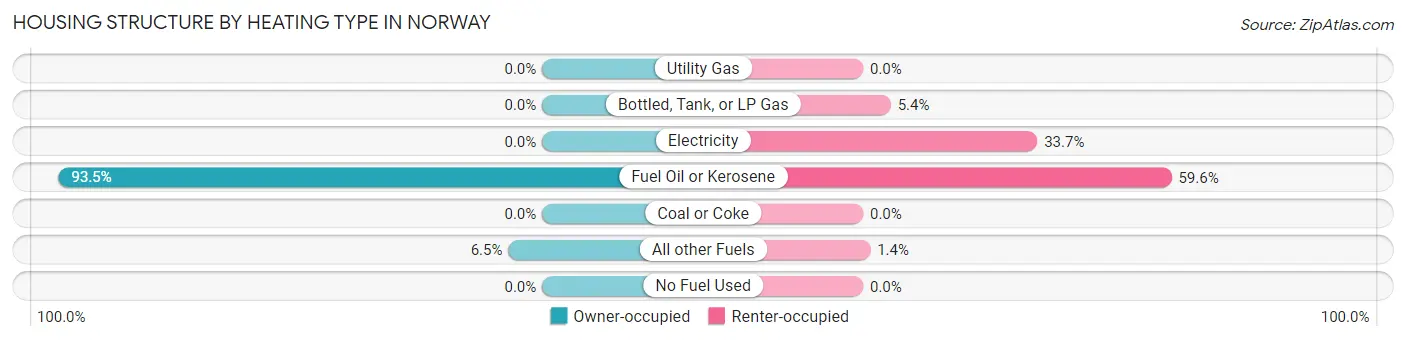
| Heating Type | Owner-occupied | Renter-occupied |
| Utility Gas | 0 (0.0%) | 0 (0.0%) |
| Bottled, Tank, or LP Gas | 0 (0.0%) | 27 (5.3%) |
| Electricity | 0 (0.0%) | 170 (33.7%) |
| Fuel Oil or Kerosene | 530 (93.5%) | 301 (59.6%) |
| Coal or Coke | 0 (0.0%) | 0 (0.0%) |
| All other Fuels | 37 (6.5%) | 7 (1.4%) |
| No Fuel Used | 0 (0.0%) | 0 (0.0%) |
| Total | 567 (100.0%) | 505 (100.0%) |
Household Vehicle Usage in Norway
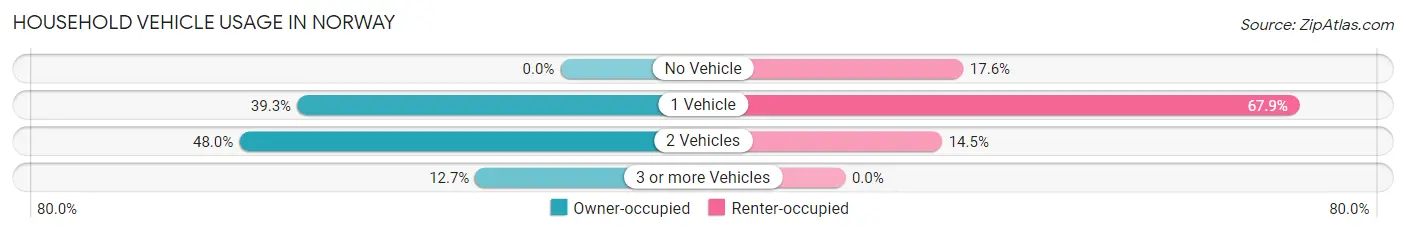
| Vehicles per Household | Owner-occupied | Renter-occupied |
| No Vehicle | 0 (0.0%) | 89 (17.6%) |
| 1 Vehicle | 223 (39.3%) | 343 (67.9%) |
| 2 Vehicles | 272 (48.0%) | 73 (14.5%) |
| 3 or more Vehicles | 72 (12.7%) | 0 (0.0%) |
| Total | 567 (100.0%) | 505 (100.0%) |
Real Estate & Mortgages in Norway
Real Estate and Mortgage Overview in Norway
| Characteristic | Without Mortgage | With Mortgage |
| Housing Units | 299 | 268 |
| Median Property Value | $106,800 | $170,200 |
| Median Household Income | $46,595 | $13 |
| Monthly Housing Costs | $593 | $0 |
| Real Estate Taxes | $724 | $0 |
Property Value by Mortgage Status in Norway
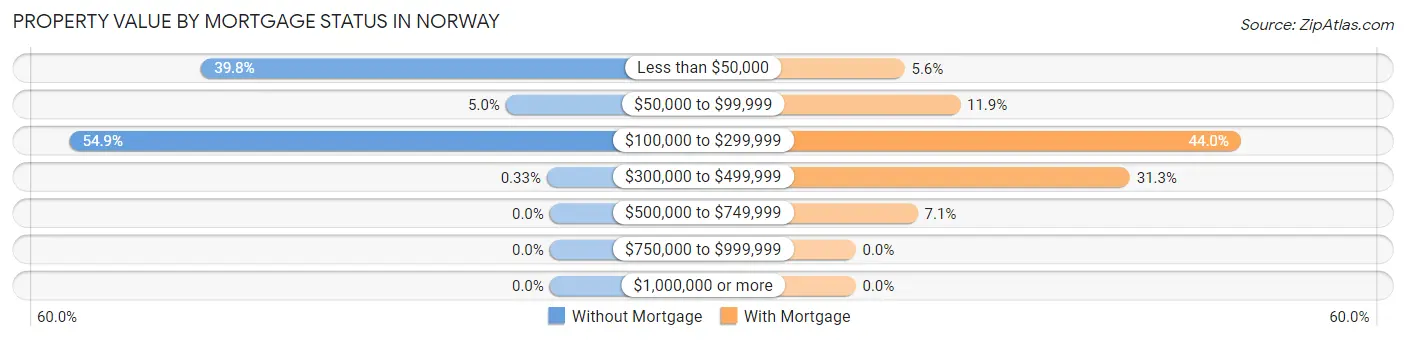
| Property Value | Without Mortgage | With Mortgage |
| Less than $50,000 | 119 (39.8%) | 15 (5.6%) |
| $50,000 to $99,999 | 15 (5.0%) | 32 (11.9%) |
| $100,000 to $299,999 | 164 (54.8%) | 118 (44.0%) |
| $300,000 to $499,999 | 1 (0.3%) | 84 (31.3%) |
| $500,000 to $749,999 | 0 (0.0%) | 19 (7.1%) |
| $750,000 to $999,999 | 0 (0.0%) | 0 (0.0%) |
| $1,000,000 or more | 0 (0.0%) | 0 (0.0%) |
| Total | 299 (100.0%) | 268 (100.0%) |
Household Income by Mortgage Status in Norway
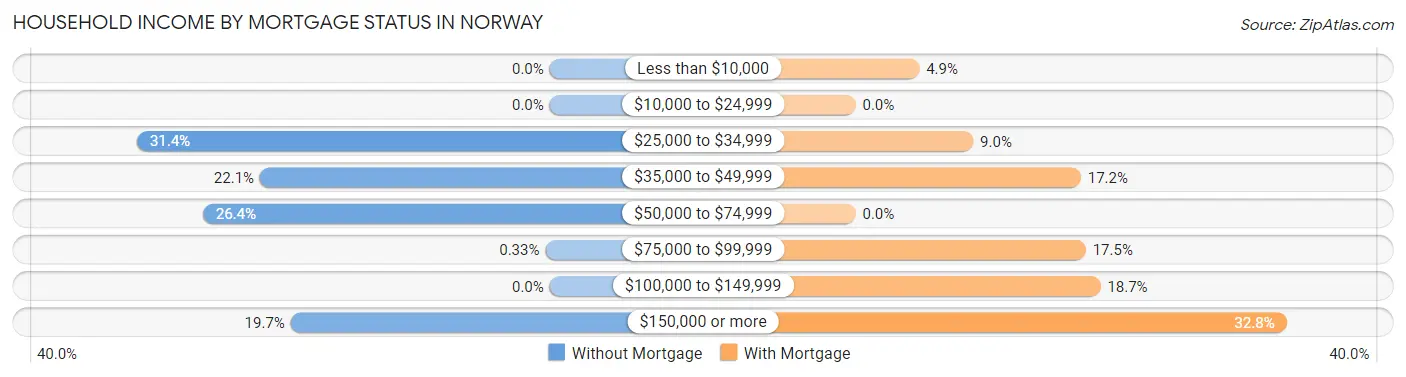
| Household Income | Without Mortgage | With Mortgage |
| Less than $10,000 | 0 (0.0%) | 13 (4.9%) |
| $10,000 to $24,999 | 0 (0.0%) | 0 (0.0%) |
| $25,000 to $34,999 | 94 (31.4%) | 24 (9.0%) |
| $35,000 to $49,999 | 66 (22.1%) | 46 (17.2%) |
| $50,000 to $74,999 | 79 (26.4%) | 0 (0.0%) |
| $75,000 to $99,999 | 1 (0.3%) | 47 (17.5%) |
| $100,000 to $149,999 | 0 (0.0%) | 50 (18.7%) |
| $150,000 or more | 59 (19.7%) | 88 (32.8%) |
| Total | 299 (100.0%) | 268 (100.0%) |
Property Value to Household Income Ratio in Norway
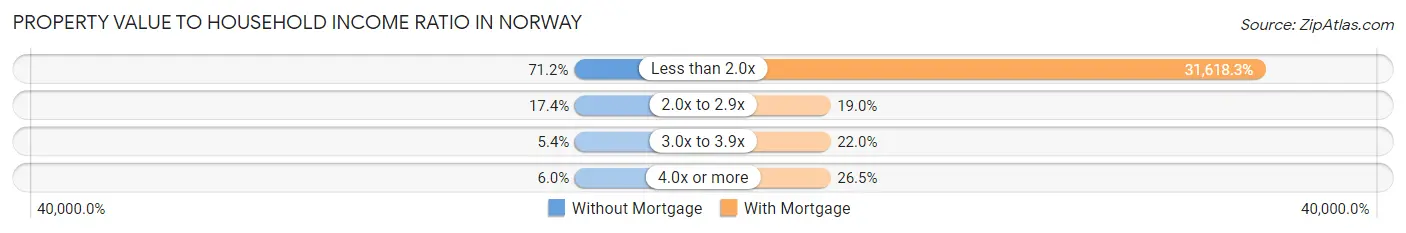
| Value-to-Income Ratio | Without Mortgage | With Mortgage |
| Less than 2.0x | 213 (71.2%) | 84,737 (31,618.3%) |
| 2.0x to 2.9x | 52 (17.4%) | 51 (19.0%) |
| 3.0x to 3.9x | 16 (5.3%) | 59 (22.0%) |
| 4.0x or more | 18 (6.0%) | 71 (26.5%) |
| Total | 299 (100.0%) | 268 (100.0%) |
Real Estate Taxes by Mortgage Status in Norway
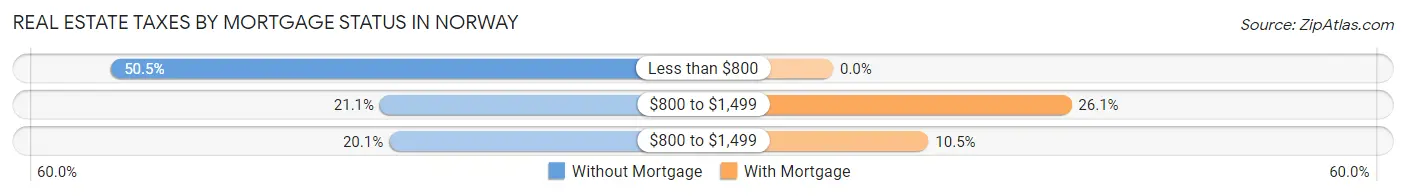
| Property Taxes | Without Mortgage | With Mortgage |
| Less than $800 | 151 (50.5%) | 0 (0.0%) |
| $800 to $1,499 | 63 (21.1%) | 70 (26.1%) |
| $800 to $1,499 | 60 (20.1%) | 28 (10.4%) |
| Total | 299 (100.0%) | 268 (100.0%) |
Health & Disability in Norway
Health Insurance Coverage by Age in Norway
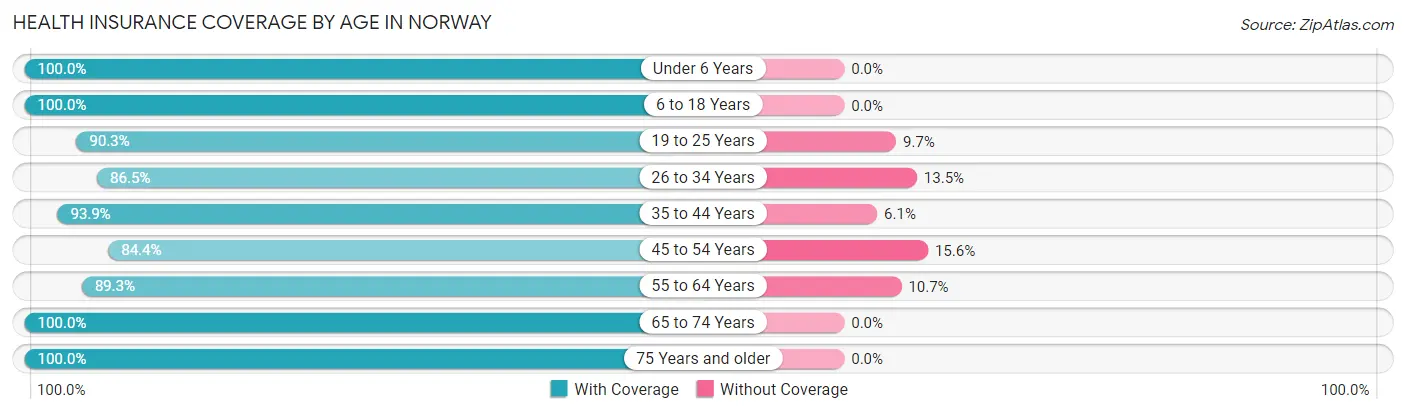
| Age Bracket | With Coverage | Without Coverage |
| Under 6 Years | 93 (100.0%) | 0 (0.0%) |
| 6 to 18 Years | 360 (100.0%) | 0 (0.0%) |
| 19 to 25 Years | 187 (90.3%) | 20 (9.7%) |
| 26 to 34 Years | 364 (86.5%) | 57 (13.5%) |
| 35 to 44 Years | 153 (93.9%) | 10 (6.1%) |
| 45 to 54 Years | 319 (84.4%) | 59 (15.6%) |
| 55 to 64 Years | 327 (89.3%) | 39 (10.7%) |
| 65 to 74 Years | 390 (100.0%) | 0 (0.0%) |
| 75 Years and older | 243 (100.0%) | 0 (0.0%) |
| Total | 2,436 (92.9%) | 185 (7.1%) |
Health Insurance Coverage by Citizenship Status in Norway
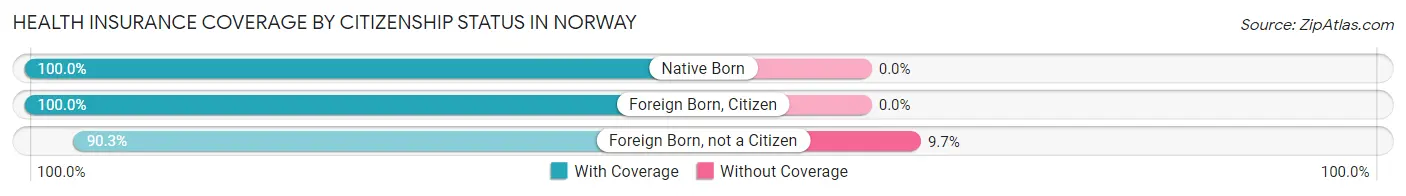
| Citizenship Status | With Coverage | Without Coverage |
| Native Born | 93 (100.0%) | 0 (0.0%) |
| Foreign Born, Citizen | 360 (100.0%) | 0 (0.0%) |
| Foreign Born, not a Citizen | 187 (90.3%) | 20 (9.7%) |
Health Insurance Coverage by Household Income in Norway
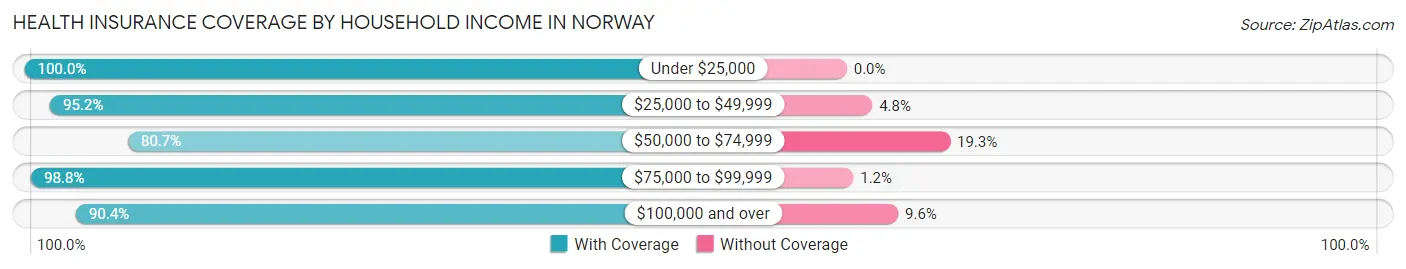
| Household Income | With Coverage | Without Coverage |
| Under $25,000 | 631 (100.0%) | 0 (0.0%) |
| $25,000 to $49,999 | 921 (95.2%) | 46 (4.8%) |
| $50,000 to $74,999 | 317 (80.7%) | 76 (19.3%) |
| $75,000 to $99,999 | 162 (98.8%) | 2 (1.2%) |
| $100,000 and over | 385 (90.4%) | 41 (9.6%) |
Public vs Private Health Insurance Coverage by Age in Norway
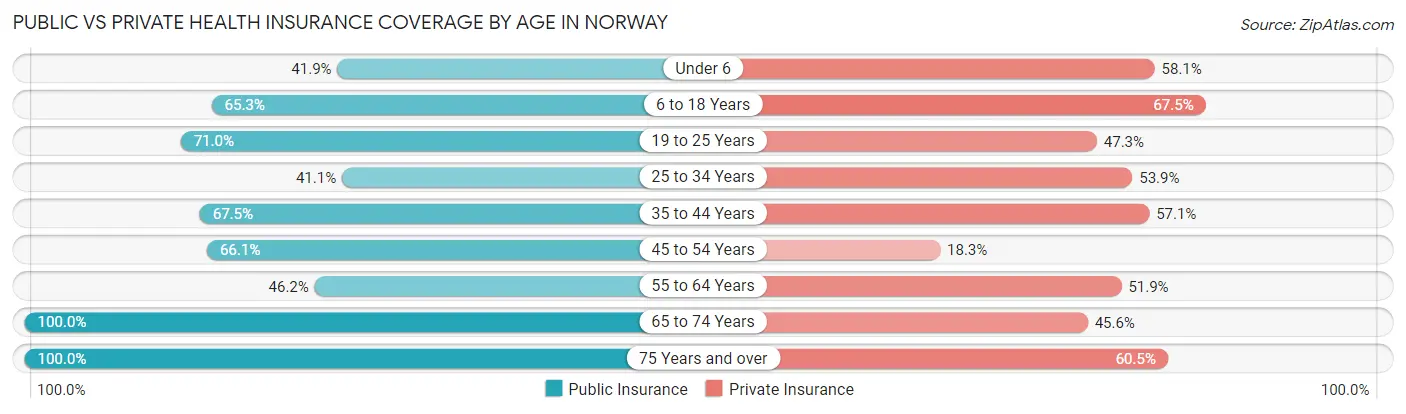
| Age Bracket | Public Insurance | Private Insurance |
| Under 6 | 39 (41.9%) | 54 (58.1%) |
| 6 to 18 Years | 235 (65.3%) | 243 (67.5%) |
| 19 to 25 Years | 147 (71.0%) | 98 (47.3%) |
| 25 to 34 Years | 173 (41.1%) | 227 (53.9%) |
| 35 to 44 Years | 110 (67.5%) | 93 (57.1%) |
| 45 to 54 Years | 250 (66.1%) | 69 (18.2%) |
| 55 to 64 Years | 169 (46.2%) | 190 (51.9%) |
| 65 to 74 Years | 390 (100.0%) | 178 (45.6%) |
| 75 Years and over | 243 (100.0%) | 147 (60.5%) |
| Total | 1,756 (67.0%) | 1,299 (49.6%) |
Disability Status by Sex by Age in Norway
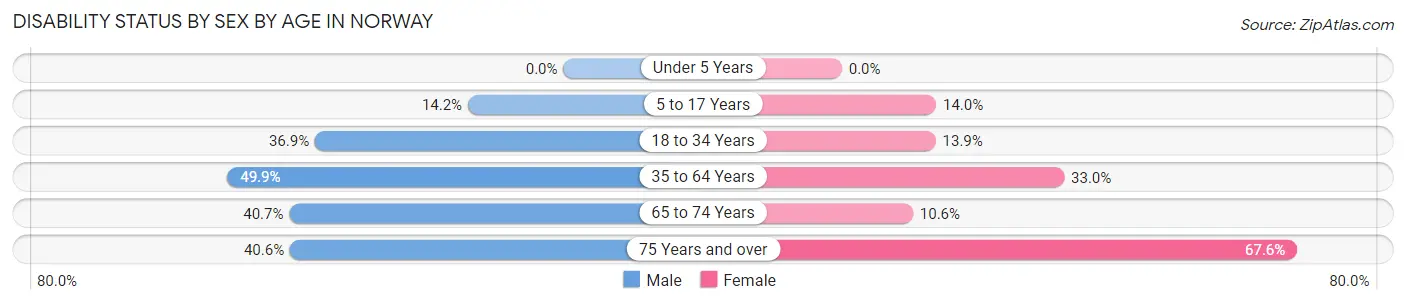
| Age Bracket | Male | Female |
| Under 5 Years | 0 (0.0%) | 0 (0.0%) |
| 5 to 17 Years | 18 (14.2%) | 35 (14.0%) |
| 18 to 34 Years | 118 (36.9%) | 45 (13.9%) |
| 35 to 64 Years | 247 (49.9%) | 136 (33.0%) |
| 65 to 74 Years | 70 (40.7%) | 23 (10.5%) |
| 75 Years and over | 41 (40.6%) | 96 (67.6%) |
Disability Class by Sex by Age in Norway
Disability Class: Hearing Difficulty
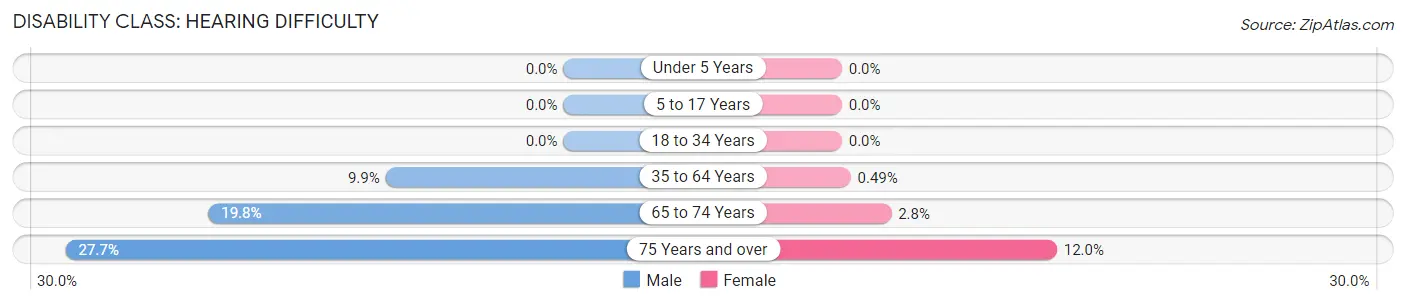
| Age Bracket | Male | Female |
| Under 5 Years | 0 (0.0%) | 0 (0.0%) |
| 5 to 17 Years | 0 (0.0%) | 0 (0.0%) |
| 18 to 34 Years | 0 (0.0%) | 0 (0.0%) |
| 35 to 64 Years | 49 (9.9%) | 2 (0.5%) |
| 65 to 74 Years | 34 (19.8%) | 6 (2.8%) |
| 75 Years and over | 28 (27.7%) | 17 (12.0%) |
Disability Class: Vision Difficulty
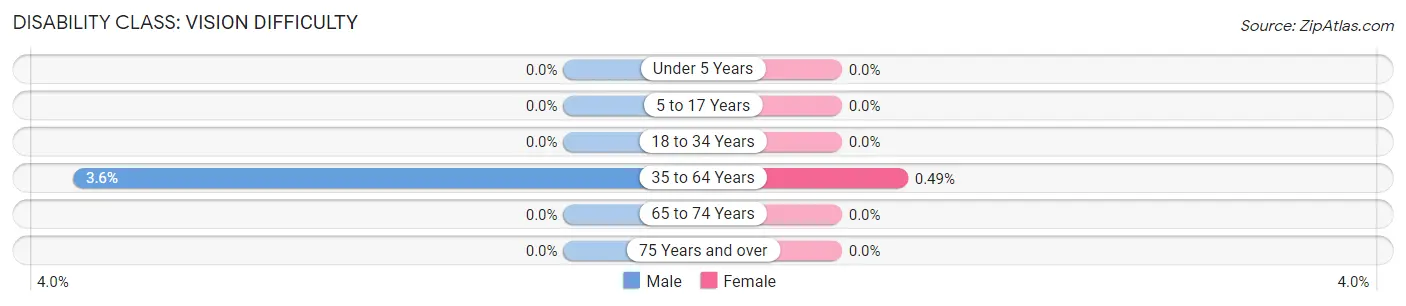
| Age Bracket | Male | Female |
| Under 5 Years | 0 (0.0%) | 0 (0.0%) |
| 5 to 17 Years | 0 (0.0%) | 0 (0.0%) |
| 18 to 34 Years | 0 (0.0%) | 0 (0.0%) |
| 35 to 64 Years | 18 (3.6%) | 2 (0.5%) |
| 65 to 74 Years | 0 (0.0%) | 0 (0.0%) |
| 75 Years and over | 0 (0.0%) | 0 (0.0%) |
Disability Class: Cognitive Difficulty
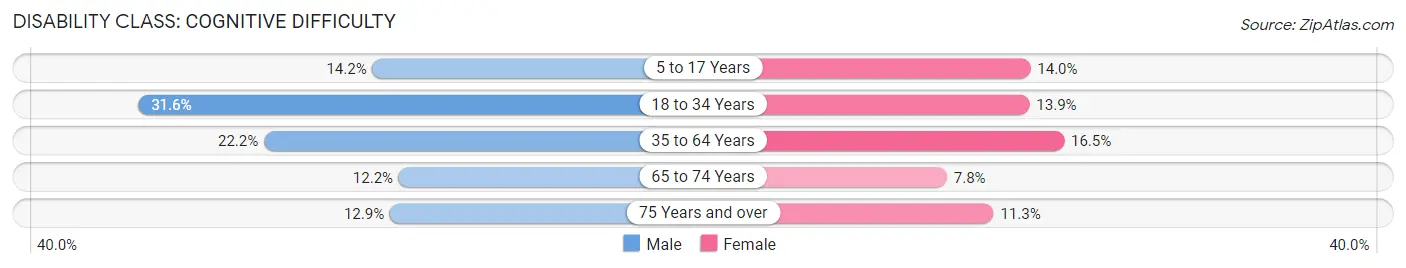
| Age Bracket | Male | Female |
| 5 to 17 Years | 18 (14.2%) | 35 (14.0%) |
| 18 to 34 Years | 101 (31.6%) | 45 (13.9%) |
| 35 to 64 Years | 110 (22.2%) | 68 (16.5%) |
| 65 to 74 Years | 21 (12.2%) | 17 (7.8%) |
| 75 Years and over | 13 (12.9%) | 16 (11.3%) |
Disability Class: Ambulatory Difficulty
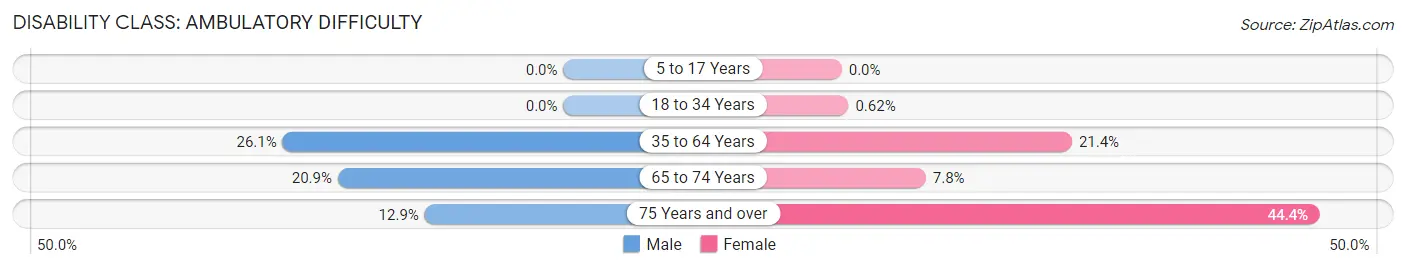
| Age Bracket | Male | Female |
| 5 to 17 Years | 0 (0.0%) | 0 (0.0%) |
| 18 to 34 Years | 0 (0.0%) | 2 (0.6%) |
| 35 to 64 Years | 129 (26.1%) | 88 (21.4%) |
| 65 to 74 Years | 36 (20.9%) | 17 (7.8%) |
| 75 Years and over | 13 (12.9%) | 63 (44.4%) |
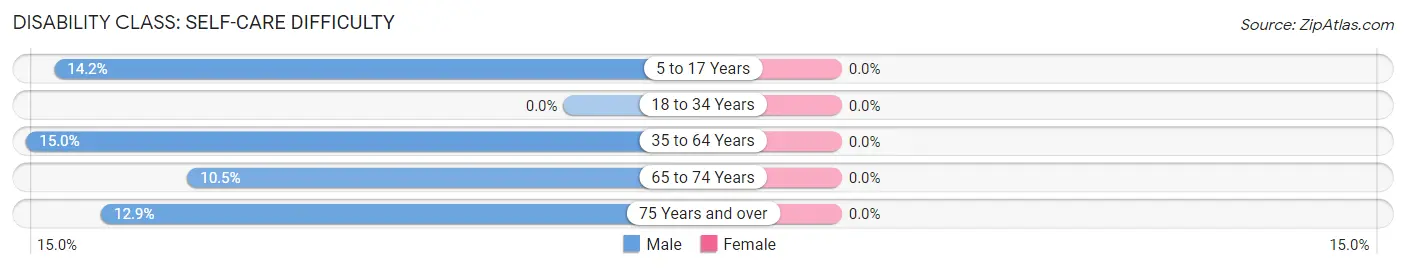
Disability Class: Self-Care Difficulty
| Age Bracket | Male | Female |
| 5 to 17 Years | 18 (14.2%) | 0 (0.0%) |
| 18 to 34 Years | 0 (0.0%) | 0 (0.0%) |
| 35 to 64 Years | 74 (14.9%) | 0 (0.0%) |
| 65 to 74 Years | 18 (10.5%) | 0 (0.0%) |
| 75 Years and over | 13 (12.9%) | 0 (0.0%) |
Technology Access in Norway
Computing Device Access in Norway
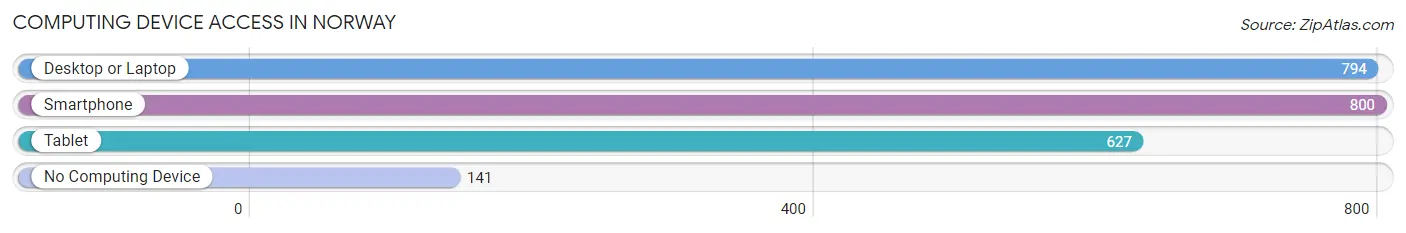
| Device Type | # Households | % Households |
| Desktop or Laptop | 794 | 74.1% |
| Smartphone | 800 | 74.6% |
| Tablet | 627 | 58.5% |
| No Computing Device | 141 | 13.2% |
| Total | 1,072 | 100.0% |
Internet Access in Norway
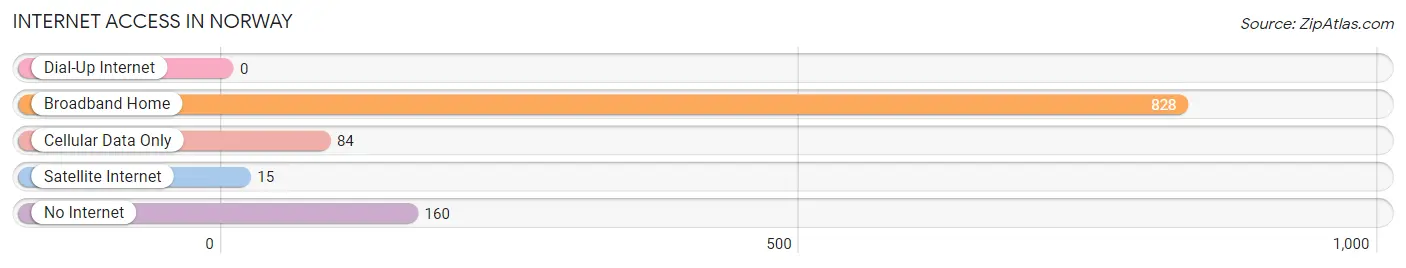
| Internet Type | # Households | % Households |
| Dial-Up Internet | 0 | 0.0% |
| Broadband Home | 828 | 77.2% |
| Cellular Data Only | 84 | 7.8% |
| Satellite Internet | 15 | 1.4% |
| No Internet | 160 | 14.9% |
| Total | 1,072 | 100.0% |
Norway Summary
Norway, Maine is a town located in Oxford County, Maine, United States. The population was 7,437 at the 2010 census. It is part of the Portland–South Portland–Biddeford, Maine metropolitan statistical area.
History
The area that is now Norway was first settled in 1786 by a group of settlers from Norway, Connecticut. The town was incorporated on March 8, 1819, and was named after the settlers' hometown.
In the 19th century, Norway was a center of the lumber industry, with several sawmills located along the Little Androscoggin River. The town was also home to several granite quarries, which provided stone for many of the buildings in the area.
Geography
Norway is located in western Oxford County, bordered by the towns of Oxford to the north, Paris to the east, West Paris to the southeast, Hebron to the south, and Waterford to the west. The Little Androscoggin River flows through the town, and the town is crossed by U.S. Route 26 and Maine State Route 117.
According to the United States Census Bureau, the town has a total area of 39.2sqmi, of which 38.7sqmi is land and 0.5sqmi is water.
Demographics
As of the census of 2000, there were 6,719 people, 2,717 households, and 1,845 families residing in the town. The population density was 173.2 people per square mile (66.9/km^2). There were 2,945 housing units at an average density of 76.2 per square mile (29.4/km^2). The racial makeup of the town was 97.90% White, 0.20% African American, 0.30% Native American, 0.37% Asian, 0.02% Pacific Islander, 0.17% from other races, and 1.04% from two or more races. Hispanic or Latino of any race were 0.60% of the population.
There were 2,717 households, out of which 32.2% had children under the age of 18 living with them, 54.2% were married couples living together, 10.2% had a female householder with no husband present, and 31.2% were non-families. 24.7% of all households were made up of individuals, and 10.2% had someone living alone who was 65 years of age or older. The average household size was 2.47 and the average family size was 2.94.
In the town, the population was spread out, with 25.2% under the age of 18, 7.2% from 18 to 24, 29.2% from 25 to 44, 24.2% from 45 to 64, and 14.2% who were 65 years of age or older. The median age was 38 years. For every 100 females, there were 94.2 males. For every 100 females age 18 and over, there were 91.2 males.
The median income for a household in the town was $36,944, and the median income for a family was $43,958. Males had a median income of $31,944 versus $23,958 for females. The per capita income for the town was $17,945. About 6.7% of families and 9.2% of the population were below the poverty line, including 11.2% of those under age 18 and 8.2% of those age 65 or over.
Economy
Norway is home to several small businesses, including a number of restaurants, retail stores, and service businesses. The town is also home to several manufacturing companies, including a paper mill, a wood products company, and a plastics manufacturer.
The town is also home to the Oxford County Fair, which is held annually in August. The fair features a variety of events, including a carnival, a parade, and a variety of agricultural and craft exhibits.
The town is also home to the Norway Country Club, which offers a golf course, tennis courts, and a swimming pool. The club also hosts a variety of events throughout the year, including weddings, banquets, and other special events.
Common Questions
What is Per Capita Income in Norway?
Per Capita income in Norway is $21,703.
What is the Median Family Income in Norway?
Median Family Income in Norway is $50,461.
What is the Median Household income in Norway?
Median Household Income in Norway is $38,381.
What is Income or Wage Gap in Norway?
Income or Wage Gap in Norway is 18.1%.
Women in Norway earn 81.9 cents for every dollar earned by a man.
What is Inequality or Gini Index in Norway?
Inequality or Gini Index in Norway is 0.41.
What is the Total Population of Norway?
Total Population of Norway is 2,698.
What is the Total Male Population of Norway?
Total Male Population of Norway is 1,286.
What is the Total Female Population of Norway?
Total Female Population of Norway is 1,412.
What is the Ratio of Males per 100 Females in Norway?
There are 91.08 Males per 100 Females in Norway.
What is the Ratio of Females per 100 Males in Norway?
There are 109.80 Females per 100 Males in Norway.
What is the Median Population Age in Norway?
Median Population Age in Norway is 45.8 Years.
What is the Average Family Size in Norway
Average Family Size in Norway is 2.9 People.
What is the Average Household Size in Norway
Average Household Size in Norway is 2.4 People.
How Large is the Labor Force in Norway?
There are 879 People in the Labor Forcein in Norway.
What is the Percentage of People in the Labor Force in Norway?
37.7% of People are in the Labor Force in Norway.
What is the Unemployment Rate in Norway?
Unemployment Rate in Norway is 7.5%.