Waldoboro, ME Map & Demographics
Waldoboro Map
Waldoboro Overview
$52,040
PER CAPITA INCOME
$112,056
AVG FAMILY INCOME
$54,345
AVG HOUSEHOLD INCOME
22.8%
WAGE / INCOME GAP [ % ]
77.2¢/ $1
WAGE / INCOME GAP [ $ ]
0.56
INEQUALITY / GINI INDEX
1,553
TOTAL POPULATION
772
MALE POPULATION
781
FEMALE POPULATION
98.85
MALES / 100 FEMALES
101.17
FEMALES / 100 MALES
53.3
MEDIAN AGE
2.5
AVG FAMILY SIZE
1.8
AVG HOUSEHOLD SIZE
796
LABOR FORCE [ PEOPLE ]
56.1%
PERCENT IN LABOR FORCE
4.0%
UNEMPLOYMENT RATE
Waldoboro Zip Codes
Waldoboro Area Codes
Income in Waldoboro
Income Overview in Waldoboro
Per Capita Income in Waldoboro is $52,040, while median incomes of families and households are $112,056 and $54,345 respectively.
| Characteristic | Number | Measure |
| Per Capita Income | 1,553 | $52,040 |
| Median Family Income | 405 | $112,056 |
| Mean Family Income | 405 | $156,301 |
| Median Household Income | 883 | $54,345 |
| Mean Household Income | 883 | $88,953 |
| Income Deficit | 405 | $0 |
| Wage / Income Gap (%) | 1,553 | 22.78% |
| Wage / Income Gap ($) | 1,553 | 77.22¢ per $1 |
| Gini / Inequality Index | 1,553 | 0.56 |
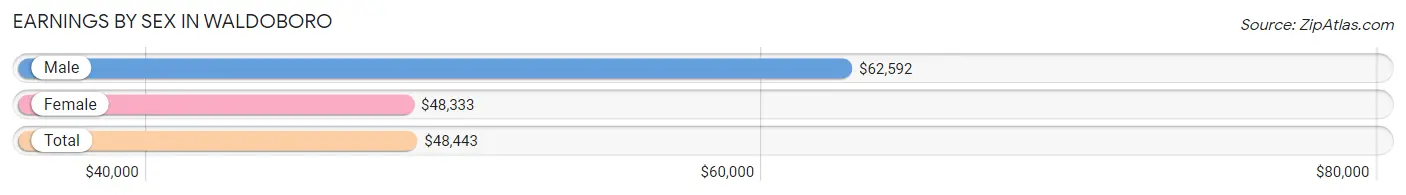
Earnings by Sex in Waldoboro
Average Earnings in Waldoboro are $48,443, $62,592 for men and $48,333 for women, a difference of 22.8%.
| Sex | Number | Average Earnings |
| Male | 429 (52.8%) | $62,592 |
| Female | 384 (47.2%) | $48,333 |
| Total | 813 (100.0%) | $48,443 |
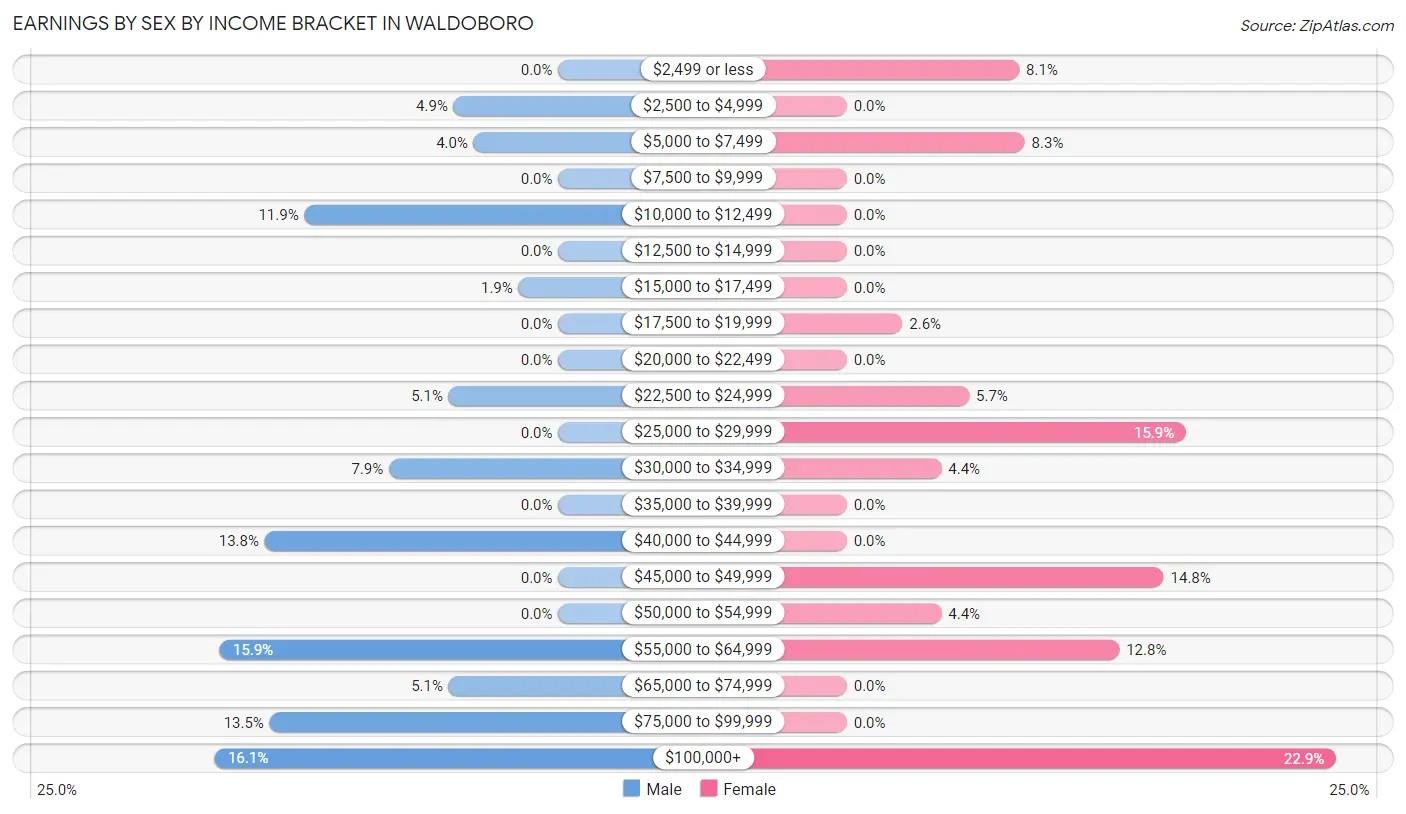
Earnings by Sex by Income Bracket in Waldoboro
The most common earnings brackets in Waldoboro are $100,000+ for men (69 | 16.1%) and $100,000+ for women (88 | 22.9%).
| Income | Male | Female |
| $2,499 or less | 0 (0.0%) | 31 (8.1%) |
| $2,500 to $4,999 | 21 (4.9%) | 0 (0.0%) |
| $5,000 to $7,499 | 17 (4.0%) | 32 (8.3%) |
| $7,500 to $9,999 | 0 (0.0%) | 0 (0.0%) |
| $10,000 to $12,499 | 51 (11.9%) | 0 (0.0%) |
| $12,500 to $14,999 | 0 (0.0%) | 0 (0.0%) |
| $15,000 to $17,499 | 8 (1.9%) | 0 (0.0%) |
| $17,500 to $19,999 | 0 (0.0%) | 10 (2.6%) |
| $20,000 to $22,499 | 0 (0.0%) | 0 (0.0%) |
| $22,500 to $24,999 | 22 (5.1%) | 22 (5.7%) |
| $25,000 to $29,999 | 0 (0.0%) | 61 (15.9%) |
| $30,000 to $34,999 | 34 (7.9%) | 17 (4.4%) |
| $35,000 to $39,999 | 0 (0.0%) | 0 (0.0%) |
| $40,000 to $44,999 | 59 (13.8%) | 0 (0.0%) |
| $45,000 to $49,999 | 0 (0.0%) | 57 (14.8%) |
| $50,000 to $54,999 | 0 (0.0%) | 17 (4.4%) |
| $55,000 to $64,999 | 68 (15.9%) | 49 (12.8%) |
| $65,000 to $74,999 | 22 (5.1%) | 0 (0.0%) |
| $75,000 to $99,999 | 58 (13.5%) | 0 (0.0%) |
| $100,000+ | 69 (16.1%) | 88 (22.9%) |
| Total | 429 (100.0%) | 384 (100.0%) |
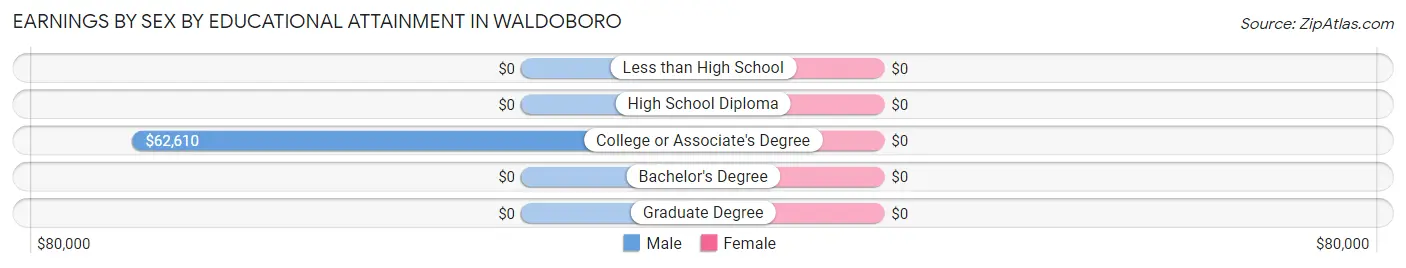
Earnings by Sex by Educational Attainment in Waldoboro
| Educational Attainment | Male Income | Female Income |
| Less than High School | - | - |
| High School Diploma | - | - |
| College or Associate's Degree | $62,610 | $0 |
| Bachelor's Degree | - | - |
| Graduate Degree | - | - |
| Total | $62,739 | $49,035 |
Family Income in Waldoboro
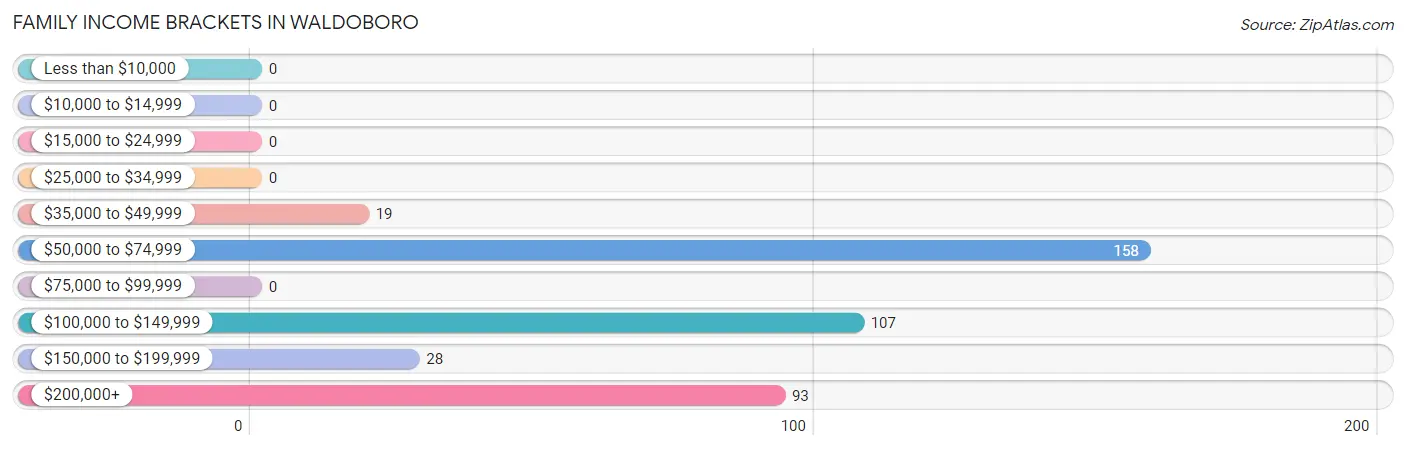
Family Income Brackets in Waldoboro
According to the Waldoboro family income data, there are 158 families falling into the $50,000 to $74,999 income range, which is the most common income bracket and makes up 39.0% of all families.
| Income Bracket | # Families | % Families |
| Less than $10,000 | 0 | 0.0% |
| $10,000 to $14,999 | 0 | 0.0% |
| $15,000 to $24,999 | 0 | 0.0% |
| $25,000 to $34,999 | 0 | 0.0% |
| $35,000 to $49,999 | 19 | 4.7% |
| $50,000 to $74,999 | 158 | 39.0% |
| $75,000 to $99,999 | 0 | 0.0% |
| $100,000 to $149,999 | 107 | 26.4% |
| $150,000 to $199,999 | 28 | 6.9% |
| $200,000+ | 93 | 23.0% |
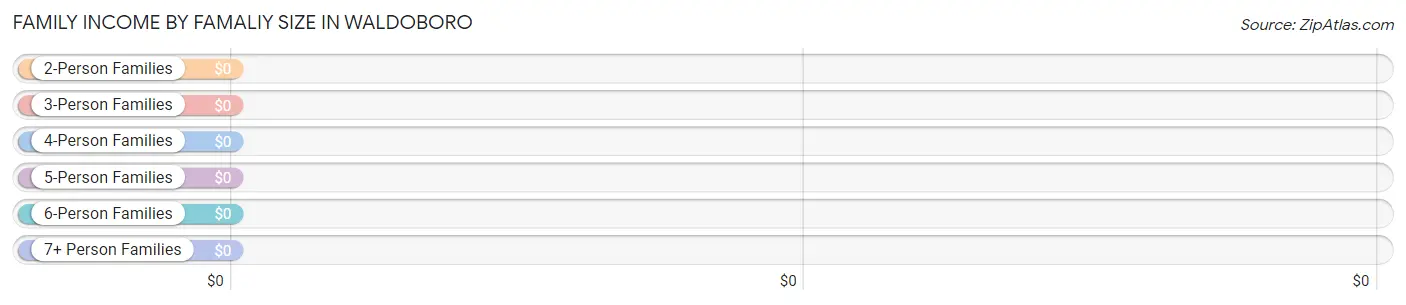
Family Income by Famaliy Size in Waldoboro
| Income Bracket | # Families | Median Income |
| 2-Person Families | 286 (70.6%) | $0 |
| 3-Person Families | 51 (12.6%) | $0 |
| 4-Person Families | 58 (14.3%) | $0 |
| 5-Person Families | 0 (0.0%) | $0 |
| 6-Person Families | 10 (2.5%) | $0 |
| 7+ Person Families | 0 (0.0%) | $0 |
| Total | 405 (100.0%) | $112,056 |
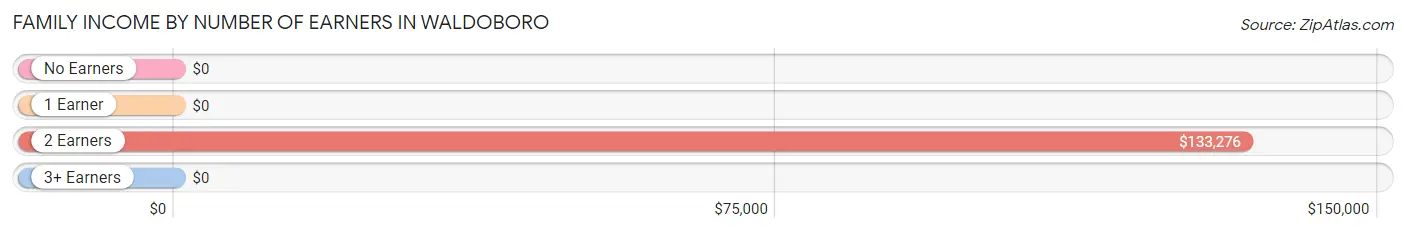
Family Income by Number of Earners in Waldoboro
| Number of Earners | # Families | Median Income |
| No Earners | 39 (9.6%) | $0 |
| 1 Earner | 178 (44.0%) | $0 |
| 2 Earners | 178 (44.0%) | $133,276 |
| 3+ Earners | 10 (2.5%) | $0 |
| Total | 405 (100.0%) | $112,056 |
Household Income in Waldoboro
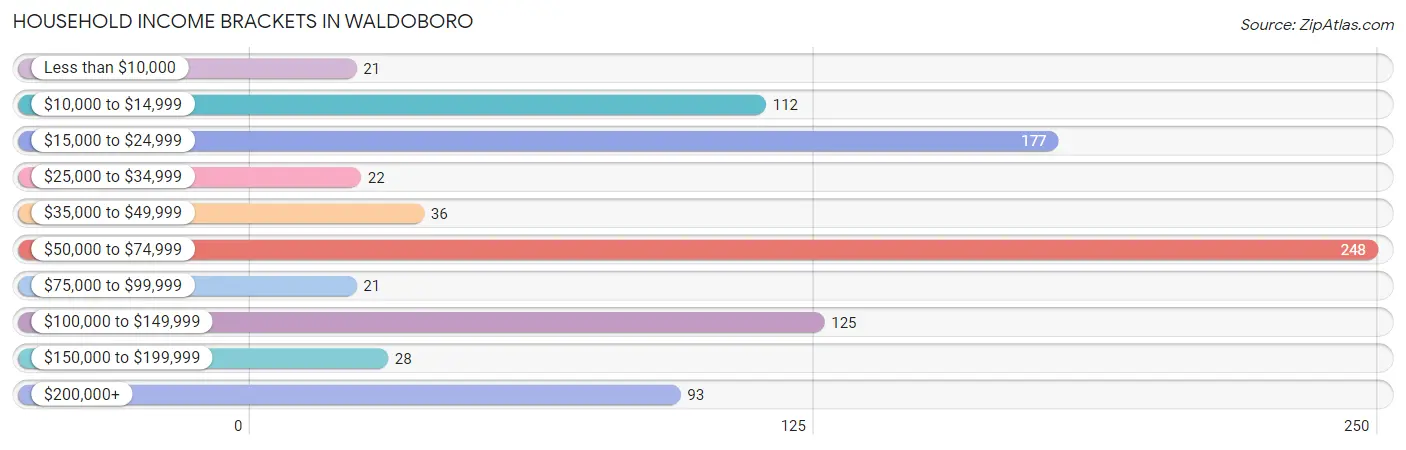
Household Income Brackets in Waldoboro
With 248 households falling in the category, the $50,000 to $74,999 income range is the most frequent in Waldoboro, accounting for 28.1% of all households. In contrast, only 21 households (2.4%) fall into the less than $10,000 income bracket, making it the least populous group.
| Income Bracket | # Households | % Households |
| Less than $10,000 | 21 | 2.4% |
| $10,000 to $14,999 | 112 | 12.7% |
| $15,000 to $24,999 | 177 | 20.0% |
| $25,000 to $34,999 | 22 | 2.5% |
| $35,000 to $49,999 | 36 | 4.1% |
| $50,000 to $74,999 | 248 | 28.1% |
| $75,000 to $99,999 | 21 | 2.4% |
| $100,000 to $149,999 | 125 | 14.2% |
| $150,000 to $199,999 | 28 | 3.2% |
| $200,000+ | 93 | 10.5% |
Household Income by Householder Age in Waldoboro
The median household income in Waldoboro is $54,345, with the highest median household income of $51,379 found in the 65+ years age bracket for the primary householder. A total of 366 households (41.4%) fall into this category.
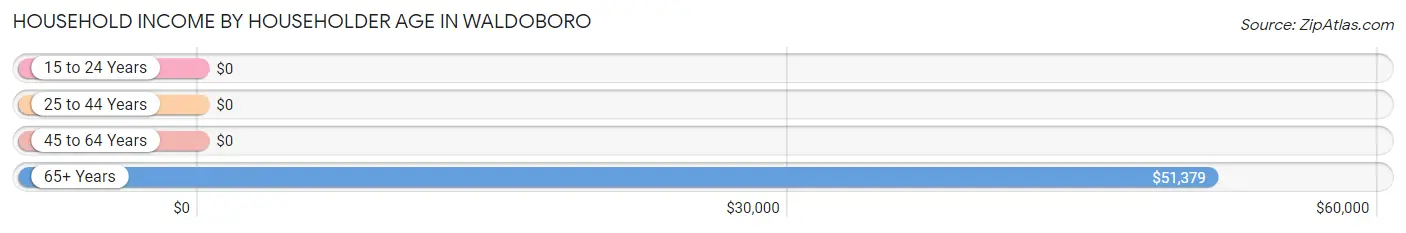
| Income Bracket | # Households | Median Income |
| 15 to 24 Years | 0 (0.0%) | $0 |
| 25 to 44 Years | 201 (22.8%) | $0 |
| 45 to 64 Years | 316 (35.8%) | $0 |
| 65+ Years | 366 (41.4%) | $51,379 |
| Total | 883 (100.0%) | $54,345 |
Poverty in Waldoboro
Income Below Poverty by Sex and Age in Waldoboro
With 7.2% poverty level for males and 16.1% for females among the residents of Waldoboro, 55 to 64 year old males and 18 to 24 year old females are the most vulnerable to poverty, with 20 males (18.9%) and 32 females (100.0%) in their respective age groups living below the poverty level.
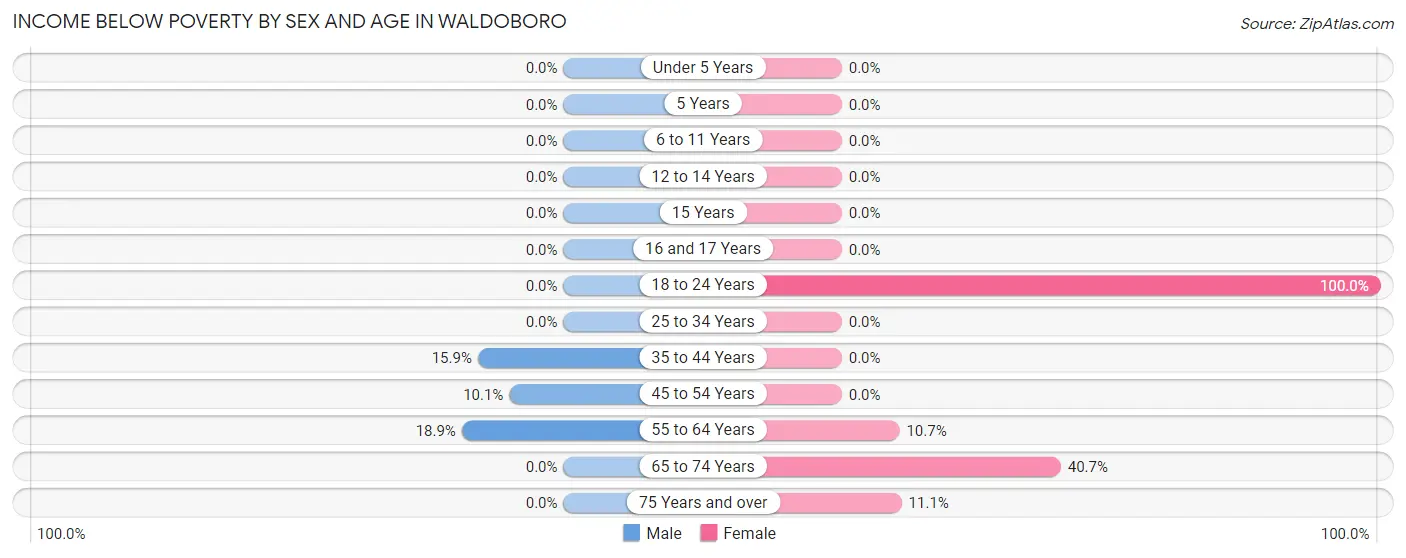
| Age Bracket | Male | Female |
| Under 5 Years | 0 (0.0%) | 0 (0.0%) |
| 5 Years | 0 (0.0%) | 0 (0.0%) |
| 6 to 11 Years | 0 (0.0%) | 0 (0.0%) |
| 12 to 14 Years | 0 (0.0%) | 0 (0.0%) |
| 15 Years | 0 (0.0%) | 0 (0.0%) |
| 16 and 17 Years | 0 (0.0%) | 0 (0.0%) |
| 18 to 24 Years | 0 (0.0%) | 32 (100.0%) |
| 25 to 34 Years | 0 (0.0%) | 0 (0.0%) |
| 35 to 44 Years | 17 (15.9%) | 0 (0.0%) |
| 45 to 54 Years | 19 (10.1%) | 0 (0.0%) |
| 55 to 64 Years | 20 (18.9%) | 21 (10.7%) |
| 65 to 74 Years | 0 (0.0%) | 63 (40.6%) |
| 75 Years and over | 0 (0.0%) | 10 (11.1%) |
| Total | 56 (7.2%) | 126 (16.1%) |
Income Above Poverty by Sex and Age in Waldoboro
According to the poverty statistics in Waldoboro, males aged under 5 years and females aged 5 years are the age groups that are most secure financially, with 100.0% of males and 100.0% of females in these age groups living above the poverty line.
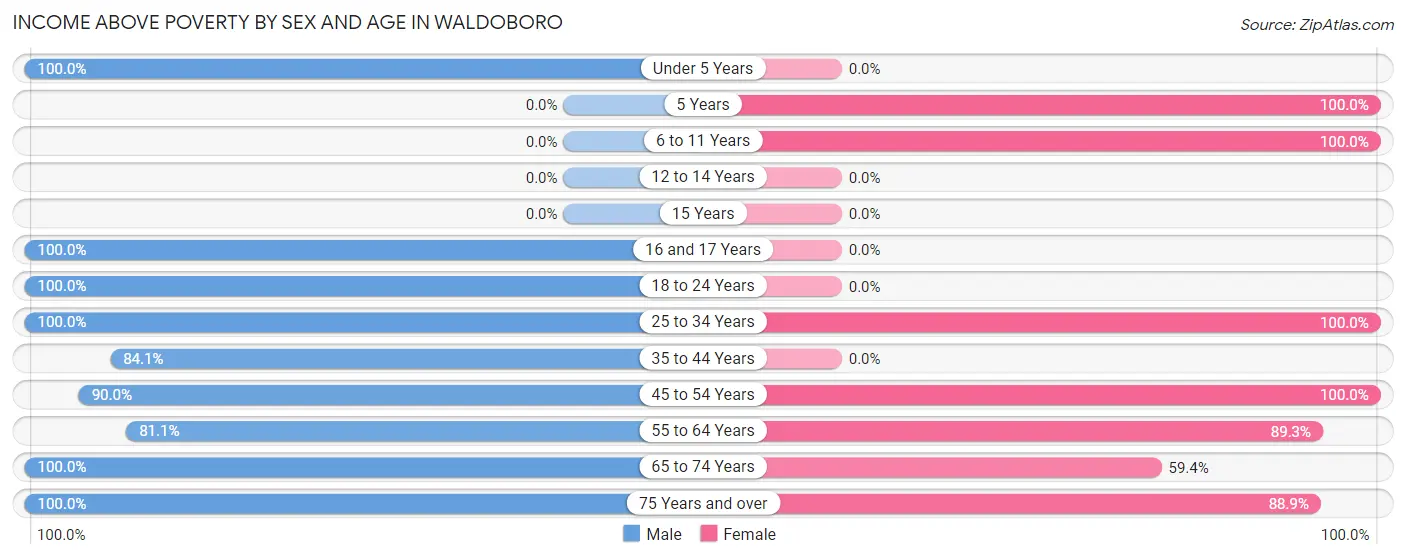
| Age Bracket | Male | Female |
| Under 5 Years | 24 (100.0%) | 0 (0.0%) |
| 5 Years | 0 (0.0%) | 49 (100.0%) |
| 6 to 11 Years | 0 (0.0%) | 61 (100.0%) |
| 12 to 14 Years | 0 (0.0%) | 0 (0.0%) |
| 15 Years | 0 (0.0%) | 0 (0.0%) |
| 16 and 17 Years | 32 (100.0%) | 0 (0.0%) |
| 18 to 24 Years | 9 (100.0%) | 0 (0.0%) |
| 25 to 34 Years | 120 (100.0%) | 110 (100.0%) |
| 35 to 44 Years | 90 (84.1%) | 0 (0.0%) |
| 45 to 54 Years | 170 (89.9%) | 88 (100.0%) |
| 55 to 64 Years | 86 (81.1%) | 175 (89.3%) |
| 65 to 74 Years | 138 (100.0%) | 92 (59.4%) |
| 75 Years and over | 47 (100.0%) | 80 (88.9%) |
| Total | 716 (92.7%) | 655 (83.9%) |
Income Below Poverty Among Married-Couple Families in Waldoboro
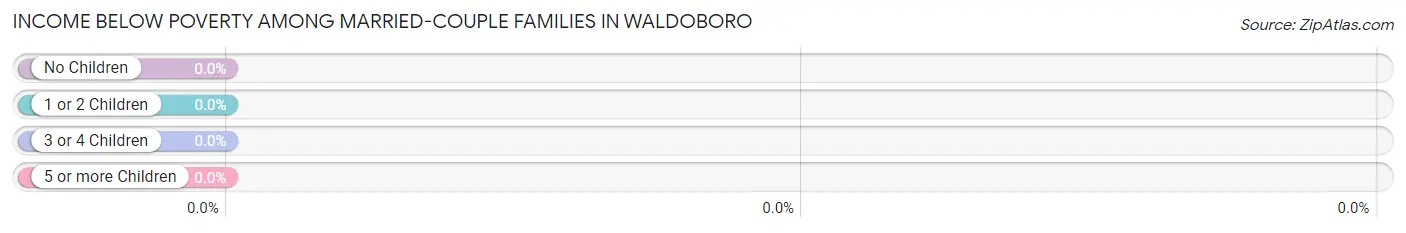
| Children | Above Poverty | Below Poverty |
| No Children | 209 (100.0%) | 0 (0.0%) |
| 1 or 2 Children | 89 (100.0%) | 0 (0.0%) |
| 3 or 4 Children | 10 (100.0%) | 0 (0.0%) |
| 5 or more Children | 0 (0.0%) | 0 (0.0%) |
| Total | 308 (100.0%) | 0 (0.0%) |
Income Below Poverty Among Single-Parent Households in Waldoboro
| Children | Single Father | Single Mother |
| No Children | 0 (0.0%) | 0 (0.0%) |
| 1 or 2 Children | 0 (0.0%) | 0 (0.0%) |
| 3 or 4 Children | 0 (0.0%) | 0 (0.0%) |
| 5 or more Children | 0 (0.0%) | 0 (0.0%) |
| Total | 0 (0.0%) | 0 (0.0%) |
Income Below Poverty Among Married-Couple vs Single-Parent Households in Waldoboro
| Children | Married-Couple Families | Single-Parent Households |
| No Children | 0 (0.0%) | 0 (0.0%) |
| 1 or 2 Children | 0 (0.0%) | 0 (0.0%) |
| 3 or 4 Children | 0 (0.0%) | 0 (0.0%) |
| 5 or more Children | 0 (0.0%) | 0 (0.0%) |
| Total | 0 (0.0%) | 0 (0.0%) |
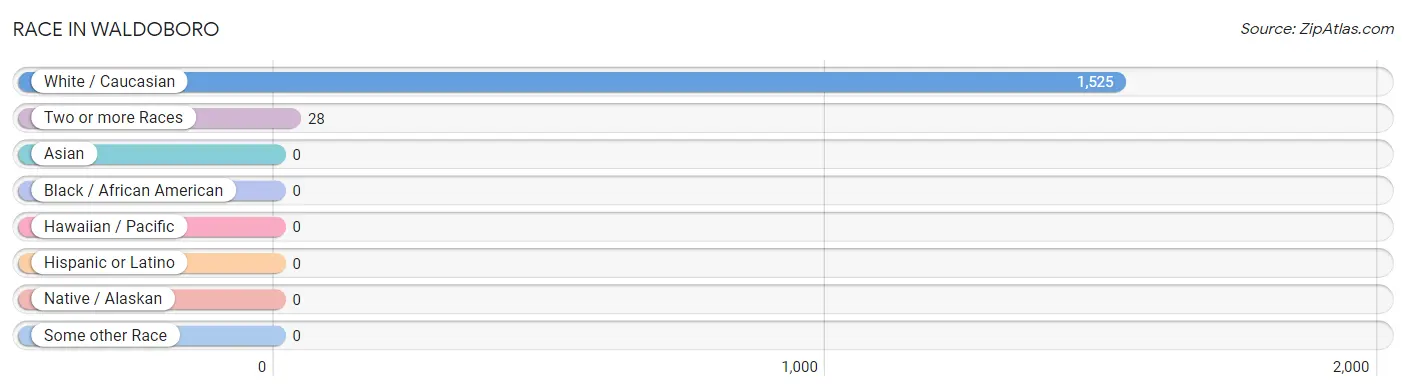
Race in Waldoboro
The most populous races in Waldoboro are White / Caucasian (1,525 | 98.2%), and Two or more Races (28 | 1.8%).
| Race | # Population | % Population |
| Asian | 0 | 0.0% |
| Black / African American | 0 | 0.0% |
| Hawaiian / Pacific | 0 | 0.0% |
| Hispanic or Latino | 0 | 0.0% |
| Native / Alaskan | 0 | 0.0% |
| White / Caucasian | 1,525 | 98.2% |
| Two or more Races | 28 | 1.8% |
| Some other Race | 0 | 0.0% |
| Total | 1,553 | 100.0% |
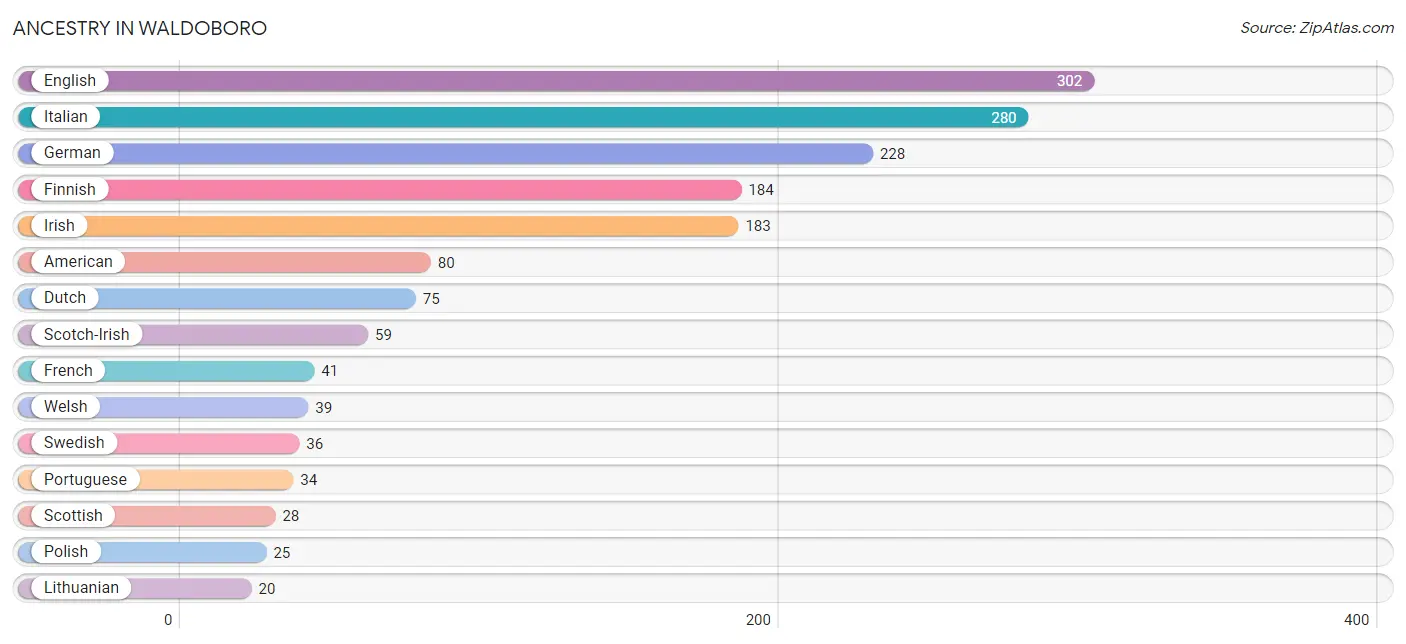
Ancestry in Waldoboro
The most populous ancestries reported in Waldoboro are English (302 | 19.5%), Italian (280 | 18.0%), German (228 | 14.7%), Finnish (184 | 11.8%), and Irish (183 | 11.8%), together accounting for 75.8% of all Waldoboro residents.
| Ancestry | # Population | % Population |
| American | 80 | 5.1% |
| Dutch | 75 | 4.8% |
| English | 302 | 19.5% |
| European | 18 | 1.2% |
| Finnish | 184 | 11.8% |
| French | 41 | 2.6% |
| German | 228 | 14.7% |
| Irish | 183 | 11.8% |
| Italian | 280 | 18.0% |
| Lithuanian | 20 | 1.3% |
| Polish | 25 | 1.6% |
| Portuguese | 34 | 2.2% |
| Scotch-Irish | 59 | 3.8% |
| Scottish | 28 | 1.8% |
| Slavic | 19 | 1.2% |
| Swedish | 36 | 2.3% |
| Ukrainian | 8 | 0.5% |
| Welsh | 39 | 2.5% | View All 18 Rows |
Immigrants in Waldoboro
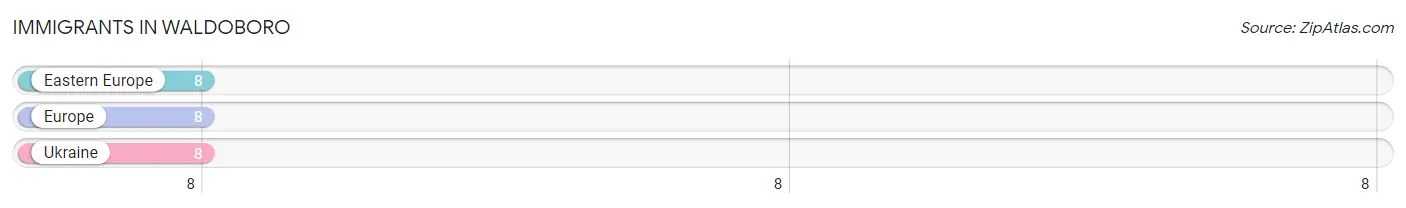
The most numerous immigrant groups reported in Waldoboro came from Eastern Europe (8 | 0.5%), Europe (8 | 0.5%), and Ukraine (8 | 0.5%), together accounting for 1.6% of all Waldoboro residents.
| Immigration Origin | # Population | % Population |
| Eastern Europe | 8 | 0.5% |
| Europe | 8 | 0.5% |
| Ukraine | 8 | 0.5% | View All 3 Rows |
Sex and Age in Waldoboro
Sex and Age in Waldoboro
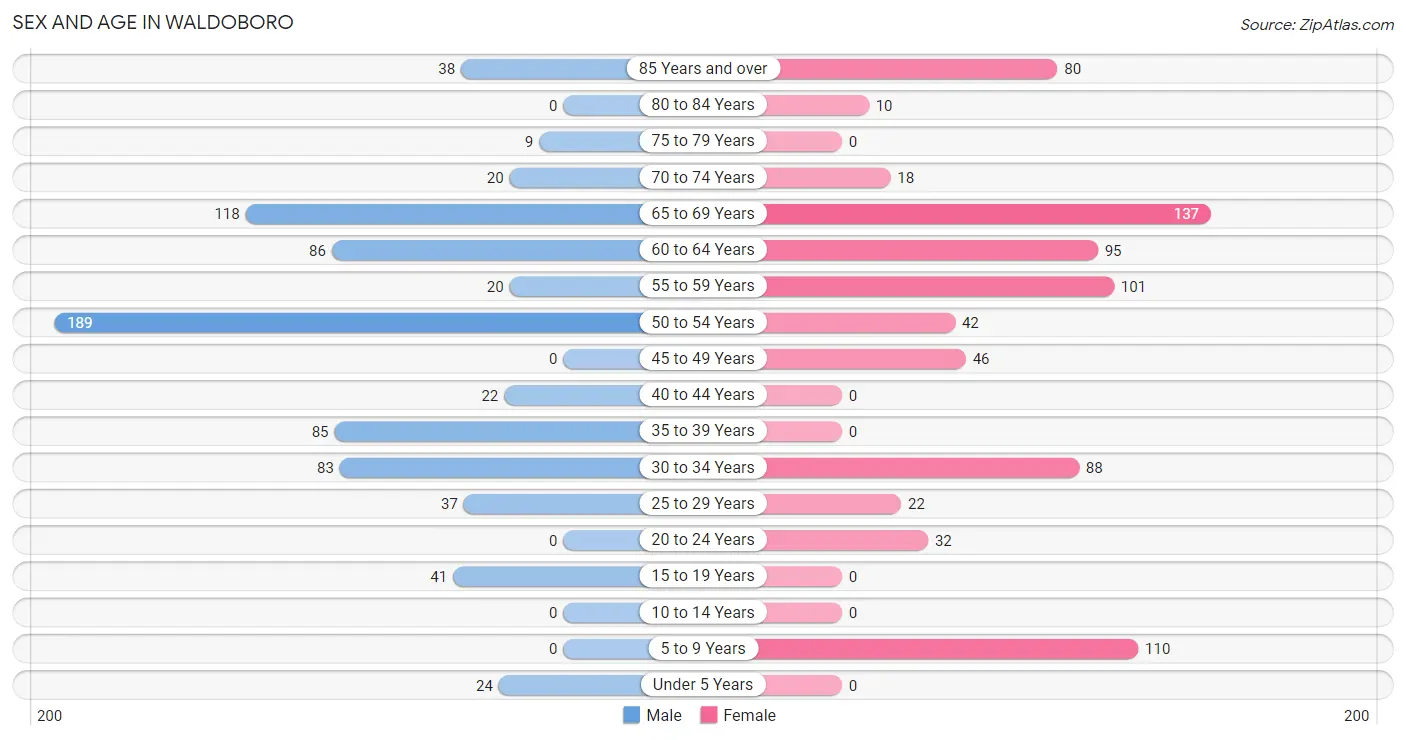
The most populous age groups in Waldoboro are 50 to 54 Years (189 | 24.5%) for men and 65 to 69 Years (137 | 17.5%) for women.
| Age Bracket | Male | Female |
| Under 5 Years | 24 (3.1%) | 0 (0.0%) |
| 5 to 9 Years | 0 (0.0%) | 110 (14.1%) |
| 10 to 14 Years | 0 (0.0%) | 0 (0.0%) |
| 15 to 19 Years | 41 (5.3%) | 0 (0.0%) |
| 20 to 24 Years | 0 (0.0%) | 32 (4.1%) |
| 25 to 29 Years | 37 (4.8%) | 22 (2.8%) |
| 30 to 34 Years | 83 (10.7%) | 88 (11.3%) |
| 35 to 39 Years | 85 (11.0%) | 0 (0.0%) |
| 40 to 44 Years | 22 (2.9%) | 0 (0.0%) |
| 45 to 49 Years | 0 (0.0%) | 46 (5.9%) |
| 50 to 54 Years | 189 (24.5%) | 42 (5.4%) |
| 55 to 59 Years | 20 (2.6%) | 101 (12.9%) |
| 60 to 64 Years | 86 (11.1%) | 95 (12.2%) |
| 65 to 69 Years | 118 (15.3%) | 137 (17.5%) |
| 70 to 74 Years | 20 (2.6%) | 18 (2.3%) |
| 75 to 79 Years | 9 (1.2%) | 0 (0.0%) |
| 80 to 84 Years | 0 (0.0%) | 10 (1.3%) |
| 85 Years and over | 38 (4.9%) | 80 (10.2%) |
| Total | 772 (100.0%) | 781 (100.0%) |
Families and Households in Waldoboro
Median Family Size in Waldoboro
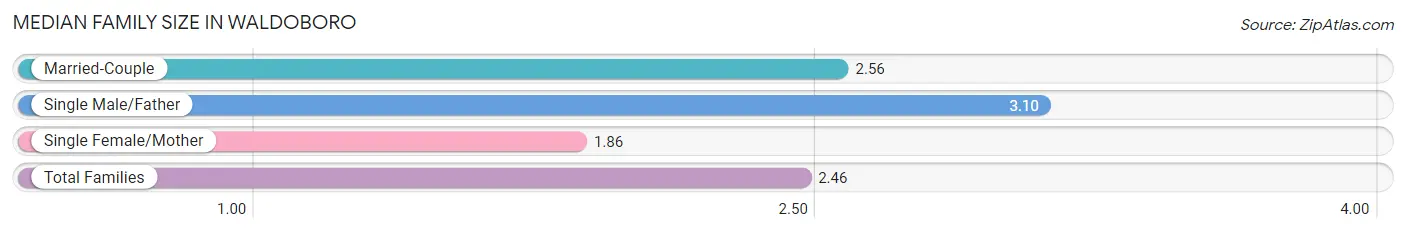
The median family size in Waldoboro is 2.46 persons per family, with single male/father families (20 | 4.9%) accounting for the largest median family size of 3.1 persons per family. On the other hand, single female/mother families (77 | 19.0%) represent the smallest median family size with 1.86 persons per family.
| Family Type | # Families | Family Size |
| Married-Couple | 308 (76.0%) | 2.56 |
| Single Male/Father | 20 (4.9%) | 3.10 |
| Single Female/Mother | 77 (19.0%) | 1.86 |
| Total Families | 405 (100.0%) | 2.46 |
Median Household Size in Waldoboro
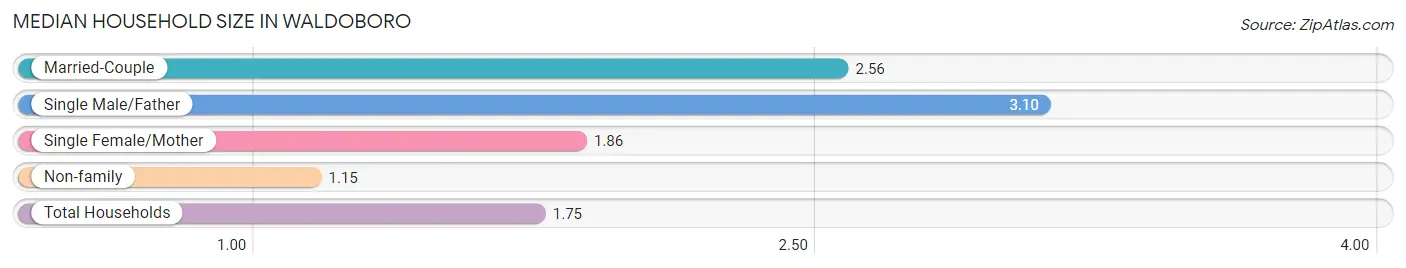
The median household size in Waldoboro is 1.75 persons per household, with single male/father households (20 | 2.3%) accounting for the largest median household size of 3.1 persons per household. non-family households (478 | 54.1%) represent the smallest median household size with 1.15 persons per household.
| Household Type | # Households | Household Size |
| Married-Couple | 308 (34.9%) | 2.56 |
| Single Male/Father | 20 (2.3%) | 3.10 |
| Single Female/Mother | 77 (8.7%) | 1.86 |
| Non-family | 478 (54.1%) | 1.15 |
| Total Households | 883 (100.0%) | 1.75 |
Household Size by Marriage Status in Waldoboro
Out of a total of 883 households in Waldoboro, 405 (45.9%) are family households, while 478 (54.1%) are nonfamily households. The most numerous type of family households are 2-person households, comprising 286, and the most common type of nonfamily households are 1-person households, comprising 418.
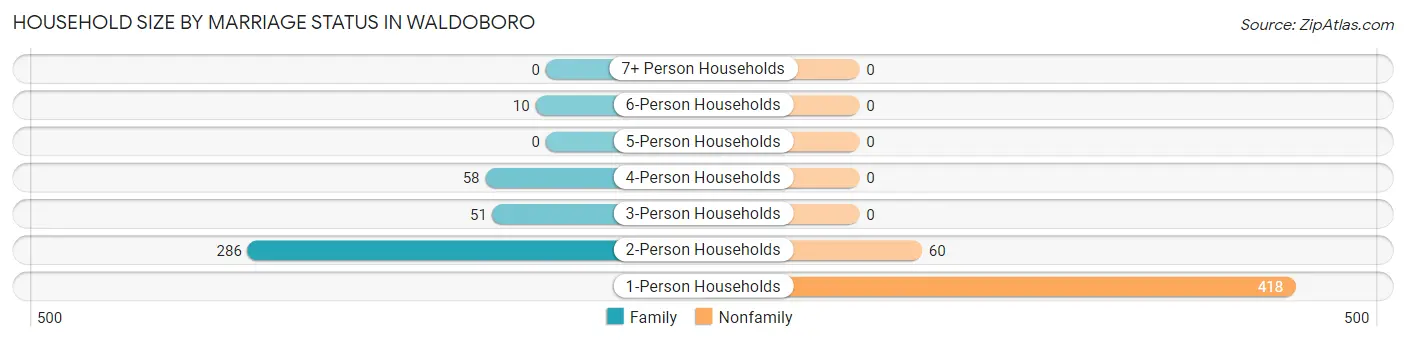
| Household Size | Family Households | Nonfamily Households |
| 1-Person Households | - | 418 (47.3%) |
| 2-Person Households | 286 (32.4%) | 60 (6.8%) |
| 3-Person Households | 51 (5.8%) | 0 (0.0%) |
| 4-Person Households | 58 (6.6%) | 0 (0.0%) |
| 5-Person Households | 0 (0.0%) | 0 (0.0%) |
| 6-Person Households | 10 (1.1%) | 0 (0.0%) |
| 7+ Person Households | 0 (0.0%) | 0 (0.0%) |
| Total | 405 (45.9%) | 478 (54.1%) |
Female Fertility in Waldoboro
Fertility by Age in Waldoboro
| Age Bracket | Women with Births | Births / 1,000 Women |
| 15 to 19 years | 0 (0.0%) | 0.0 |
| 20 to 34 years | 0 (0.0%) | 0.0 |
| 35 to 50 years | 0 (0.0%) | 0.0 |
| Total | 0 (0.0%) | 0.0 |
Fertility by Age by Marriage Status in Waldoboro
| Age Bracket | Married | Unmarried |
| 15 to 19 years | 0 (0.0%) | 0 (0.0%) |
| 20 to 34 years | 0 (0.0%) | 0 (0.0%) |
| 35 to 50 years | 0 (0.0%) | 0 (0.0%) |
| Total | 0 (0.0%) | 0 (0.0%) |
Fertility by Education in Waldoboro
| Educational Attainment | Women with Births | Births / 1,000 Women |
| Less than High School | 0 (0.0%) | 0.0 |
| High School Diploma | 0 (0.0%) | 0.0 |
| College or Associate's Degree | 0 (0.0%) | 0.0 |
| Bachelor's Degree | 0 (0.0%) | 0.0 |
| Graduate Degree | 0 (0.0%) | 0.0 |
| Total | 0 (0.0%) | 0.0 |
Fertility by Education by Marriage Status in Waldoboro
| Educational Attainment | Married | Unmarried |
| Less than High School | 0 (0.0%) | 0 (0.0%) |
| High School Diploma | 0 (0.0%) | 0 (0.0%) |
| College or Associate's Degree | 0 (0.0%) | 0 (0.0%) |
| Bachelor's Degree | 0 (0.0%) | 0 (0.0%) |
| Graduate Degree | 0 (0.0%) | 0 (0.0%) |
| Total | 0 (0.0%) | 0 (0.0%) |
Employment Characteristics in Waldoboro
Employment by Class of Employer in Waldoboro
Among the 747 employed individuals in Waldoboro, private company employees (304 | 40.7%), state government employees (115 | 15.4%), and self-employed (not incorporated) (97 | 13.0%) make up the most common classes of employment.
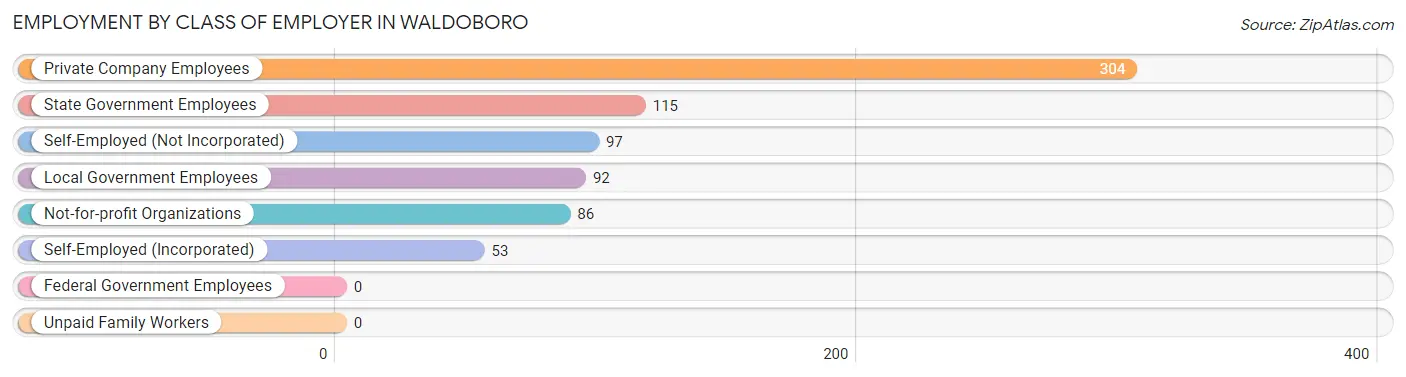
| Employer Class | # Employees | % Employees |
| Private Company Employees | 304 | 40.7% |
| Self-Employed (Incorporated) | 53 | 7.1% |
| Self-Employed (Not Incorporated) | 97 | 13.0% |
| Not-for-profit Organizations | 86 | 11.5% |
| Local Government Employees | 92 | 12.3% |
| State Government Employees | 115 | 15.4% |
| Federal Government Employees | 0 | 0.0% |
| Unpaid Family Workers | 0 | 0.0% |
| Total | 747 | 100.0% |
Employment Status by Age in Waldoboro
According to the labor force statistics for Waldoboro, out of the total population over 16 years of age (1,419), 56.1% or 796 individuals are in the labor force, with 4.0% or 32 of them unemployed. The age group with the highest labor force participation rate is 20 to 24 years, with 100.0% or 32 individuals in the labor force. Within the labor force, the 20 to 24 years age range has the highest percentage of unemployed individuals, with 100.0% or 32 of them being unemployed.
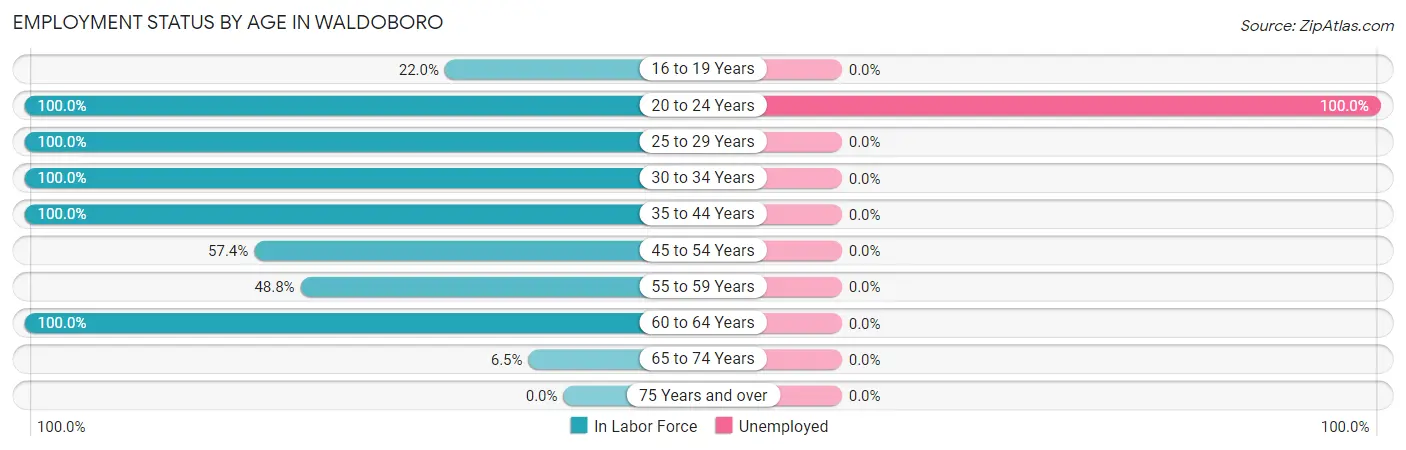
| Age Bracket | In Labor Force | Unemployed |
| 16 to 19 Years | 9 (22.0%) | 0 (0.0%) |
| 20 to 24 Years | 32 (100.0%) | 32 (100.0%) |
| 25 to 29 Years | 59 (100.0%) | 0 (0.0%) |
| 30 to 34 Years | 171 (100.0%) | 0 (0.0%) |
| 35 to 44 Years | 107 (100.0%) | 0 (0.0%) |
| 45 to 54 Years | 159 (57.4%) | 0 (0.0%) |
| 55 to 59 Years | 59 (48.8%) | 0 (0.0%) |
| 60 to 64 Years | 181 (100.0%) | 0 (0.0%) |
| 65 to 74 Years | 19 (6.5%) | 0 (0.0%) |
| 75 Years and over | 0 (0.0%) | 0 (0.0%) |
| Total | 796 (56.1%) | 32 (4.0%) |
Employment Status by Educational Attainment in Waldoboro
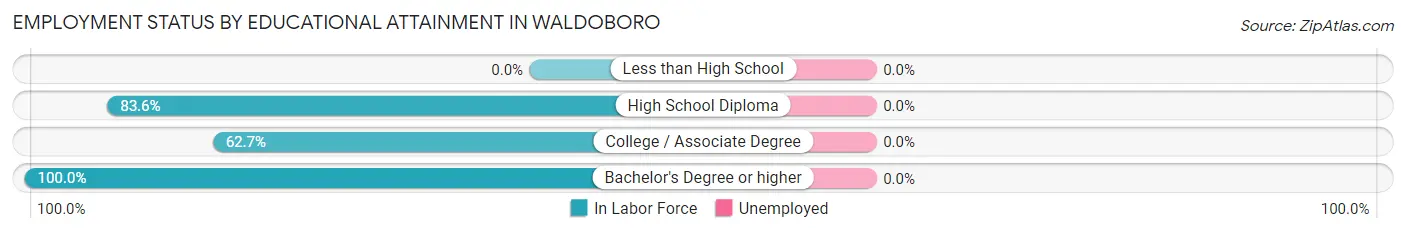
| Educational Attainment | In Labor Force | Unemployed |
| Less than High School | 0 (0.0%) | 0 (0.0%) |
| High School Diploma | 209 (83.6%) | 0 (0.0%) |
| College / Associate Degree | 202 (62.7%) | 0 (0.0%) |
| Bachelor's Degree or higher | 325 (100.0%) | 0 (0.0%) |
| Total | 736 (80.3%) | 0 (0.0%) |
Employment Occupations by Sex in Waldoboro
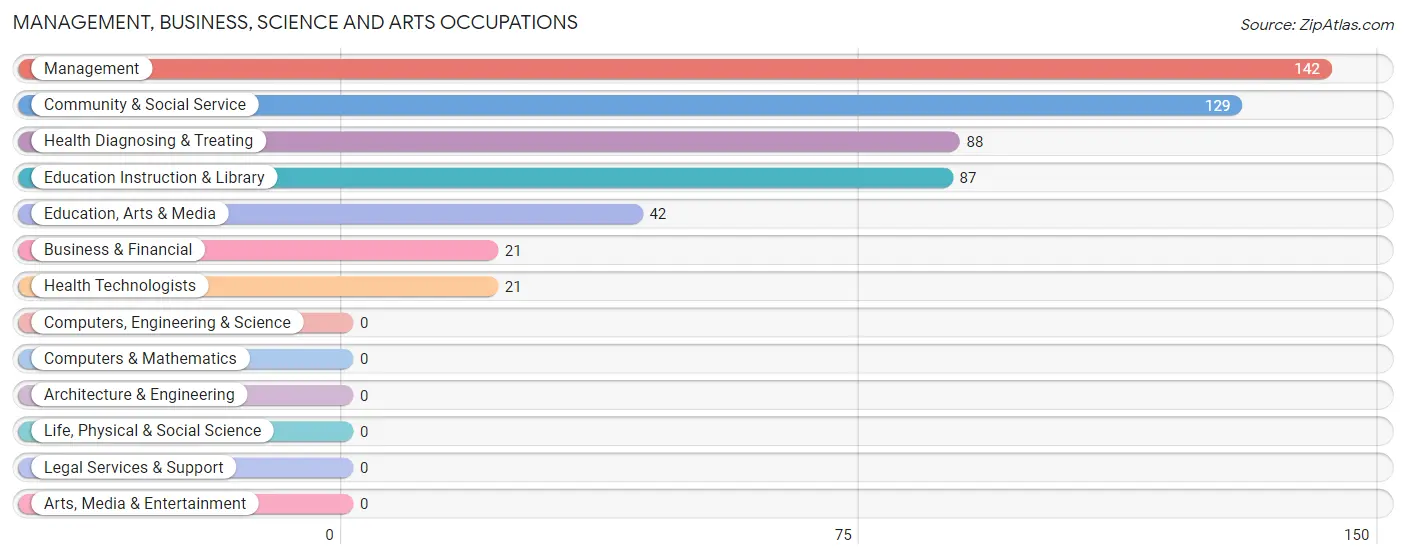
Management, Business, Science and Arts Occupations
The most common Management, Business, Science and Arts occupations in Waldoboro are Management (142 | 18.6%), Community & Social Service (129 | 16.9%), Health Diagnosing & Treating (88 | 11.5%), Education Instruction & Library (87 | 11.4%), and Education, Arts & Media (42 | 5.5%).
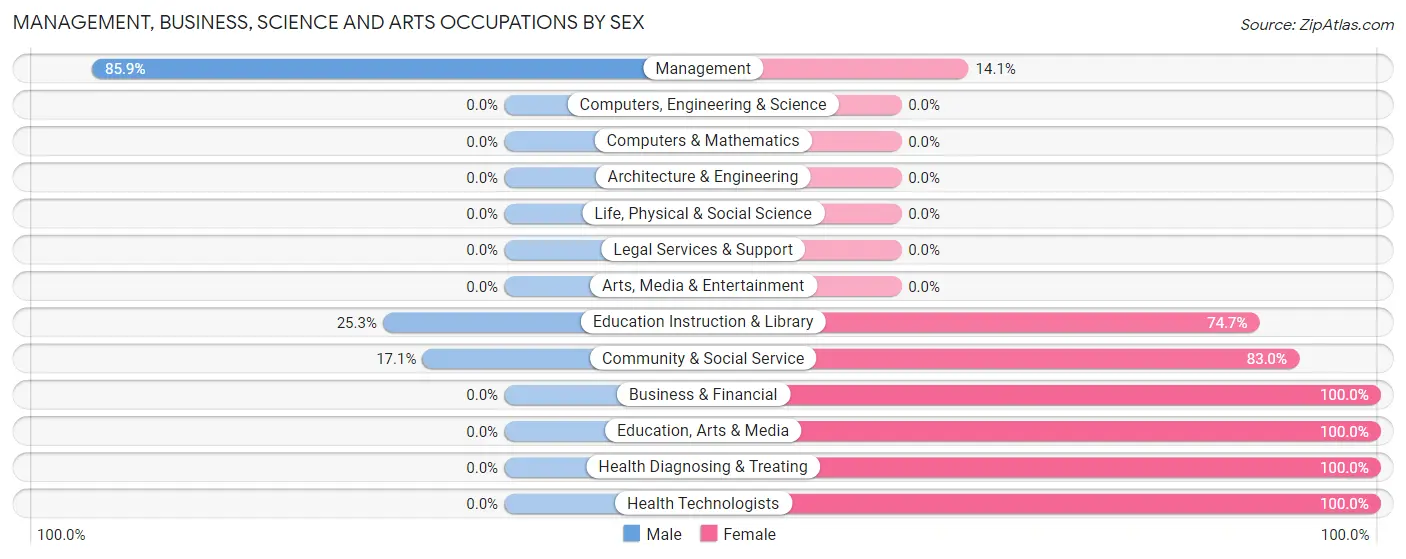
Management, Business, Science and Arts Occupations by Sex
Within the Management, Business, Science and Arts occupations in Waldoboro, the most male-oriented occupations are Management (85.9%), Education Instruction & Library (25.3%), and Community & Social Service (17.1%), while the most female-oriented occupations are Business & Financial (100.0%), Education, Arts & Media (100.0%), and Health Diagnosing & Treating (100.0%).
| Occupation | Male | Female |
| Management | 122 (85.9%) | 20 (14.1%) |
| Business & Financial | 0 (0.0%) | 21 (100.0%) |
| Computers, Engineering & Science | 0 (0.0%) | 0 (0.0%) |
| Computers & Mathematics | 0 (0.0%) | 0 (0.0%) |
| Architecture & Engineering | 0 (0.0%) | 0 (0.0%) |
| Life, Physical & Social Science | 0 (0.0%) | 0 (0.0%) |
| Community & Social Service | 22 (17.1%) | 107 (83.0%) |
| Education, Arts & Media | 0 (0.0%) | 42 (100.0%) |
| Legal Services & Support | 0 (0.0%) | 0 (0.0%) |
| Education Instruction & Library | 22 (25.3%) | 65 (74.7%) |
| Arts, Media & Entertainment | 0 (0.0%) | 0 (0.0%) |
| Health Diagnosing & Treating | 0 (0.0%) | 88 (100.0%) |
| Health Technologists | 0 (0.0%) | 21 (100.0%) |
| Total (Category) | 144 (37.9%) | 236 (62.1%) |
| Total (Overall) | 412 (53.9%) | 352 (46.1%) |
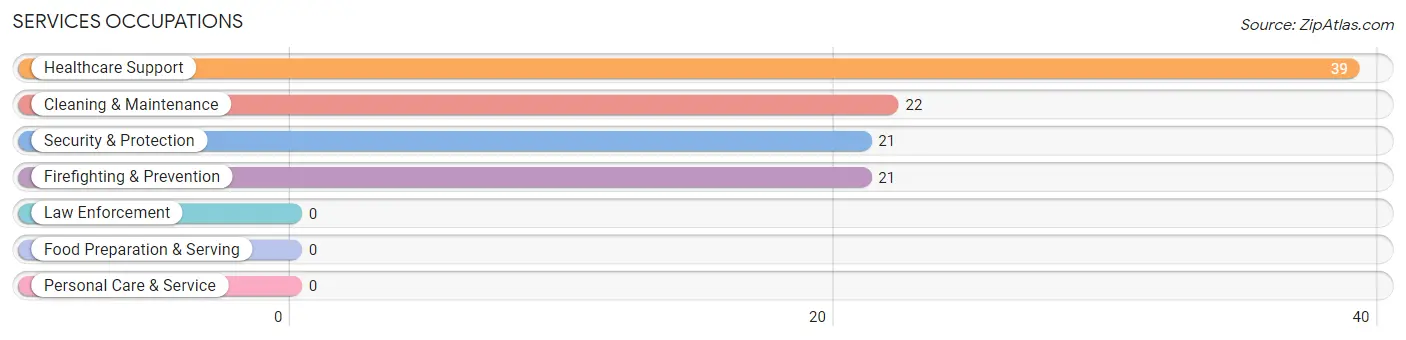
Services Occupations
The most common Services occupations in Waldoboro are Healthcare Support (39 | 5.1%), Cleaning & Maintenance (22 | 2.9%), Security & Protection (21 | 2.8%), and Firefighting & Prevention (21 | 2.8%).
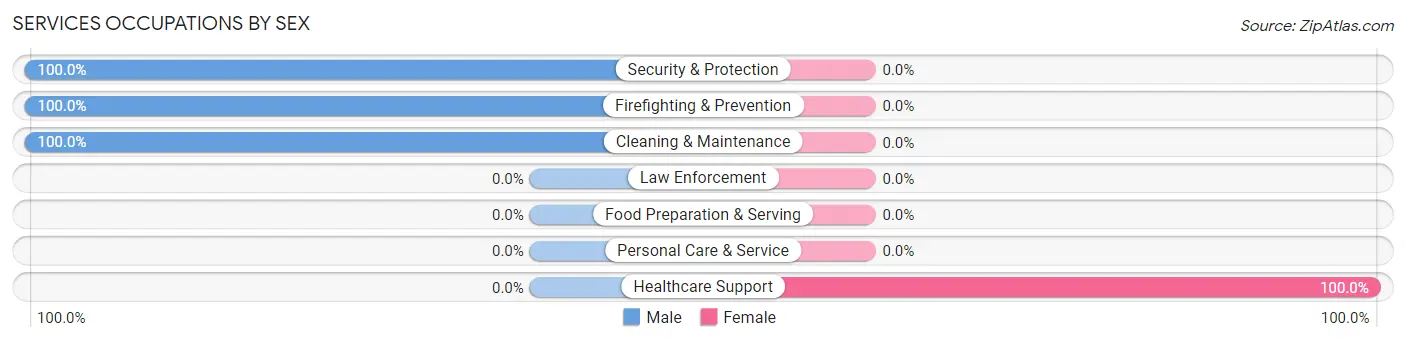
Services Occupations by Sex
| Occupation | Male | Female |
| Healthcare Support | 0 (0.0%) | 39 (100.0%) |
| Security & Protection | 21 (100.0%) | 0 (0.0%) |
| Firefighting & Prevention | 21 (100.0%) | 0 (0.0%) |
| Law Enforcement | 0 (0.0%) | 0 (0.0%) |
| Food Preparation & Serving | 0 (0.0%) | 0 (0.0%) |
| Cleaning & Maintenance | 22 (100.0%) | 0 (0.0%) |
| Personal Care & Service | 0 (0.0%) | 0 (0.0%) |
| Total (Category) | 43 (52.4%) | 39 (47.6%) |
| Total (Overall) | 412 (53.9%) | 352 (46.1%) |
Sales and Office Occupations
The most common Sales and Office occupations in Waldoboro are Sales & Related (158 | 20.7%), and Office & Administration (27 | 3.5%).
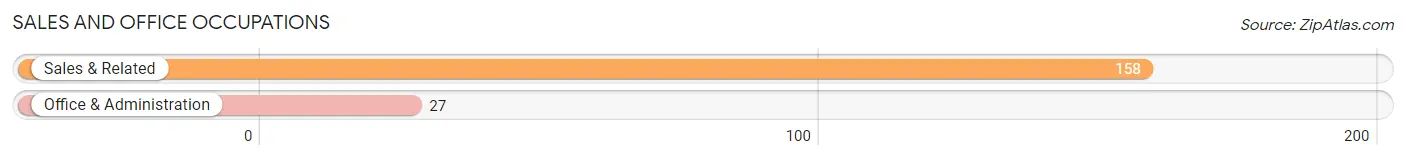
Sales and Office Occupations by Sex

| Occupation | Male | Female |
| Sales & Related | 108 (68.3%) | 50 (31.7%) |
| Office & Administration | 0 (0.0%) | 27 (100.0%) |
| Total (Category) | 108 (58.4%) | 77 (41.6%) |
| Total (Overall) | 412 (53.9%) | 352 (46.1%) |
Natural Resources, Construction and Maintenance Occupations
The most common Natural Resources, Construction and Maintenance occupations in Waldoboro are Construction & Extraction (37 | 4.8%), and Farming, Fishing & Forestry (36 | 4.7%).
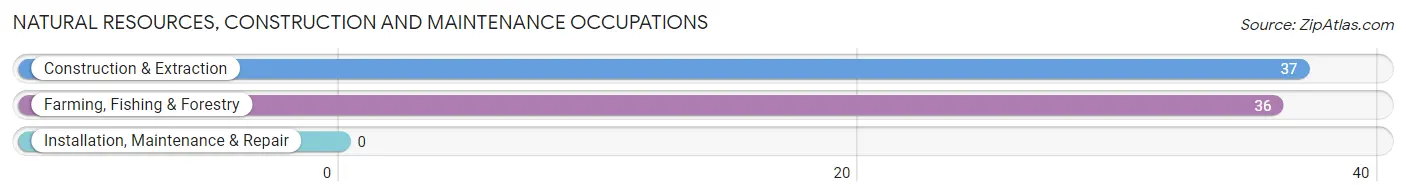
Natural Resources, Construction and Maintenance Occupations by Sex

| Occupation | Male | Female |
| Farming, Fishing & Forestry | 36 (100.0%) | 0 (0.0%) |
| Construction & Extraction | 37 (100.0%) | 0 (0.0%) |
| Installation, Maintenance & Repair | 0 (0.0%) | 0 (0.0%) |
| Total (Category) | 73 (100.0%) | 0 (0.0%) |
| Total (Overall) | 412 (53.9%) | 352 (46.1%) |
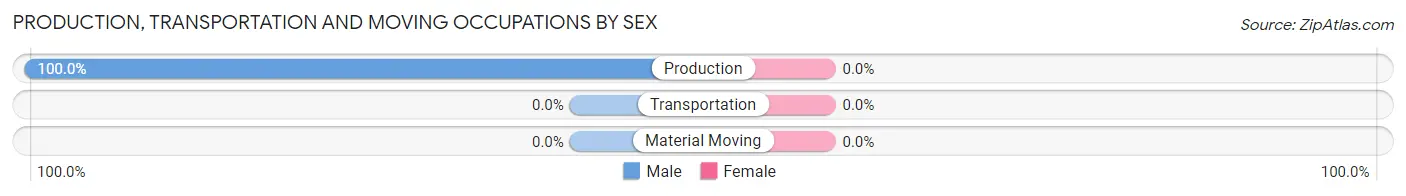
Production, Transportation and Moving Occupations
The most common Production, Transportation and Moving occupations in Waldoboro are , and Production (44 | 5.8%).

Production, Transportation and Moving Occupations by Sex
| Occupation | Male | Female |
| Production | 44 (100.0%) | 0 (0.0%) |
| Transportation | 0 (0.0%) | 0 (0.0%) |
| Material Moving | 0 (0.0%) | 0 (0.0%) |
| Total (Category) | 44 (100.0%) | 0 (0.0%) |
| Total (Overall) | 412 (53.9%) | 352 (46.1%) |
Employment Industries by Sex in Waldoboro
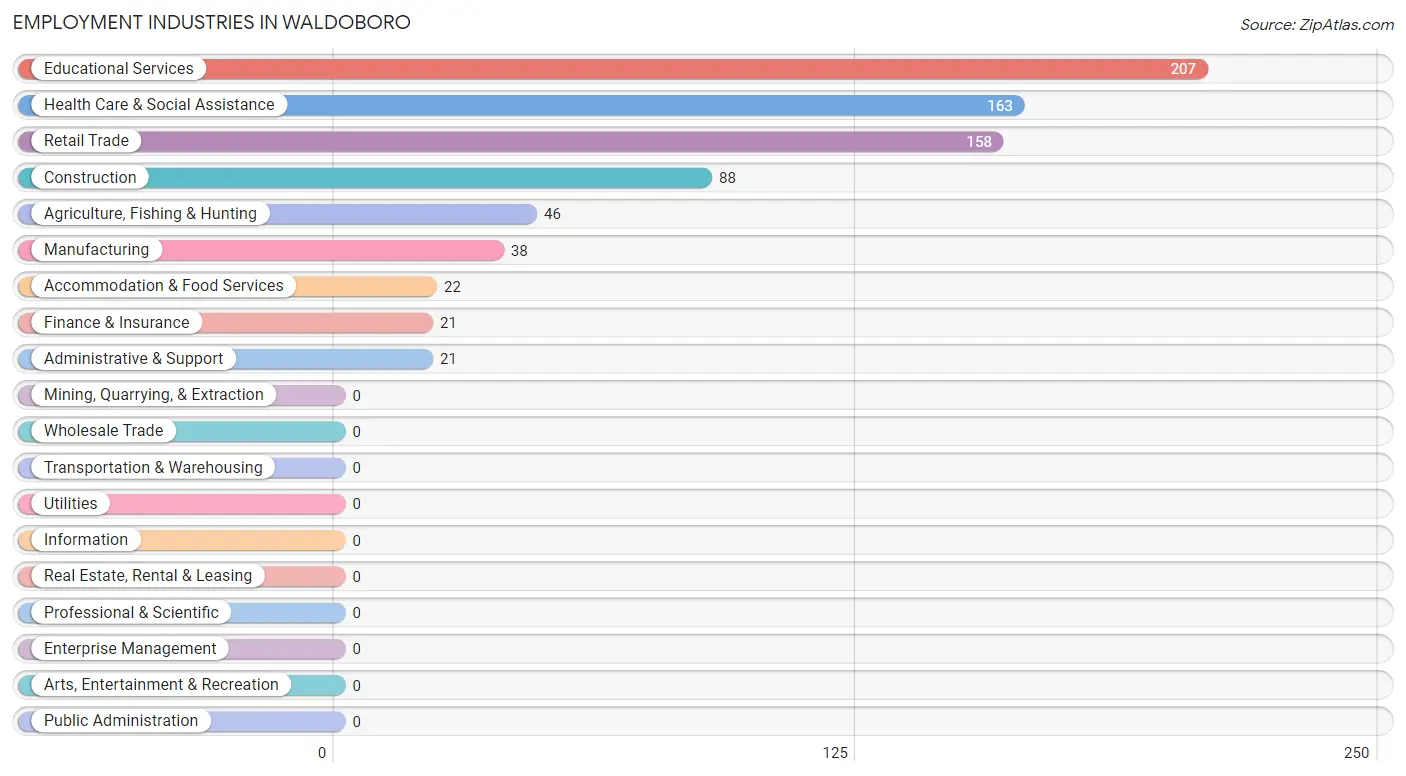
Employment Industries in Waldoboro
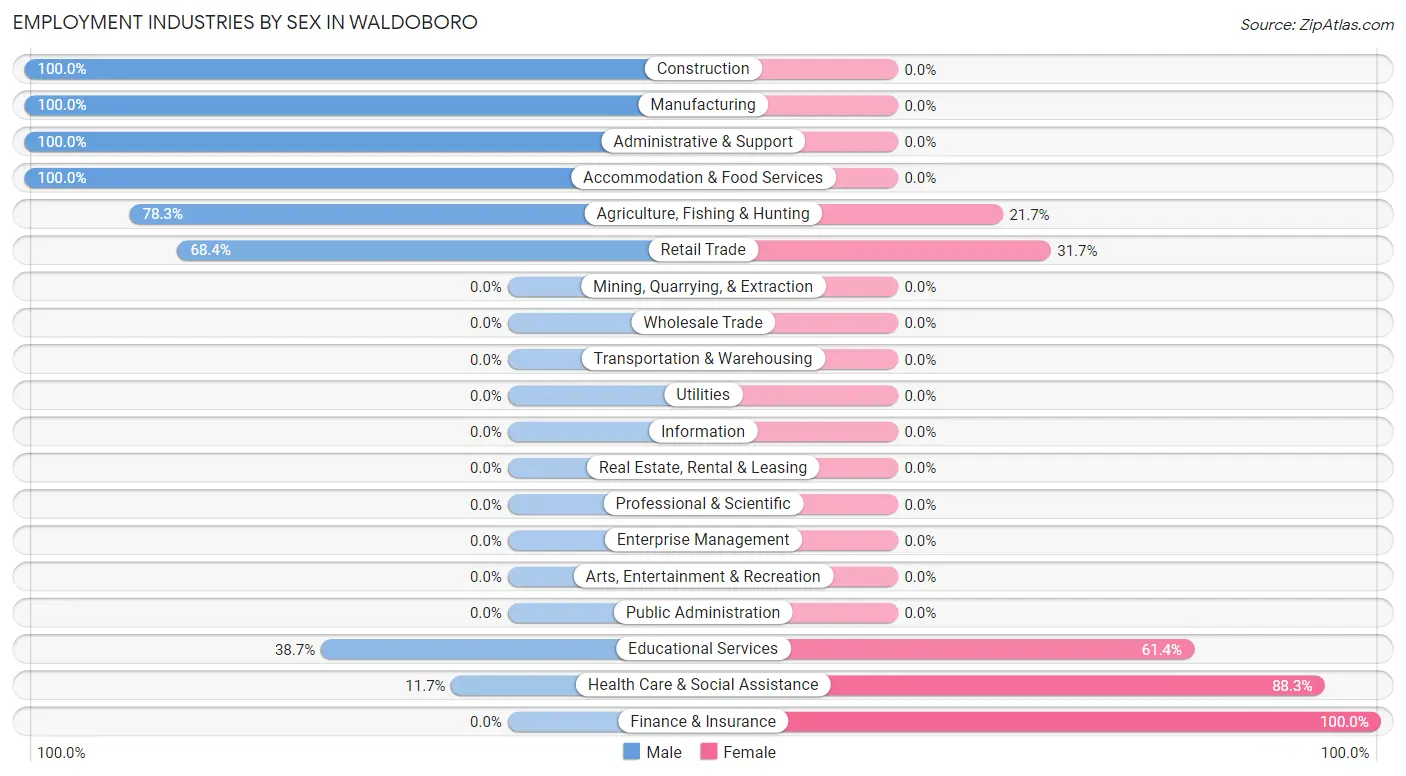
The major employment industries in Waldoboro include Educational Services (207 | 27.1%), Health Care & Social Assistance (163 | 21.3%), Retail Trade (158 | 20.7%), Construction (88 | 11.5%), and Agriculture, Fishing & Hunting (46 | 6.0%).
Employment Industries by Sex in Waldoboro
The Waldoboro industries that see more men than women are Construction (100.0%), Manufacturing (100.0%), and Administrative & Support (100.0%), whereas the industries that tend to have a higher number of women are Finance & Insurance (100.0%), Health Care & Social Assistance (88.3%), and Educational Services (61.4%).
| Industry | Male | Female |
| Agriculture, Fishing & Hunting | 36 (78.3%) | 10 (21.7%) |
| Mining, Quarrying, & Extraction | 0 (0.0%) | 0 (0.0%) |
| Construction | 88 (100.0%) | 0 (0.0%) |
| Manufacturing | 38 (100.0%) | 0 (0.0%) |
| Wholesale Trade | 0 (0.0%) | 0 (0.0%) |
| Retail Trade | 108 (68.3%) | 50 (31.7%) |
| Transportation & Warehousing | 0 (0.0%) | 0 (0.0%) |
| Utilities | 0 (0.0%) | 0 (0.0%) |
| Information | 0 (0.0%) | 0 (0.0%) |
| Finance & Insurance | 0 (0.0%) | 21 (100.0%) |
| Real Estate, Rental & Leasing | 0 (0.0%) | 0 (0.0%) |
| Professional & Scientific | 0 (0.0%) | 0 (0.0%) |
| Enterprise Management | 0 (0.0%) | 0 (0.0%) |
| Administrative & Support | 21 (100.0%) | 0 (0.0%) |
| Educational Services | 80 (38.7%) | 127 (61.4%) |
| Health Care & Social Assistance | 19 (11.7%) | 144 (88.3%) |
| Arts, Entertainment & Recreation | 0 (0.0%) | 0 (0.0%) |
| Accommodation & Food Services | 22 (100.0%) | 0 (0.0%) |
| Public Administration | 0 (0.0%) | 0 (0.0%) |
| Total | 412 (53.9%) | 352 (46.1%) |
Education in Waldoboro
School Enrollment in Waldoboro
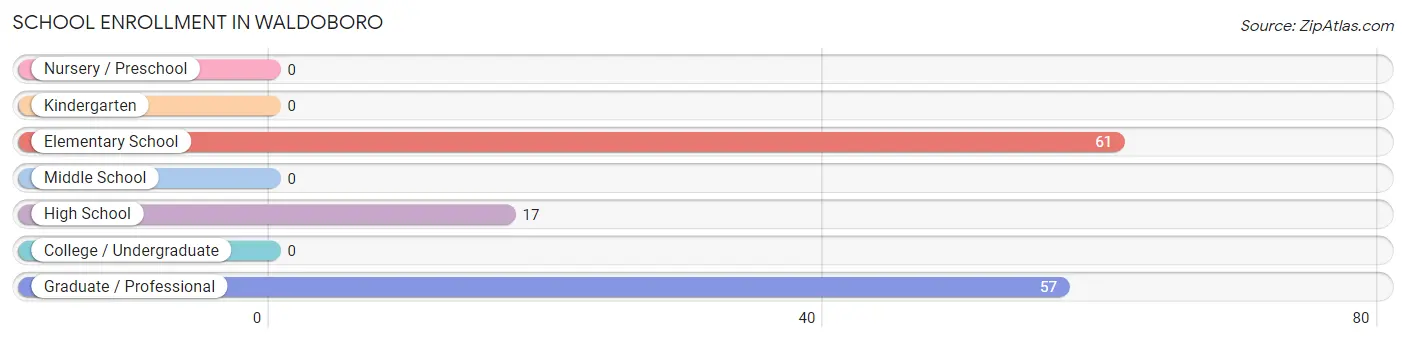
The most common levels of schooling among the 135 students in Waldoboro are elementary school (61 | 45.2%), graduate / professional (57 | 42.2%), and high school (17 | 12.6%).
| School Level | # Students | % Students |
| Nursery / Preschool | 0 | 0.0% |
| Kindergarten | 0 | 0.0% |
| Elementary School | 61 | 45.2% |
| Middle School | 0 | 0.0% |
| High School | 17 | 12.6% |
| College / Undergraduate | 0 | 0.0% |
| Graduate / Professional | 57 | 42.2% |
| Total | 135 | 100.0% |
School Enrollment by Age by Funding Source in Waldoboro
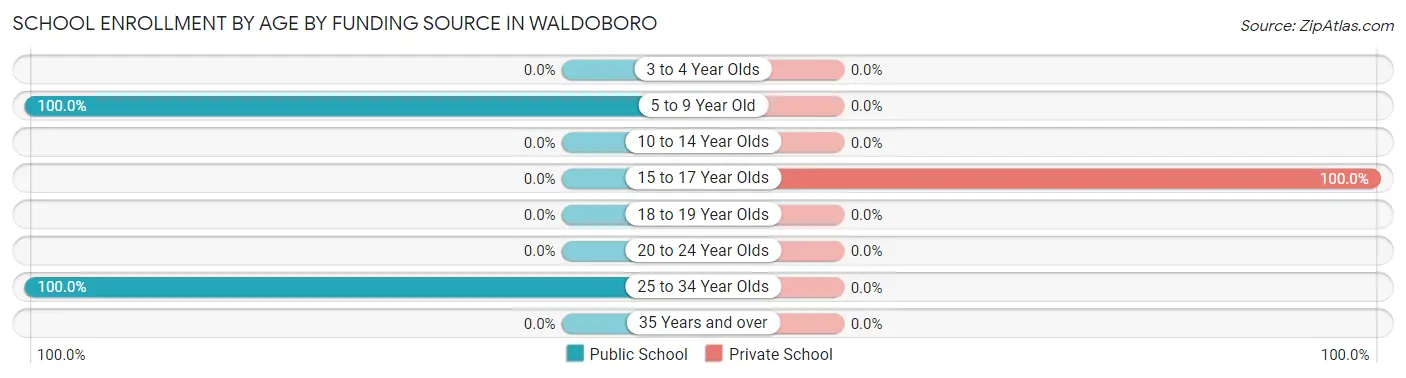
Out of a total of 135 students who are enrolled in schools in Waldoboro, 17 (12.6%) attend a private institution, while the remaining 118 (87.4%) are enrolled in public schools. The age group of 15 to 17 year olds has the highest likelihood of being enrolled in private schools, with 17 (100.0% in the age bracket) enrolled. Conversely, the age group of 5 to 9 year old has the lowest likelihood of being enrolled in a private school, with 61 (100.0% in the age bracket) attending a public institution.
| Age Bracket | Public School | Private School |
| 3 to 4 Year Olds | 0 (0.0%) | 0 (0.0%) |
| 5 to 9 Year Old | 61 (100.0%) | 0 (0.0%) |
| 10 to 14 Year Olds | 0 (0.0%) | 0 (0.0%) |
| 15 to 17 Year Olds | 0 (0.0%) | 17 (100.0%) |
| 18 to 19 Year Olds | 0 (0.0%) | 0 (0.0%) |
| 20 to 24 Year Olds | 0 (0.0%) | 0 (0.0%) |
| 25 to 34 Year Olds | 57 (100.0%) | 0 (0.0%) |
| 35 Years and over | 0 (0.0%) | 0 (0.0%) |
| Total | 118 (87.4%) | 17 (12.6%) |
Educational Attainment by Field of Study in Waldoboro
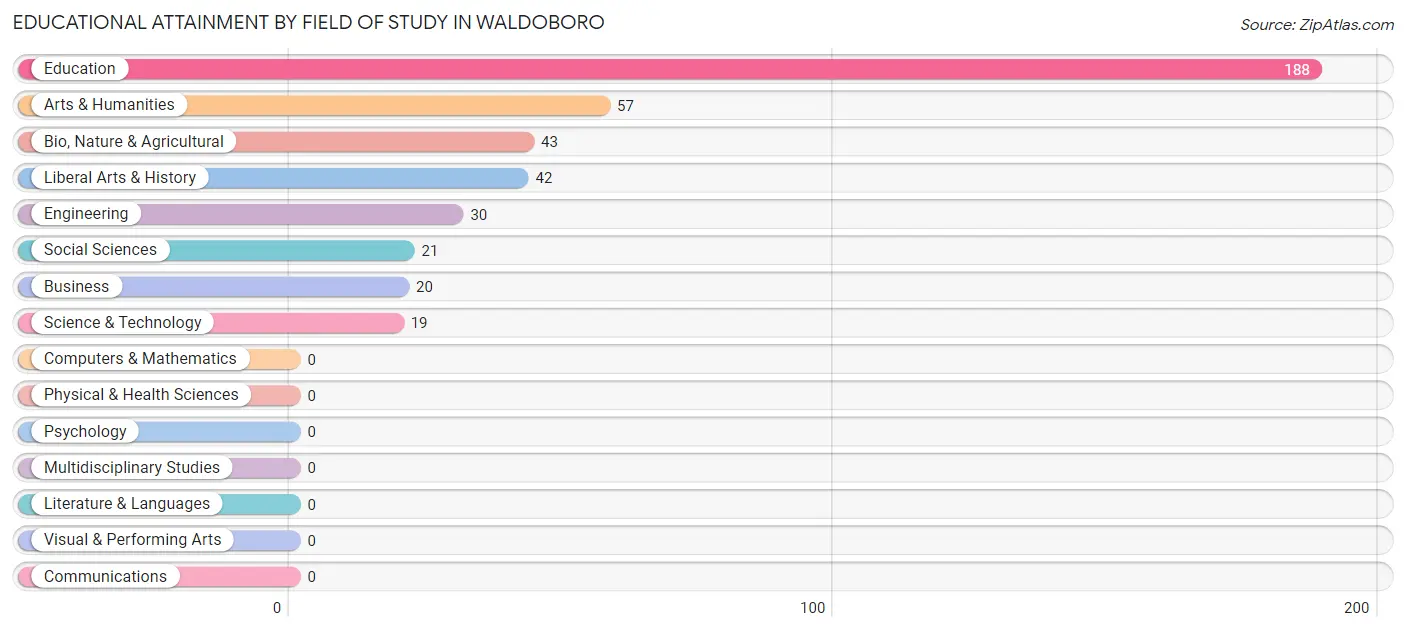
Education (188 | 44.8%), arts & humanities (57 | 13.6%), bio, nature & agricultural (43 | 10.2%), liberal arts & history (42 | 10.0%), and engineering (30 | 7.1%) are the most common fields of study among 420 individuals in Waldoboro who have obtained a bachelor's degree or higher.
| Field of Study | # Graduates | % Graduates |
| Computers & Mathematics | 0 | 0.0% |
| Bio, Nature & Agricultural | 43 | 10.2% |
| Physical & Health Sciences | 0 | 0.0% |
| Psychology | 0 | 0.0% |
| Social Sciences | 21 | 5.0% |
| Engineering | 30 | 7.1% |
| Multidisciplinary Studies | 0 | 0.0% |
| Science & Technology | 19 | 4.5% |
| Business | 20 | 4.8% |
| Education | 188 | 44.8% |
| Literature & Languages | 0 | 0.0% |
| Liberal Arts & History | 42 | 10.0% |
| Visual & Performing Arts | 0 | 0.0% |
| Communications | 0 | 0.0% |
| Arts & Humanities | 57 | 13.6% |
| Total | 420 | 100.0% |
Transportation & Commute in Waldoboro
Vehicle Availability by Sex in Waldoboro
The most prevalent vehicle ownership categories in Waldoboro are males with 2 vehicles (261, accounting for 66.1%) and females with 2 vehicles (289, making up 74.2%).
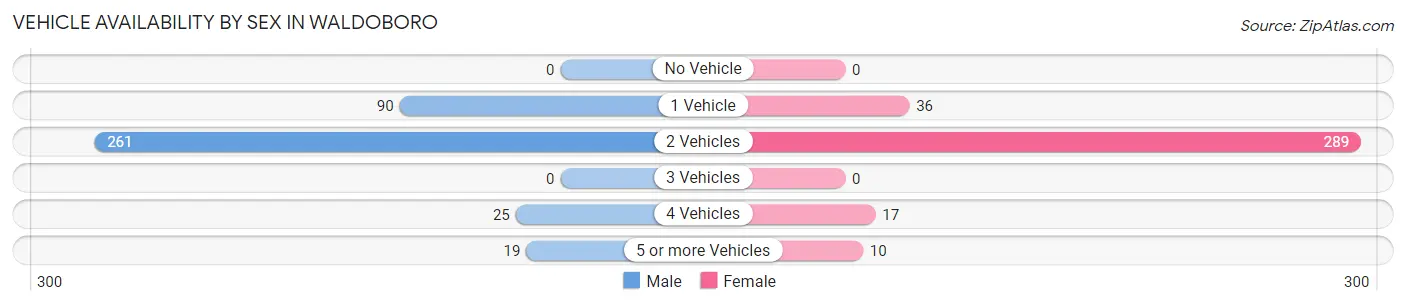
| Vehicles Available | Male | Female |
| No Vehicle | 0 (0.0%) | 0 (0.0%) |
| 1 Vehicle | 90 (22.8%) | 36 (10.2%) |
| 2 Vehicles | 261 (66.1%) | 289 (82.1%) |
| 3 Vehicles | 0 (0.0%) | 0 (0.0%) |
| 4 Vehicles | 25 (6.3%) | 17 (4.8%) |
| 5 or more Vehicles | 19 (4.8%) | 10 (2.8%) |
| Total | 395 (100.0%) | 352 (100.0%) |
Commute Time in Waldoboro
The most frequently occuring commute durations in Waldoboro are 10 to 14 minutes (119 commuters, 16.2%), 25 to 29 minutes (96 commuters, 13.0%), and 30 to 34 minutes (92 commuters, 12.5%).
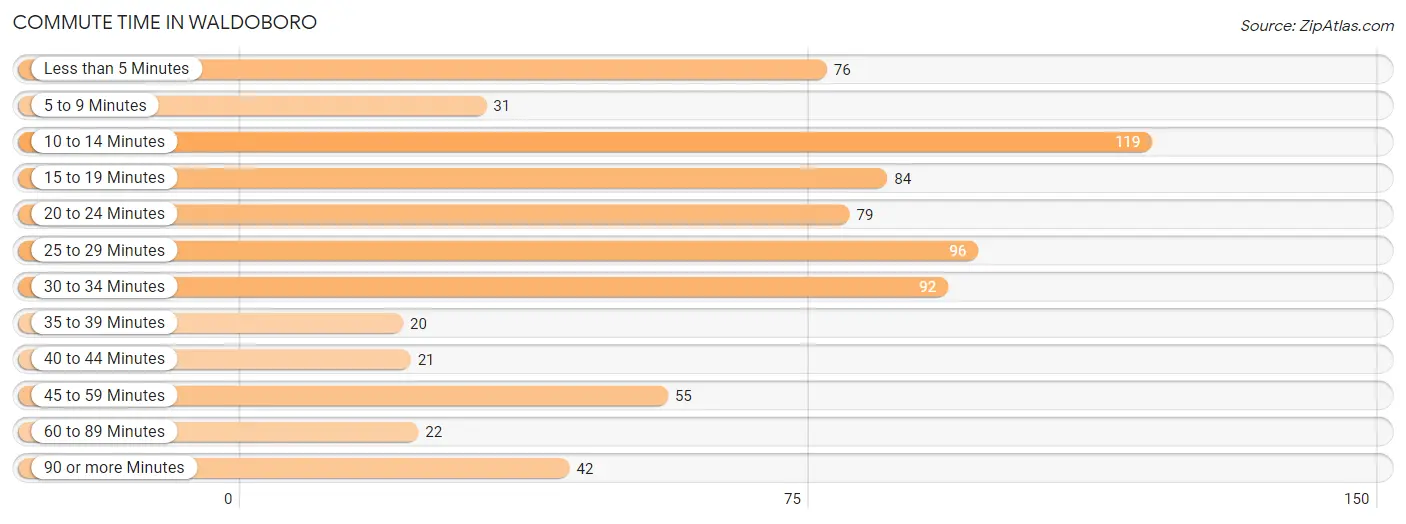
| Commute Time | # Commuters | % Commuters |
| Less than 5 Minutes | 76 | 10.3% |
| 5 to 9 Minutes | 31 | 4.2% |
| 10 to 14 Minutes | 119 | 16.2% |
| 15 to 19 Minutes | 84 | 11.4% |
| 20 to 24 Minutes | 79 | 10.7% |
| 25 to 29 Minutes | 96 | 13.0% |
| 30 to 34 Minutes | 92 | 12.5% |
| 35 to 39 Minutes | 20 | 2.7% |
| 40 to 44 Minutes | 21 | 2.9% |
| 45 to 59 Minutes | 55 | 7.5% |
| 60 to 89 Minutes | 22 | 3.0% |
| 90 or more Minutes | 42 | 5.7% |
Commute Time by Sex in Waldoboro
The most common commute times in Waldoboro are 25 to 29 minutes (96 commuters, 24.3%) for males and 15 to 19 minutes (84 commuters, 24.6%) for females.
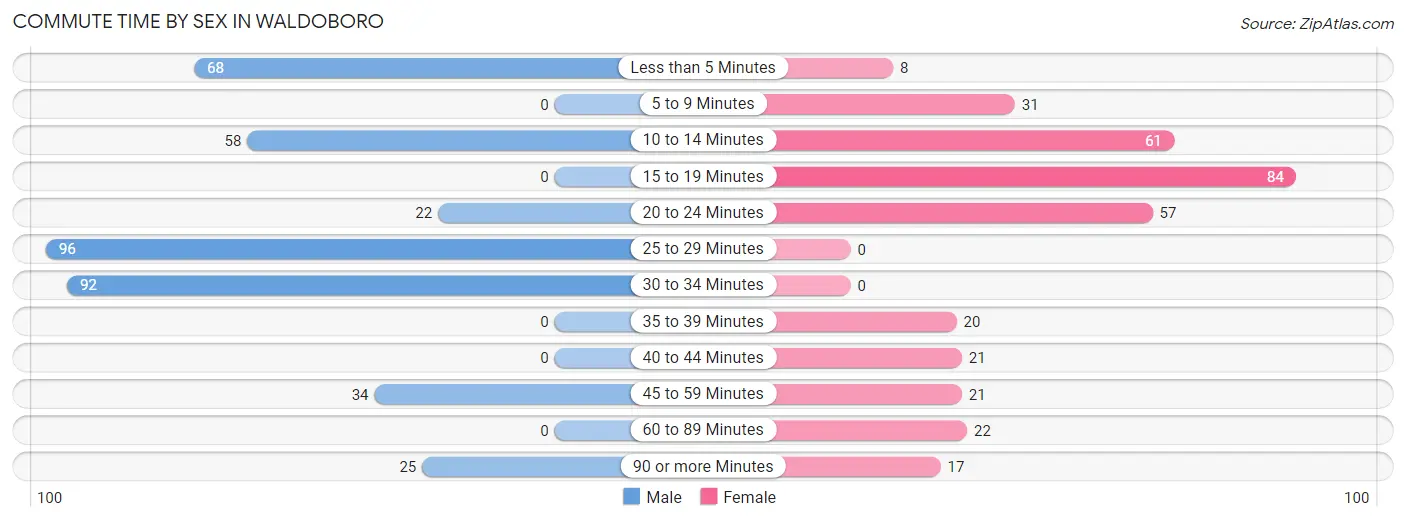
| Commute Time | Male | Female |
| Less than 5 Minutes | 68 (17.2%) | 8 (2.3%) |
| 5 to 9 Minutes | 0 (0.0%) | 31 (9.1%) |
| 10 to 14 Minutes | 58 (14.7%) | 61 (17.8%) |
| 15 to 19 Minutes | 0 (0.0%) | 84 (24.6%) |
| 20 to 24 Minutes | 22 (5.6%) | 57 (16.7%) |
| 25 to 29 Minutes | 96 (24.3%) | 0 (0.0%) |
| 30 to 34 Minutes | 92 (23.3%) | 0 (0.0%) |
| 35 to 39 Minutes | 0 (0.0%) | 20 (5.9%) |
| 40 to 44 Minutes | 0 (0.0%) | 21 (6.1%) |
| 45 to 59 Minutes | 34 (8.6%) | 21 (6.1%) |
| 60 to 89 Minutes | 0 (0.0%) | 22 (6.4%) |
| 90 or more Minutes | 25 (6.3%) | 17 (5.0%) |
Time of Departure to Work by Sex in Waldoboro
The most frequent times of departure to work in Waldoboro are 6:30 AM to 6:59 AM (120, 30.4%) for males and 7:00 AM to 7:29 AM (139, 40.6%) for females.
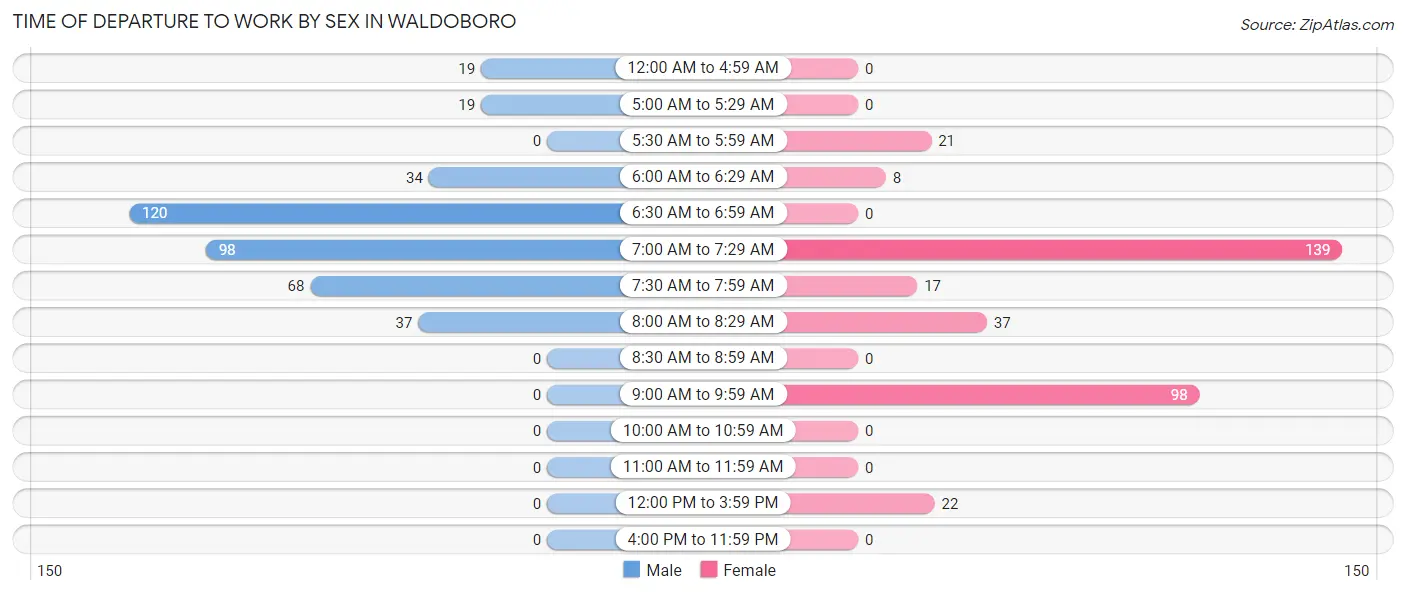
| Time of Departure | Male | Female |
| 12:00 AM to 4:59 AM | 19 (4.8%) | 0 (0.0%) |
| 5:00 AM to 5:29 AM | 19 (4.8%) | 0 (0.0%) |
| 5:30 AM to 5:59 AM | 0 (0.0%) | 21 (6.1%) |
| 6:00 AM to 6:29 AM | 34 (8.6%) | 8 (2.3%) |
| 6:30 AM to 6:59 AM | 120 (30.4%) | 0 (0.0%) |
| 7:00 AM to 7:29 AM | 98 (24.8%) | 139 (40.6%) |
| 7:30 AM to 7:59 AM | 68 (17.2%) | 17 (5.0%) |
| 8:00 AM to 8:29 AM | 37 (9.4%) | 37 (10.8%) |
| 8:30 AM to 8:59 AM | 0 (0.0%) | 0 (0.0%) |
| 9:00 AM to 9:59 AM | 0 (0.0%) | 98 (28.6%) |
| 10:00 AM to 10:59 AM | 0 (0.0%) | 0 (0.0%) |
| 11:00 AM to 11:59 AM | 0 (0.0%) | 0 (0.0%) |
| 12:00 PM to 3:59 PM | 0 (0.0%) | 22 (6.4%) |
| 4:00 PM to 11:59 PM | 0 (0.0%) | 0 (0.0%) |
| Total | 395 (100.0%) | 342 (100.0%) |
Housing Occupancy in Waldoboro
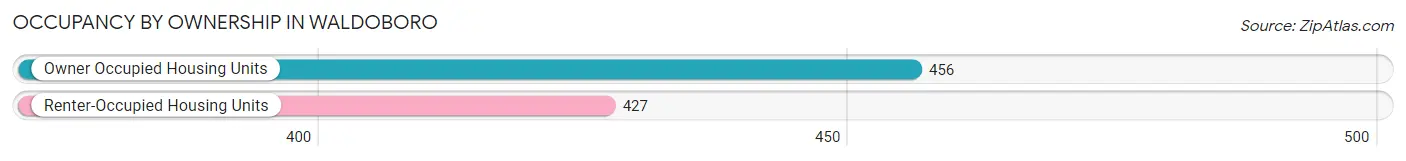
Occupancy by Ownership in Waldoboro
Of the total 883 dwellings in Waldoboro, owner-occupied units account for 456 (51.6%), while renter-occupied units make up 427 (48.4%).
| Occupancy | # Housing Units | % Housing Units |
| Owner Occupied Housing Units | 456 | 51.6% |
| Renter-Occupied Housing Units | 427 | 48.4% |
| Total Occupied Housing Units | 883 | 100.0% |
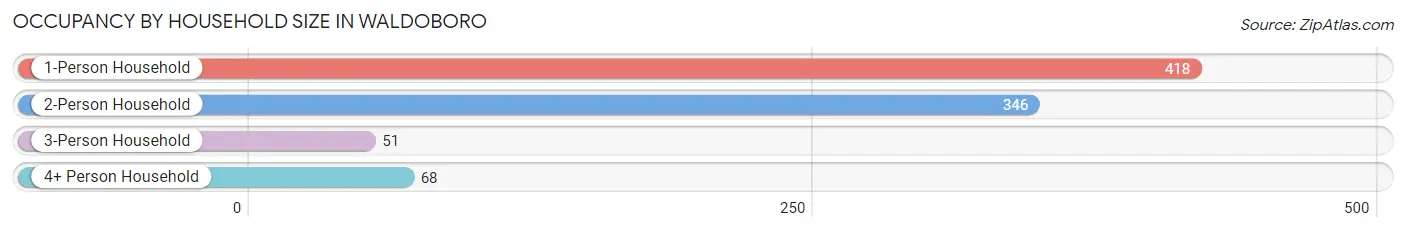
Occupancy by Household Size in Waldoboro
| Household Size | # Housing Units | % Housing Units |
| 1-Person Household | 418 | 47.3% |
| 2-Person Household | 346 | 39.2% |
| 3-Person Household | 51 | 5.8% |
| 4+ Person Household | 68 | 7.7% |
| Total Housing Units | 883 | 100.0% |
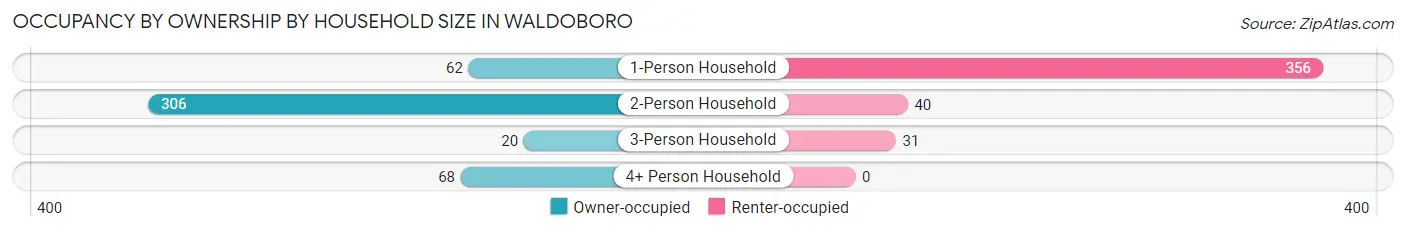
Occupancy by Ownership by Household Size in Waldoboro
| Household Size | Owner-occupied | Renter-occupied |
| 1-Person Household | 62 (14.8%) | 356 (85.2%) |
| 2-Person Household | 306 (88.4%) | 40 (11.6%) |
| 3-Person Household | 20 (39.2%) | 31 (60.8%) |
| 4+ Person Household | 68 (100.0%) | 0 (0.0%) |
| Total Housing Units | 456 (51.6%) | 427 (48.4%) |
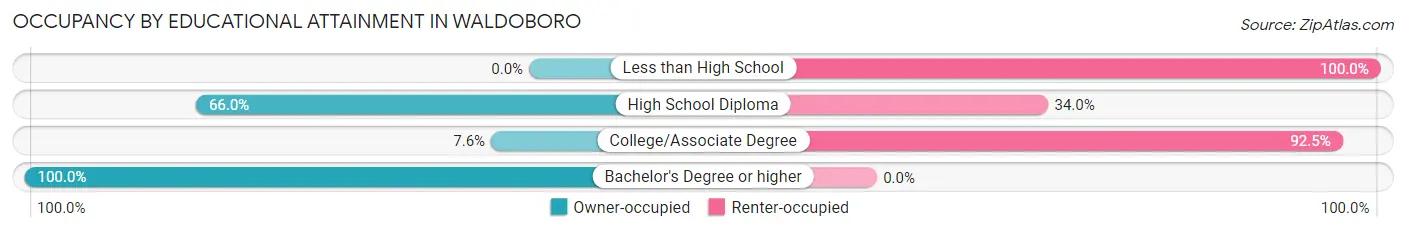
Occupancy by Educational Attainment in Waldoboro
| Household Size | Owner-occupied | Renter-occupied |
| Less than High School | 0 (0.0%) | 47 (100.0%) |
| High School Diploma | 239 (66.0%) | 123 (34.0%) |
| College/Associate Degree | 21 (7.5%) | 257 (92.4%) |
| Bachelor's Degree or higher | 196 (100.0%) | 0 (0.0%) |
Occupancy by Age of Householder in Waldoboro
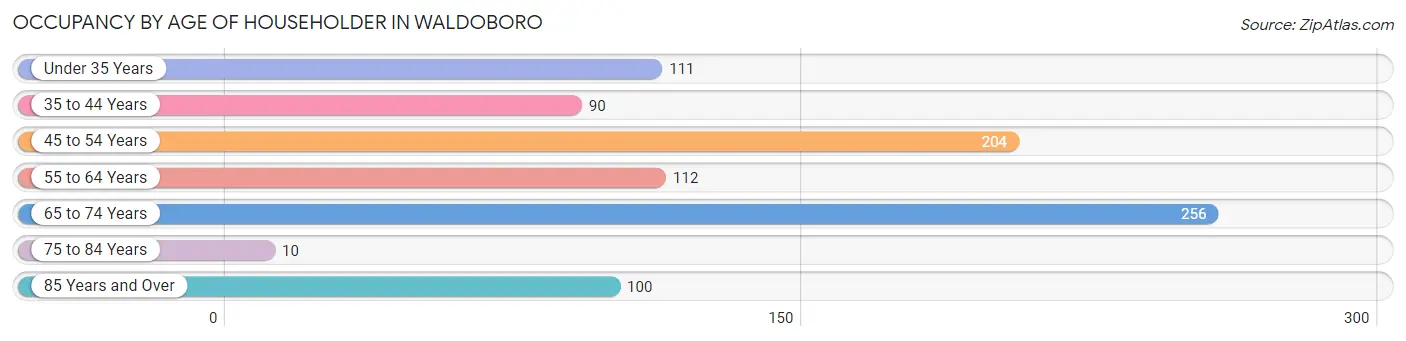
| Age Bracket | # Households | % Households |
| Under 35 Years | 111 | 12.6% |
| 35 to 44 Years | 90 | 10.2% |
| 45 to 54 Years | 204 | 23.1% |
| 55 to 64 Years | 112 | 12.7% |
| 65 to 74 Years | 256 | 29.0% |
| 75 to 84 Years | 10 | 1.1% |
| 85 Years and Over | 100 | 11.3% |
| Total | 883 | 100.0% |
Housing Finances in Waldoboro
Median Income by Occupancy in Waldoboro
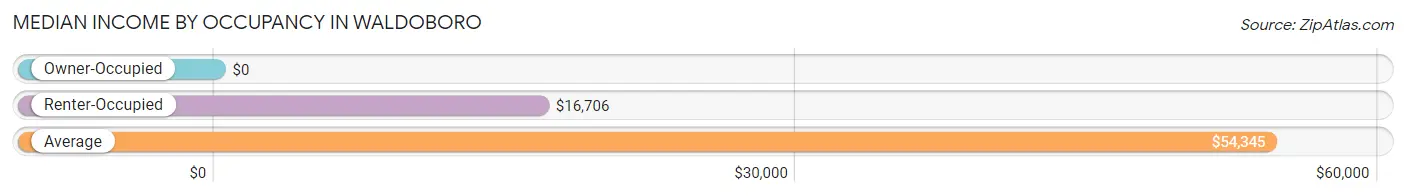
| Occupancy Type | # Households | Median Income |
| Owner-Occupied | 456 (51.6%) | $0 |
| Renter-Occupied | 427 (48.4%) | $16,706 |
| Average | 883 (100.0%) | $54,345 |
Occupancy by Householder Income Bracket in Waldoboro
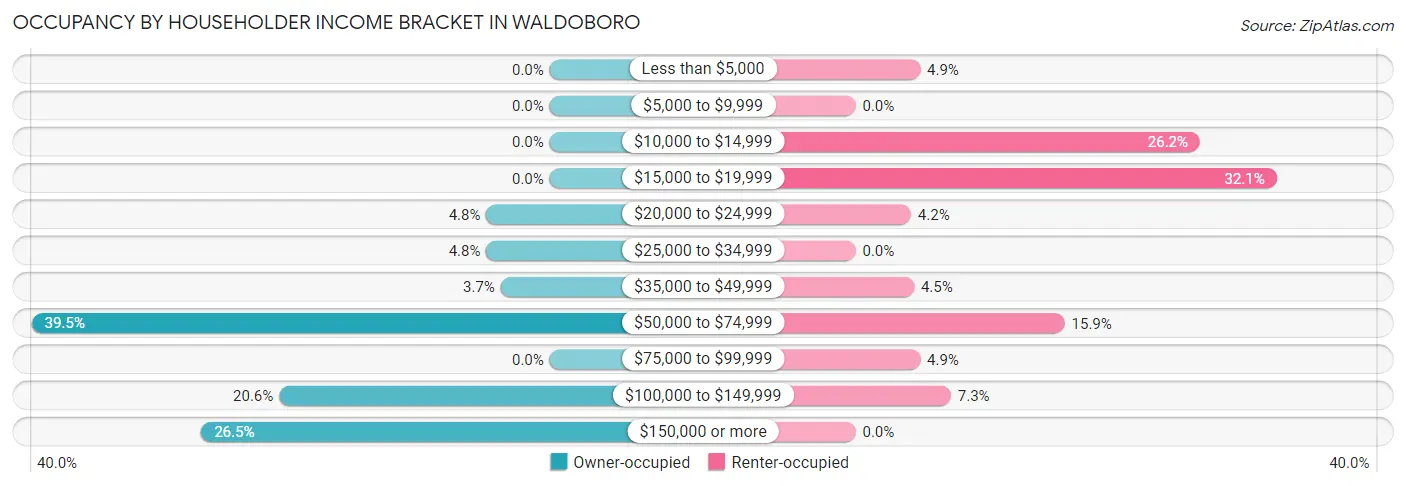
| Income Bracket | Owner-occupied | Renter-occupied |
| Less than $5,000 | 0 (0.0%) | 21 (4.9%) |
| $5,000 to $9,999 | 0 (0.0%) | 0 (0.0%) |
| $10,000 to $14,999 | 0 (0.0%) | 112 (26.2%) |
| $15,000 to $19,999 | 0 (0.0%) | 137 (32.1%) |
| $20,000 to $24,999 | 22 (4.8%) | 18 (4.2%) |
| $25,000 to $34,999 | 22 (4.8%) | 0 (0.0%) |
| $35,000 to $49,999 | 17 (3.7%) | 19 (4.4%) |
| $50,000 to $74,999 | 180 (39.5%) | 68 (15.9%) |
| $75,000 to $99,999 | 0 (0.0%) | 21 (4.9%) |
| $100,000 to $149,999 | 94 (20.6%) | 31 (7.3%) |
| $150,000 or more | 121 (26.5%) | 0 (0.0%) |
| Total | 456 (100.0%) | 427 (100.0%) |
Monthly Housing Cost Tiers in Waldoboro
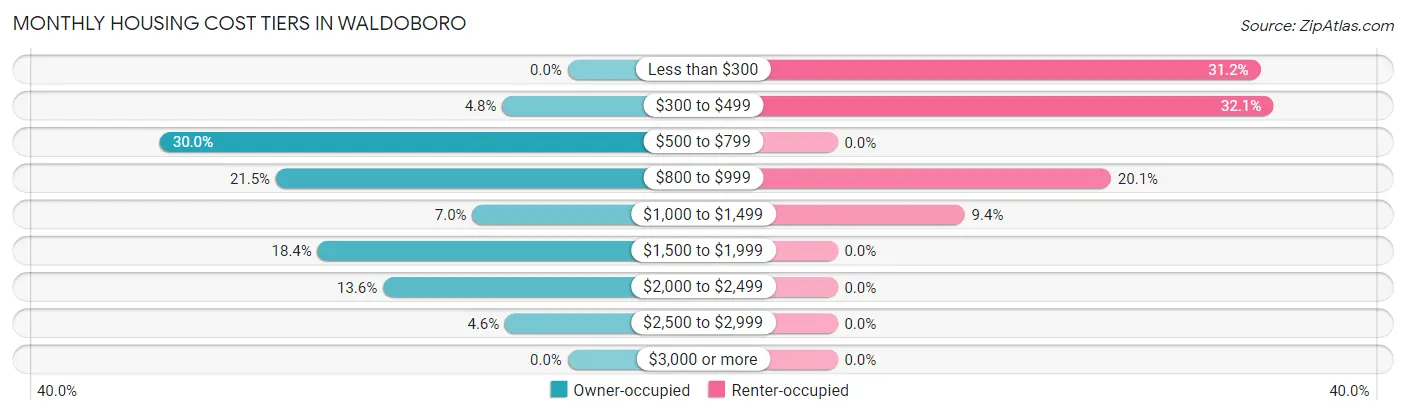
| Monthly Cost | Owner-occupied | Renter-occupied |
| Less than $300 | 0 (0.0%) | 133 (31.1%) |
| $300 to $499 | 22 (4.8%) | 137 (32.1%) |
| $500 to $799 | 137 (30.0%) | 0 (0.0%) |
| $800 to $999 | 98 (21.5%) | 86 (20.1%) |
| $1,000 to $1,499 | 32 (7.0%) | 40 (9.4%) |
| $1,500 to $1,999 | 84 (18.4%) | 0 (0.0%) |
| $2,000 to $2,499 | 62 (13.6%) | 0 (0.0%) |
| $2,500 to $2,999 | 21 (4.6%) | 0 (0.0%) |
| $3,000 or more | 0 (0.0%) | 0 (0.0%) |
| Total | 456 (100.0%) | 427 (100.0%) |
Physical Housing Characteristics in Waldoboro
Housing Structures in Waldoboro
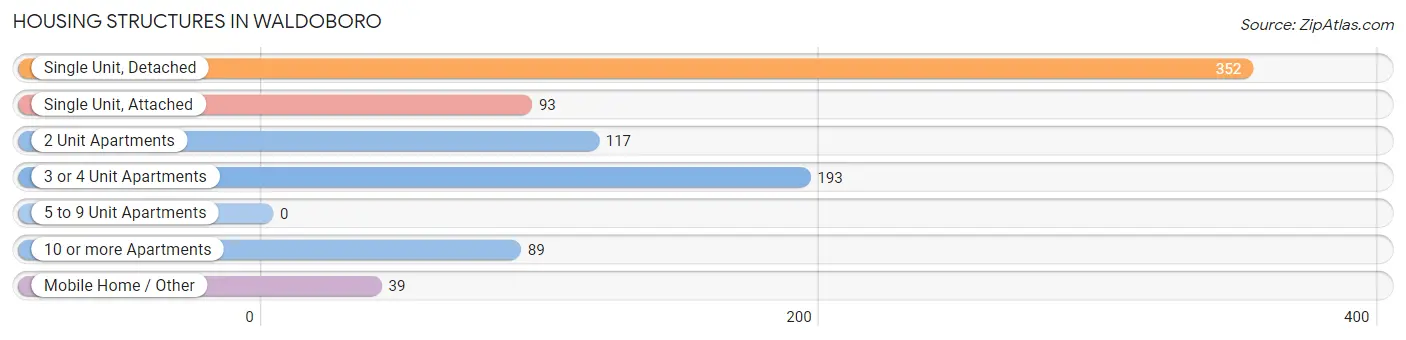
| Structure Type | # Housing Units | % Housing Units |
| Single Unit, Detached | 352 | 39.9% |
| Single Unit, Attached | 93 | 10.5% |
| 2 Unit Apartments | 117 | 13.3% |
| 3 or 4 Unit Apartments | 193 | 21.9% |
| 5 to 9 Unit Apartments | 0 | 0.0% |
| 10 or more Apartments | 89 | 10.1% |
| Mobile Home / Other | 39 | 4.4% |
| Total | 883 | 100.0% |
Housing Structures by Occupancy in Waldoboro
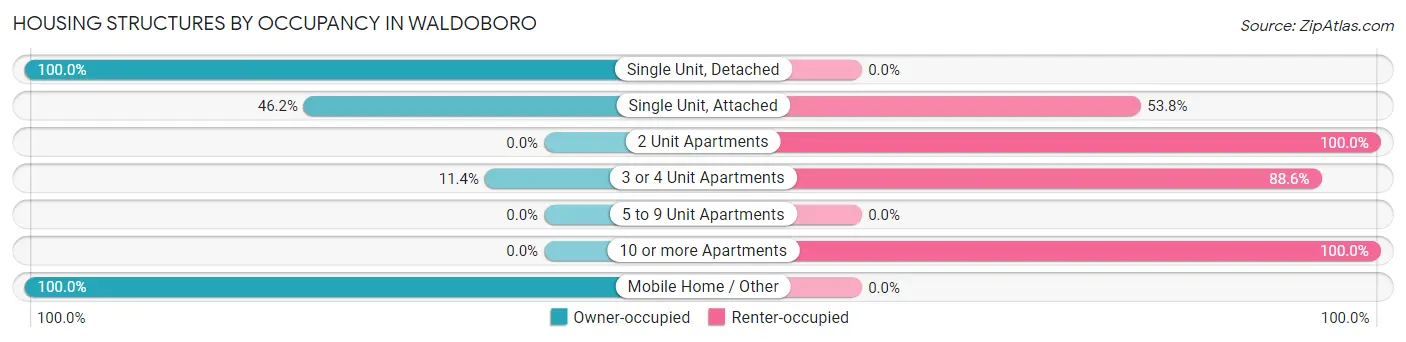
| Structure Type | Owner-occupied | Renter-occupied |
| Single Unit, Detached | 352 (100.0%) | 0 (0.0%) |
| Single Unit, Attached | 43 (46.2%) | 50 (53.8%) |
| 2 Unit Apartments | 0 (0.0%) | 117 (100.0%) |
| 3 or 4 Unit Apartments | 22 (11.4%) | 171 (88.6%) |
| 5 to 9 Unit Apartments | 0 (0.0%) | 0 (0.0%) |
| 10 or more Apartments | 0 (0.0%) | 89 (100.0%) |
| Mobile Home / Other | 39 (100.0%) | 0 (0.0%) |
| Total | 456 (51.6%) | 427 (48.4%) |
Housing Structures by Number of Rooms in Waldoboro
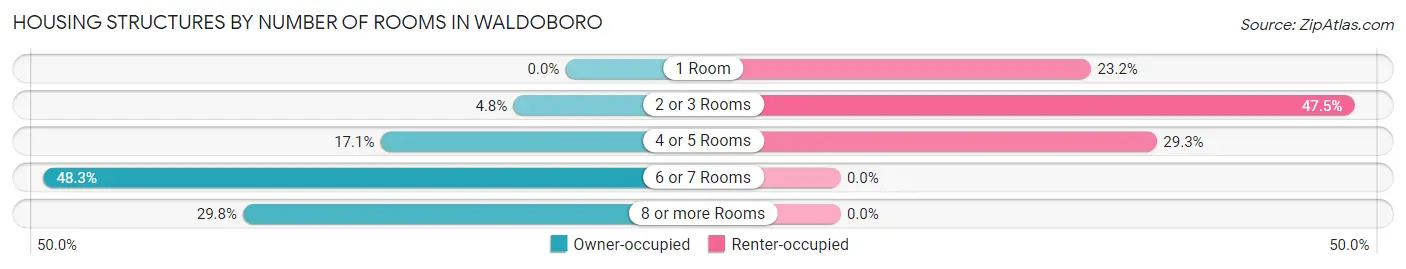
| Number of Rooms | Owner-occupied | Renter-occupied |
| 1 Room | 0 (0.0%) | 99 (23.2%) |
| 2 or 3 Rooms | 22 (4.8%) | 203 (47.5%) |
| 4 or 5 Rooms | 78 (17.1%) | 125 (29.3%) |
| 6 or 7 Rooms | 220 (48.2%) | 0 (0.0%) |
| 8 or more Rooms | 136 (29.8%) | 0 (0.0%) |
| Total | 456 (100.0%) | 427 (100.0%) |
Housing Structure by Heating Type in Waldoboro
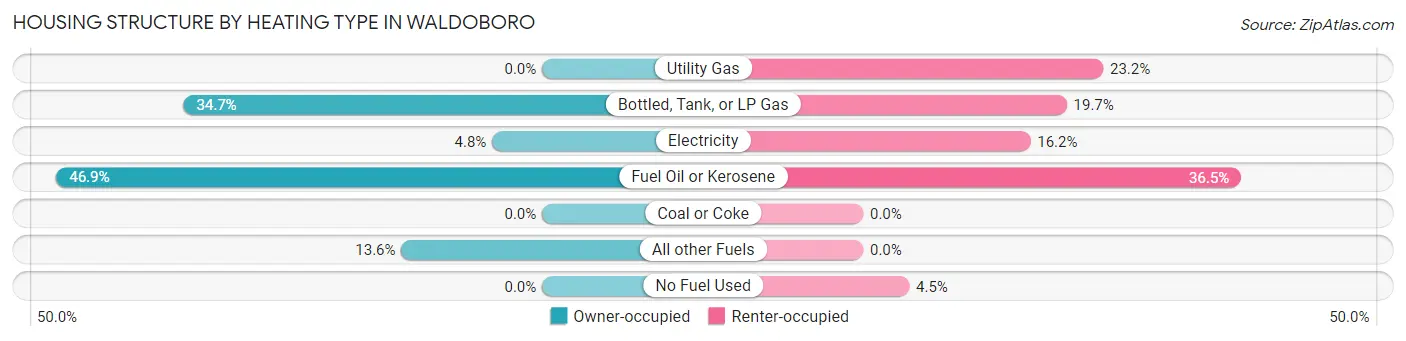
| Heating Type | Owner-occupied | Renter-occupied |
| Utility Gas | 0 (0.0%) | 99 (23.2%) |
| Bottled, Tank, or LP Gas | 158 (34.6%) | 84 (19.7%) |
| Electricity | 22 (4.8%) | 69 (16.2%) |
| Fuel Oil or Kerosene | 214 (46.9%) | 156 (36.5%) |
| Coal or Coke | 0 (0.0%) | 0 (0.0%) |
| All other Fuels | 62 (13.6%) | 0 (0.0%) |
| No Fuel Used | 0 (0.0%) | 19 (4.4%) |
| Total | 456 (100.0%) | 427 (100.0%) |
Household Vehicle Usage in Waldoboro
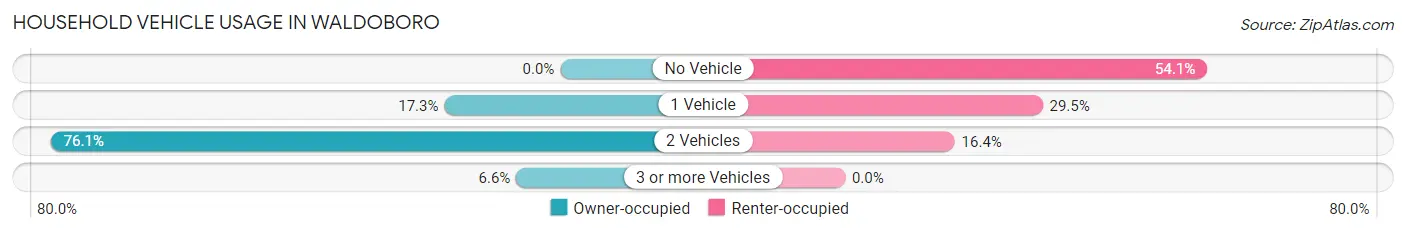
| Vehicles per Household | Owner-occupied | Renter-occupied |
| No Vehicle | 0 (0.0%) | 231 (54.1%) |
| 1 Vehicle | 79 (17.3%) | 126 (29.5%) |
| 2 Vehicles | 347 (76.1%) | 70 (16.4%) |
| 3 or more Vehicles | 30 (6.6%) | 0 (0.0%) |
| Total | 456 (100.0%) | 427 (100.0%) |
Real Estate & Mortgages in Waldoboro
Real Estate and Mortgage Overview in Waldoboro
| Characteristic | Without Mortgage | With Mortgage |
| Housing Units | 175 | 281 |
| Median Property Value | $147,600 | $224,600 |
| Median Household Income | $52,091 | $101 |
| Monthly Housing Costs | $613 | $0 |
| Real Estate Taxes | $3,198 | $22 |
Property Value by Mortgage Status in Waldoboro
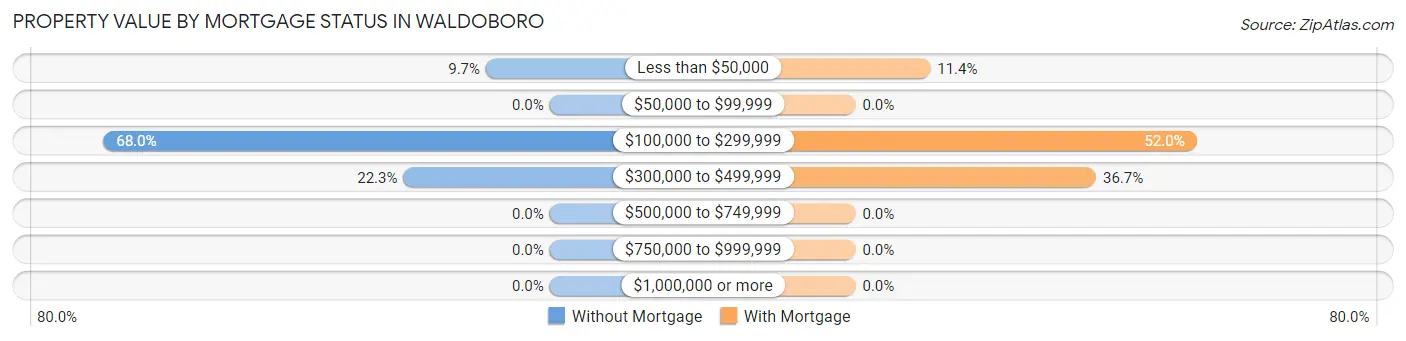
| Property Value | Without Mortgage | With Mortgage |
| Less than $50,000 | 17 (9.7%) | 32 (11.4%) |
| $50,000 to $99,999 | 0 (0.0%) | 0 (0.0%) |
| $100,000 to $299,999 | 119 (68.0%) | 146 (52.0%) |
| $300,000 to $499,999 | 39 (22.3%) | 103 (36.6%) |
| $500,000 to $749,999 | 0 (0.0%) | 0 (0.0%) |
| $750,000 to $999,999 | 0 (0.0%) | 0 (0.0%) |
| $1,000,000 or more | 0 (0.0%) | 0 (0.0%) |
| Total | 175 (100.0%) | 281 (100.0%) |
Household Income by Mortgage Status in Waldoboro
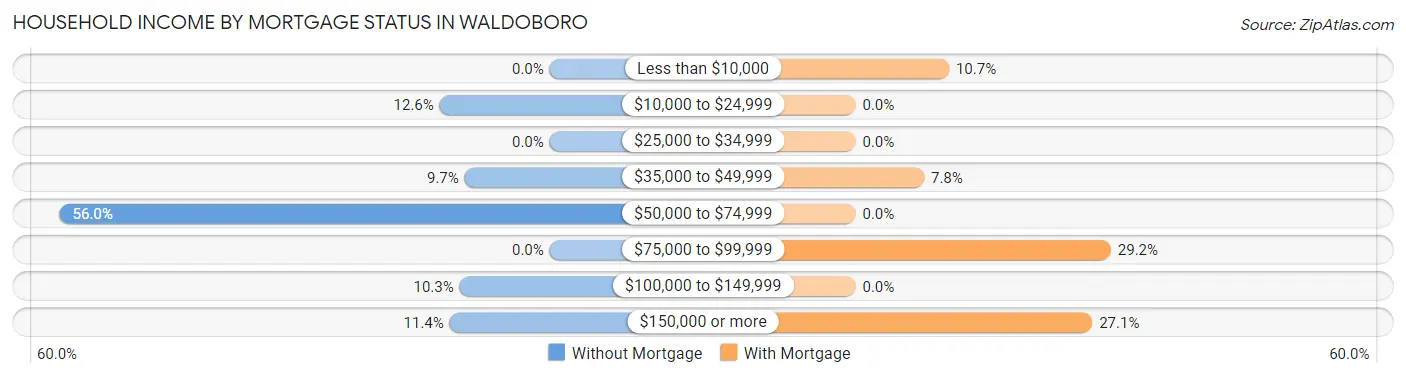
| Household Income | Without Mortgage | With Mortgage |
| Less than $10,000 | 0 (0.0%) | 30 (10.7%) |
| $10,000 to $24,999 | 22 (12.6%) | 0 (0.0%) |
| $25,000 to $34,999 | 0 (0.0%) | 0 (0.0%) |
| $35,000 to $49,999 | 17 (9.7%) | 22 (7.8%) |
| $50,000 to $74,999 | 98 (56.0%) | 0 (0.0%) |
| $75,000 to $99,999 | 0 (0.0%) | 82 (29.2%) |
| $100,000 to $149,999 | 18 (10.3%) | 0 (0.0%) |
| $150,000 or more | 20 (11.4%) | 76 (27.1%) |
| Total | 175 (100.0%) | 281 (100.0%) |
Property Value to Household Income Ratio in Waldoboro
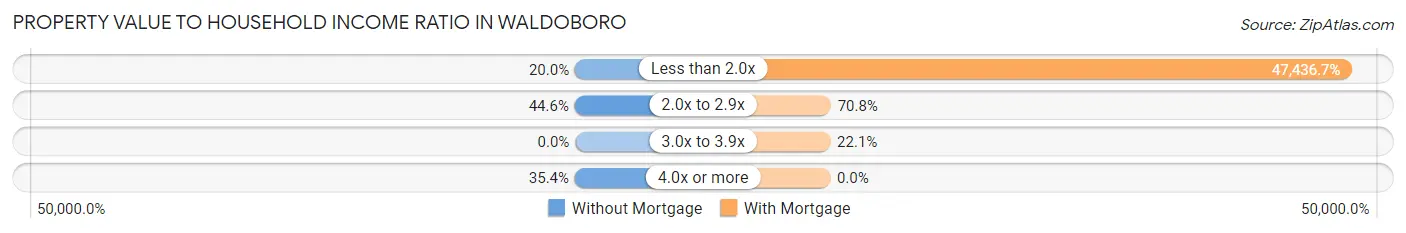
| Value-to-Income Ratio | Without Mortgage | With Mortgage |
| Less than 2.0x | 35 (20.0%) | 133,297 (47,436.6%) |
| 2.0x to 2.9x | 78 (44.6%) | 199 (70.8%) |
| 3.0x to 3.9x | 0 (0.0%) | 62 (22.1%) |
| 4.0x or more | 62 (35.4%) | 0 (0.0%) |
| Total | 175 (100.0%) | 281 (100.0%) |
Real Estate Taxes by Mortgage Status in Waldoboro
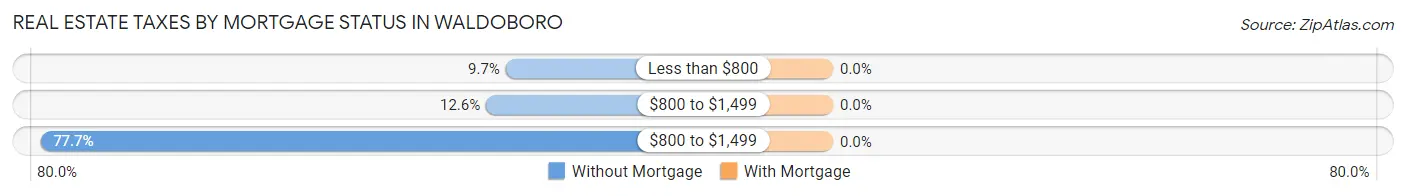
| Property Taxes | Without Mortgage | With Mortgage |
| Less than $800 | 17 (9.7%) | 0 (0.0%) |
| $800 to $1,499 | 22 (12.6%) | 0 (0.0%) |
| $800 to $1,499 | 136 (77.7%) | 0 (0.0%) |
| Total | 175 (100.0%) | 281 (100.0%) |
Health & Disability in Waldoboro
Health Insurance Coverage by Age in Waldoboro
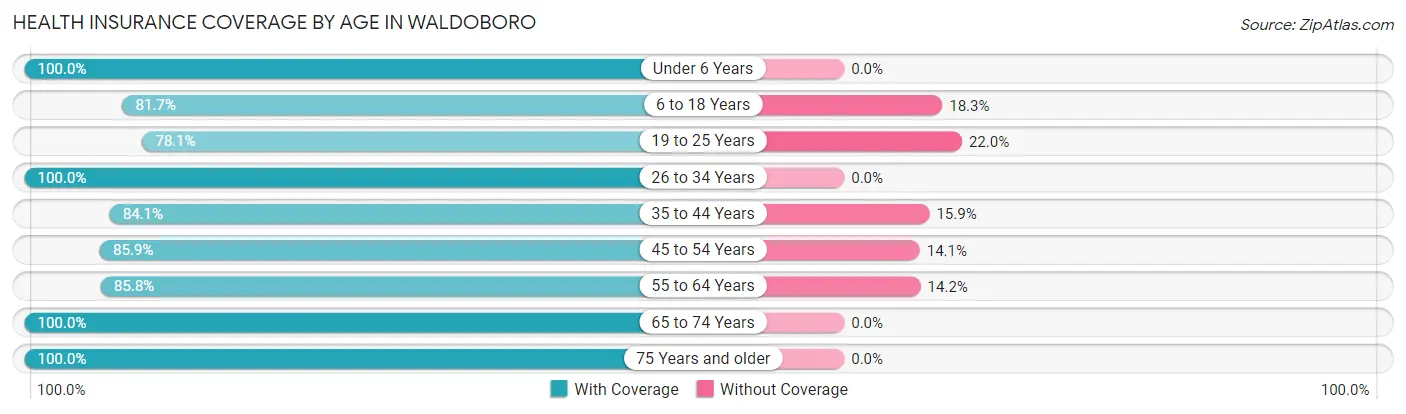
| Age Bracket | With Coverage | Without Coverage |
| Under 6 Years | 73 (100.0%) | 0 (0.0%) |
| 6 to 18 Years | 76 (81.7%) | 17 (18.3%) |
| 19 to 25 Years | 32 (78.0%) | 9 (22.0%) |
| 26 to 34 Years | 230 (100.0%) | 0 (0.0%) |
| 35 to 44 Years | 90 (84.1%) | 17 (15.9%) |
| 45 to 54 Years | 238 (85.9%) | 39 (14.1%) |
| 55 to 64 Years | 259 (85.8%) | 43 (14.2%) |
| 65 to 74 Years | 293 (100.0%) | 0 (0.0%) |
| 75 Years and older | 137 (100.0%) | 0 (0.0%) |
| Total | 1,428 (91.9%) | 125 (8.1%) |
Health Insurance Coverage by Citizenship Status in Waldoboro

| Citizenship Status | With Coverage | Without Coverage |
| Native Born | 73 (100.0%) | 0 (0.0%) |
| Foreign Born, Citizen | 76 (81.7%) | 17 (18.3%) |
| Foreign Born, not a Citizen | 32 (78.0%) | 9 (22.0%) |
Health Insurance Coverage by Household Income in Waldoboro
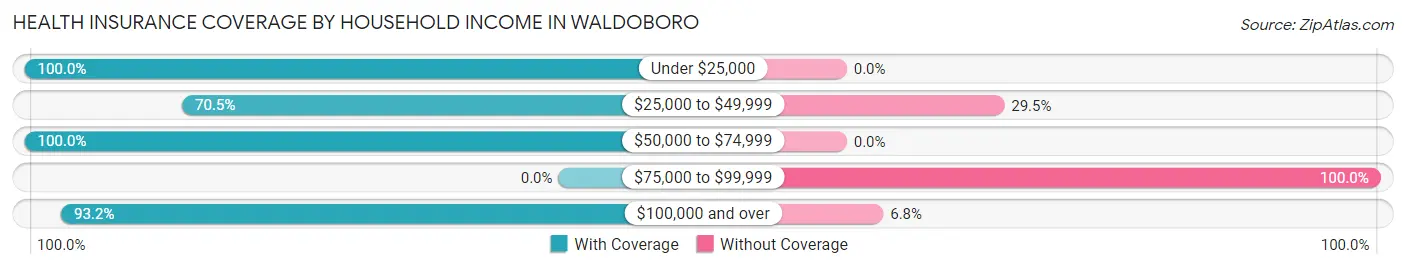
| Household Income | With Coverage | Without Coverage |
| Under $25,000 | 310 (100.0%) | 0 (0.0%) |
| $25,000 to $49,999 | 86 (70.5%) | 36 (29.5%) |
| $50,000 to $74,999 | 396 (100.0%) | 0 (0.0%) |
| $75,000 to $99,999 | 0 (0.0%) | 43 (100.0%) |
| $100,000 and over | 627 (93.2%) | 46 (6.8%) |
Public vs Private Health Insurance Coverage by Age in Waldoboro
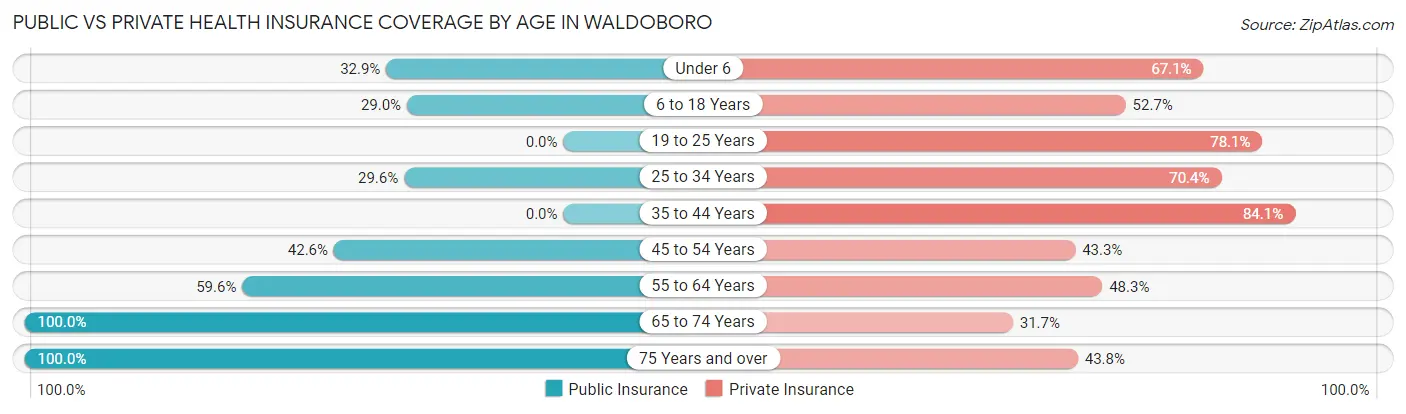
| Age Bracket | Public Insurance | Private Insurance |
| Under 6 | 24 (32.9%) | 49 (67.1%) |
| 6 to 18 Years | 27 (29.0%) | 49 (52.7%) |
| 19 to 25 Years | 0 (0.0%) | 32 (78.0%) |
| 25 to 34 Years | 68 (29.6%) | 162 (70.4%) |
| 35 to 44 Years | 0 (0.0%) | 90 (84.1%) |
| 45 to 54 Years | 118 (42.6%) | 120 (43.3%) |
| 55 to 64 Years | 180 (59.6%) | 146 (48.3%) |
| 65 to 74 Years | 293 (100.0%) | 93 (31.7%) |
| 75 Years and over | 137 (100.0%) | 60 (43.8%) |
| Total | 847 (54.5%) | 801 (51.6%) |
Disability Status by Sex by Age in Waldoboro
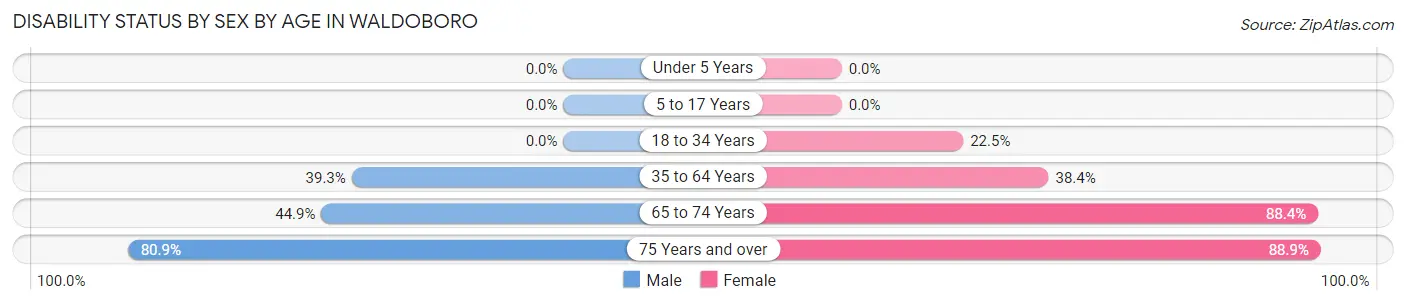
| Age Bracket | Male | Female |
| Under 5 Years | 0 (0.0%) | 0 (0.0%) |
| 5 to 17 Years | 0 (0.0%) | 0 (0.0%) |
| 18 to 34 Years | 0 (0.0%) | 32 (22.5%) |
| 35 to 64 Years | 158 (39.3%) | 109 (38.4%) |
| 65 to 74 Years | 62 (44.9%) | 137 (88.4%) |
| 75 Years and over | 38 (80.8%) | 80 (88.9%) |
Disability Class by Sex by Age in Waldoboro
Disability Class: Hearing Difficulty
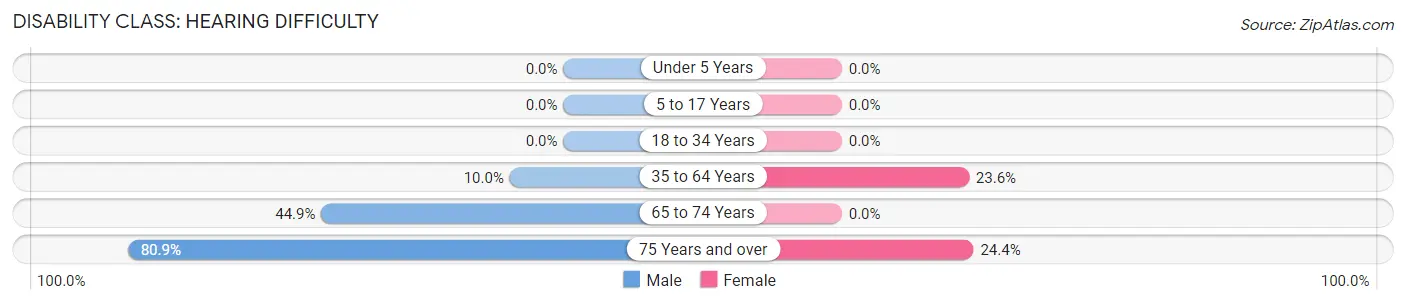
| Age Bracket | Male | Female |
| Under 5 Years | 0 (0.0%) | 0 (0.0%) |
| 5 to 17 Years | 0 (0.0%) | 0 (0.0%) |
| 18 to 34 Years | 0 (0.0%) | 0 (0.0%) |
| 35 to 64 Years | 40 (10.0%) | 67 (23.6%) |
| 65 to 74 Years | 62 (44.9%) | 0 (0.0%) |
| 75 Years and over | 38 (80.8%) | 22 (24.4%) |
Disability Class: Vision Difficulty
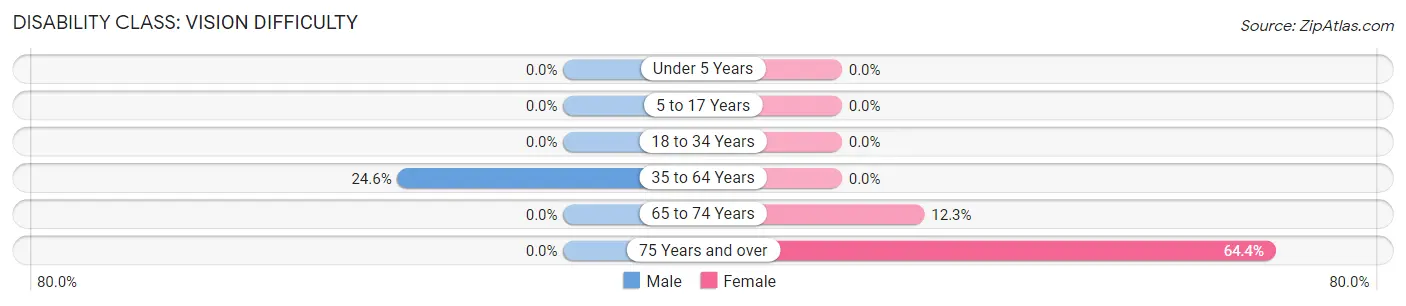
| Age Bracket | Male | Female |
| Under 5 Years | 0 (0.0%) | 0 (0.0%) |
| 5 to 17 Years | 0 (0.0%) | 0 (0.0%) |
| 18 to 34 Years | 0 (0.0%) | 0 (0.0%) |
| 35 to 64 Years | 99 (24.6%) | 0 (0.0%) |
| 65 to 74 Years | 0 (0.0%) | 19 (12.3%) |
| 75 Years and over | 0 (0.0%) | 58 (64.4%) |
Disability Class: Cognitive Difficulty
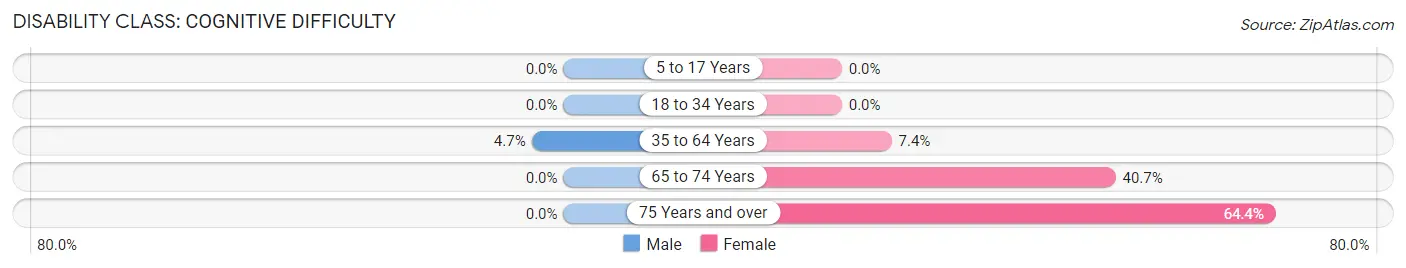
| Age Bracket | Male | Female |
| 5 to 17 Years | 0 (0.0%) | 0 (0.0%) |
| 18 to 34 Years | 0 (0.0%) | 0 (0.0%) |
| 35 to 64 Years | 19 (4.7%) | 21 (7.4%) |
| 65 to 74 Years | 0 (0.0%) | 63 (40.6%) |
| 75 Years and over | 0 (0.0%) | 58 (64.4%) |
Disability Class: Ambulatory Difficulty
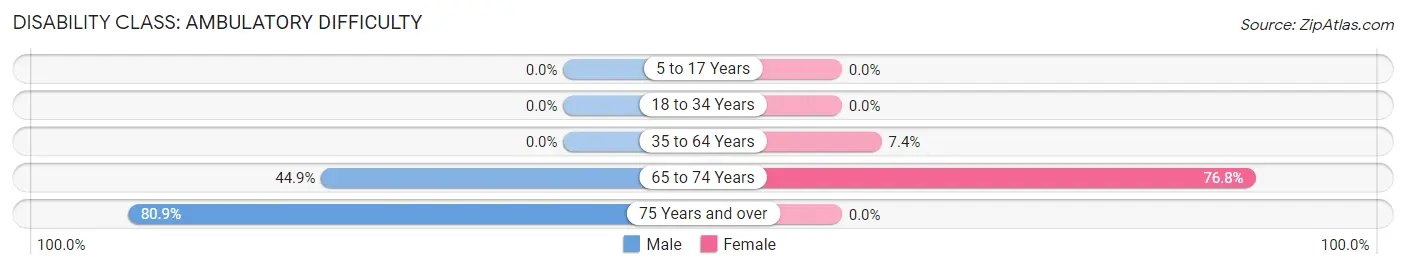
| Age Bracket | Male | Female |
| 5 to 17 Years | 0 (0.0%) | 0 (0.0%) |
| 18 to 34 Years | 0 (0.0%) | 0 (0.0%) |
| 35 to 64 Years | 0 (0.0%) | 21 (7.4%) |
| 65 to 74 Years | 62 (44.9%) | 119 (76.8%) |
| 75 Years and over | 38 (80.8%) | 0 (0.0%) |
Disability Class: Self-Care Difficulty
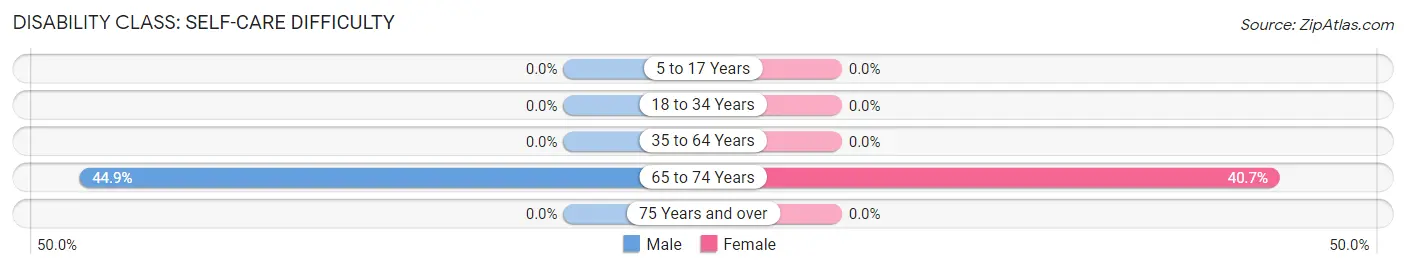
| Age Bracket | Male | Female |
| 5 to 17 Years | 0 (0.0%) | 0 (0.0%) |
| 18 to 34 Years | 0 (0.0%) | 0 (0.0%) |
| 35 to 64 Years | 0 (0.0%) | 0 (0.0%) |
| 65 to 74 Years | 62 (44.9%) | 63 (40.6%) |
| 75 Years and over | 0 (0.0%) | 0 (0.0%) |
Technology Access in Waldoboro
Computing Device Access in Waldoboro
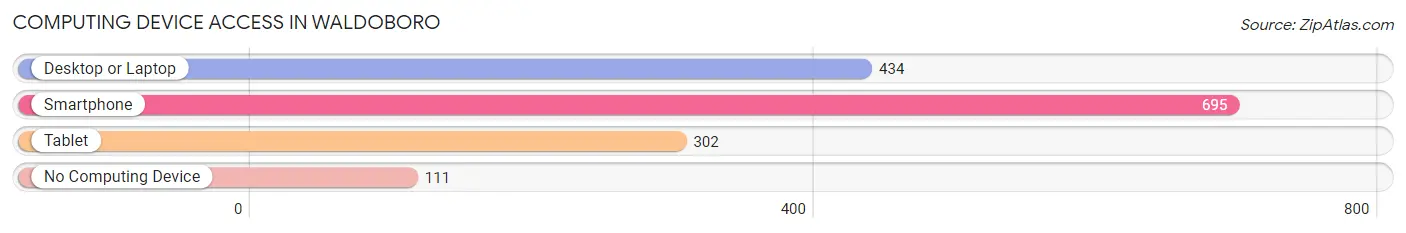
| Device Type | # Households | % Households |
| Desktop or Laptop | 434 | 49.1% |
| Smartphone | 695 | 78.7% |
| Tablet | 302 | 34.2% |
| No Computing Device | 111 | 12.6% |
| Total | 883 | 100.0% |
Internet Access in Waldoboro
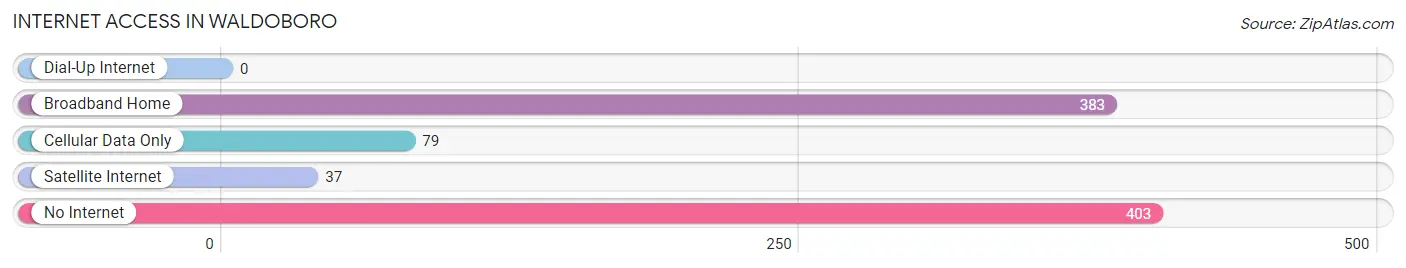
| Internet Type | # Households | % Households |
| Dial-Up Internet | 0 | 0.0% |
| Broadband Home | 383 | 43.4% |
| Cellular Data Only | 79 | 8.9% |
| Satellite Internet | 37 | 4.2% |
| No Internet | 403 | 45.6% |
| Total | 883 | 100.0% |
Waldoboro Summary
Waldoboro is a town located in Lincoln County, Maine, United States. The population was 5,075 at the 2010 census. It is the largest town in the county and is situated on the Medomak River.
History
Waldoboro was first settled in 1740 by a group of German immigrants from the Palatinate region of Germany. The town was originally called Broad Bay Plantation and was incorporated in 1773. The name was changed to Waldoboro in 1784, after the German city of Waldoboro.
The town was an important port in the early 19th century, and was home to several shipbuilding yards. The town was also a center of the granite industry, with several quarries located in the area.
Geography
Waldoboro is located at 44°4′25″N 69°25′25″W (44.073611, -69.423607). According to the United States Census Bureau, the town has a total area of 28.2 square miles (73.1 km2), of which, 27.7 square miles (71.6 km2) of it is land and 0.5 square miles (1.3 km2) is water.
Economy
Waldoboro is a rural community with a strong agricultural base. The town is home to several farms, including dairy, beef, and poultry farms. The town is also home to several small businesses, including a lumber mill, a boat building business, and a granite quarry.
Demographics
As of the census of 2000, there were 4,845 people, 1,945 households, and 1,323 families residing in the town. The population density was 175.2 people per square mile (67.7/km2). There were 2,093 housing units at an average density of 75.3 per square mile (29.1/km2). The racial makeup of the town was 97.90% White, 0.37% African American, 0.37% Native American, 0.25% Asian, 0.02% Pacific Islander, 0.12% from other races, and 0.97% from two or more races. Hispanic or Latino of any race were 0.45% of the population.
There were 1,945 households, out of which 32.2% had children under the age of 18 living with them, 54.2% were married couples living together, 9.7% had a female householder with no husband present, and 31.3% were non-families. 25.2% of all households were made up of individuals, and 11.2% had someone living alone who was 65 years of age or older. The average household size was 2.48 and the average family size was 2.96.
In the town, the population was spread out, with 25.2% under the age of 18, 6.7% from 18 to 24, 28.7% from 25 to 44, 24.2% from 45 to 64, and 15.2% who were 65 years of age or older. The median age was 39 years. For every 100 females, there were 94.2 males. For every 100 females age 18 and over, there were 91.2 males.
The median income for a household in the town was $35,938, and the median income for a family was $41,944. Males had a median income of $30,917 versus $22,917 for females. The per capita income for the town was $17,845. About 8.2% of families and 10.7% of the population were below the poverty line, including 13.2% of those under age 18 and 11.2% of those age 65 or over.
Common Questions
What is Per Capita Income in Waldoboro?
Per Capita income in Waldoboro is $52,040.
What is the Median Family Income in Waldoboro?
Median Family Income in Waldoboro is $112,056.
What is the Median Household income in Waldoboro?
Median Household Income in Waldoboro is $54,345.
What is Income or Wage Gap in Waldoboro?
Income or Wage Gap in Waldoboro is 22.8%.
Women in Waldoboro earn 77.2 cents for every dollar earned by a man.
What is Inequality or Gini Index in Waldoboro?
Inequality or Gini Index in Waldoboro is 0.56.
What is the Total Population of Waldoboro?
Total Population of Waldoboro is 1,553.
What is the Total Male Population of Waldoboro?
Total Male Population of Waldoboro is 772.
What is the Total Female Population of Waldoboro?
Total Female Population of Waldoboro is 781.
What is the Ratio of Males per 100 Females in Waldoboro?
There are 98.85 Males per 100 Females in Waldoboro.
What is the Ratio of Females per 100 Males in Waldoboro?
There are 101.17 Females per 100 Males in Waldoboro.
What is the Median Population Age in Waldoboro?
Median Population Age in Waldoboro is 53.3 Years.
What is the Average Family Size in Waldoboro
Average Family Size in Waldoboro is 2.5 People.
What is the Average Household Size in Waldoboro
Average Household Size in Waldoboro is 1.8 People.
How Large is the Labor Force in Waldoboro?
There are 796 People in the Labor Forcein in Waldoboro.
What is the Percentage of People in the Labor Force in Waldoboro?
56.1% of People are in the Labor Force in Waldoboro.
What is the Unemployment Rate in Waldoboro?
Unemployment Rate in Waldoboro is 4.0%.