Van Buren, ME Map & Demographics
Van Buren Map
Van Buren Overview
$27,685
PER CAPITA INCOME
$60,833
AVG FAMILY INCOME
$34,263
AVG HOUSEHOLD INCOME
27.9%
WAGE / INCOME GAP [ % ]
72.1¢/ $1
WAGE / INCOME GAP [ $ ]
$10,137
FAMILY INCOME DEFICIT
0.61
INEQUALITY / GINI INDEX
1,682
TOTAL POPULATION
718
MALE POPULATION
964
FEMALE POPULATION
74.48
MALES / 100 FEMALES
134.26
FEMALES / 100 MALES
57.0
MEDIAN AGE
3.3
AVG FAMILY SIZE
2.2
AVG HOUSEHOLD SIZE
560
LABOR FORCE [ PEOPLE ]
39.6%
PERCENT IN LABOR FORCE
1.6%
UNEMPLOYMENT RATE
Van Buren Zip Codes
Van Buren Area Codes
Income in Van Buren
Income Overview in Van Buren
Per Capita Income in Van Buren is $27,685, while median incomes of families and households are $60,833 and $34,263 respectively.
| Characteristic | Number | Measure |
| Per Capita Income | 1,682 | $27,685 |
| Median Family Income | 282 | $60,833 |
| Mean Family Income | 282 | $107,526 |
| Median Household Income | 679 | $34,263 |
| Mean Household Income | 679 | $63,442 |
| Income Deficit | 282 | $10,137 |
| Wage / Income Gap (%) | 1,682 | 27.95% |
| Wage / Income Gap ($) | 1,682 | 72.05¢ per $1 |
| Gini / Inequality Index | 1,682 | 0.61 |
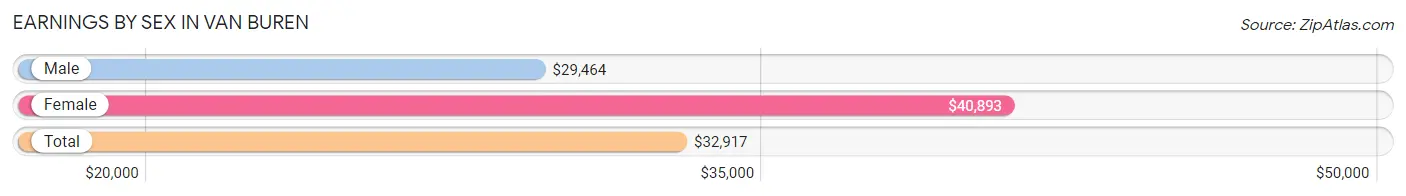
Earnings by Sex in Van Buren
Average Earnings in Van Buren are $32,917, $29,464 for men and $40,893 for women, a difference of 28.0%.
| Sex | Number | Average Earnings |
| Male | 275 (46.1%) | $29,464 |
| Female | 321 (53.9%) | $40,893 |
| Total | 596 (100.0%) | $32,917 |
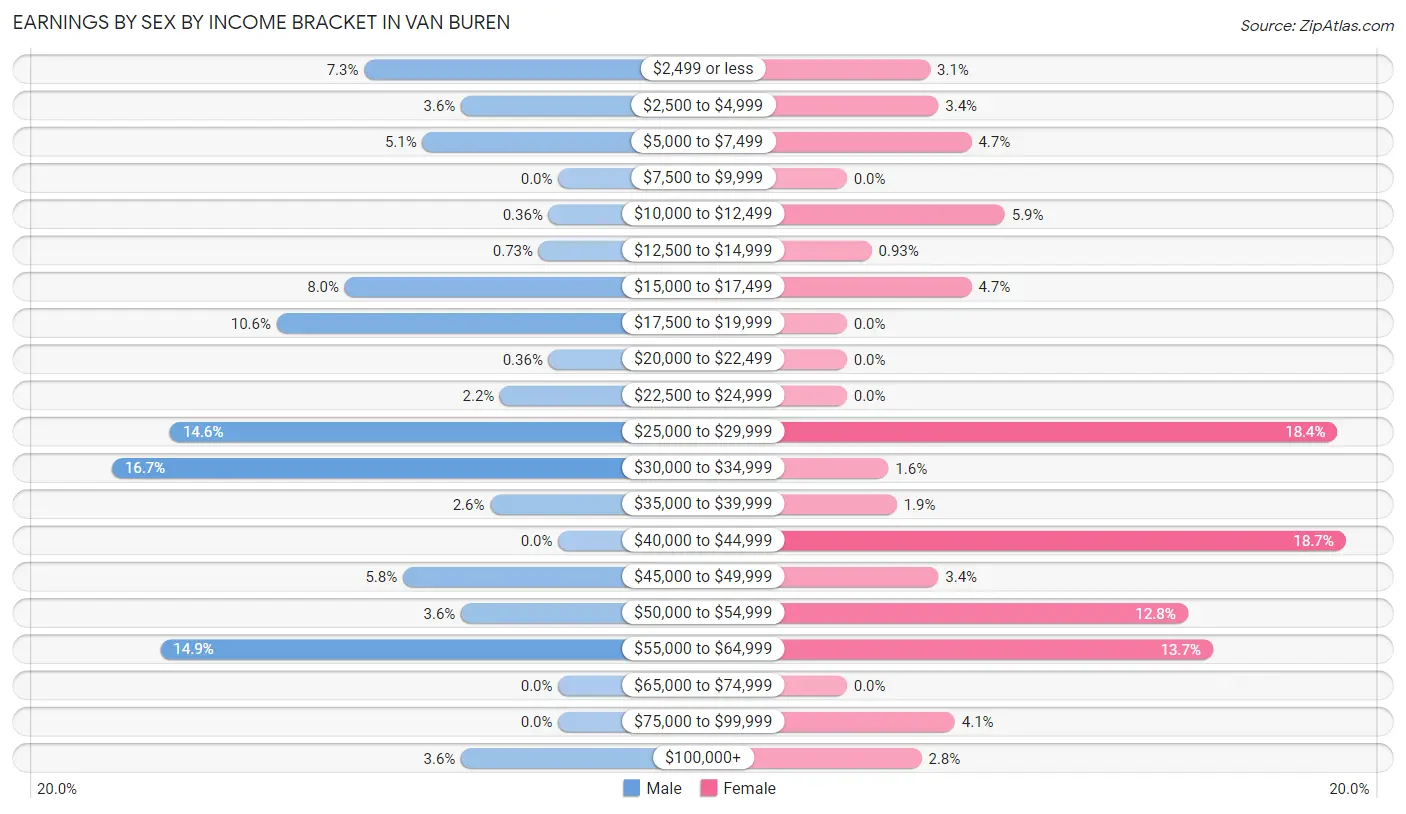
Earnings by Sex by Income Bracket in Van Buren
The most common earnings brackets in Van Buren are $30,000 to $34,999 for men (46 | 16.7%) and $40,000 to $44,999 for women (60 | 18.7%).
| Income | Male | Female |
| $2,499 or less | 20 (7.3%) | 10 (3.1%) |
| $2,500 to $4,999 | 10 (3.6%) | 11 (3.4%) |
| $5,000 to $7,499 | 14 (5.1%) | 15 (4.7%) |
| $7,500 to $9,999 | 0 (0.0%) | 0 (0.0%) |
| $10,000 to $12,499 | 1 (0.4%) | 19 (5.9%) |
| $12,500 to $14,999 | 2 (0.7%) | 3 (0.9%) |
| $15,000 to $17,499 | 22 (8.0%) | 15 (4.7%) |
| $17,500 to $19,999 | 29 (10.5%) | 0 (0.0%) |
| $20,000 to $22,499 | 1 (0.4%) | 0 (0.0%) |
| $22,500 to $24,999 | 6 (2.2%) | 0 (0.0%) |
| $25,000 to $29,999 | 40 (14.5%) | 59 (18.4%) |
| $30,000 to $34,999 | 46 (16.7%) | 5 (1.6%) |
| $35,000 to $39,999 | 7 (2.5%) | 6 (1.9%) |
| $40,000 to $44,999 | 0 (0.0%) | 60 (18.7%) |
| $45,000 to $49,999 | 16 (5.8%) | 11 (3.4%) |
| $50,000 to $54,999 | 10 (3.6%) | 41 (12.8%) |
| $55,000 to $64,999 | 41 (14.9%) | 44 (13.7%) |
| $65,000 to $74,999 | 0 (0.0%) | 0 (0.0%) |
| $75,000 to $99,999 | 0 (0.0%) | 13 (4.1%) |
| $100,000+ | 10 (3.6%) | 9 (2.8%) |
| Total | 275 (100.0%) | 321 (100.0%) |
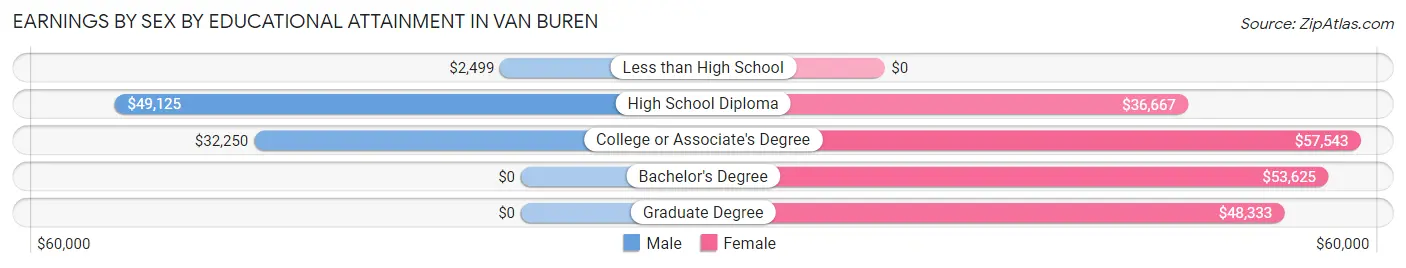
Earnings by Sex by Educational Attainment in Van Buren
Average earnings in Van Buren are $32,702 for men and $44,091 for women, a difference of 25.8%. Men with an educational attainment of high school diploma enjoy the highest average annual earnings of $49,125, while those with less than high school education earn the least with $2,499. Women with an educational attainment of college or associate's degree earn the most with the average annual earnings of $57,543, while those with high school diploma education have the smallest earnings of $36,667.
| Educational Attainment | Male Income | Female Income |
| Less than High School | $2,499 | $0 |
| High School Diploma | $49,125 | $36,667 |
| College or Associate's Degree | $32,250 | $57,543 |
| Bachelor's Degree | - | - |
| Graduate Degree | - | - |
| Total | $32,702 | $44,091 |
Family Income in Van Buren
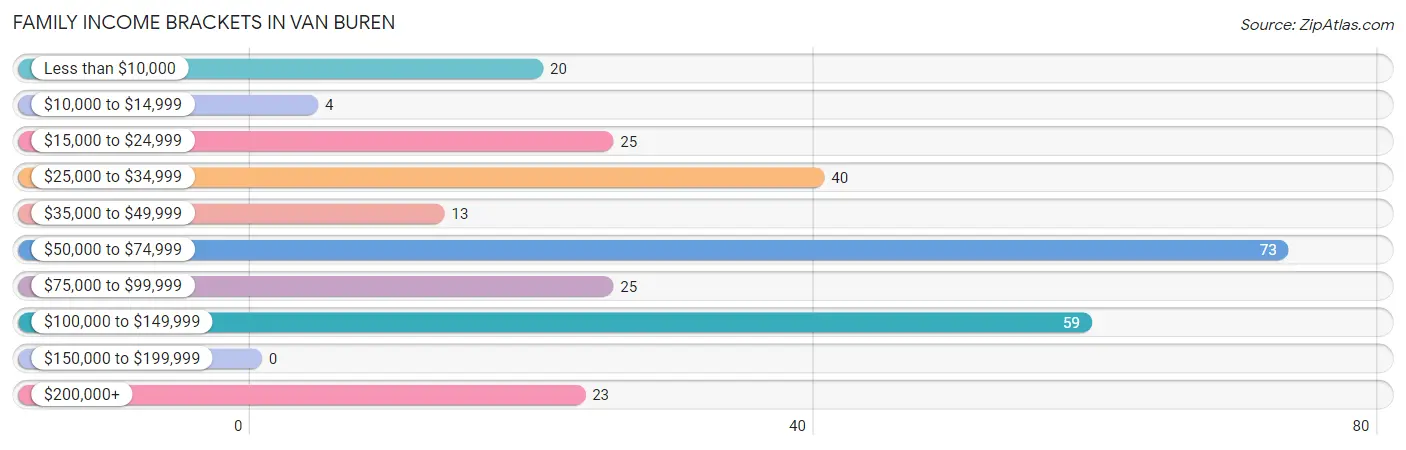
Family Income Brackets in Van Buren
According to the Van Buren family income data, there are 73 families falling into the $50,000 to $74,999 income range, which is the most common income bracket and makes up 25.9% of all families.
| Income Bracket | # Families | % Families |
| Less than $10,000 | 20 | 7.1% |
| $10,000 to $14,999 | 4 | 1.4% |
| $15,000 to $24,999 | 25 | 8.9% |
| $25,000 to $34,999 | 40 | 14.2% |
| $35,000 to $49,999 | 13 | 4.6% |
| $50,000 to $74,999 | 73 | 25.9% |
| $75,000 to $99,999 | 25 | 8.9% |
| $100,000 to $149,999 | 59 | 20.9% |
| $150,000 to $199,999 | 0 | 0.0% |
| $200,000+ | 23 | 8.2% |
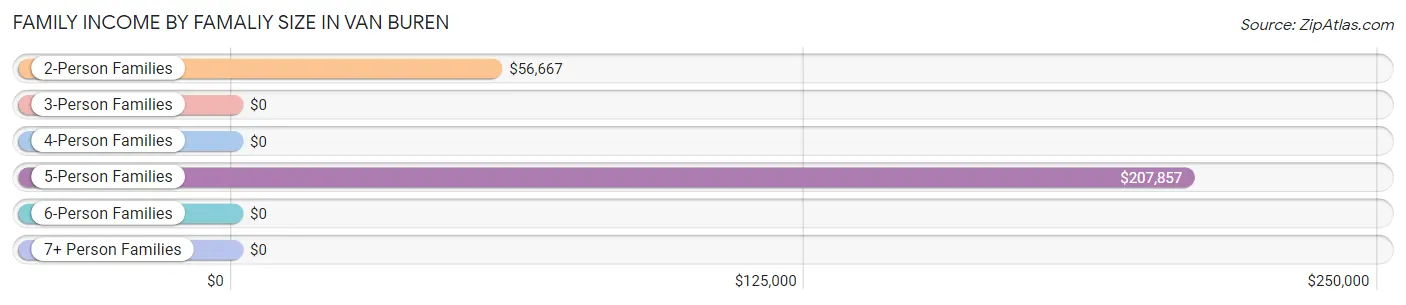
Family Income by Famaliy Size in Van Buren
5-person families (30 | 10.6%) account for the highest median family income in Van Buren with $207,857 per family, while 5-person families (30 | 10.6%) have the highest median income of $41,571 per family member.
| Income Bracket | # Families | Median Income |
| 2-Person Families | 162 (57.5%) | $56,667 |
| 3-Person Families | 26 (9.2%) | $0 |
| 4-Person Families | 64 (22.7%) | $0 |
| 5-Person Families | 30 (10.6%) | $207,857 |
| 6-Person Families | 0 (0.0%) | $0 |
| 7+ Person Families | 0 (0.0%) | $0 |
| Total | 282 (100.0%) | $60,833 |
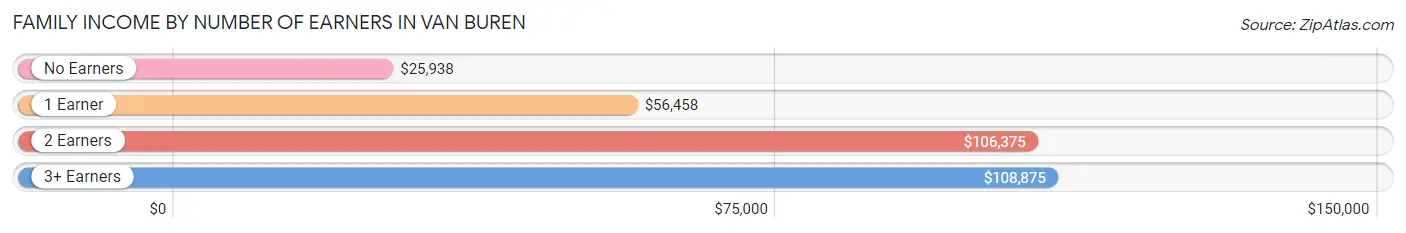
Family Income by Number of Earners in Van Buren
The median family income in Van Buren is $60,833, with families comprising 3+ earners (23) having the highest median family income of $108,875, while families with no earners (77) have the lowest median family income of $25,938, accounting for 8.2% and 27.3% of families, respectively.
| Number of Earners | # Families | Median Income |
| No Earners | 77 (27.3%) | $25,938 |
| 1 Earner | 99 (35.1%) | $56,458 |
| 2 Earners | 83 (29.4%) | $106,375 |
| 3+ Earners | 23 (8.2%) | $108,875 |
| Total | 282 (100.0%) | $60,833 |
Household Income in Van Buren
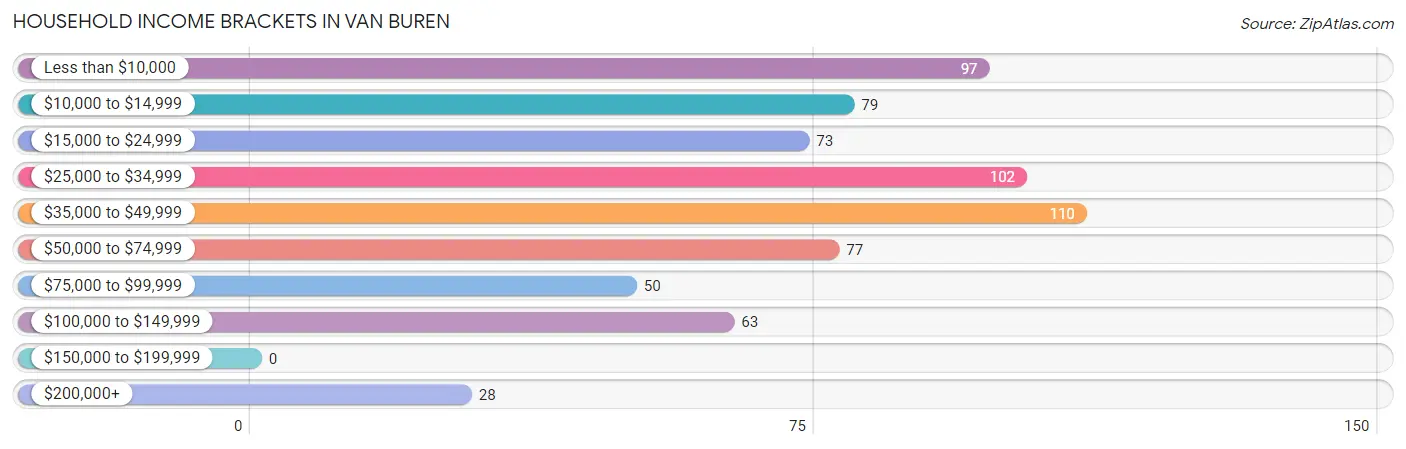
Household Income Brackets in Van Buren
With 110 households falling in the category, the $35,000 to $49,999 income range is the most frequent in Van Buren, accounting for 16.2% of all households.
| Income Bracket | # Households | % Households |
| Less than $10,000 | 97 | 14.3% |
| $10,000 to $14,999 | 79 | 11.6% |
| $15,000 to $24,999 | 73 | 10.8% |
| $25,000 to $34,999 | 102 | 15.0% |
| $35,000 to $49,999 | 110 | 16.2% |
| $50,000 to $74,999 | 77 | 11.3% |
| $75,000 to $99,999 | 50 | 7.4% |
| $100,000 to $149,999 | 63 | 9.3% |
| $150,000 to $199,999 | 0 | 0.0% |
| $200,000+ | 28 | 4.1% |
Household Income by Householder Age in Van Buren
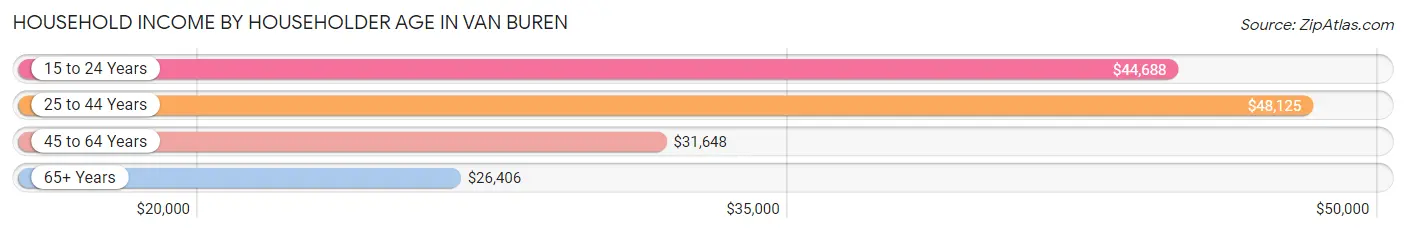
The median household income in Van Buren is $34,263, with the highest median household income of $48,125 found in the 25 to 44 years age bracket for the primary householder. A total of 121 households (17.8%) fall into this category. Meanwhile, the 65+ years age bracket for the primary householder has the lowest median household income of $26,406, with 245 households (36.1%) in this group.
| Income Bracket | # Households | Median Income |
| 15 to 24 Years | 40 (5.9%) | $44,688 |
| 25 to 44 Years | 121 (17.8%) | $48,125 |
| 45 to 64 Years | 273 (40.2%) | $31,648 |
| 65+ Years | 245 (36.1%) | $26,406 |
| Total | 679 (100.0%) | $34,263 |
Poverty in Van Buren
Income Below Poverty by Sex and Age in Van Buren
With 26.4% poverty level for males and 29.0% for females among the residents of Van Buren, 35 to 44 year old males and 6 to 11 year old females are the most vulnerable to poverty, with 12 males (60.0%) and 50 females (45.1%) in their respective age groups living below the poverty level.
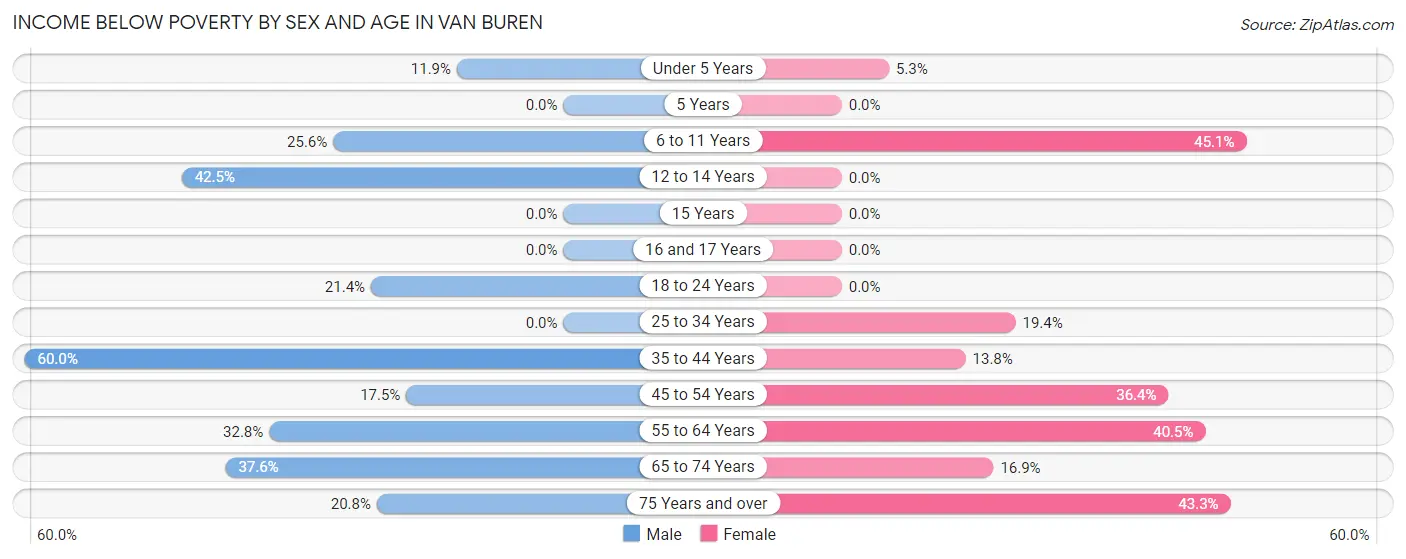
| Age Bracket | Male | Female |
| Under 5 Years | 7 (11.9%) | 1 (5.3%) |
| 5 Years | 0 (0.0%) | 0 (0.0%) |
| 6 to 11 Years | 10 (25.6%) | 50 (45.1%) |
| 12 to 14 Years | 17 (42.5%) | 0 (0.0%) |
| 15 Years | 0 (0.0%) | 0 (0.0%) |
| 16 and 17 Years | 0 (0.0%) | 0 (0.0%) |
| 18 to 24 Years | 12 (21.4%) | 0 (0.0%) |
| 25 to 34 Years | 0 (0.0%) | 12 (19.4%) |
| 35 to 44 Years | 12 (60.0%) | 8 (13.8%) |
| 45 to 54 Years | 14 (17.5%) | 40 (36.4%) |
| 55 to 64 Years | 58 (32.8%) | 51 (40.5%) |
| 65 to 74 Years | 35 (37.6%) | 25 (16.9%) |
| 75 Years and over | 16 (20.8%) | 58 (43.3%) |
| Total | 181 (26.4%) | 245 (29.0%) |
Income Above Poverty by Sex and Age in Van Buren
According to the poverty statistics in Van Buren, males aged 16 and 17 years and females aged 16 and 17 years are the age groups that are most secure financially, with 100.0% of males and 100.0% of females in these age groups living above the poverty line.
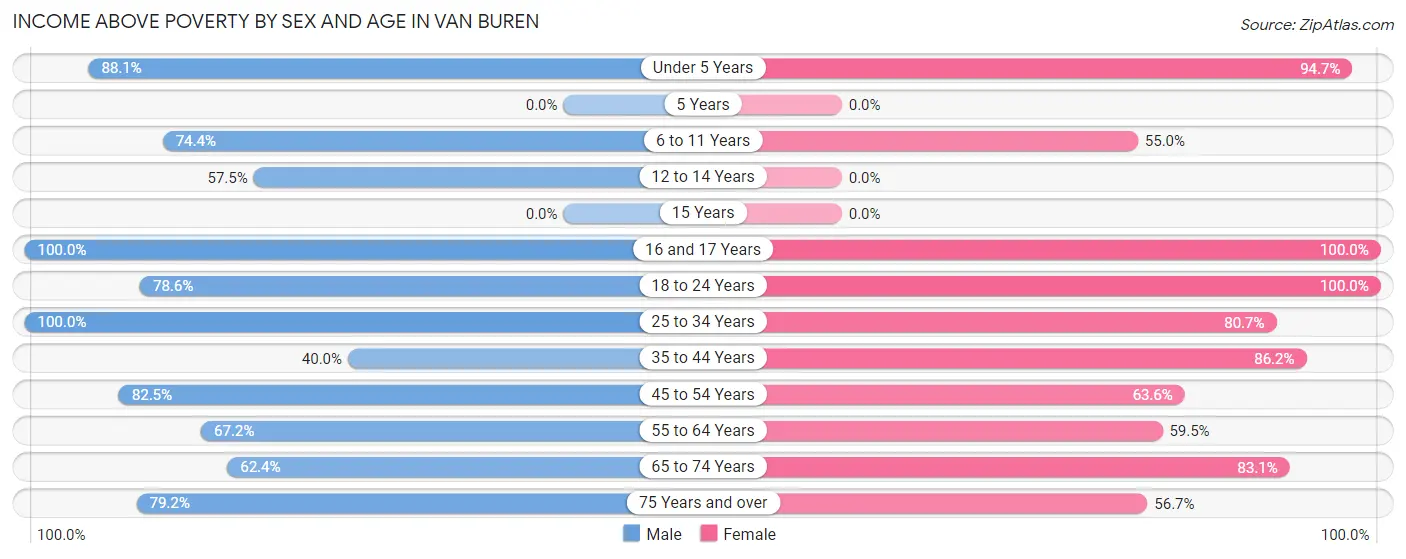
| Age Bracket | Male | Female |
| Under 5 Years | 52 (88.1%) | 18 (94.7%) |
| 5 Years | 0 (0.0%) | 0 (0.0%) |
| 6 to 11 Years | 29 (74.4%) | 61 (54.9%) |
| 12 to 14 Years | 23 (57.5%) | 0 (0.0%) |
| 15 Years | 0 (0.0%) | 0 (0.0%) |
| 16 and 17 Years | 11 (100.0%) | 9 (100.0%) |
| 18 to 24 Years | 44 (78.6%) | 68 (100.0%) |
| 25 to 34 Years | 33 (100.0%) | 50 (80.6%) |
| 35 to 44 Years | 8 (40.0%) | 50 (86.2%) |
| 45 to 54 Years | 66 (82.5%) | 70 (63.6%) |
| 55 to 64 Years | 119 (67.2%) | 75 (59.5%) |
| 65 to 74 Years | 58 (62.4%) | 123 (83.1%) |
| 75 Years and over | 61 (79.2%) | 76 (56.7%) |
| Total | 504 (73.6%) | 600 (71.0%) |
Income Below Poverty Among Married-Couple Families in Van Buren
The poverty statistics for married-couple families in Van Buren show that 3.8% or 8 of the total 212 families live below the poverty line. Families with no children have the highest poverty rate of 4.6%, comprising of 7 families. On the other hand, families with 3 or 4 children have the lowest poverty rate of 0.0%, which includes 0 families.
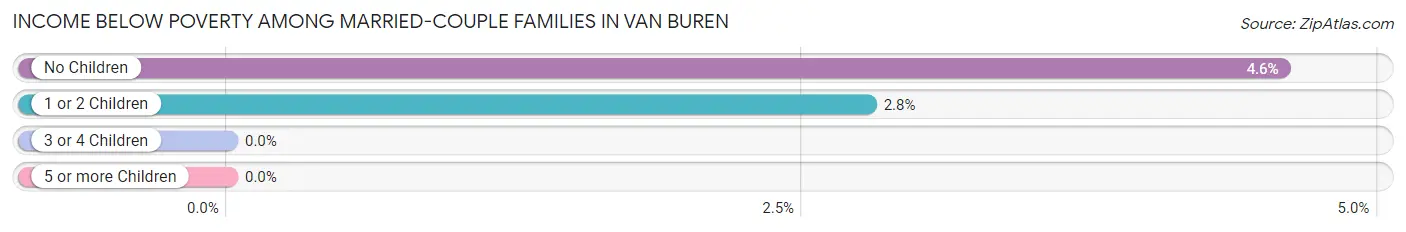
| Children | Above Poverty | Below Poverty |
| No Children | 146 (95.4%) | 7 (4.6%) |
| 1 or 2 Children | 35 (97.2%) | 1 (2.8%) |
| 3 or 4 Children | 23 (100.0%) | 0 (0.0%) |
| 5 or more Children | 0 (0.0%) | 0 (0.0%) |
| Total | 204 (96.2%) | 8 (3.8%) |
Income Below Poverty Among Single-Parent Households in Van Buren
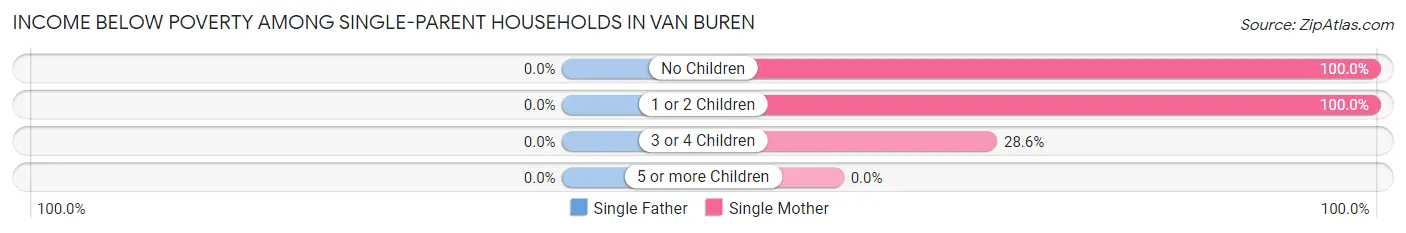
| Children | Single Father | Single Mother |
| No Children | 0 (0.0%) | 4 (100.0%) |
| 1 or 2 Children | 0 (0.0%) | 21 (100.0%) |
| 3 or 4 Children | 0 (0.0%) | 10 (28.6%) |
| 5 or more Children | 0 (0.0%) | 0 (0.0%) |
| Total | 0 (0.0%) | 35 (58.3%) |
Income Below Poverty Among Married-Couple vs Single-Parent Households in Van Buren
The poverty data for Van Buren shows that 8 of the married-couple family households (3.8%) and 35 of the single-parent households (50.0%) are living below the poverty level. Within the married-couple family households, those with no children have the highest poverty rate, with 7 households (4.6%) falling below the poverty line. Among the single-parent households, those with 1 or 2 children have the highest poverty rate, with 21 household (100.0%) living below poverty.
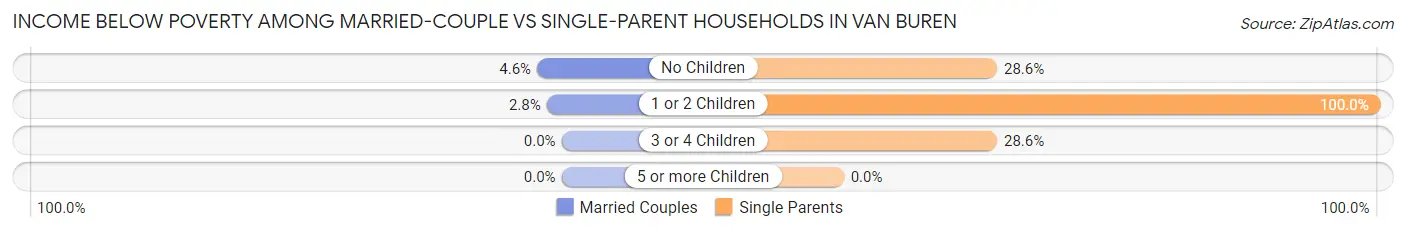
| Children | Married-Couple Families | Single-Parent Households |
| No Children | 7 (4.6%) | 4 (28.6%) |
| 1 or 2 Children | 1 (2.8%) | 21 (100.0%) |
| 3 or 4 Children | 0 (0.0%) | 10 (28.6%) |
| 5 or more Children | 0 (0.0%) | 0 (0.0%) |
| Total | 8 (3.8%) | 35 (50.0%) |
Race in Van Buren
The most populous races in Van Buren are White / Caucasian (1,555 | 92.4%), Black / African American (83 | 4.9%), and Asian (35 | 2.1%).
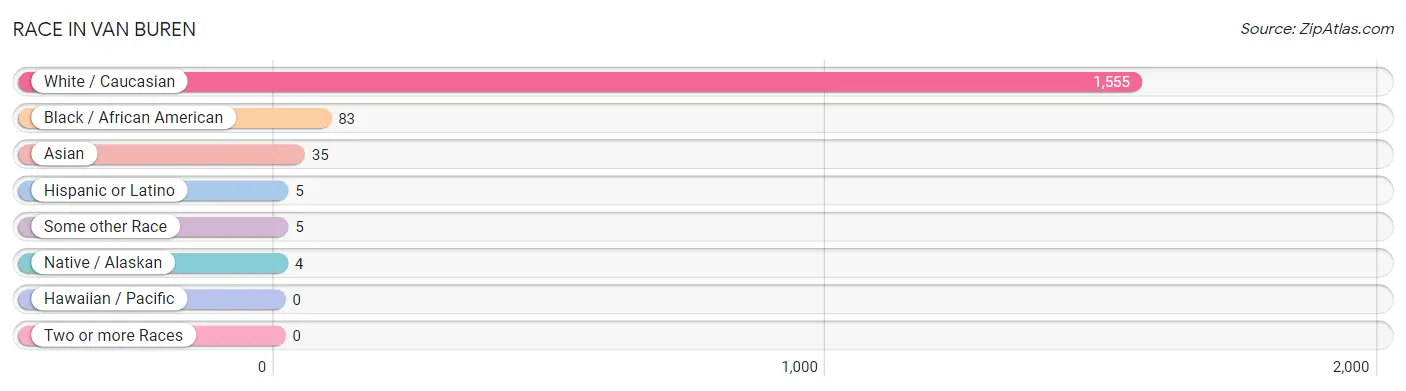
| Race | # Population | % Population |
| Asian | 35 | 2.1% |
| Black / African American | 83 | 4.9% |
| Hawaiian / Pacific | 0 | 0.0% |
| Hispanic or Latino | 5 | 0.3% |
| Native / Alaskan | 4 | 0.2% |
| White / Caucasian | 1,555 | 92.4% |
| Two or more Races | 0 | 0.0% |
| Some other Race | 5 | 0.3% |
| Total | 1,682 | 100.0% |
Ancestry in Van Buren
The most populous ancestries reported in Van Buren are French (424 | 25.2%), French Canadian (276 | 16.4%), American (252 | 15.0%), English (69 | 4.1%), and Scotch-Irish (62 | 3.7%), together accounting for 64.4% of all Van Buren residents.
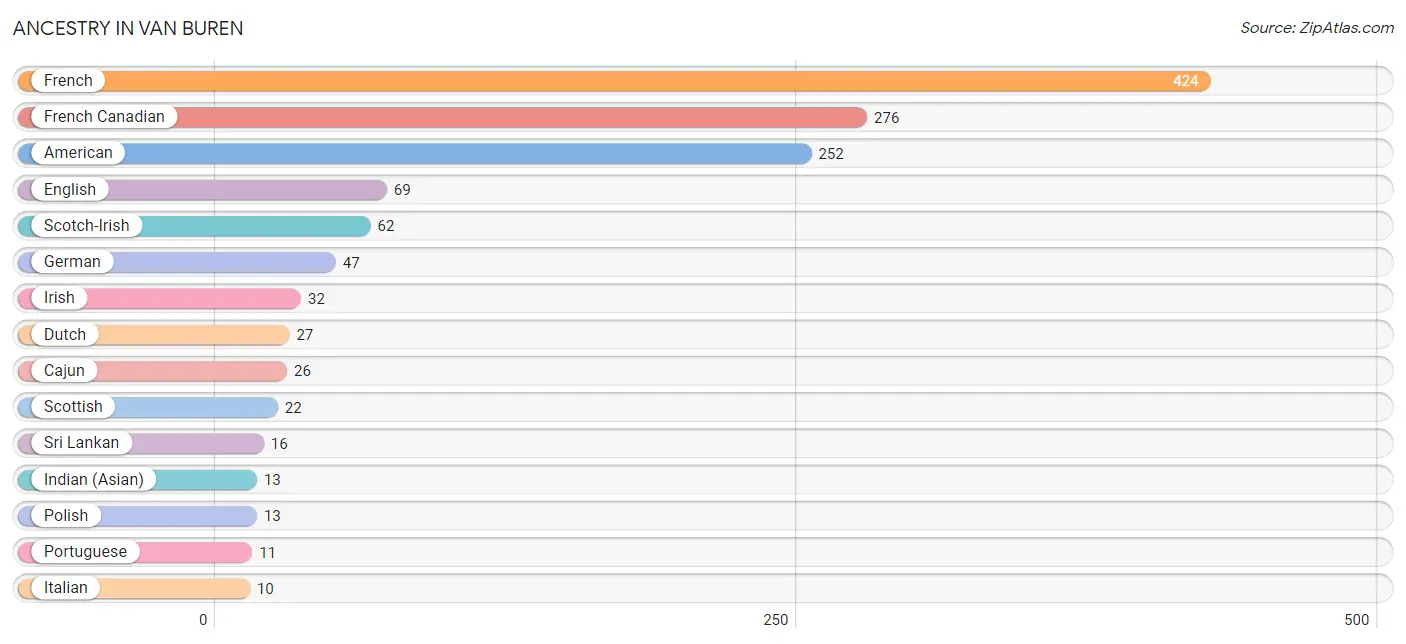
| Ancestry | # Population | % Population |
| American | 252 | 15.0% |
| Cajun | 26 | 1.5% |
| Canadian | 4 | 0.2% |
| Central American | 5 | 0.3% |
| Dutch | 27 | 1.6% |
| English | 69 | 4.1% |
| French | 424 | 25.2% |
| French Canadian | 276 | 16.4% |
| German | 47 | 2.8% |
| Guatemalan | 5 | 0.3% |
| Indian (Asian) | 13 | 0.8% |
| Irish | 32 | 1.9% |
| Italian | 10 | 0.6% |
| Korean | 6 | 0.4% |
| Polish | 13 | 0.8% |
| Portuguese | 11 | 0.6% |
| Scotch-Irish | 62 | 3.7% |
| Scottish | 22 | 1.3% |
| Sri Lankan | 16 | 0.9% |
| Swedish | 10 | 0.6% | View All 20 Rows |
Immigrants in Van Buren
The most numerous immigrant groups reported in Van Buren came from Canada (169 | 10.1%), Asia (29 | 1.7%), China (29 | 1.7%), Eastern Asia (29 | 1.7%), and Taiwan (16 | 0.9%), together accounting for 16.2% of all Van Buren residents.
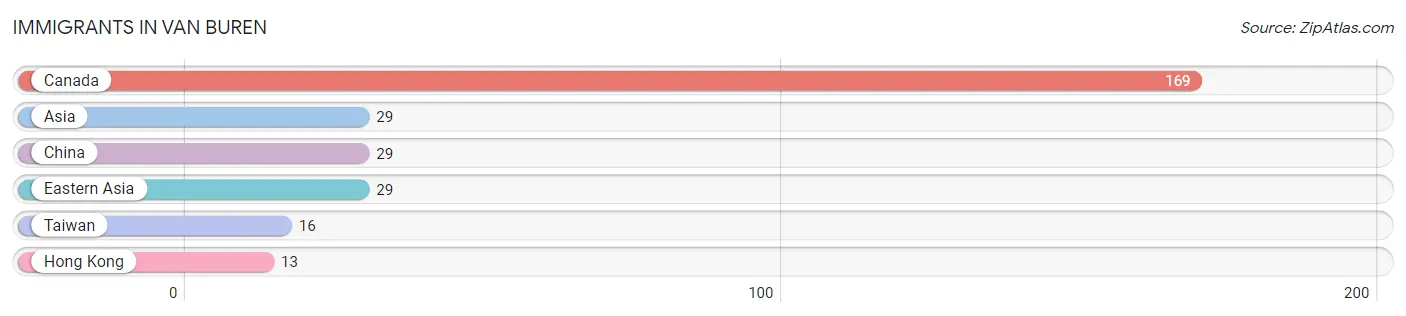
| Immigration Origin | # Population | % Population |
| Asia | 29 | 1.7% |
| Canada | 169 | 10.1% |
| China | 29 | 1.7% |
| Eastern Asia | 29 | 1.7% |
| Hong Kong | 13 | 0.8% |
| Taiwan | 16 | 0.9% | View All 6 Rows |
Sex and Age in Van Buren
Sex and Age in Van Buren
The most populous age groups in Van Buren are 60 to 64 Years (107 | 14.9%) for men and 85 Years and over (116 | 12.0%) for women.
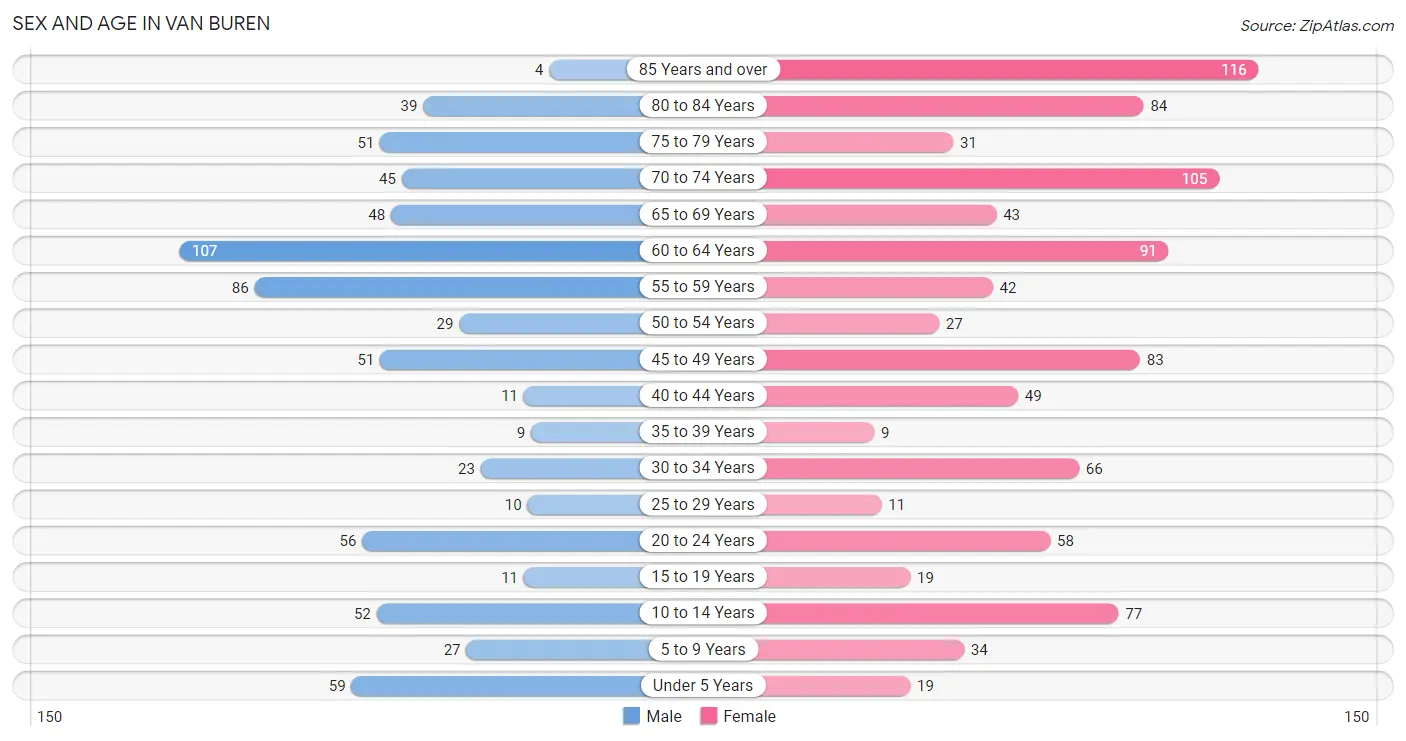
| Age Bracket | Male | Female |
| Under 5 Years | 59 (8.2%) | 19 (2.0%) |
| 5 to 9 Years | 27 (3.8%) | 34 (3.5%) |
| 10 to 14 Years | 52 (7.2%) | 77 (8.0%) |
| 15 to 19 Years | 11 (1.5%) | 19 (2.0%) |
| 20 to 24 Years | 56 (7.8%) | 58 (6.0%) |
| 25 to 29 Years | 10 (1.4%) | 11 (1.1%) |
| 30 to 34 Years | 23 (3.2%) | 66 (6.9%) |
| 35 to 39 Years | 9 (1.3%) | 9 (0.9%) |
| 40 to 44 Years | 11 (1.5%) | 49 (5.1%) |
| 45 to 49 Years | 51 (7.1%) | 83 (8.6%) |
| 50 to 54 Years | 29 (4.0%) | 27 (2.8%) |
| 55 to 59 Years | 86 (12.0%) | 42 (4.4%) |
| 60 to 64 Years | 107 (14.9%) | 91 (9.4%) |
| 65 to 69 Years | 48 (6.7%) | 43 (4.5%) |
| 70 to 74 Years | 45 (6.3%) | 105 (10.9%) |
| 75 to 79 Years | 51 (7.1%) | 31 (3.2%) |
| 80 to 84 Years | 39 (5.4%) | 84 (8.7%) |
| 85 Years and over | 4 (0.6%) | 116 (12.0%) |
| Total | 718 (100.0%) | 964 (100.0%) |
Families and Households in Van Buren
Median Family Size in Van Buren
The median family size in Van Buren is 3.29 persons per family, with single male/father families (10 | 3.5%) accounting for the largest median family size of 4.2 persons per family. On the other hand, married-couple families (212 | 75.2%) represent the smallest median family size with 3.11 persons per family.
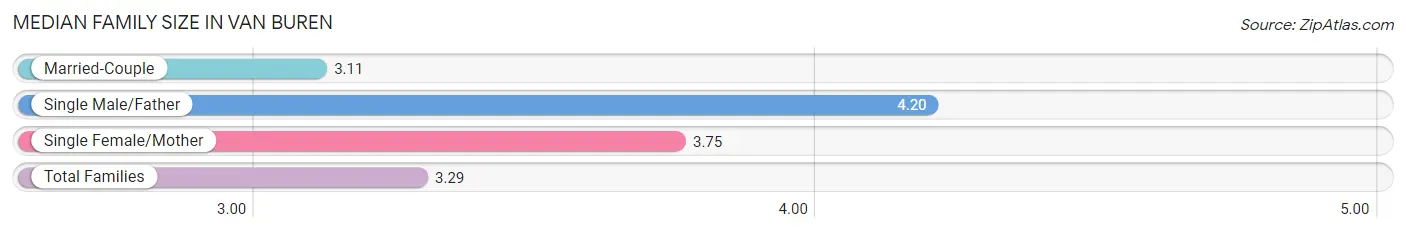
| Family Type | # Families | Family Size |
| Married-Couple | 212 (75.2%) | 3.11 |
| Single Male/Father | 10 (3.5%) | 4.20 |
| Single Female/Mother | 60 (21.3%) | 3.75 |
| Total Families | 282 (100.0%) | 3.29 |
Median Household Size in Van Buren
The median household size in Van Buren is 2.24 persons per household, with single female/mother households (60 | 8.8%) accounting for the largest median household size of 4.45 persons per household. non-family households (397 | 58.5%) represent the smallest median household size with 1.21 persons per household.
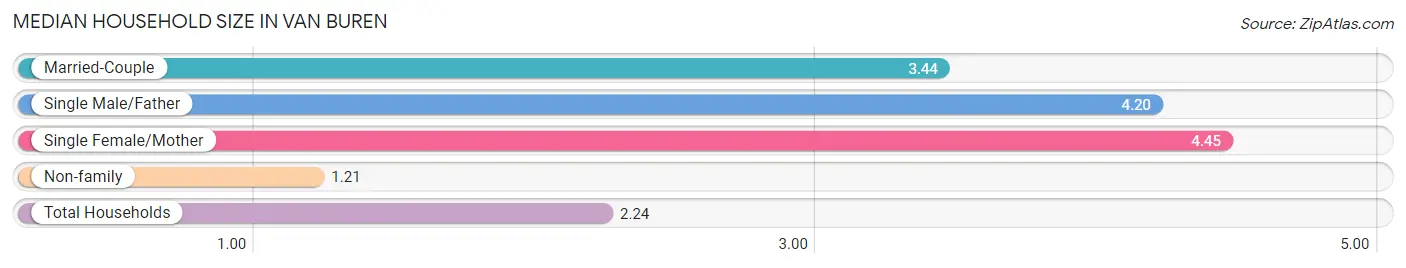
| Household Type | # Households | Household Size |
| Married-Couple | 212 (31.2%) | 3.44 |
| Single Male/Father | 10 (1.5%) | 4.20 |
| Single Female/Mother | 60 (8.8%) | 4.45 |
| Non-family | 397 (58.5%) | 1.21 |
| Total Households | 679 (100.0%) | 2.24 |
Household Size by Marriage Status in Van Buren
Out of a total of 679 households in Van Buren, 282 (41.5%) are family households, while 397 (58.5%) are nonfamily households. The most numerous type of family households are 2-person households, comprising 162, and the most common type of nonfamily households are 1-person households, comprising 343.
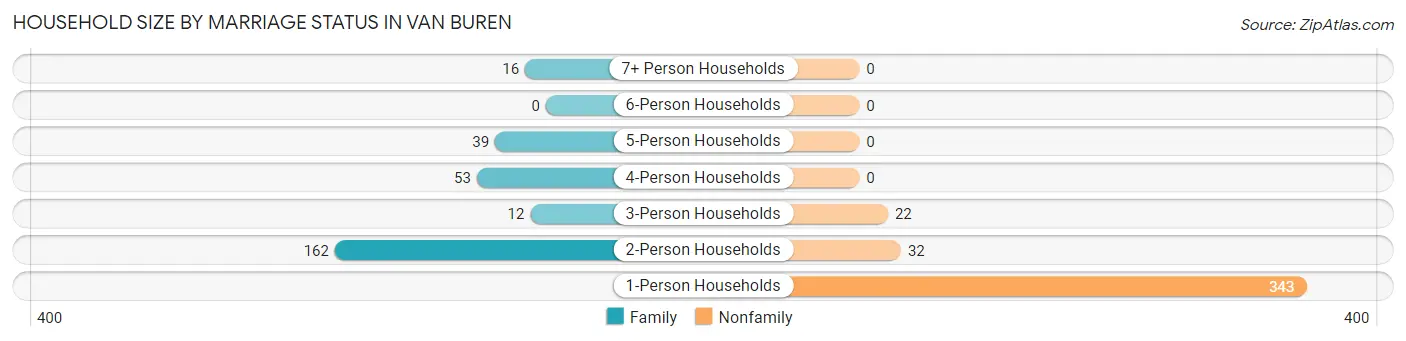
| Household Size | Family Households | Nonfamily Households |
| 1-Person Households | - | 343 (50.5%) |
| 2-Person Households | 162 (23.9%) | 32 (4.7%) |
| 3-Person Households | 12 (1.8%) | 22 (3.2%) |
| 4-Person Households | 53 (7.8%) | 0 (0.0%) |
| 5-Person Households | 39 (5.7%) | 0 (0.0%) |
| 6-Person Households | 0 (0.0%) | 0 (0.0%) |
| 7+ Person Households | 16 (2.4%) | 0 (0.0%) |
| Total | 282 (41.5%) | 397 (58.5%) |
Female Fertility in Van Buren
Fertility by Age in Van Buren
Average fertility rate in Van Buren is 220.0 births per 1,000 women. Women in the age bracket of 20 to 34 years have the highest fertility rate with 481.0 births per 1,000 women. Women in the age bracket of 20 to 34 years acount for 100.0% of all women with births.
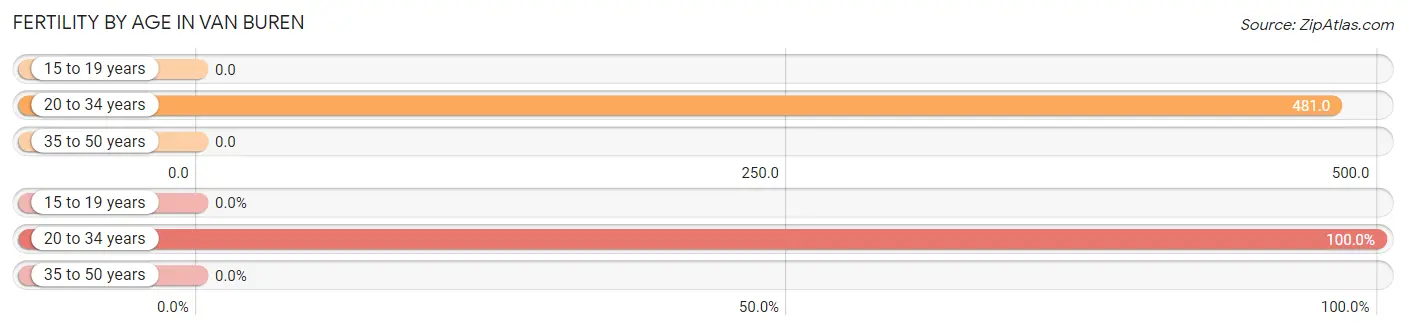
| Age Bracket | Women with Births | Births / 1,000 Women |
| 15 to 19 years | 0 (0.0%) | 0.0 |
| 20 to 34 years | 65 (100.0%) | 481.0 |
| 35 to 50 years | 0 (0.0%) | 0.0 |
| Total | 65 (100.0%) | 220.0 |
Fertility by Age by Marriage Status in Van Buren
16.9% of women with births (65) in Van Buren are married. The highest percentage of unmarried women with births falls into 20 to 34 years age bracket with 83.1% of them unmarried at the time of birth, while the lowest percentage of unmarried women with births belong to 20 to 34 years age bracket with 83.1% of them unmarried.
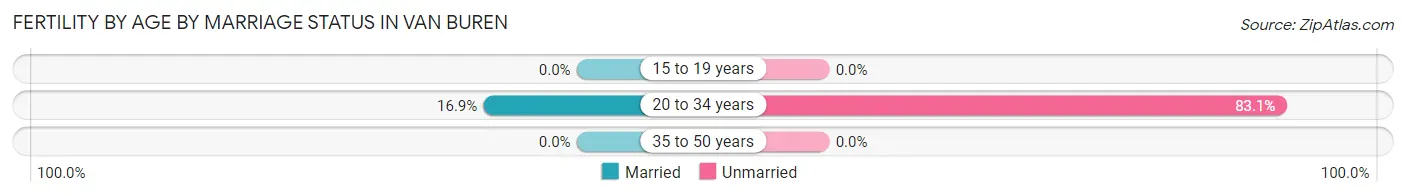
| Age Bracket | Married | Unmarried |
| 15 to 19 years | 0 (0.0%) | 0 (0.0%) |
| 20 to 34 years | 11 (16.9%) | 54 (83.1%) |
| 35 to 50 years | 0 (0.0%) | 0 (0.0%) |
| Total | 11 (16.9%) | 54 (83.1%) |
Fertility by Education in Van Buren
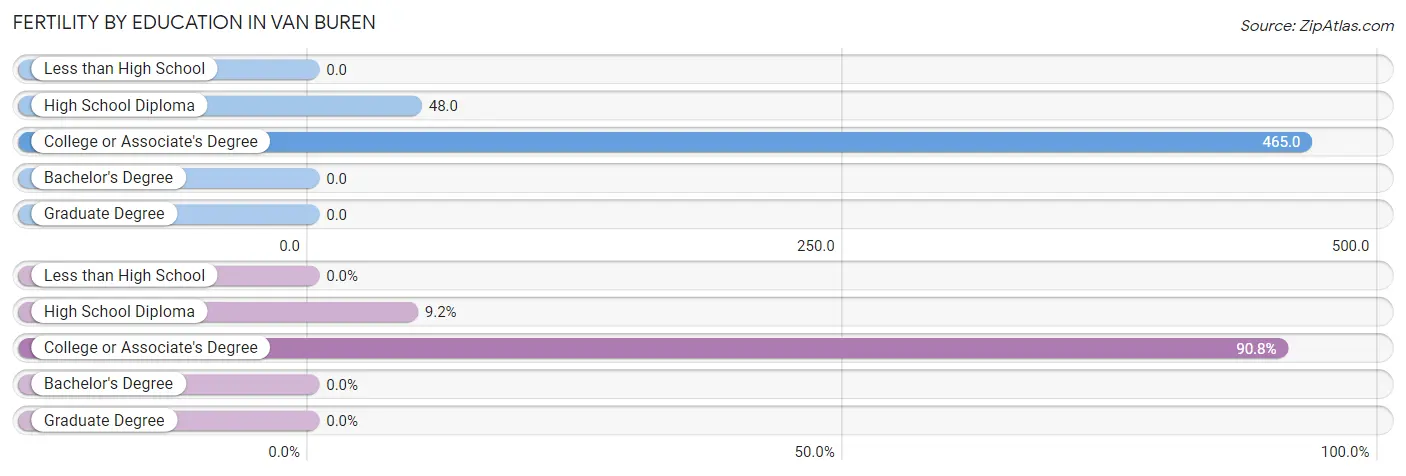
| Educational Attainment | Women with Births | Births / 1,000 Women |
| Less than High School | 0 (0.0%) | 0.0 |
| High School Diploma | 6 (9.2%) | 48.0 |
| College or Associate's Degree | 59 (90.8%) | 465.0 |
| Bachelor's Degree | 0 (0.0%) | 0.0 |
| Graduate Degree | 0 (0.0%) | 0.0 |
| Total | 65 (100.0%) | 220.0 |
Fertility by Education by Marriage Status in Van Buren
83.1% of women with births in Van Buren are unmarried. Women with the educational attainment of college or associate's degree are most likely to be married with 18.6% of them married at childbirth, while women with the educational attainment of high school diploma are least likely to be married with 100.0% of them unmarried at childbirth.
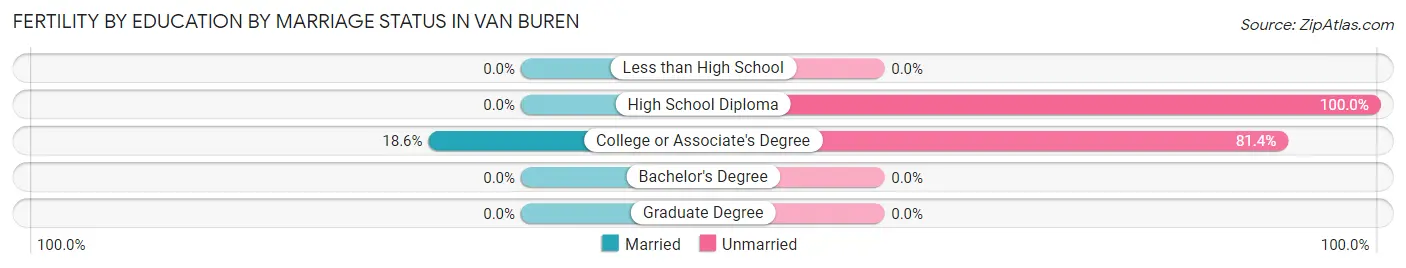
| Educational Attainment | Married | Unmarried |
| Less than High School | 0 (0.0%) | 0 (0.0%) |
| High School Diploma | 0 (0.0%) | 6 (100.0%) |
| College or Associate's Degree | 11 (18.6%) | 48 (81.4%) |
| Bachelor's Degree | 0 (0.0%) | 0 (0.0%) |
| Graduate Degree | 0 (0.0%) | 0 (0.0%) |
| Total | 11 (16.9%) | 54 (83.1%) |
Employment Characteristics in Van Buren
Employment by Class of Employer in Van Buren
Among the 540 employed individuals in Van Buren, private company employees (251 | 46.5%), not-for-profit organizations (90 | 16.7%), and federal government employees (79 | 14.6%) make up the most common classes of employment.
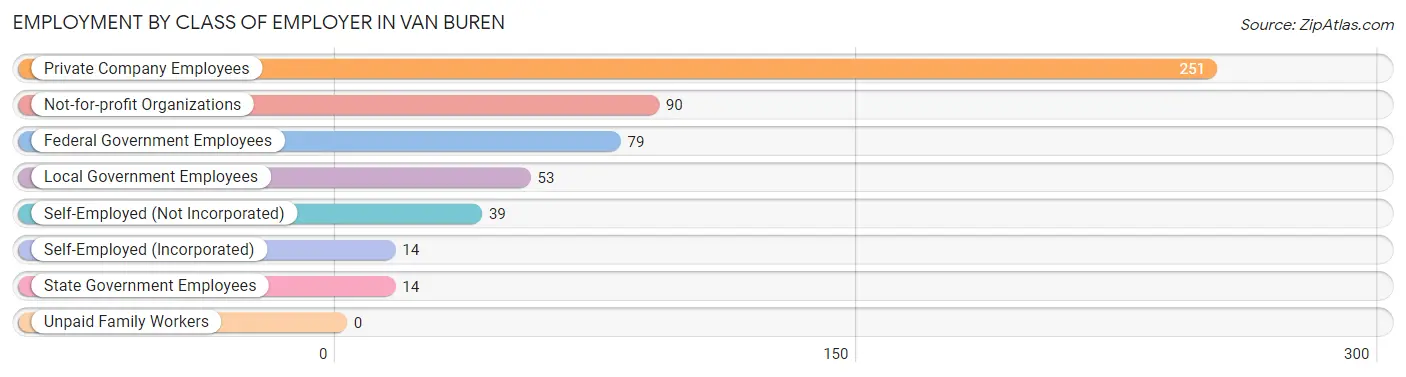
| Employer Class | # Employees | % Employees |
| Private Company Employees | 251 | 46.5% |
| Self-Employed (Incorporated) | 14 | 2.6% |
| Self-Employed (Not Incorporated) | 39 | 7.2% |
| Not-for-profit Organizations | 90 | 16.7% |
| Local Government Employees | 53 | 9.8% |
| State Government Employees | 14 | 2.6% |
| Federal Government Employees | 79 | 14.6% |
| Unpaid Family Workers | 0 | 0.0% |
| Total | 540 | 100.0% |
Employment Status by Age in Van Buren
According to the labor force statistics for Van Buren, out of the total population over 16 years of age (1,414), 39.6% or 560 individuals are in the labor force, with 1.6% or 9 of them unemployed. The age group with the highest labor force participation rate is 25 to 29 years, with 100.0% or 21 individuals in the labor force. Within the labor force, the 30 to 34 years age range has the highest percentage of unemployed individuals, with 8.2% or 6 of them being unemployed.
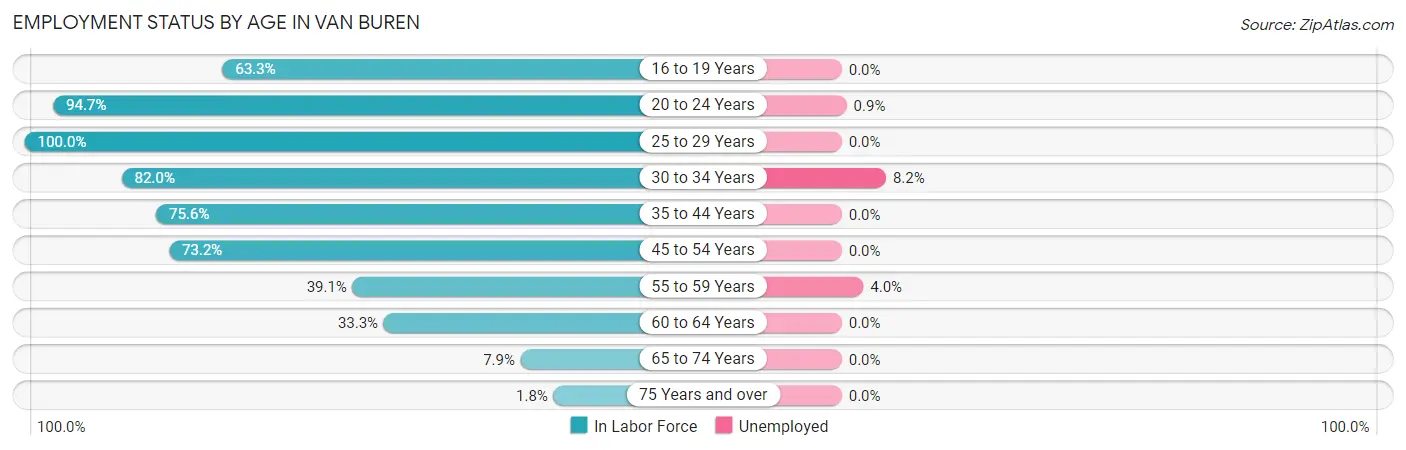
| Age Bracket | In Labor Force | Unemployed |
| 16 to 19 Years | 19 (63.3%) | 0 (0.0%) |
| 20 to 24 Years | 108 (94.7%) | 1 (0.9%) |
| 25 to 29 Years | 21 (100.0%) | 0 (0.0%) |
| 30 to 34 Years | 73 (82.0%) | 6 (8.2%) |
| 35 to 44 Years | 59 (75.6%) | 0 (0.0%) |
| 45 to 54 Years | 139 (73.2%) | 0 (0.0%) |
| 55 to 59 Years | 50 (39.1%) | 2 (4.0%) |
| 60 to 64 Years | 66 (33.3%) | 0 (0.0%) |
| 65 to 74 Years | 19 (7.9%) | 0 (0.0%) |
| 75 Years and over | 6 (1.8%) | 0 (0.0%) |
| Total | 560 (39.6%) | 9 (1.6%) |
Employment Status by Educational Attainment in Van Buren
According to labor force statistics for Van Buren, 58.0% of individuals (408) out of the total population between 25 and 64 years of age (704) are in the labor force, with 2.0% or 8 of them being unemployed. The group with the highest labor force participation rate are those with the educational attainment of high school diploma, with 68.3% or 164 individuals in the labor force. Within the labor force, individuals with high school diploma education have the highest percentage of unemployment, with 3.7% or 6 of them being unemployed.
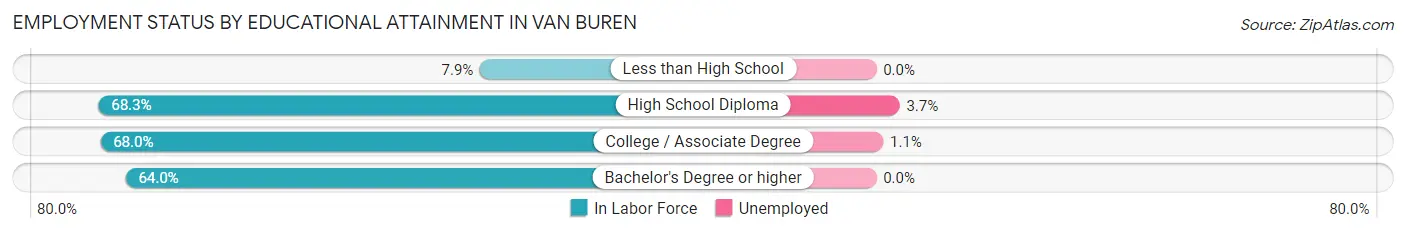
| Educational Attainment | In Labor Force | Unemployed |
| Less than High School | 9 (7.9%) | 0 (0.0%) |
| High School Diploma | 164 (68.3%) | 9 (3.7%) |
| College / Associate Degree | 187 (68.0%) | 3 (1.1%) |
| Bachelor's Degree or higher | 48 (64.0%) | 0 (0.0%) |
| Total | 408 (58.0%) | 14 (2.0%) |
Employment Occupations by Sex in Van Buren
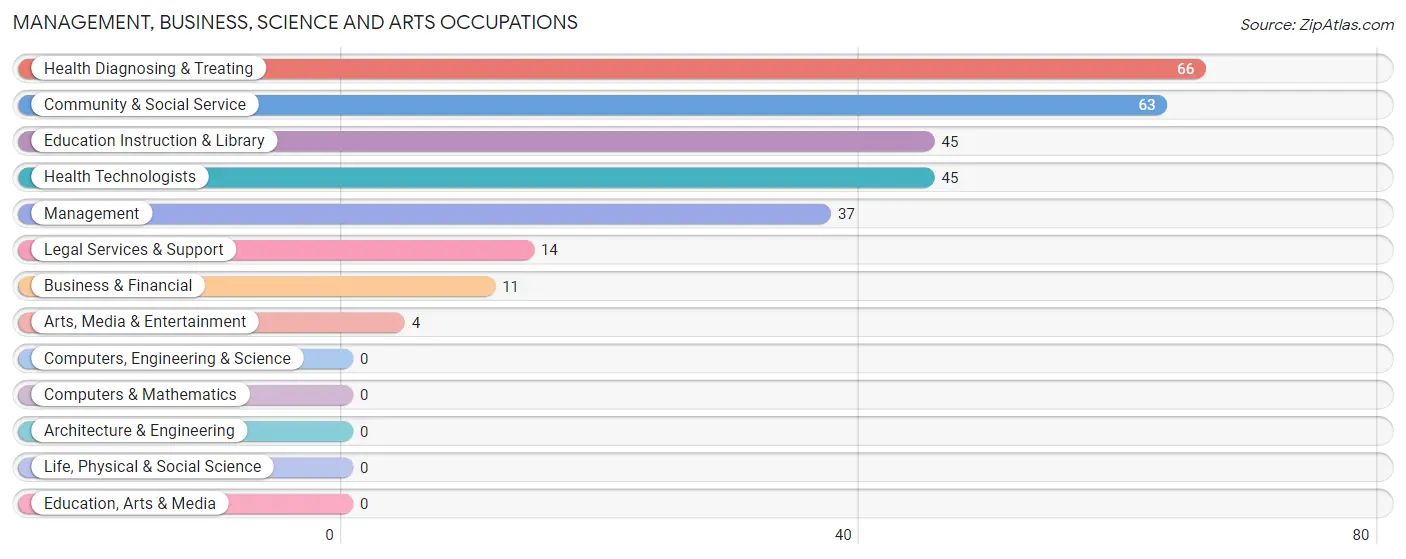
Management, Business, Science and Arts Occupations
The most common Management, Business, Science and Arts occupations in Van Buren are Health Diagnosing & Treating (66 | 12.0%), Community & Social Service (63 | 11.4%), Education Instruction & Library (45 | 8.2%), Health Technologists (45 | 8.2%), and Management (37 | 6.7%).
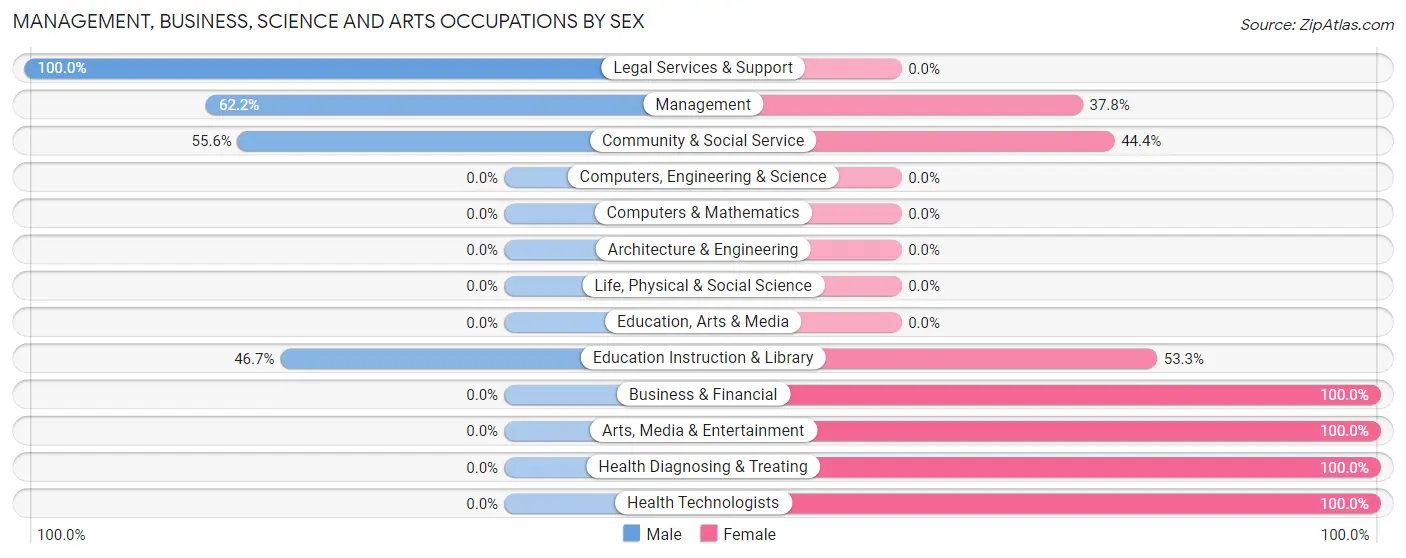
Management, Business, Science and Arts Occupations by Sex
Within the Management, Business, Science and Arts occupations in Van Buren, the most male-oriented occupations are Legal Services & Support (100.0%), Management (62.2%), and Community & Social Service (55.6%), while the most female-oriented occupations are Business & Financial (100.0%), Arts, Media & Entertainment (100.0%), and Health Diagnosing & Treating (100.0%).
| Occupation | Male | Female |
| Management | 23 (62.2%) | 14 (37.8%) |
| Business & Financial | 0 (0.0%) | 11 (100.0%) |
| Computers, Engineering & Science | 0 (0.0%) | 0 (0.0%) |
| Computers & Mathematics | 0 (0.0%) | 0 (0.0%) |
| Architecture & Engineering | 0 (0.0%) | 0 (0.0%) |
| Life, Physical & Social Science | 0 (0.0%) | 0 (0.0%) |
| Community & Social Service | 35 (55.6%) | 28 (44.4%) |
| Education, Arts & Media | 0 (0.0%) | 0 (0.0%) |
| Legal Services & Support | 14 (100.0%) | 0 (0.0%) |
| Education Instruction & Library | 21 (46.7%) | 24 (53.3%) |
| Arts, Media & Entertainment | 0 (0.0%) | 4 (100.0%) |
| Health Diagnosing & Treating | 0 (0.0%) | 66 (100.0%) |
| Health Technologists | 0 (0.0%) | 45 (100.0%) |
| Total (Category) | 58 (32.8%) | 119 (67.2%) |
| Total (Overall) | 245 (44.5%) | 306 (55.5%) |
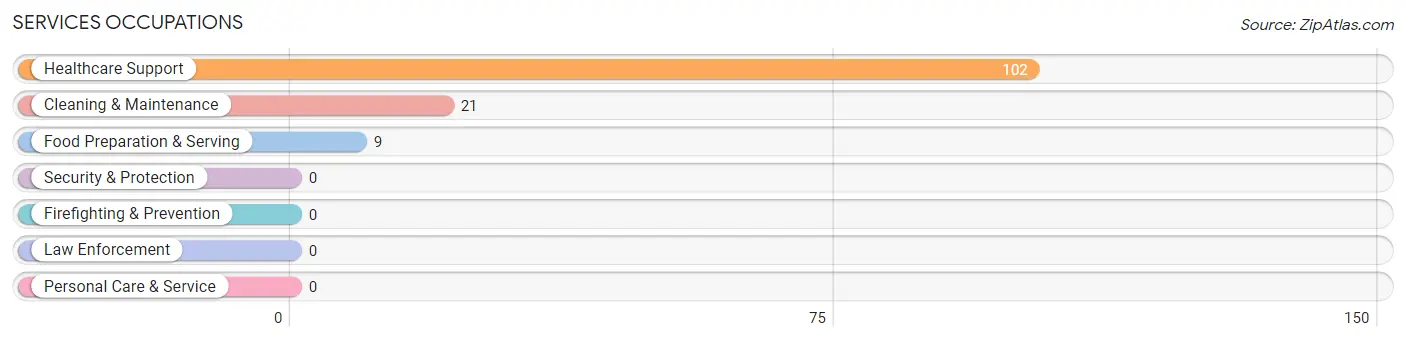
Services Occupations
The most common Services occupations in Van Buren are Healthcare Support (102 | 18.5%), Cleaning & Maintenance (21 | 3.8%), and Food Preparation & Serving (9 | 1.6%).
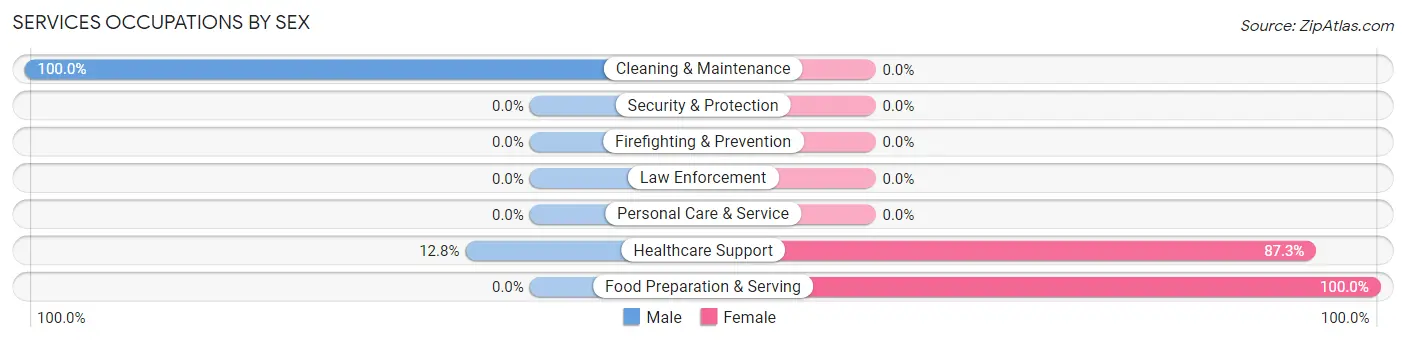
Services Occupations by Sex
Within the Services occupations in Van Buren, the most male-oriented occupations are Cleaning & Maintenance (100.0%), and Healthcare Support (12.8%), while the most female-oriented occupations are Food Preparation & Serving (100.0%), and Healthcare Support (87.3%).
| Occupation | Male | Female |
| Healthcare Support | 13 (12.8%) | 89 (87.3%) |
| Security & Protection | 0 (0.0%) | 0 (0.0%) |
| Firefighting & Prevention | 0 (0.0%) | 0 (0.0%) |
| Law Enforcement | 0 (0.0%) | 0 (0.0%) |
| Food Preparation & Serving | 0 (0.0%) | 9 (100.0%) |
| Cleaning & Maintenance | 21 (100.0%) | 0 (0.0%) |
| Personal Care & Service | 0 (0.0%) | 0 (0.0%) |
| Total (Category) | 34 (25.8%) | 98 (74.2%) |
| Total (Overall) | 245 (44.5%) | 306 (55.5%) |
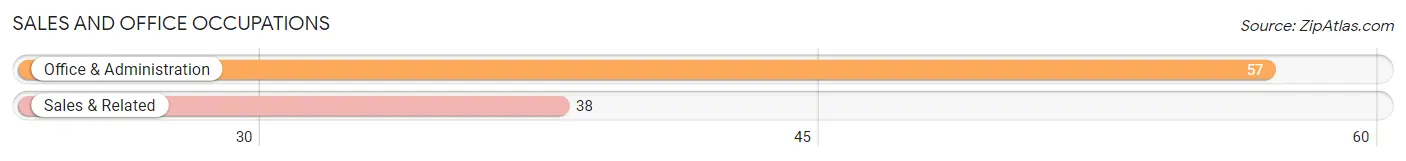
Sales and Office Occupations
The most common Sales and Office occupations in Van Buren are Office & Administration (57 | 10.3%), and Sales & Related (38 | 6.9%).
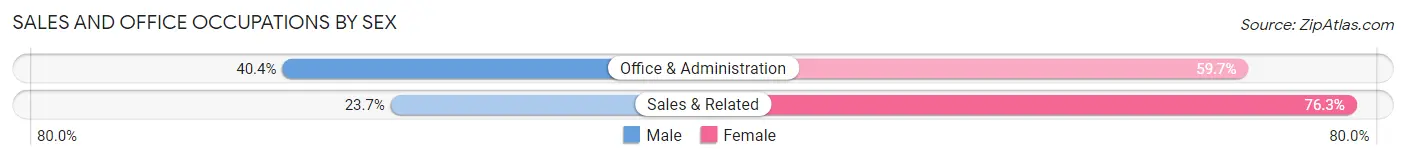
Sales and Office Occupations by Sex
| Occupation | Male | Female |
| Sales & Related | 9 (23.7%) | 29 (76.3%) |
| Office & Administration | 23 (40.4%) | 34 (59.7%) |
| Total (Category) | 32 (33.7%) | 63 (66.3%) |
| Total (Overall) | 245 (44.5%) | 306 (55.5%) |
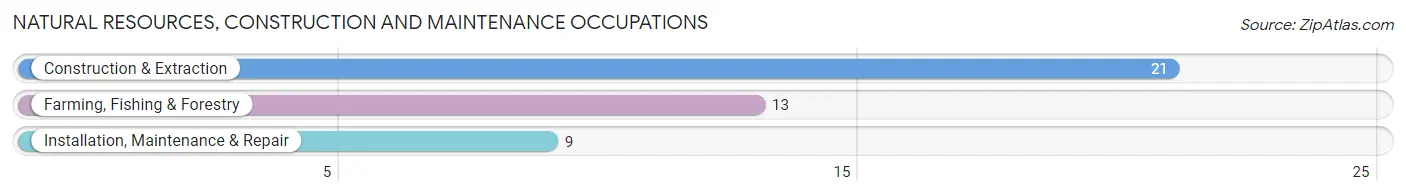
Natural Resources, Construction and Maintenance Occupations
The most common Natural Resources, Construction and Maintenance occupations in Van Buren are Construction & Extraction (21 | 3.8%), Farming, Fishing & Forestry (13 | 2.4%), and Installation, Maintenance & Repair (9 | 1.6%).
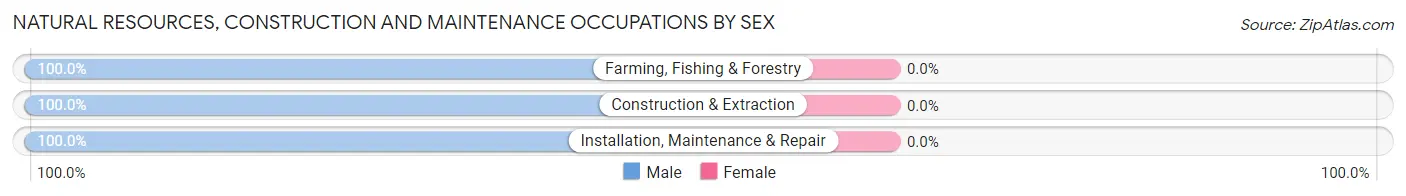
Natural Resources, Construction and Maintenance Occupations by Sex
| Occupation | Male | Female |
| Farming, Fishing & Forestry | 13 (100.0%) | 0 (0.0%) |
| Construction & Extraction | 21 (100.0%) | 0 (0.0%) |
| Installation, Maintenance & Repair | 9 (100.0%) | 0 (0.0%) |
| Total (Category) | 43 (100.0%) | 0 (0.0%) |
| Total (Overall) | 245 (44.5%) | 306 (55.5%) |
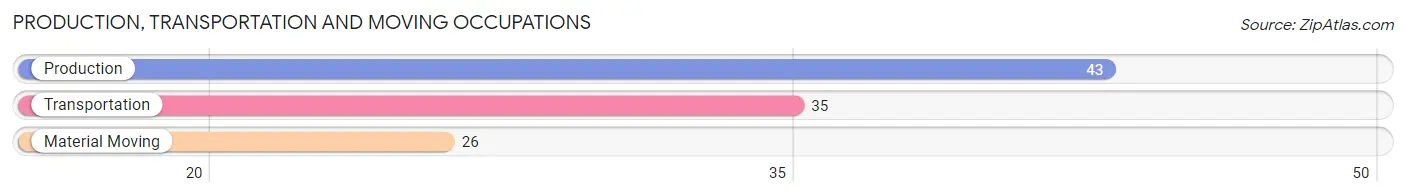
Production, Transportation and Moving Occupations
The most common Production, Transportation and Moving occupations in Van Buren are Production (43 | 7.8%), Transportation (35 | 6.4%), and Material Moving (26 | 4.7%).
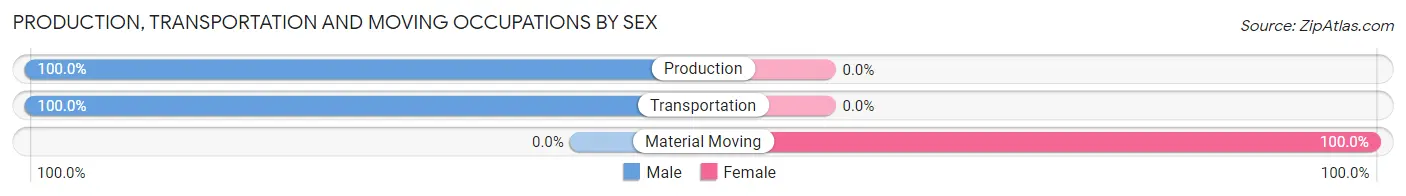
Production, Transportation and Moving Occupations by Sex
| Occupation | Male | Female |
| Production | 43 (100.0%) | 0 (0.0%) |
| Transportation | 35 (100.0%) | 0 (0.0%) |
| Material Moving | 0 (0.0%) | 26 (100.0%) |
| Total (Category) | 78 (75.0%) | 26 (25.0%) |
| Total (Overall) | 245 (44.5%) | 306 (55.5%) |
Employment Industries by Sex in Van Buren
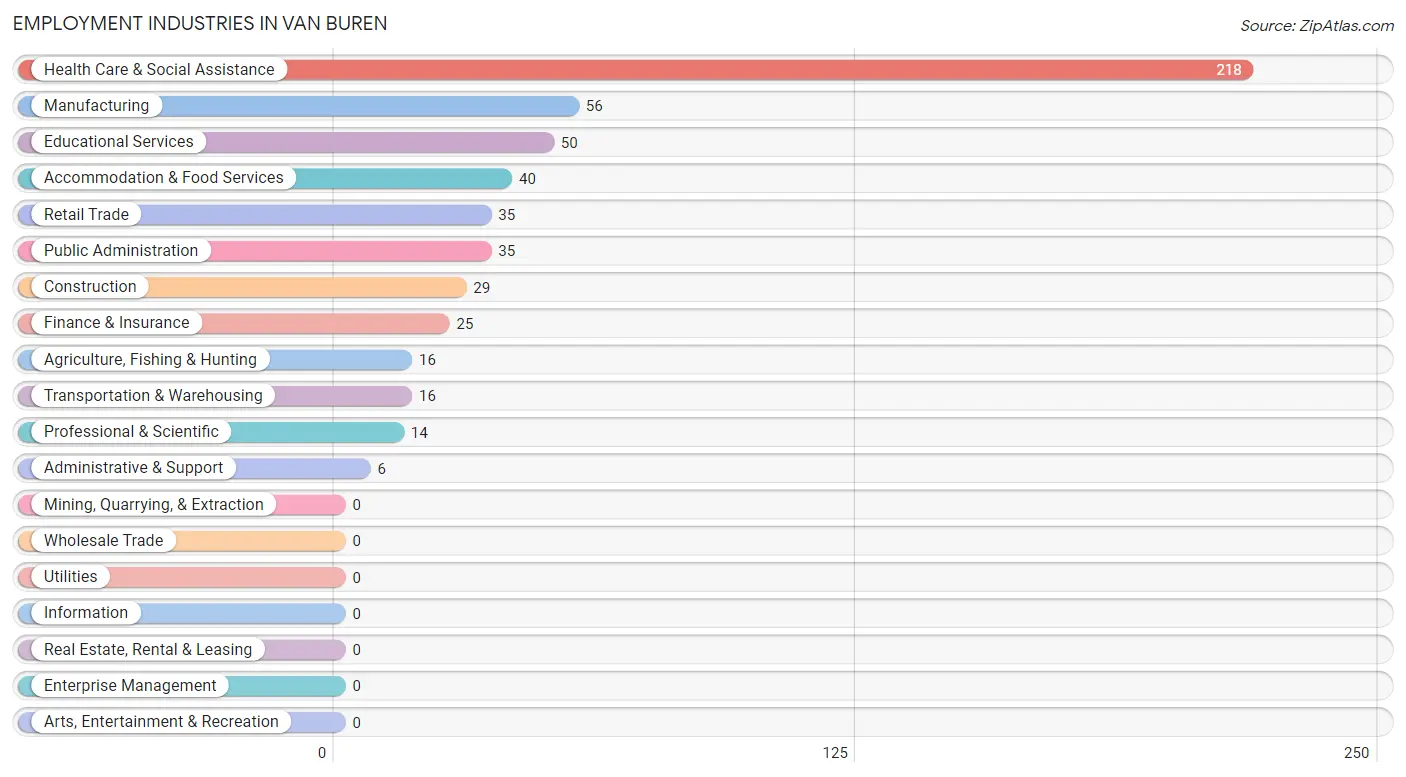
Employment Industries in Van Buren
The major employment industries in Van Buren include Health Care & Social Assistance (218 | 39.6%), Manufacturing (56 | 10.2%), Educational Services (50 | 9.1%), Accommodation & Food Services (40 | 7.3%), and Retail Trade (35 | 6.4%).
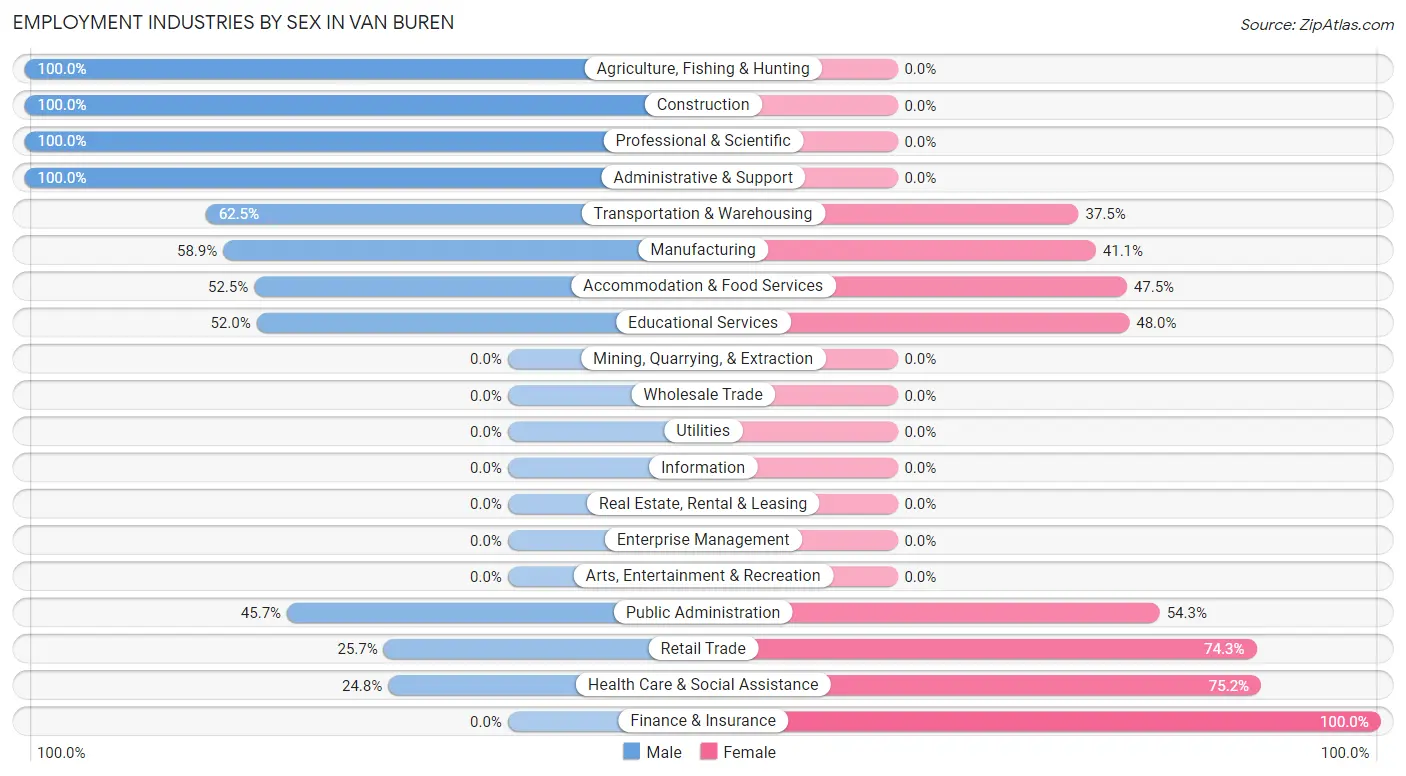
Employment Industries by Sex in Van Buren
The Van Buren industries that see more men than women are Agriculture, Fishing & Hunting (100.0%), Construction (100.0%), and Professional & Scientific (100.0%), whereas the industries that tend to have a higher number of women are Finance & Insurance (100.0%), Health Care & Social Assistance (75.2%), and Retail Trade (74.3%).
| Industry | Male | Female |
| Agriculture, Fishing & Hunting | 16 (100.0%) | 0 (0.0%) |
| Mining, Quarrying, & Extraction | 0 (0.0%) | 0 (0.0%) |
| Construction | 29 (100.0%) | 0 (0.0%) |
| Manufacturing | 33 (58.9%) | 23 (41.1%) |
| Wholesale Trade | 0 (0.0%) | 0 (0.0%) |
| Retail Trade | 9 (25.7%) | 26 (74.3%) |
| Transportation & Warehousing | 10 (62.5%) | 6 (37.5%) |
| Utilities | 0 (0.0%) | 0 (0.0%) |
| Information | 0 (0.0%) | 0 (0.0%) |
| Finance & Insurance | 0 (0.0%) | 25 (100.0%) |
| Real Estate, Rental & Leasing | 0 (0.0%) | 0 (0.0%) |
| Professional & Scientific | 14 (100.0%) | 0 (0.0%) |
| Enterprise Management | 0 (0.0%) | 0 (0.0%) |
| Administrative & Support | 6 (100.0%) | 0 (0.0%) |
| Educational Services | 26 (52.0%) | 24 (48.0%) |
| Health Care & Social Assistance | 54 (24.8%) | 164 (75.2%) |
| Arts, Entertainment & Recreation | 0 (0.0%) | 0 (0.0%) |
| Accommodation & Food Services | 21 (52.5%) | 19 (47.5%) |
| Public Administration | 16 (45.7%) | 19 (54.3%) |
| Total | 245 (44.5%) | 306 (55.5%) |
Education in Van Buren
School Enrollment in Van Buren
The most common levels of schooling among the 288 students in Van Buren are middle school (102 | 35.4%), elementary school (65 | 22.6%), and college / undergraduate (51 | 17.7%).
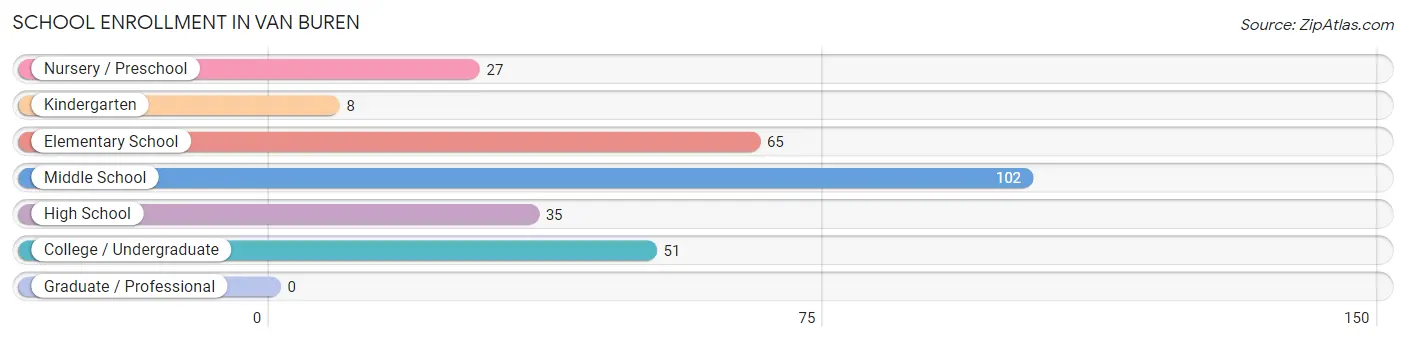
| School Level | # Students | % Students |
| Nursery / Preschool | 27 | 9.4% |
| Kindergarten | 8 | 2.8% |
| Elementary School | 65 | 22.6% |
| Middle School | 102 | 35.4% |
| High School | 35 | 12.1% |
| College / Undergraduate | 51 | 17.7% |
| Graduate / Professional | 0 | 0.0% |
| Total | 288 | 100.0% |
School Enrollment by Age by Funding Source in Van Buren
Out of a total of 288 students who are enrolled in schools in Van Buren, 1 (0.3%) attend a private institution, while the remaining 287 (99.7%) are enrolled in public schools. The age group of 3 to 4 year olds has the highest likelihood of being enrolled in private schools, with 1 (3.7% in the age bracket) enrolled. Conversely, the age group of 5 to 9 year old has the lowest likelihood of being enrolled in a private school, with 61 (100.0% in the age bracket) attending a public institution.
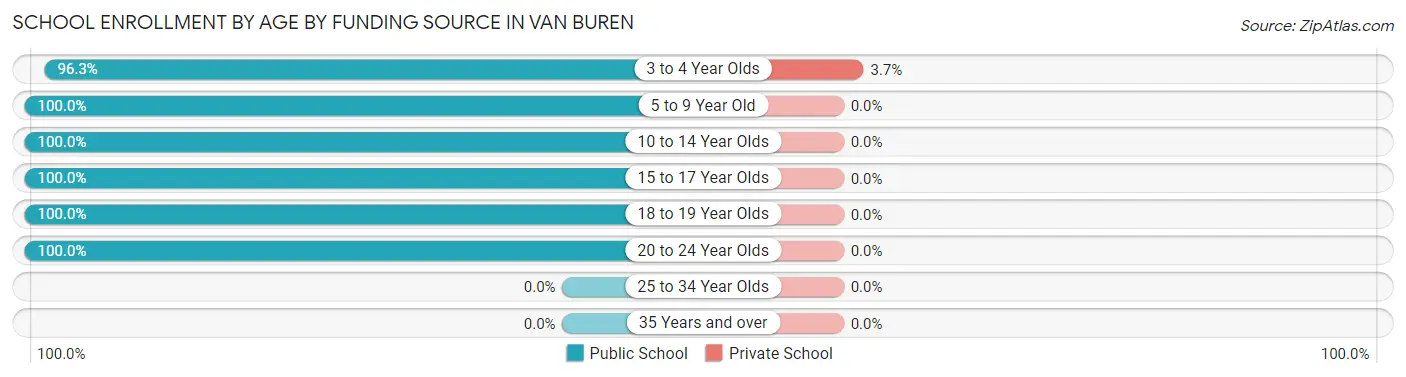
| Age Bracket | Public School | Private School |
| 3 to 4 Year Olds | 26 (96.3%) | 1 (3.7%) |
| 5 to 9 Year Old | 61 (100.0%) | 0 (0.0%) |
| 10 to 14 Year Olds | 129 (100.0%) | 0 (0.0%) |
| 15 to 17 Year Olds | 20 (100.0%) | 0 (0.0%) |
| 18 to 19 Year Olds | 10 (100.0%) | 0 (0.0%) |
| 20 to 24 Year Olds | 41 (100.0%) | 0 (0.0%) |
| 25 to 34 Year Olds | 0 (0.0%) | 0 (0.0%) |
| 35 Years and over | 0 (0.0%) | 0 (0.0%) |
| Total | 287 (99.7%) | 1 (0.3%) |
Educational Attainment by Field of Study in Van Buren
Education (30 | 27.0%), liberal arts & history (24 | 21.6%), business (21 | 18.9%), science & technology (16 | 14.4%), and bio, nature & agricultural (12 | 10.8%) are the most common fields of study among 111 individuals in Van Buren who have obtained a bachelor's degree or higher.
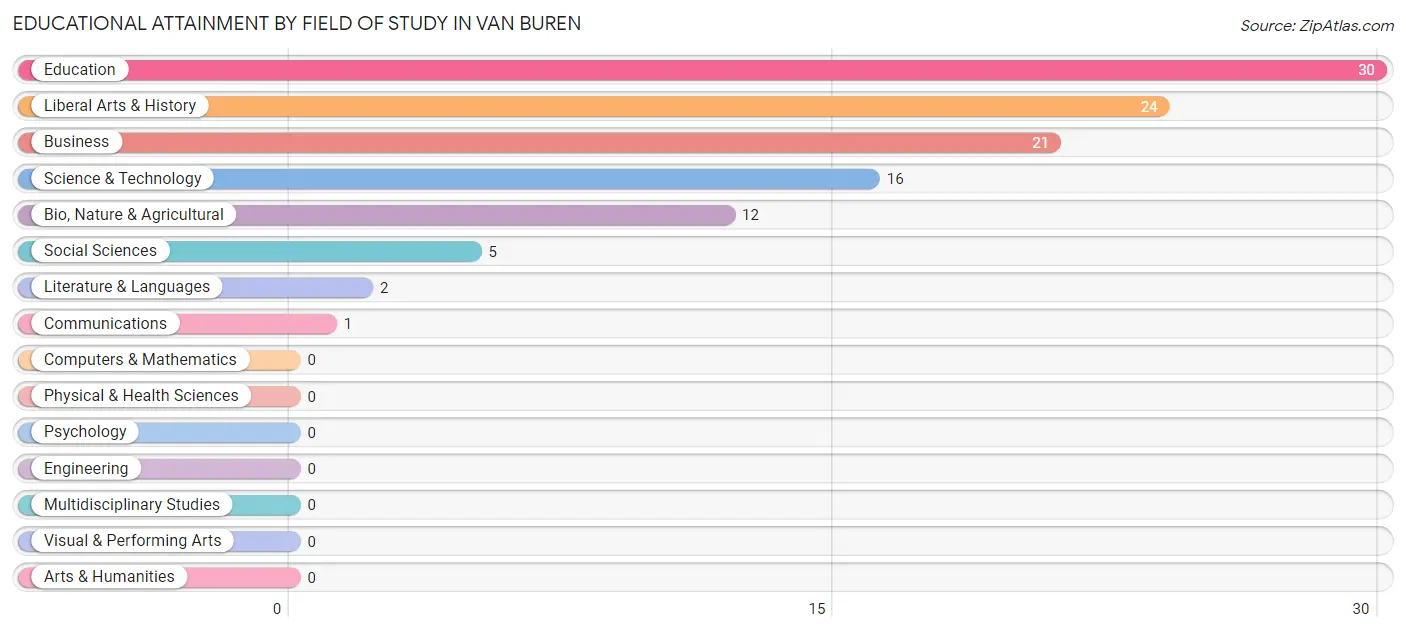
| Field of Study | # Graduates | % Graduates |
| Computers & Mathematics | 0 | 0.0% |
| Bio, Nature & Agricultural | 12 | 10.8% |
| Physical & Health Sciences | 0 | 0.0% |
| Psychology | 0 | 0.0% |
| Social Sciences | 5 | 4.5% |
| Engineering | 0 | 0.0% |
| Multidisciplinary Studies | 0 | 0.0% |
| Science & Technology | 16 | 14.4% |
| Business | 21 | 18.9% |
| Education | 30 | 27.0% |
| Literature & Languages | 2 | 1.8% |
| Liberal Arts & History | 24 | 21.6% |
| Visual & Performing Arts | 0 | 0.0% |
| Communications | 1 | 0.9% |
| Arts & Humanities | 0 | 0.0% |
| Total | 111 | 100.0% |
Transportation & Commute in Van Buren
Vehicle Availability by Sex in Van Buren
The most prevalent vehicle ownership categories in Van Buren are males with 3 vehicles (96, accounting for 39.8%) and females with 3 vehicles (86, making up 32.5%).
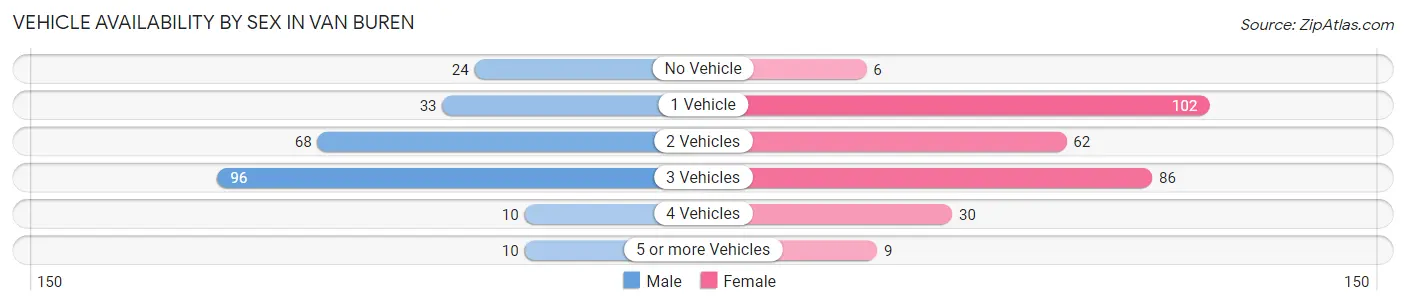
| Vehicles Available | Male | Female |
| No Vehicle | 24 (10.0%) | 6 (2.0%) |
| 1 Vehicle | 33 (13.7%) | 102 (34.6%) |
| 2 Vehicles | 68 (28.2%) | 62 (21.0%) |
| 3 Vehicles | 96 (39.8%) | 86 (29.1%) |
| 4 Vehicles | 10 (4.2%) | 30 (10.2%) |
| 5 or more Vehicles | 10 (4.2%) | 9 (3.0%) |
| Total | 241 (100.0%) | 295 (100.0%) |
Commute Time in Van Buren
The most frequently occuring commute durations in Van Buren are 5 to 9 minutes (98 commuters, 20.2%), 30 to 34 minutes (93 commuters, 19.2%), and less than 5 minutes (81 commuters, 16.7%).
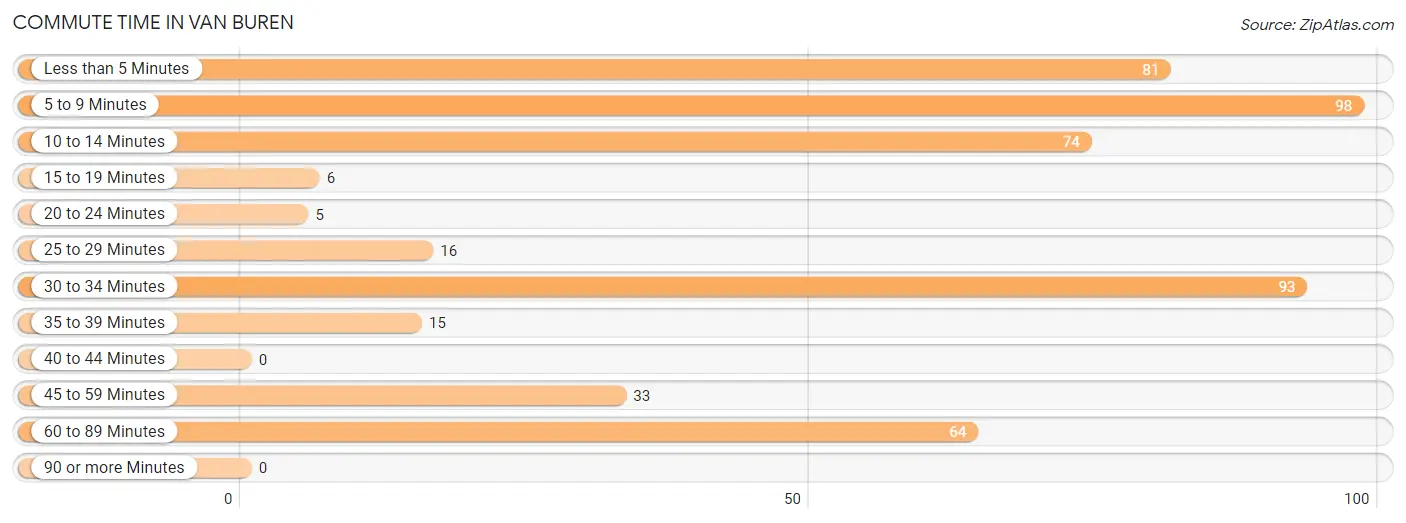
| Commute Time | # Commuters | % Commuters |
| Less than 5 Minutes | 81 | 16.7% |
| 5 to 9 Minutes | 98 | 20.2% |
| 10 to 14 Minutes | 74 | 15.3% |
| 15 to 19 Minutes | 6 | 1.2% |
| 20 to 24 Minutes | 5 | 1.0% |
| 25 to 29 Minutes | 16 | 3.3% |
| 30 to 34 Minutes | 93 | 19.2% |
| 35 to 39 Minutes | 15 | 3.1% |
| 40 to 44 Minutes | 0 | 0.0% |
| 45 to 59 Minutes | 33 | 6.8% |
| 60 to 89 Minutes | 64 | 13.2% |
| 90 or more Minutes | 0 | 0.0% |
Commute Time by Sex in Van Buren
The most common commute times in Van Buren are 5 to 9 minutes (51 commuters, 23.4%) for males and 30 to 34 minutes (70 commuters, 26.2%) for females.
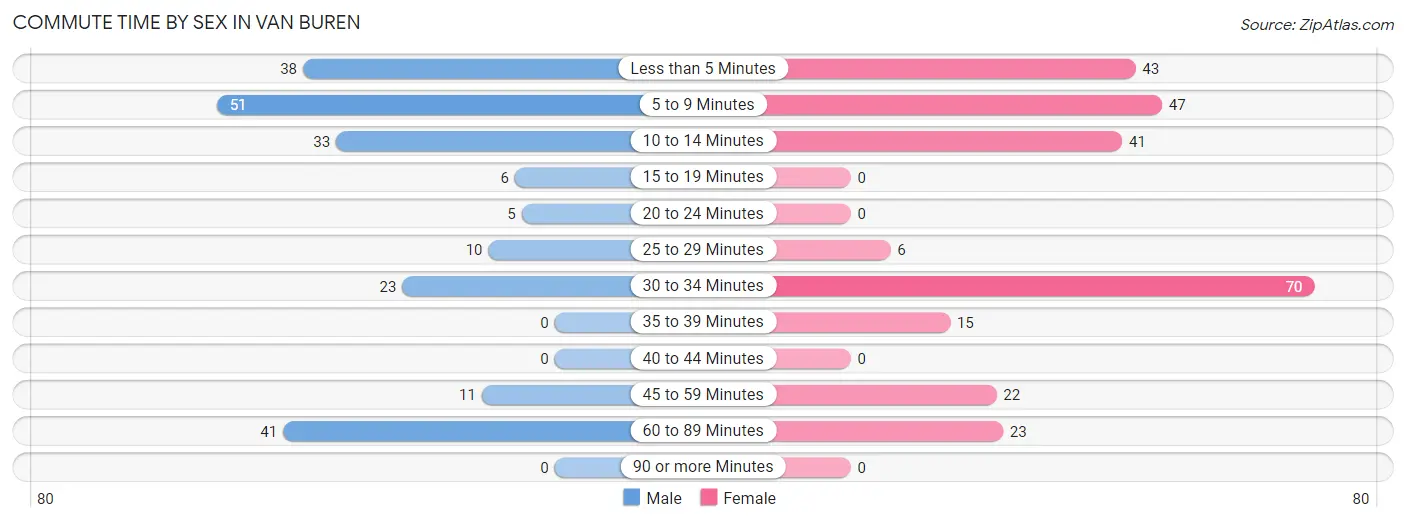
| Commute Time | Male | Female |
| Less than 5 Minutes | 38 (17.4%) | 43 (16.1%) |
| 5 to 9 Minutes | 51 (23.4%) | 47 (17.6%) |
| 10 to 14 Minutes | 33 (15.1%) | 41 (15.4%) |
| 15 to 19 Minutes | 6 (2.8%) | 0 (0.0%) |
| 20 to 24 Minutes | 5 (2.3%) | 0 (0.0%) |
| 25 to 29 Minutes | 10 (4.6%) | 6 (2.2%) |
| 30 to 34 Minutes | 23 (10.5%) | 70 (26.2%) |
| 35 to 39 Minutes | 0 (0.0%) | 15 (5.6%) |
| 40 to 44 Minutes | 0 (0.0%) | 0 (0.0%) |
| 45 to 59 Minutes | 11 (5.1%) | 22 (8.2%) |
| 60 to 89 Minutes | 41 (18.8%) | 23 (8.6%) |
| 90 or more Minutes | 0 (0.0%) | 0 (0.0%) |
Time of Departure to Work by Sex in Van Buren
The most frequent times of departure to work in Van Buren are 7:00 AM to 7:29 AM (40, 18.3%) for males and 8:00 AM to 8:29 AM (65, 24.3%) for females.
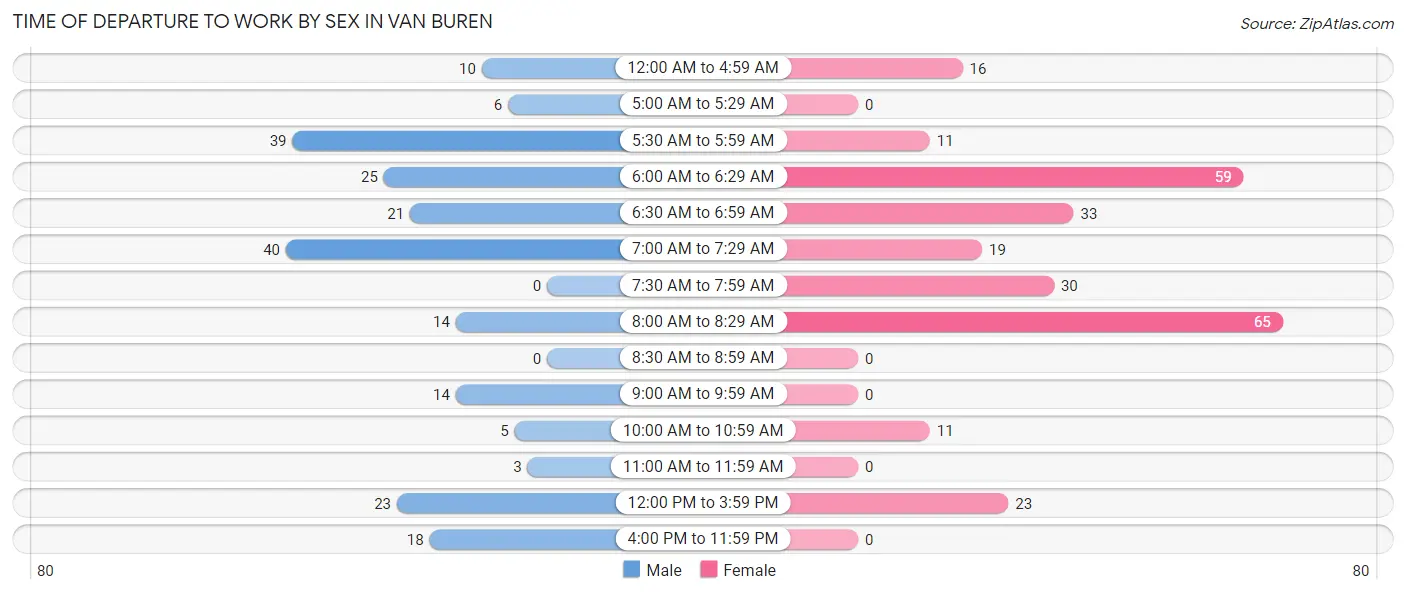
| Time of Departure | Male | Female |
| 12:00 AM to 4:59 AM | 10 (4.6%) | 16 (6.0%) |
| 5:00 AM to 5:29 AM | 6 (2.8%) | 0 (0.0%) |
| 5:30 AM to 5:59 AM | 39 (17.9%) | 11 (4.1%) |
| 6:00 AM to 6:29 AM | 25 (11.5%) | 59 (22.1%) |
| 6:30 AM to 6:59 AM | 21 (9.6%) | 33 (12.4%) |
| 7:00 AM to 7:29 AM | 40 (18.3%) | 19 (7.1%) |
| 7:30 AM to 7:59 AM | 0 (0.0%) | 30 (11.2%) |
| 8:00 AM to 8:29 AM | 14 (6.4%) | 65 (24.3%) |
| 8:30 AM to 8:59 AM | 0 (0.0%) | 0 (0.0%) |
| 9:00 AM to 9:59 AM | 14 (6.4%) | 0 (0.0%) |
| 10:00 AM to 10:59 AM | 5 (2.3%) | 11 (4.1%) |
| 11:00 AM to 11:59 AM | 3 (1.4%) | 0 (0.0%) |
| 12:00 PM to 3:59 PM | 23 (10.5%) | 23 (8.6%) |
| 4:00 PM to 11:59 PM | 18 (8.3%) | 0 (0.0%) |
| Total | 218 (100.0%) | 267 (100.0%) |
Housing Occupancy in Van Buren
Occupancy by Ownership in Van Buren
Of the total 679 dwellings in Van Buren, owner-occupied units account for 437 (64.4%), while renter-occupied units make up 242 (35.6%).
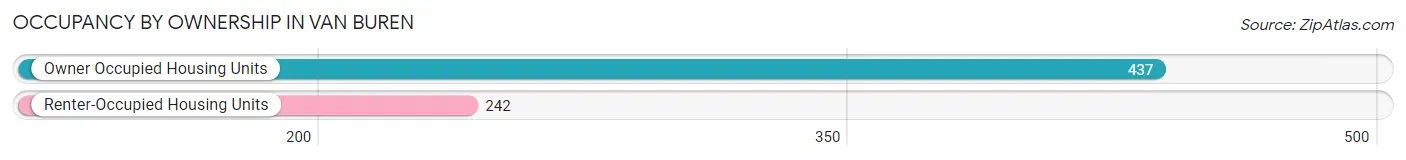
| Occupancy | # Housing Units | % Housing Units |
| Owner Occupied Housing Units | 437 | 64.4% |
| Renter-Occupied Housing Units | 242 | 35.6% |
| Total Occupied Housing Units | 679 | 100.0% |
Occupancy by Household Size in Van Buren
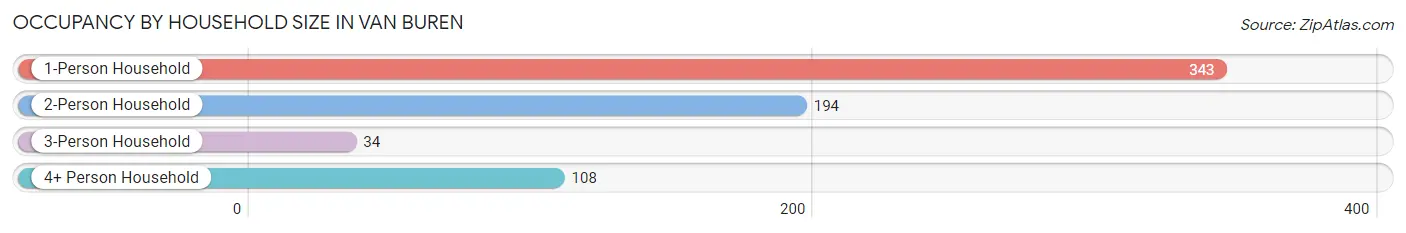
| Household Size | # Housing Units | % Housing Units |
| 1-Person Household | 343 | 50.5% |
| 2-Person Household | 194 | 28.6% |
| 3-Person Household | 34 | 5.0% |
| 4+ Person Household | 108 | 15.9% |
| Total Housing Units | 679 | 100.0% |
Occupancy by Ownership by Household Size in Van Buren
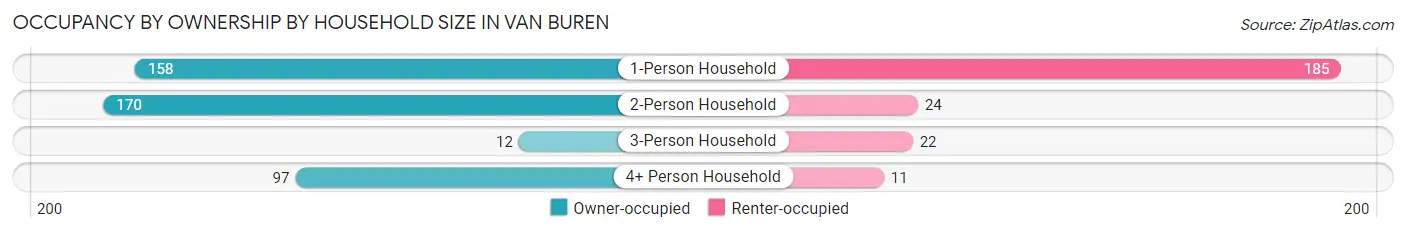
| Household Size | Owner-occupied | Renter-occupied |
| 1-Person Household | 158 (46.1%) | 185 (53.9%) |
| 2-Person Household | 170 (87.6%) | 24 (12.4%) |
| 3-Person Household | 12 (35.3%) | 22 (64.7%) |
| 4+ Person Household | 97 (89.8%) | 11 (10.2%) |
| Total Housing Units | 437 (64.4%) | 242 (35.6%) |
Occupancy by Educational Attainment in Van Buren
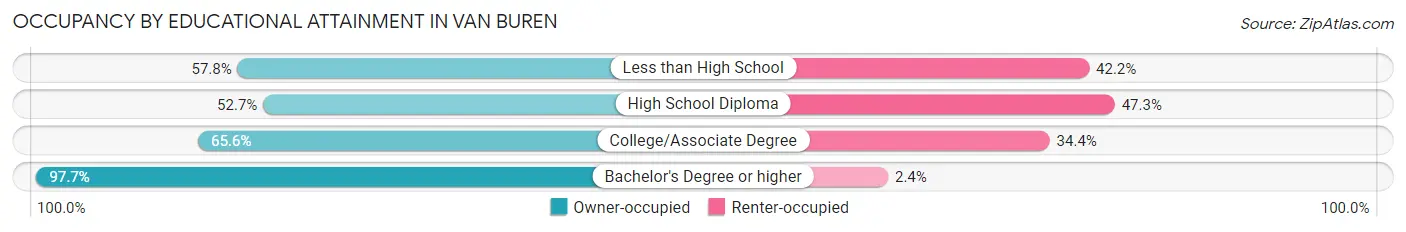
| Household Size | Owner-occupied | Renter-occupied |
| Less than High School | 52 (57.8%) | 38 (42.2%) |
| High School Diploma | 117 (52.7%) | 105 (47.3%) |
| College/Associate Degree | 185 (65.6%) | 97 (34.4%) |
| Bachelor's Degree or higher | 83 (97.7%) | 2 (2.4%) |
Occupancy by Age of Householder in Van Buren
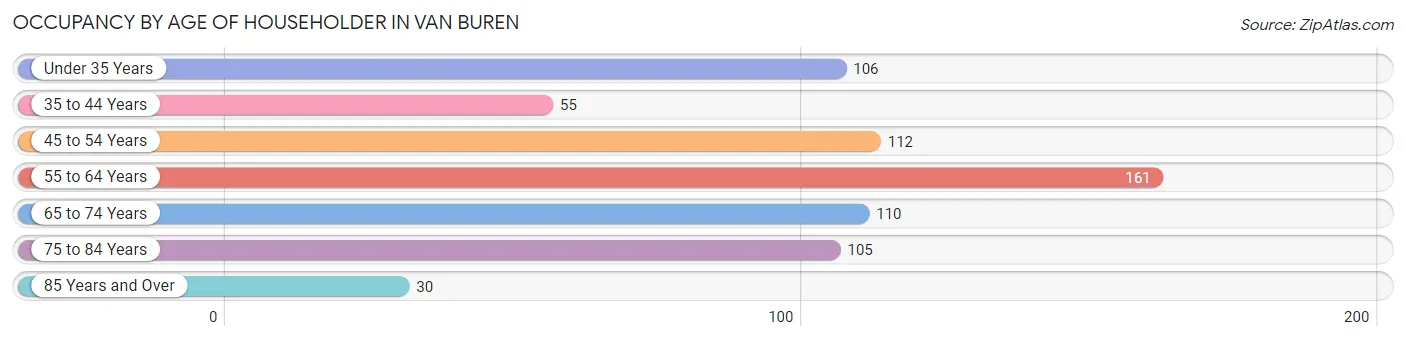
| Age Bracket | # Households | % Households |
| Under 35 Years | 106 | 15.6% |
| 35 to 44 Years | 55 | 8.1% |
| 45 to 54 Years | 112 | 16.5% |
| 55 to 64 Years | 161 | 23.7% |
| 65 to 74 Years | 110 | 16.2% |
| 75 to 84 Years | 105 | 15.5% |
| 85 Years and Over | 30 | 4.4% |
| Total | 679 | 100.0% |
Housing Finances in Van Buren
Median Income by Occupancy in Van Buren
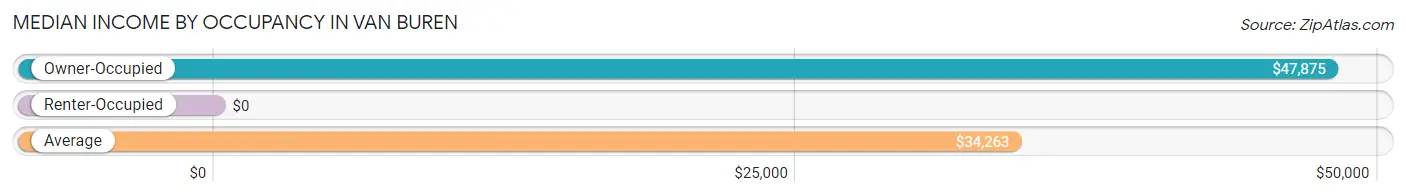
| Occupancy Type | # Households | Median Income |
| Owner-Occupied | 437 (64.4%) | $47,875 |
| Renter-Occupied | 242 (35.6%) | $0 |
| Average | 679 (100.0%) | $34,263 |
Occupancy by Householder Income Bracket in Van Buren
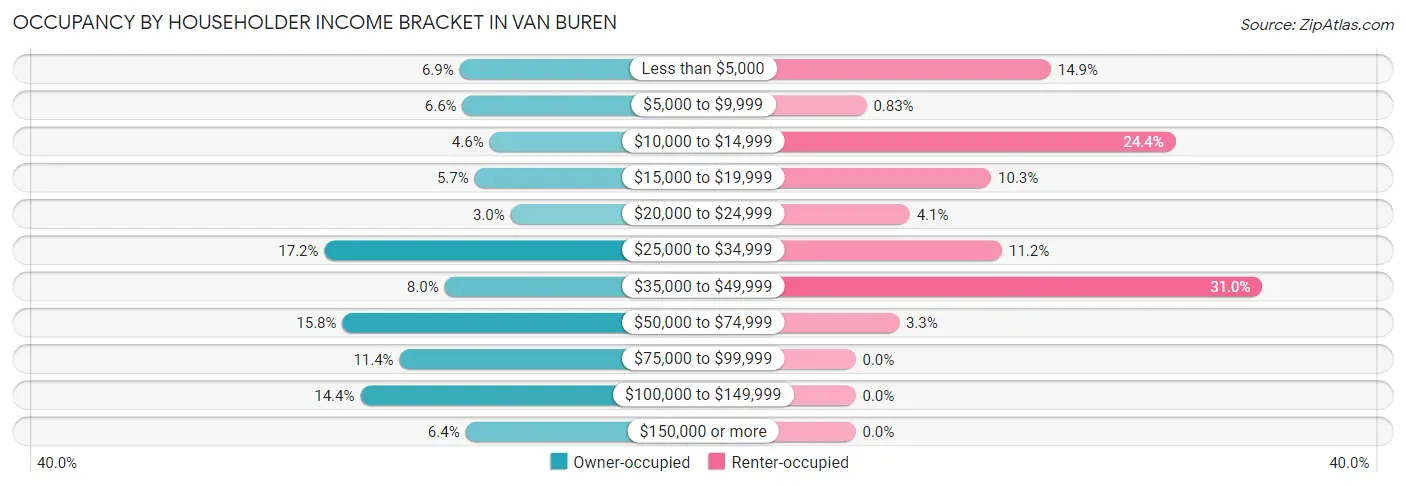
| Income Bracket | Owner-occupied | Renter-occupied |
| Less than $5,000 | 30 (6.9%) | 36 (14.9%) |
| $5,000 to $9,999 | 29 (6.6%) | 2 (0.8%) |
| $10,000 to $14,999 | 20 (4.6%) | 59 (24.4%) |
| $15,000 to $19,999 | 25 (5.7%) | 25 (10.3%) |
| $20,000 to $24,999 | 13 (3.0%) | 10 (4.1%) |
| $25,000 to $34,999 | 75 (17.2%) | 27 (11.2%) |
| $35,000 to $49,999 | 35 (8.0%) | 75 (31.0%) |
| $50,000 to $74,999 | 69 (15.8%) | 8 (3.3%) |
| $75,000 to $99,999 | 50 (11.4%) | 0 (0.0%) |
| $100,000 to $149,999 | 63 (14.4%) | 0 (0.0%) |
| $150,000 or more | 28 (6.4%) | 0 (0.0%) |
| Total | 437 (100.0%) | 242 (100.0%) |
Monthly Housing Cost Tiers in Van Buren
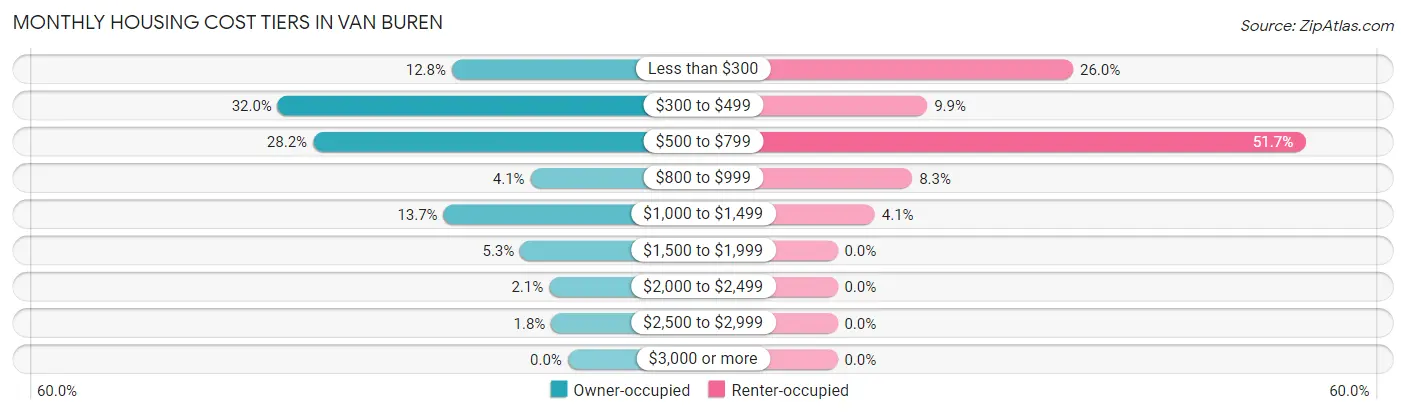
| Monthly Cost | Owner-occupied | Renter-occupied |
| Less than $300 | 56 (12.8%) | 63 (26.0%) |
| $300 to $499 | 140 (32.0%) | 24 (9.9%) |
| $500 to $799 | 123 (28.1%) | 125 (51.6%) |
| $800 to $999 | 18 (4.1%) | 20 (8.3%) |
| $1,000 to $1,499 | 60 (13.7%) | 10 (4.1%) |
| $1,500 to $1,999 | 23 (5.3%) | 0 (0.0%) |
| $2,000 to $2,499 | 9 (2.1%) | 0 (0.0%) |
| $2,500 to $2,999 | 8 (1.8%) | 0 (0.0%) |
| $3,000 or more | 0 (0.0%) | 0 (0.0%) |
| Total | 437 (100.0%) | 242 (100.0%) |
Physical Housing Characteristics in Van Buren
Housing Structures in Van Buren
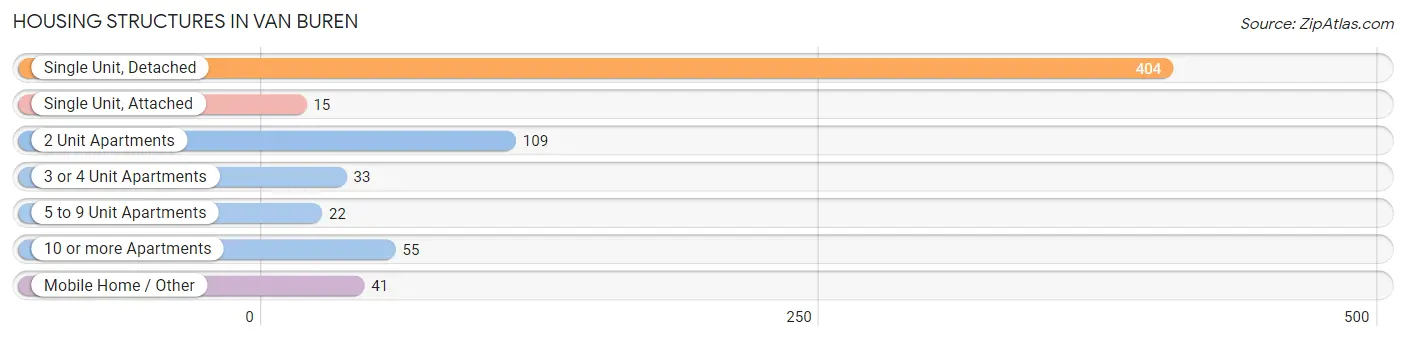
| Structure Type | # Housing Units | % Housing Units |
| Single Unit, Detached | 404 | 59.5% |
| Single Unit, Attached | 15 | 2.2% |
| 2 Unit Apartments | 109 | 16.1% |
| 3 or 4 Unit Apartments | 33 | 4.9% |
| 5 to 9 Unit Apartments | 22 | 3.2% |
| 10 or more Apartments | 55 | 8.1% |
| Mobile Home / Other | 41 | 6.0% |
| Total | 679 | 100.0% |
Housing Structures by Occupancy in Van Buren
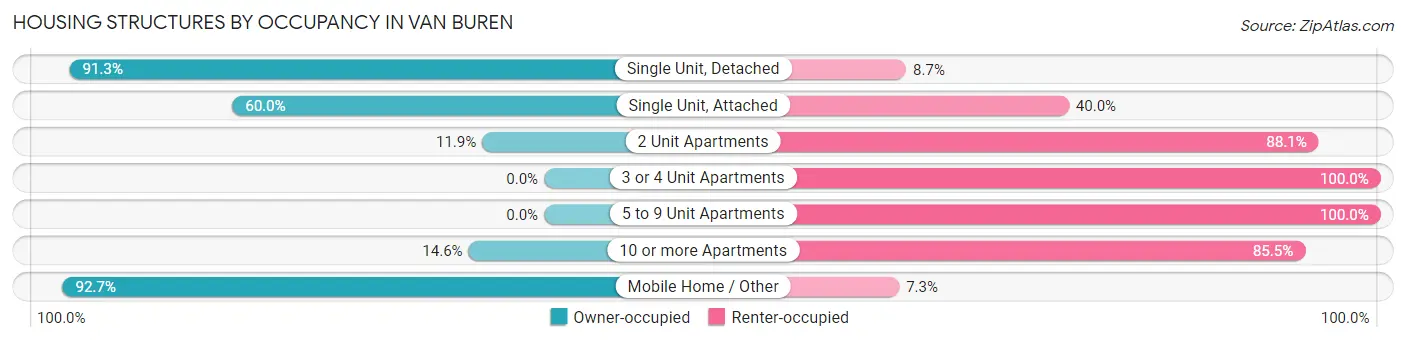
| Structure Type | Owner-occupied | Renter-occupied |
| Single Unit, Detached | 369 (91.3%) | 35 (8.7%) |
| Single Unit, Attached | 9 (60.0%) | 6 (40.0%) |
| 2 Unit Apartments | 13 (11.9%) | 96 (88.1%) |
| 3 or 4 Unit Apartments | 0 (0.0%) | 33 (100.0%) |
| 5 to 9 Unit Apartments | 0 (0.0%) | 22 (100.0%) |
| 10 or more Apartments | 8 (14.5%) | 47 (85.5%) |
| Mobile Home / Other | 38 (92.7%) | 3 (7.3%) |
| Total | 437 (64.4%) | 242 (35.6%) |
Housing Structures by Number of Rooms in Van Buren
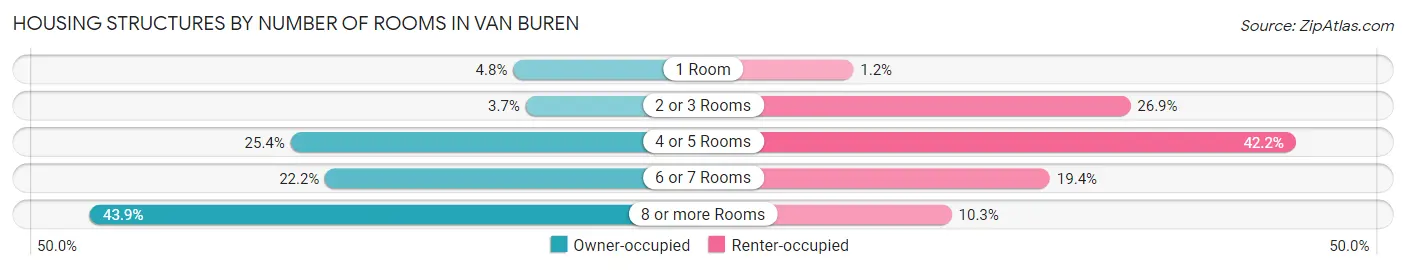
| Number of Rooms | Owner-occupied | Renter-occupied |
| 1 Room | 21 (4.8%) | 3 (1.2%) |
| 2 or 3 Rooms | 16 (3.7%) | 65 (26.9%) |
| 4 or 5 Rooms | 111 (25.4%) | 102 (42.1%) |
| 6 or 7 Rooms | 97 (22.2%) | 47 (19.4%) |
| 8 or more Rooms | 192 (43.9%) | 25 (10.3%) |
| Total | 437 (100.0%) | 242 (100.0%) |
Housing Structure by Heating Type in Van Buren
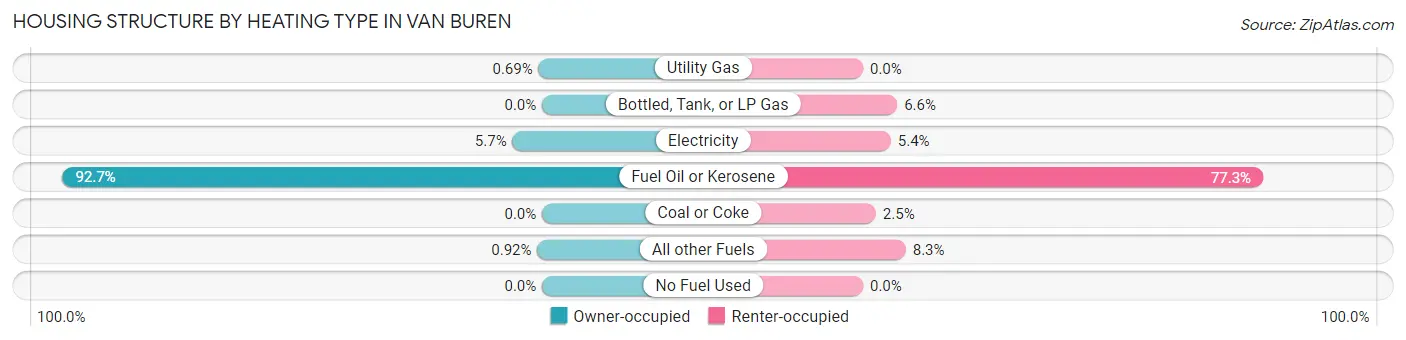
| Heating Type | Owner-occupied | Renter-occupied |
| Utility Gas | 3 (0.7%) | 0 (0.0%) |
| Bottled, Tank, or LP Gas | 0 (0.0%) | 16 (6.6%) |
| Electricity | 25 (5.7%) | 13 (5.4%) |
| Fuel Oil or Kerosene | 405 (92.7%) | 187 (77.3%) |
| Coal or Coke | 0 (0.0%) | 6 (2.5%) |
| All other Fuels | 4 (0.9%) | 20 (8.3%) |
| No Fuel Used | 0 (0.0%) | 0 (0.0%) |
| Total | 437 (100.0%) | 242 (100.0%) |
Household Vehicle Usage in Van Buren
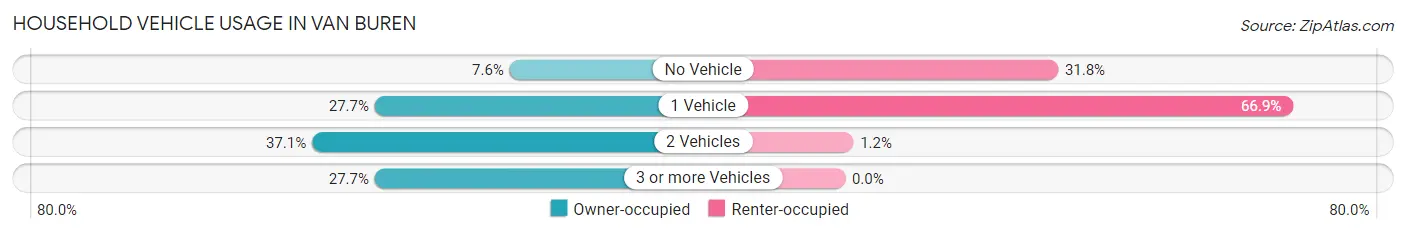
| Vehicles per Household | Owner-occupied | Renter-occupied |
| No Vehicle | 33 (7.5%) | 77 (31.8%) |
| 1 Vehicle | 121 (27.7%) | 162 (66.9%) |
| 2 Vehicles | 162 (37.1%) | 3 (1.2%) |
| 3 or more Vehicles | 121 (27.7%) | 0 (0.0%) |
| Total | 437 (100.0%) | 242 (100.0%) |
Real Estate & Mortgages in Van Buren
Real Estate and Mortgage Overview in Van Buren
| Characteristic | Without Mortgage | With Mortgage |
| Housing Units | 259 | 178 |
| Median Property Value | $84,400 | $118,800 |
| Median Household Income | $34,044 | $9 |
| Monthly Housing Costs | $392 | $0 |
| Real Estate Taxes | $1,096 | $9 |
Property Value by Mortgage Status in Van Buren
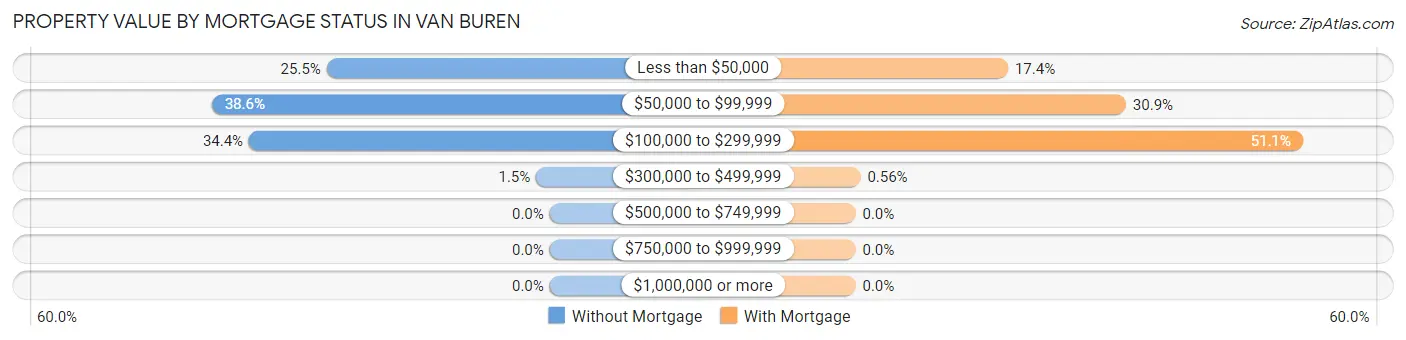
| Property Value | Without Mortgage | With Mortgage |
| Less than $50,000 | 66 (25.5%) | 31 (17.4%) |
| $50,000 to $99,999 | 100 (38.6%) | 55 (30.9%) |
| $100,000 to $299,999 | 89 (34.4%) | 91 (51.1%) |
| $300,000 to $499,999 | 4 (1.5%) | 1 (0.6%) |
| $500,000 to $749,999 | 0 (0.0%) | 0 (0.0%) |
| $750,000 to $999,999 | 0 (0.0%) | 0 (0.0%) |
| $1,000,000 or more | 0 (0.0%) | 0 (0.0%) |
| Total | 259 (100.0%) | 178 (100.0%) |
Household Income by Mortgage Status in Van Buren
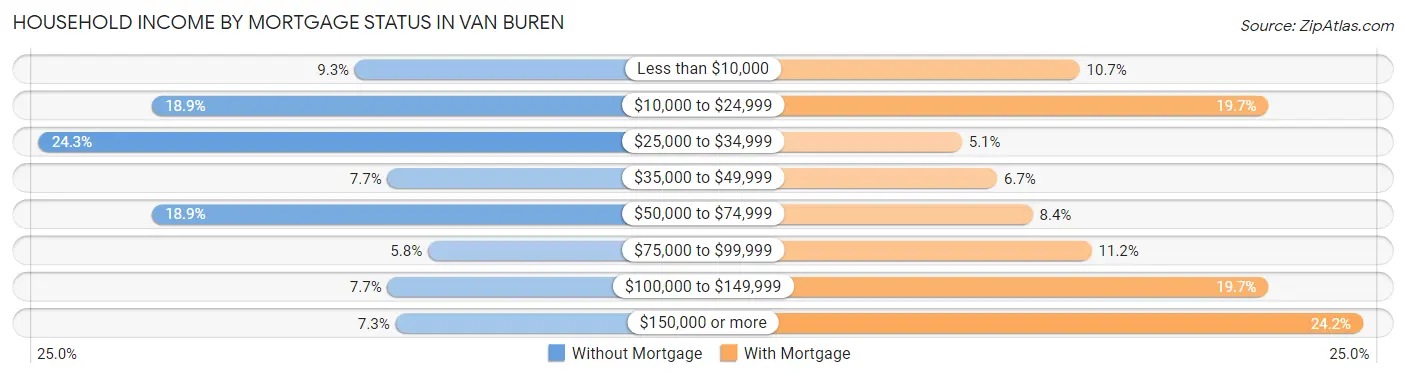
| Household Income | Without Mortgage | With Mortgage |
| Less than $10,000 | 24 (9.3%) | 19 (10.7%) |
| $10,000 to $24,999 | 49 (18.9%) | 35 (19.7%) |
| $25,000 to $34,999 | 63 (24.3%) | 9 (5.1%) |
| $35,000 to $49,999 | 20 (7.7%) | 12 (6.7%) |
| $50,000 to $74,999 | 49 (18.9%) | 15 (8.4%) |
| $75,000 to $99,999 | 15 (5.8%) | 20 (11.2%) |
| $100,000 to $149,999 | 20 (7.7%) | 35 (19.7%) |
| $150,000 or more | 19 (7.3%) | 43 (24.2%) |
| Total | 259 (100.0%) | 178 (100.0%) |
Property Value to Household Income Ratio in Van Buren
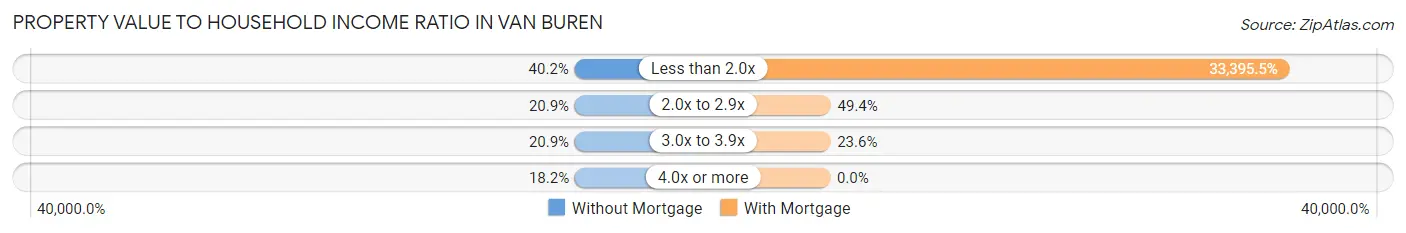
| Value-to-Income Ratio | Without Mortgage | With Mortgage |
| Less than 2.0x | 104 (40.2%) | 59,444 (33,395.5%) |
| 2.0x to 2.9x | 54 (20.8%) | 88 (49.4%) |
| 3.0x to 3.9x | 54 (20.8%) | 42 (23.6%) |
| 4.0x or more | 47 (18.1%) | 0 (0.0%) |
| Total | 259 (100.0%) | 178 (100.0%) |
Real Estate Taxes by Mortgage Status in Van Buren
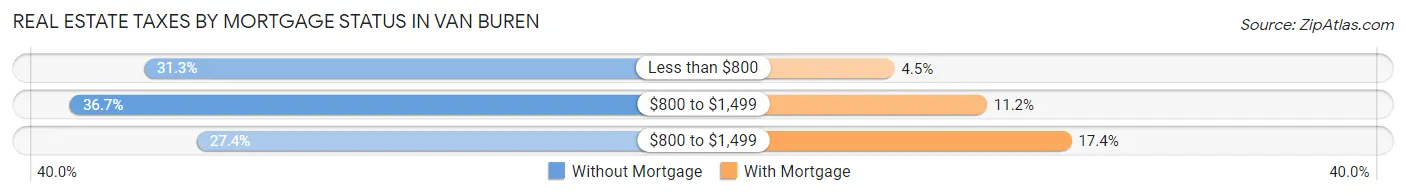
| Property Taxes | Without Mortgage | With Mortgage |
| Less than $800 | 81 (31.3%) | 8 (4.5%) |
| $800 to $1,499 | 95 (36.7%) | 20 (11.2%) |
| $800 to $1,499 | 71 (27.4%) | 31 (17.4%) |
| Total | 259 (100.0%) | 178 (100.0%) |
Health & Disability in Van Buren
Health Insurance Coverage by Age in Van Buren
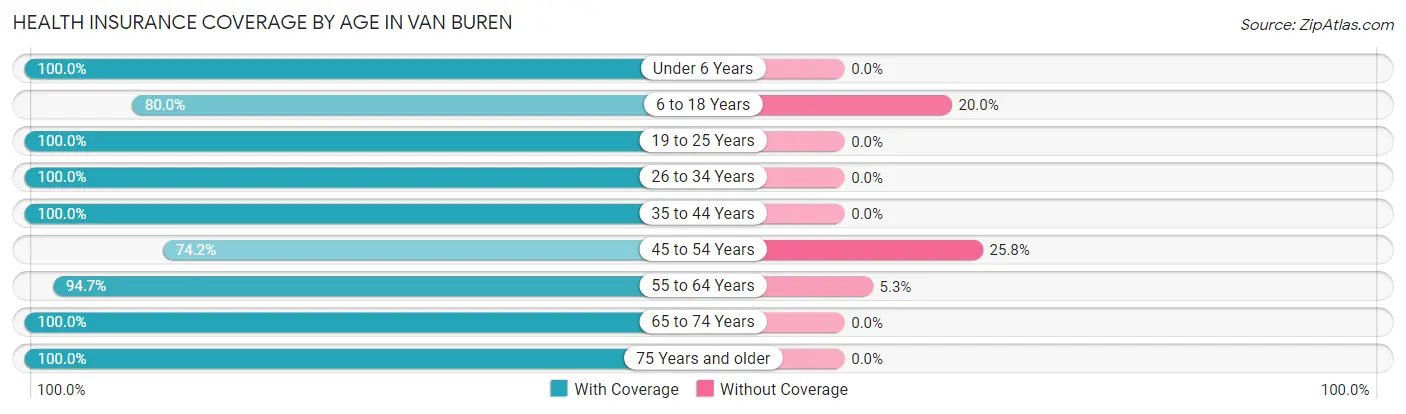
| Age Bracket | With Coverage | Without Coverage |
| Under 6 Years | 78 (100.0%) | 0 (0.0%) |
| 6 to 18 Years | 168 (80.0%) | 42 (20.0%) |
| 19 to 25 Years | 135 (100.0%) | 0 (0.0%) |
| 26 to 34 Years | 84 (100.0%) | 0 (0.0%) |
| 35 to 44 Years | 78 (100.0%) | 0 (0.0%) |
| 45 to 54 Years | 141 (74.2%) | 49 (25.8%) |
| 55 to 64 Years | 287 (94.7%) | 16 (5.3%) |
| 65 to 74 Years | 241 (100.0%) | 0 (0.0%) |
| 75 Years and older | 211 (100.0%) | 0 (0.0%) |
| Total | 1,423 (93.0%) | 107 (7.0%) |
Health Insurance Coverage by Citizenship Status in Van Buren
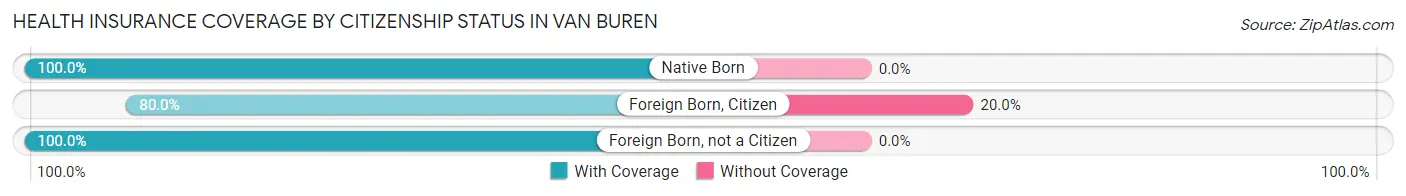
| Citizenship Status | With Coverage | Without Coverage |
| Native Born | 78 (100.0%) | 0 (0.0%) |
| Foreign Born, Citizen | 168 (80.0%) | 42 (20.0%) |
| Foreign Born, not a Citizen | 135 (100.0%) | 0 (0.0%) |
Health Insurance Coverage by Household Income in Van Buren
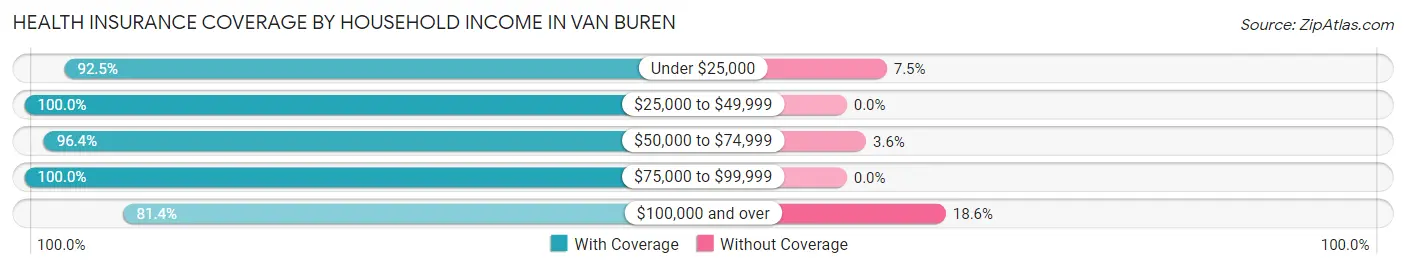
| Household Income | With Coverage | Without Coverage |
| Under $25,000 | 321 (92.5%) | 26 (7.5%) |
| $25,000 to $49,999 | 422 (100.0%) | 0 (0.0%) |
| $50,000 to $74,999 | 160 (96.4%) | 6 (3.6%) |
| $75,000 to $99,999 | 179 (100.0%) | 0 (0.0%) |
| $100,000 and over | 329 (81.4%) | 75 (18.6%) |
Public vs Private Health Insurance Coverage by Age in Van Buren
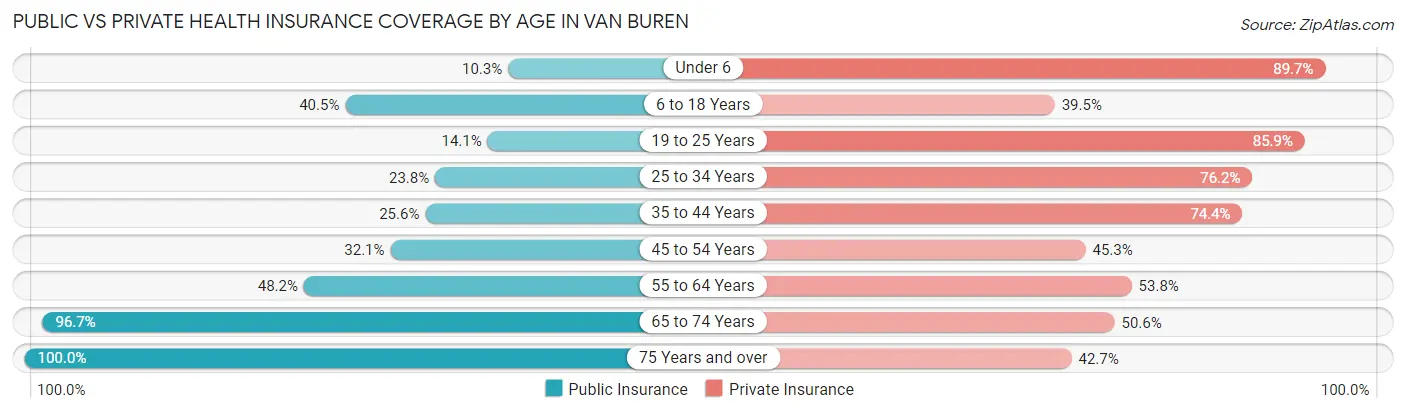
| Age Bracket | Public Insurance | Private Insurance |
| Under 6 | 8 (10.3%) | 70 (89.7%) |
| 6 to 18 Years | 85 (40.5%) | 83 (39.5%) |
| 19 to 25 Years | 19 (14.1%) | 116 (85.9%) |
| 25 to 34 Years | 20 (23.8%) | 64 (76.2%) |
| 35 to 44 Years | 20 (25.6%) | 58 (74.4%) |
| 45 to 54 Years | 61 (32.1%) | 86 (45.3%) |
| 55 to 64 Years | 146 (48.2%) | 163 (53.8%) |
| 65 to 74 Years | 233 (96.7%) | 122 (50.6%) |
| 75 Years and over | 211 (100.0%) | 90 (42.6%) |
| Total | 803 (52.5%) | 852 (55.7%) |
Disability Status by Sex by Age in Van Buren
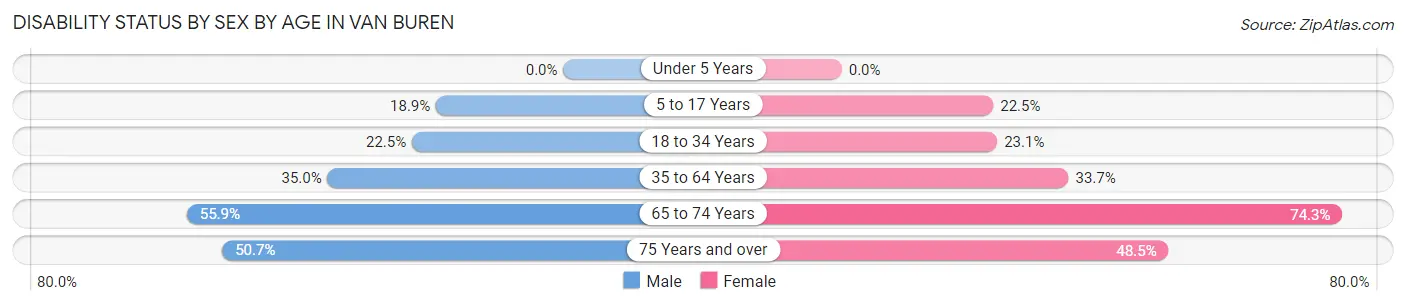
| Age Bracket | Male | Female |
| Under 5 Years | 0 (0.0%) | 0 (0.0%) |
| 5 to 17 Years | 17 (18.9%) | 27 (22.5%) |
| 18 to 34 Years | 20 (22.5%) | 30 (23.1%) |
| 35 to 64 Years | 97 (35.0%) | 99 (33.7%) |
| 65 to 74 Years | 52 (55.9%) | 110 (74.3%) |
| 75 Years and over | 39 (50.6%) | 65 (48.5%) |
Disability Class by Sex by Age in Van Buren
Disability Class: Hearing Difficulty
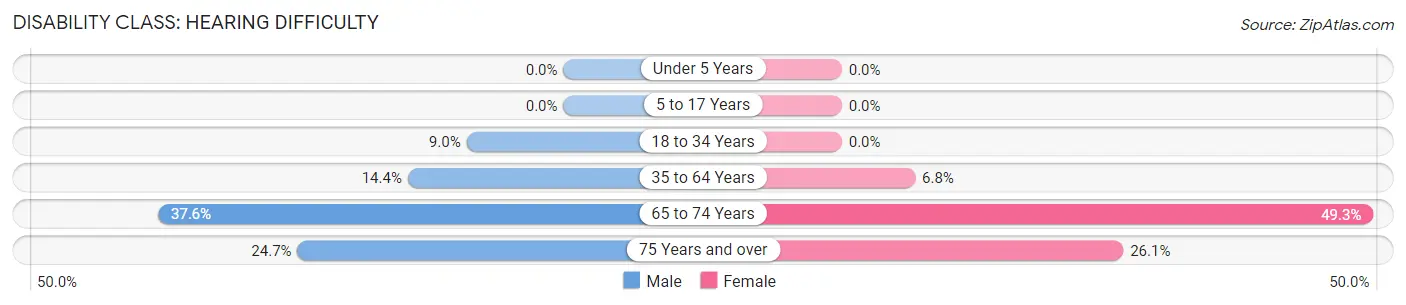
| Age Bracket | Male | Female |
| Under 5 Years | 0 (0.0%) | 0 (0.0%) |
| 5 to 17 Years | 0 (0.0%) | 0 (0.0%) |
| 18 to 34 Years | 8 (9.0%) | 0 (0.0%) |
| 35 to 64 Years | 40 (14.4%) | 20 (6.8%) |
| 65 to 74 Years | 35 (37.6%) | 73 (49.3%) |
| 75 Years and over | 19 (24.7%) | 35 (26.1%) |
Disability Class: Vision Difficulty
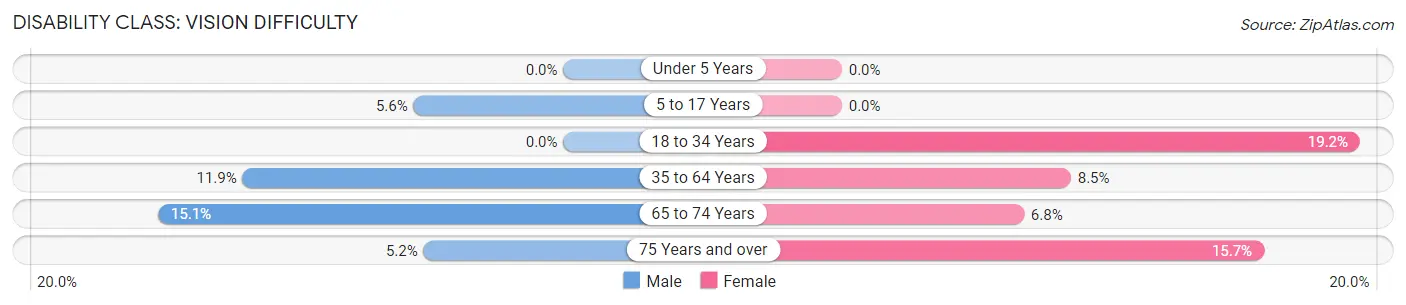
| Age Bracket | Male | Female |
| Under 5 Years | 0 (0.0%) | 0 (0.0%) |
| 5 to 17 Years | 5 (5.6%) | 0 (0.0%) |
| 18 to 34 Years | 0 (0.0%) | 25 (19.2%) |
| 35 to 64 Years | 33 (11.9%) | 25 (8.5%) |
| 65 to 74 Years | 14 (15.0%) | 10 (6.8%) |
| 75 Years and over | 4 (5.2%) | 21 (15.7%) |
Disability Class: Cognitive Difficulty
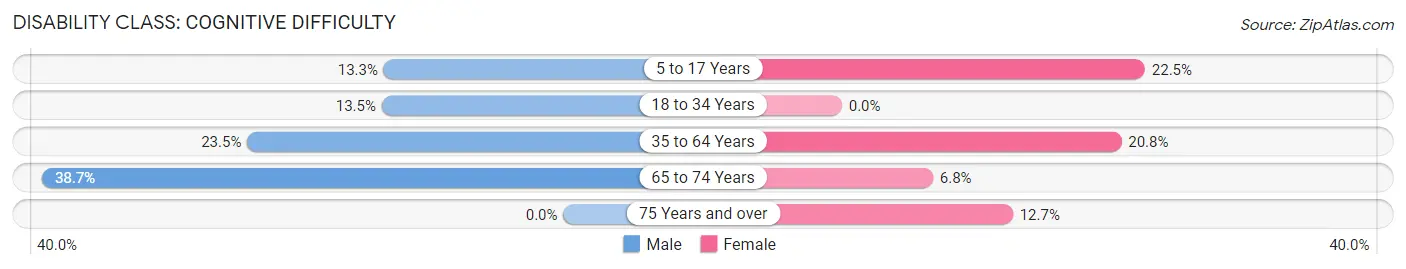
| Age Bracket | Male | Female |
| 5 to 17 Years | 12 (13.3%) | 27 (22.5%) |
| 18 to 34 Years | 12 (13.5%) | 0 (0.0%) |
| 35 to 64 Years | 65 (23.5%) | 61 (20.7%) |
| 65 to 74 Years | 36 (38.7%) | 10 (6.8%) |
| 75 Years and over | 0 (0.0%) | 17 (12.7%) |
Disability Class: Ambulatory Difficulty
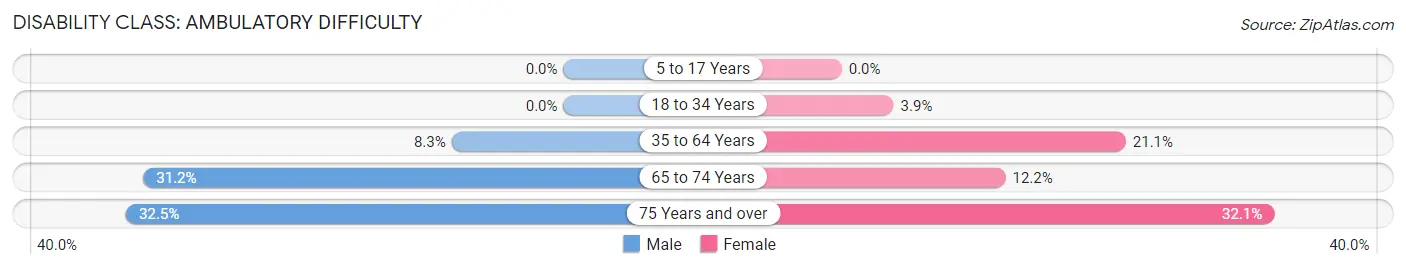
| Age Bracket | Male | Female |
| 5 to 17 Years | 0 (0.0%) | 0 (0.0%) |
| 18 to 34 Years | 0 (0.0%) | 5 (3.8%) |
| 35 to 64 Years | 23 (8.3%) | 62 (21.1%) |
| 65 to 74 Years | 29 (31.2%) | 18 (12.2%) |
| 75 Years and over | 25 (32.5%) | 43 (32.1%) |
Disability Class: Self-Care Difficulty
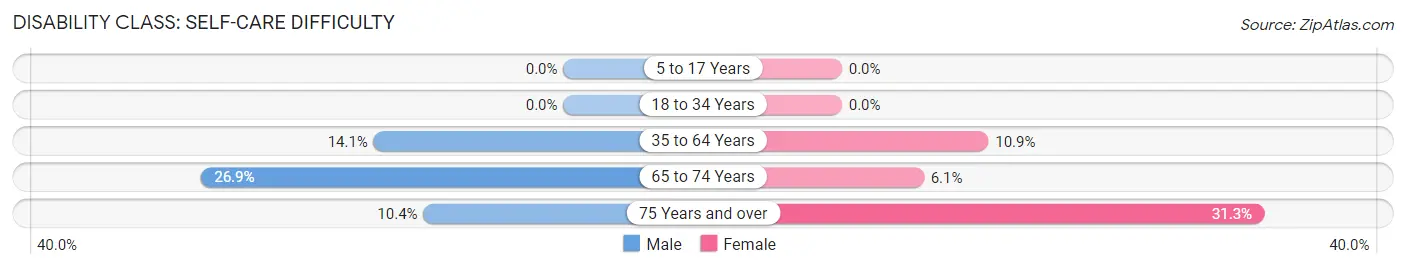
| Age Bracket | Male | Female |
| 5 to 17 Years | 0 (0.0%) | 0 (0.0%) |
| 18 to 34 Years | 0 (0.0%) | 0 (0.0%) |
| 35 to 64 Years | 39 (14.1%) | 32 (10.9%) |
| 65 to 74 Years | 25 (26.9%) | 9 (6.1%) |
| 75 Years and over | 8 (10.4%) | 42 (31.3%) |
Technology Access in Van Buren
Computing Device Access in Van Buren
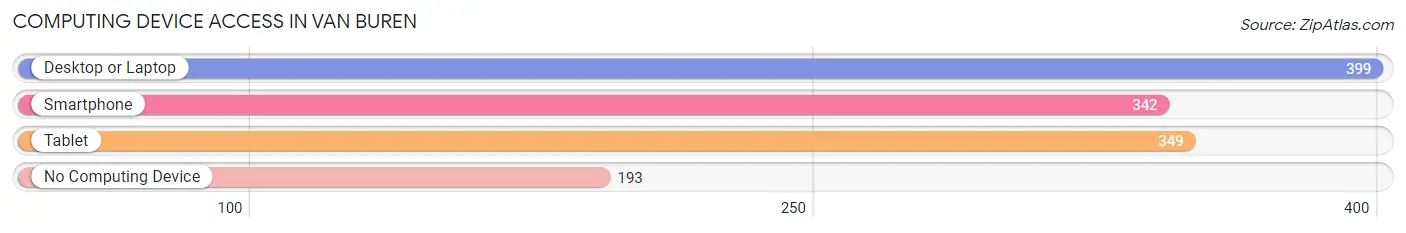
| Device Type | # Households | % Households |
| Desktop or Laptop | 399 | 58.8% |
| Smartphone | 342 | 50.4% |
| Tablet | 349 | 51.4% |
| No Computing Device | 193 | 28.4% |
| Total | 679 | 100.0% |
Internet Access in Van Buren
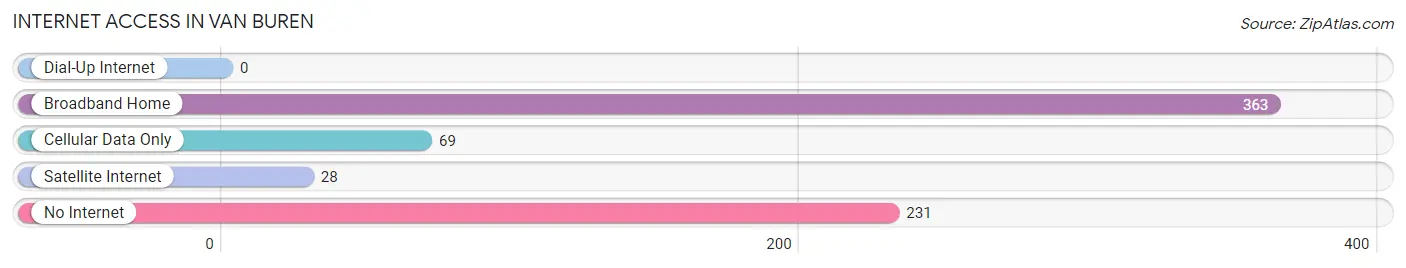
| Internet Type | # Households | % Households |
| Dial-Up Internet | 0 | 0.0% |
| Broadband Home | 363 | 53.5% |
| Cellular Data Only | 69 | 10.2% |
| Satellite Internet | 28 | 4.1% |
| No Internet | 231 | 34.0% |
| Total | 679 | 100.0% |
Van Buren Summary
Van Buren, Maine is a small town located in Aroostook County, in the northernmost part of the state. It is situated on the Saint John River, which forms the border between the United States and Canada. The town was named after Martin Van Buren, the eighth President of the United States.
History
Van Buren was first settled in 1820 by a group of French-Canadian immigrants. The town was incorporated in 1831 and was named after Martin Van Buren, who was the eighth President of the United States. The town was originally a lumbering and farming community, and the first sawmill was built in 1832.
In the late 19th century, Van Buren became a major port for the export of potatoes, which were grown in the area. The town was also a major stop on the Bangor and Aroostook Railroad, which connected the town to the rest of the state.
In the early 20th century, Van Buren was a major center for the production of paper products. The town was also home to a large number of shoe factories, which employed many of the town's residents.
Geography
Van Buren is located in Aroostook County, in the northernmost part of the state. It is situated on the Saint John River, which forms the border between the United States and Canada. The town is located about 25 miles south of the Canadian border.
The town is located in a rural area, and is surrounded by forests and farmland. The town is located in a valley, and is surrounded by hills and mountains. The highest point in the town is Mount Katahdin, which is located about 25 miles to the south.
Economy
Van Buren's economy is largely based on agriculture and forestry. The town is home to several potato farms, and is a major producer of potatoes in the state. The town is also home to several sawmills and paper mills, which employ many of the town's residents.
The town is also home to several small businesses, including restaurants, shops, and other services. The town is also home to a number of tourist attractions, including the Van Buren Historical Society Museum and the Van Buren State Park.
Demographics
As of the 2010 census, the town had a population of 2,171. The racial makeup of the town was 97.2% White, 0.7% African American, 0.3% Native American, 0.2% Asian, 0.1% Pacific Islander, 0.2% from other races, and 1.3% from two or more races. Hispanic or Latino of any race were 0.7% of the population.
The median income for a household in the town was $35,938, and the median income for a family was $41,250. The per capita income for the town was $17,845. About 16.2% of families and 19.2% of the population were below the poverty line, including 28.3% of those under age 18 and 11.2% of those age 65 or over.
Common Questions
What is Per Capita Income in Van Buren?
Per Capita income in Van Buren is $27,685.
What is the Median Family Income in Van Buren?
Median Family Income in Van Buren is $60,833.
What is the Median Household income in Van Buren?
Median Household Income in Van Buren is $34,263.
What is Income or Wage Gap in Van Buren?
Income or Wage Gap in Van Buren is 27.9%.
Women in Van Buren earn 72.1 cents for every dollar earned by a man.
What is Family Income Deficit in Van Buren?
Family Income Deficit in Van Buren is $10,137.
Families that are below poverty line in Van Buren earn $10,137 less on average than the poverty threshold level.
What is Inequality or Gini Index in Van Buren?
Inequality or Gini Index in Van Buren is 0.61.
What is the Total Population of Van Buren?
Total Population of Van Buren is 1,682.
What is the Total Male Population of Van Buren?
Total Male Population of Van Buren is 718.
What is the Total Female Population of Van Buren?
Total Female Population of Van Buren is 964.
What is the Ratio of Males per 100 Females in Van Buren?
There are 74.48 Males per 100 Females in Van Buren.
What is the Ratio of Females per 100 Males in Van Buren?
There are 134.26 Females per 100 Males in Van Buren.
What is the Median Population Age in Van Buren?
Median Population Age in Van Buren is 57.0 Years.
What is the Average Family Size in Van Buren
Average Family Size in Van Buren is 3.3 People.
What is the Average Household Size in Van Buren
Average Household Size in Van Buren is 2.2 People.
How Large is the Labor Force in Van Buren?
There are 560 People in the Labor Forcein in Van Buren.
What is the Percentage of People in the Labor Force in Van Buren?
39.6% of People are in the Labor Force in Van Buren.
What is the Unemployment Rate in Van Buren?
Unemployment Rate in Van Buren is 1.6%.