Dexter, ME Map & Demographics
Dexter Map
Dexter Overview
$33,392
PER CAPITA INCOME
$87,147
AVG FAMILY INCOME
$56,280
AVG HOUSEHOLD INCOME
16.3%
WAGE / INCOME GAP [ % ]
83.7¢/ $1
WAGE / INCOME GAP [ $ ]
$1,936
FAMILY INCOME DEFICIT
0.40
INEQUALITY / GINI INDEX
1,745
TOTAL POPULATION
807
MALE POPULATION
938
FEMALE POPULATION
86.03
MALES / 100 FEMALES
116.23
FEMALES / 100 MALES
55.2
MEDIAN AGE
2.5
AVG FAMILY SIZE
1.9
AVG HOUSEHOLD SIZE
951
LABOR FORCE [ PEOPLE ]
59.8%
PERCENT IN LABOR FORCE
4.7%
UNEMPLOYMENT RATE
Dexter Zip Codes
Dexter Area Codes
Income in Dexter
Income Overview in Dexter
Per Capita Income in Dexter is $33,392, while median incomes of families and households are $87,147 and $56,280 respectively.
| Characteristic | Number | Measure |
| Per Capita Income | 1,745 | $33,392 |
| Median Family Income | 511 | $87,147 |
| Mean Family Income | 511 | $86,588 |
| Median Household Income | 896 | $56,280 |
| Mean Household Income | 896 | $65,555 |
| Income Deficit | 511 | $1,936 |
| Wage / Income Gap (%) | 1,745 | 16.27% |
| Wage / Income Gap ($) | 1,745 | 83.73¢ per $1 |
| Gini / Inequality Index | 1,745 | 0.40 |
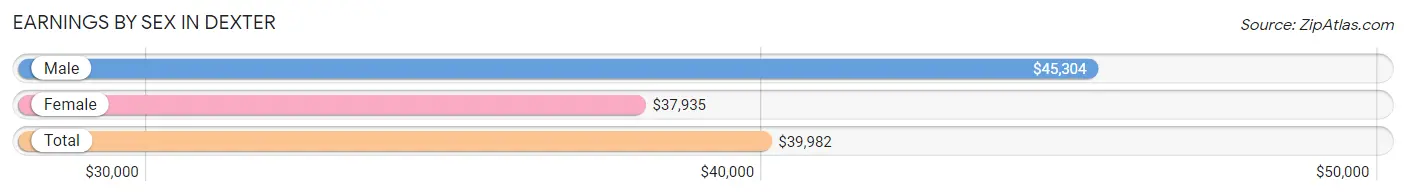
Earnings by Sex in Dexter
Average Earnings in Dexter are $39,982, $45,304 for men and $37,935 for women, a difference of 16.3%.
| Sex | Number | Average Earnings |
| Male | 491 (49.8%) | $45,304 |
| Female | 494 (50.1%) | $37,935 |
| Total | 985 (100.0%) | $39,982 |
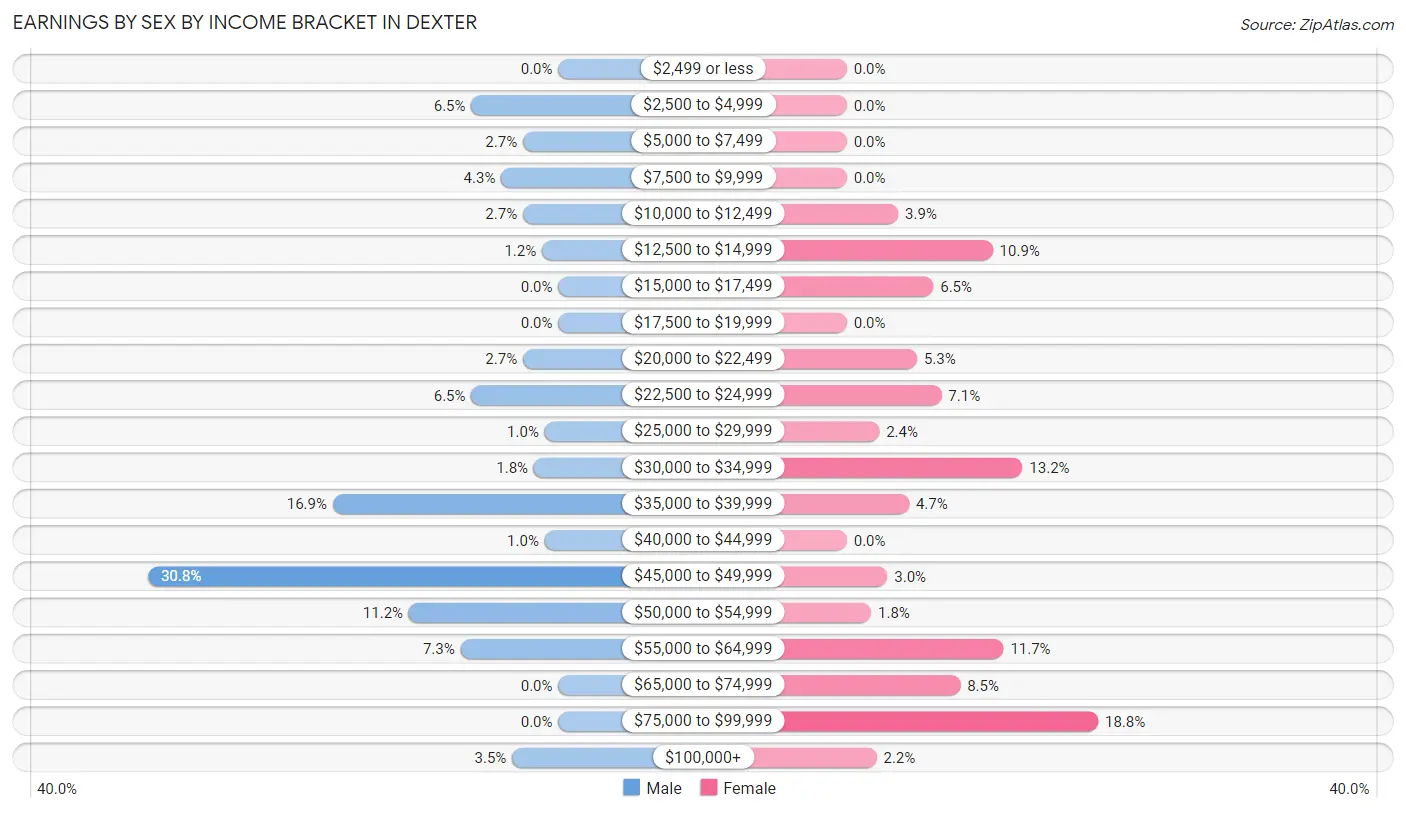
Earnings by Sex by Income Bracket in Dexter
The most common earnings brackets in Dexter are $45,000 to $49,999 for men (151 | 30.7%) and $75,000 to $99,999 for women (93 | 18.8%).
| Income | Male | Female |
| $2,499 or less | 0 (0.0%) | 0 (0.0%) |
| $2,500 to $4,999 | 32 (6.5%) | 0 (0.0%) |
| $5,000 to $7,499 | 13 (2.6%) | 0 (0.0%) |
| $7,500 to $9,999 | 21 (4.3%) | 0 (0.0%) |
| $10,000 to $12,499 | 13 (2.6%) | 19 (3.8%) |
| $12,500 to $14,999 | 6 (1.2%) | 54 (10.9%) |
| $15,000 to $17,499 | 0 (0.0%) | 32 (6.5%) |
| $17,500 to $19,999 | 0 (0.0%) | 0 (0.0%) |
| $20,000 to $22,499 | 13 (2.6%) | 26 (5.3%) |
| $22,500 to $24,999 | 32 (6.5%) | 35 (7.1%) |
| $25,000 to $29,999 | 5 (1.0%) | 12 (2.4%) |
| $30,000 to $34,999 | 9 (1.8%) | 65 (13.2%) |
| $35,000 to $39,999 | 83 (16.9%) | 23 (4.7%) |
| $40,000 to $44,999 | 5 (1.0%) | 0 (0.0%) |
| $45,000 to $49,999 | 151 (30.7%) | 15 (3.0%) |
| $50,000 to $54,999 | 55 (11.2%) | 9 (1.8%) |
| $55,000 to $64,999 | 36 (7.3%) | 58 (11.7%) |
| $65,000 to $74,999 | 0 (0.0%) | 42 (8.5%) |
| $75,000 to $99,999 | 0 (0.0%) | 93 (18.8%) |
| $100,000+ | 17 (3.5%) | 11 (2.2%) |
| Total | 491 (100.0%) | 494 (100.0%) |
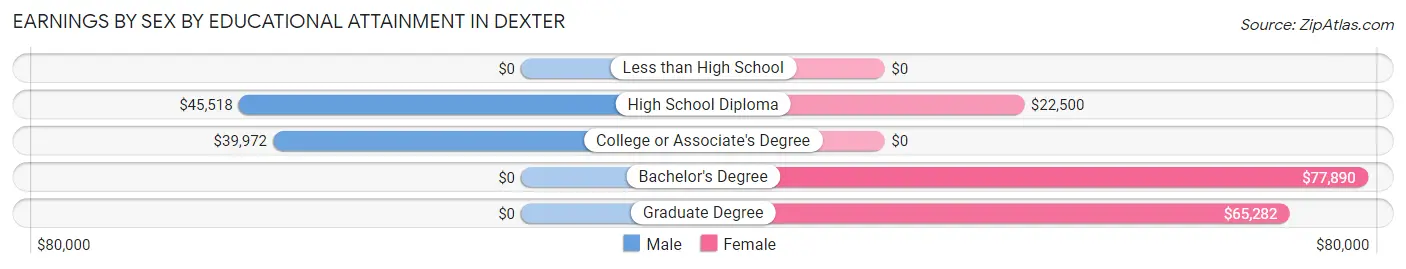
Earnings by Sex by Educational Attainment in Dexter
Average earnings in Dexter are $45,732 for men and $60,409 for women, a difference of 24.3%. Men with an educational attainment of high school diploma enjoy the highest average annual earnings of $45,518, while those with college or associate's degree education earn the least with $39,972. Women with an educational attainment of bachelor's degree earn the most with the average annual earnings of $77,890, while those with high school diploma education have the smallest earnings of $22,500.
| Educational Attainment | Male Income | Female Income |
| Less than High School | - | - |
| High School Diploma | $45,518 | $22,500 |
| College or Associate's Degree | $39,972 | $0 |
| Bachelor's Degree | - | - |
| Graduate Degree | - | - |
| Total | $45,732 | $60,409 |
Family Income in Dexter
Family Income Brackets in Dexter
According to the Dexter family income data, there are 192 families falling into the $100,000 to $149,999 income range, which is the most common income bracket and makes up 37.6% of all families.
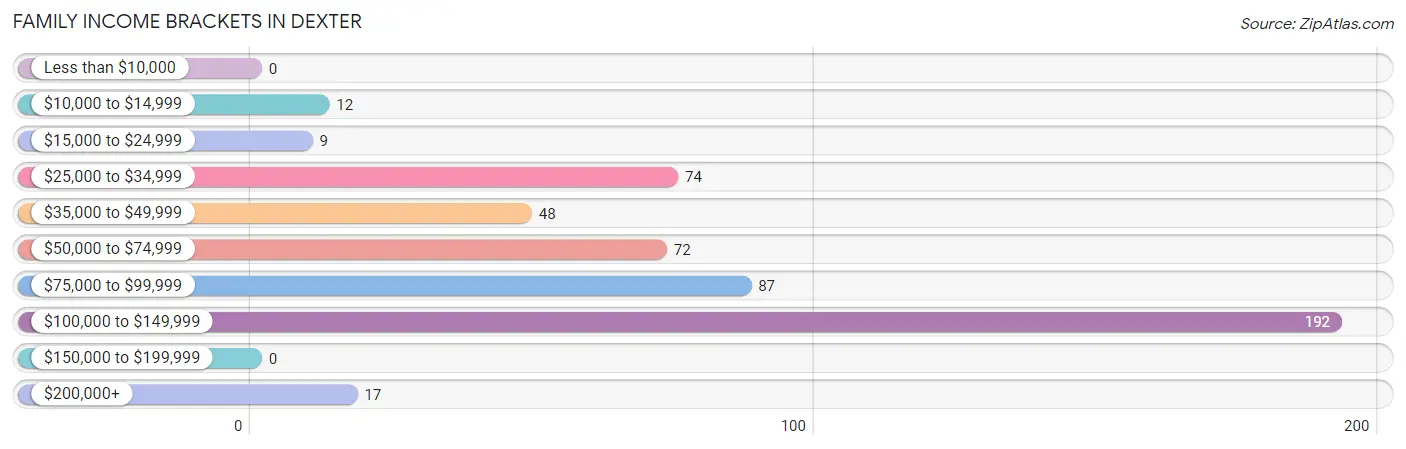
| Income Bracket | # Families | % Families |
| Less than $10,000 | 0 | 0.0% |
| $10,000 to $14,999 | 12 | 2.3% |
| $15,000 to $24,999 | 9 | 1.8% |
| $25,000 to $34,999 | 74 | 14.5% |
| $35,000 to $49,999 | 48 | 9.4% |
| $50,000 to $74,999 | 72 | 14.1% |
| $75,000 to $99,999 | 87 | 17.0% |
| $100,000 to $149,999 | 192 | 37.6% |
| $150,000 to $199,999 | 0 | 0.0% |
| $200,000+ | 17 | 3.3% |
Family Income by Famaliy Size in Dexter
3-person families (81 | 15.9%) account for the highest median family income in Dexter with $100,673 per family, while 2-person families (368 | 72.0%) have the highest median income of $42,981 per family member.
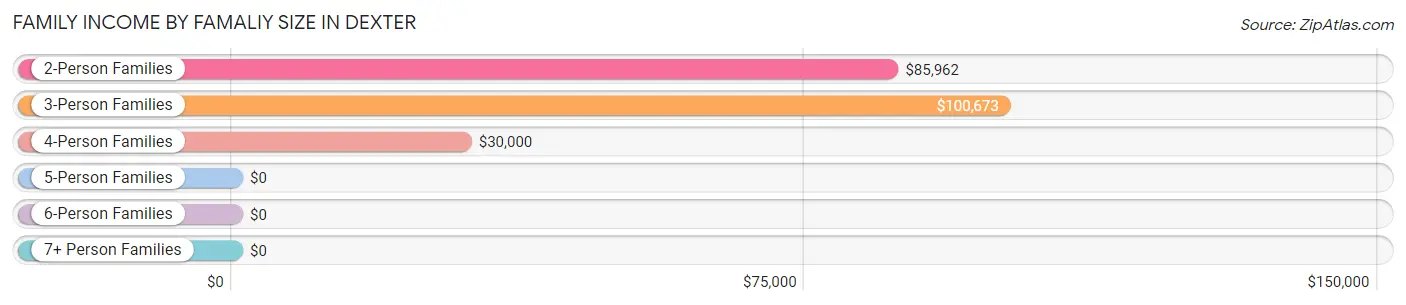
| Income Bracket | # Families | Median Income |
| 2-Person Families | 368 (72.0%) | $85,962 |
| 3-Person Families | 81 (15.9%) | $100,673 |
| 4-Person Families | 26 (5.1%) | $30,000 |
| 5-Person Families | 36 (7.0%) | $0 |
| 6-Person Families | 0 (0.0%) | $0 |
| 7+ Person Families | 0 (0.0%) | $0 |
| Total | 511 (100.0%) | $87,147 |
Family Income by Number of Earners in Dexter
The median family income in Dexter is $87,147, with families comprising 2 earners (257) having the highest median family income of $125,191, while families with no earners (133) have the lowest median family income of $42,893, accounting for 50.3% and 26.0% of families, respectively.
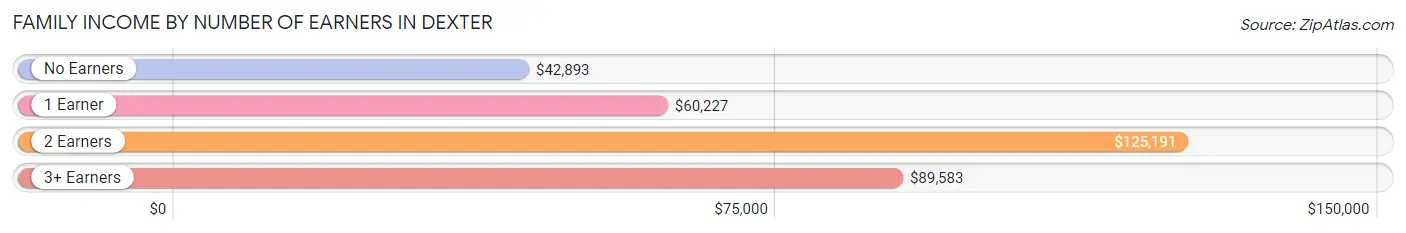
| Number of Earners | # Families | Median Income |
| No Earners | 133 (26.0%) | $42,893 |
| 1 Earner | 76 (14.9%) | $60,227 |
| 2 Earners | 257 (50.3%) | $125,191 |
| 3+ Earners | 45 (8.8%) | $89,583 |
| Total | 511 (100.0%) | $87,147 |
Household Income in Dexter
Household Income Brackets in Dexter
With 192 households falling in the category, the $100,000 to $149,999 income range is the most frequent in Dexter, accounting for 21.4% of all households.
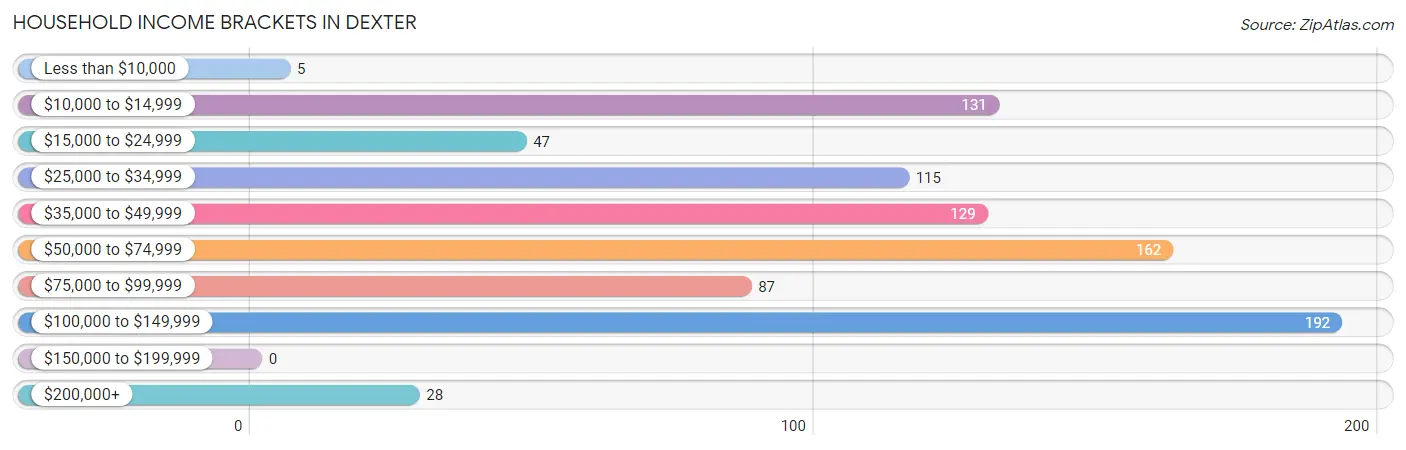
| Income Bracket | # Households | % Households |
| Less than $10,000 | 5 | 0.6% |
| $10,000 to $14,999 | 131 | 14.6% |
| $15,000 to $24,999 | 47 | 5.2% |
| $25,000 to $34,999 | 115 | 12.8% |
| $35,000 to $49,999 | 129 | 14.4% |
| $50,000 to $74,999 | 162 | 18.1% |
| $75,000 to $99,999 | 87 | 9.7% |
| $100,000 to $149,999 | 192 | 21.4% |
| $150,000 to $199,999 | 0 | 0.0% |
| $200,000+ | 28 | 3.1% |
Household Income by Householder Age in Dexter
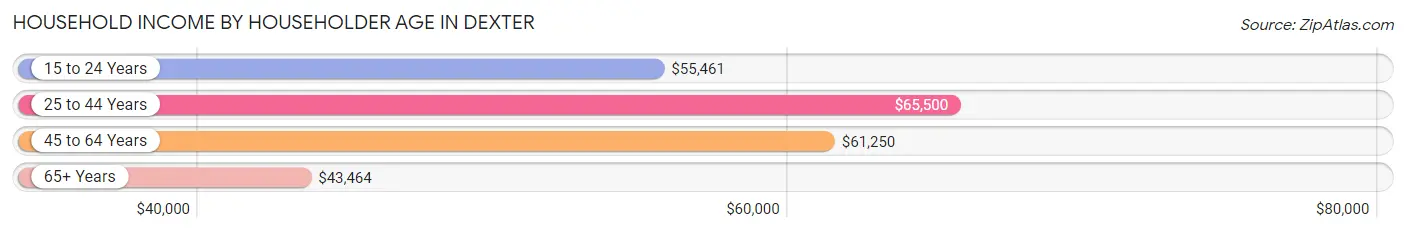
The median household income in Dexter is $56,280, with the highest median household income of $65,500 found in the 25 to 44 years age bracket for the primary householder. A total of 172 households (19.2%) fall into this category. Meanwhile, the 65+ years age bracket for the primary householder has the lowest median household income of $43,464, with 293 households (32.7%) in this group.
| Income Bracket | # Households | Median Income |
| 15 to 24 Years | 31 (3.5%) | $55,461 |
| 25 to 44 Years | 172 (19.2%) | $65,500 |
| 45 to 64 Years | 400 (44.6%) | $61,250 |
| 65+ Years | 293 (32.7%) | $43,464 |
| Total | 896 (100.0%) | $56,280 |
Poverty in Dexter
Income Below Poverty by Sex and Age in Dexter
With 16.5% poverty level for males and 13.3% for females among the residents of Dexter, 15 year old males and 6 to 11 year old females are the most vulnerable to poverty, with 9 males (100.0%) and 13 females (54.2%) in their respective age groups living below the poverty level.
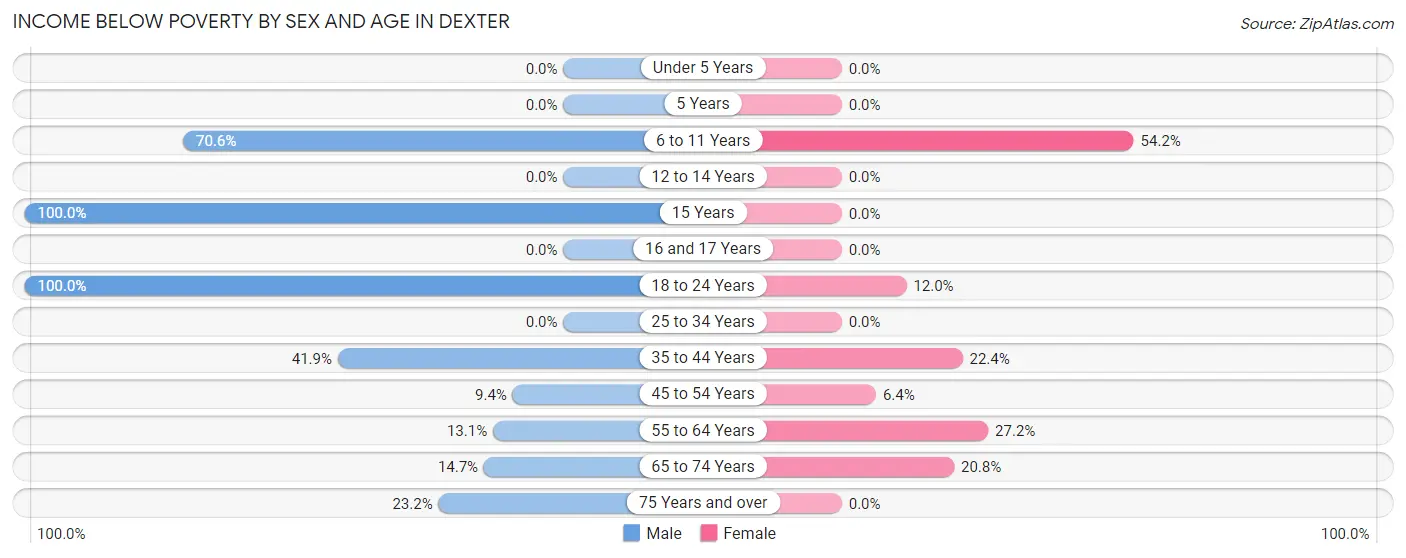
| Age Bracket | Male | Female |
| Under 5 Years | 0 (0.0%) | 0 (0.0%) |
| 5 Years | 0 (0.0%) | 0 (0.0%) |
| 6 to 11 Years | 12 (70.6%) | 13 (54.2%) |
| 12 to 14 Years | 0 (0.0%) | 0 (0.0%) |
| 15 Years | 9 (100.0%) | 0 (0.0%) |
| 16 and 17 Years | 0 (0.0%) | 0 (0.0%) |
| 18 to 24 Years | 8 (100.0%) | 9 (12.0%) |
| 25 to 34 Years | 0 (0.0%) | 0 (0.0%) |
| 35 to 44 Years | 18 (41.9%) | 13 (22.4%) |
| 45 to 54 Years | 8 (9.4%) | 8 (6.4%) |
| 55 to 64 Years | 29 (13.1%) | 47 (27.2%) |
| 65 to 74 Years | 14 (14.7%) | 35 (20.8%) |
| 75 Years and over | 35 (23.2%) | 0 (0.0%) |
| Total | 133 (16.5%) | 125 (13.3%) |
Income Above Poverty by Sex and Age in Dexter
According to the poverty statistics in Dexter, males aged 16 and 17 years and females aged under 5 years are the age groups that are most secure financially, with 100.0% of males and 100.0% of females in these age groups living above the poverty line.
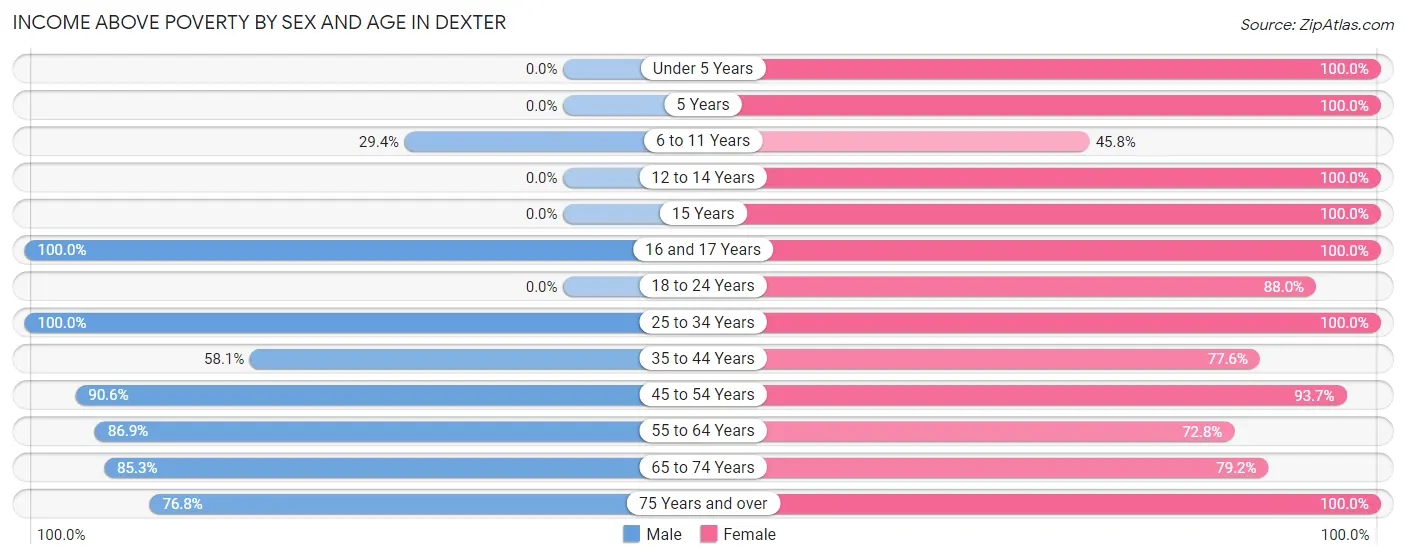
| Age Bracket | Male | Female |
| Under 5 Years | 0 (0.0%) | 47 (100.0%) |
| 5 Years | 0 (0.0%) | 8 (100.0%) |
| 6 to 11 Years | 5 (29.4%) | 11 (45.8%) |
| 12 to 14 Years | 0 (0.0%) | 26 (100.0%) |
| 15 Years | 0 (0.0%) | 23 (100.0%) |
| 16 and 17 Years | 38 (100.0%) | 30 (100.0%) |
| 18 to 24 Years | 0 (0.0%) | 66 (88.0%) |
| 25 to 34 Years | 139 (100.0%) | 84 (100.0%) |
| 35 to 44 Years | 25 (58.1%) | 45 (77.6%) |
| 45 to 54 Years | 77 (90.6%) | 118 (93.6%) |
| 55 to 64 Years | 193 (86.9%) | 126 (72.8%) |
| 65 to 74 Years | 81 (85.3%) | 133 (79.2%) |
| 75 Years and over | 116 (76.8%) | 96 (100.0%) |
| Total | 674 (83.5%) | 813 (86.7%) |
Income Below Poverty Among Married-Couple Families in Dexter
The poverty statistics for married-couple families in Dexter show that 8.3% or 42 of the total 504 families live below the poverty line. Families with 1 or 2 children have the highest poverty rate of 28.8%, comprising of 21 families. On the other hand, families with 3 or 4 children have the lowest poverty rate of 0.0%, which includes 0 families.
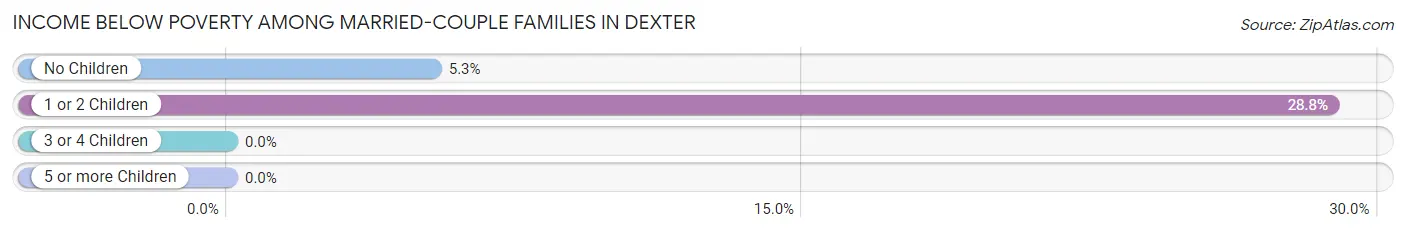
| Children | Above Poverty | Below Poverty |
| No Children | 374 (94.7%) | 21 (5.3%) |
| 1 or 2 Children | 52 (71.2%) | 21 (28.8%) |
| 3 or 4 Children | 36 (100.0%) | 0 (0.0%) |
| 5 or more Children | 0 (0.0%) | 0 (0.0%) |
| Total | 462 (91.7%) | 42 (8.3%) |
Income Below Poverty Among Single-Parent Households in Dexter
| Children | Single Father | Single Mother |
| No Children | 0 (0.0%) | 0 (0.0%) |
| 1 or 2 Children | 0 (0.0%) | 0 (0.0%) |
| 3 or 4 Children | 0 (0.0%) | 0 (0.0%) |
| 5 or more Children | 0 (0.0%) | 0 (0.0%) |
| Total | 0 (0.0%) | 0 (0.0%) |
Income Below Poverty Among Married-Couple vs Single-Parent Households in Dexter
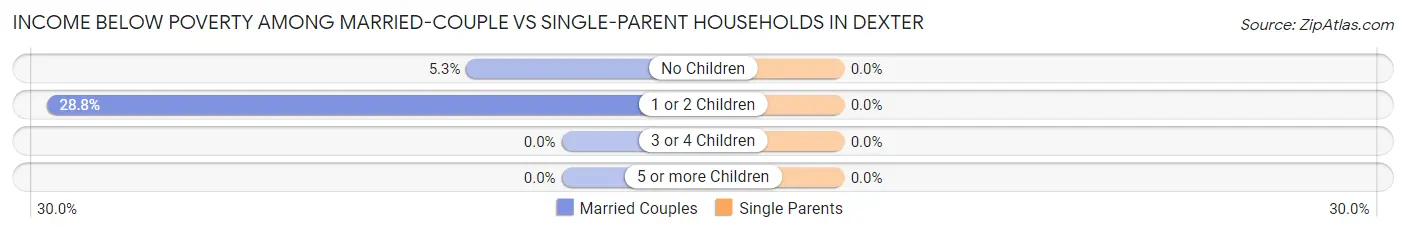
| Children | Married-Couple Families | Single-Parent Households |
| No Children | 21 (5.3%) | 0 (0.0%) |
| 1 or 2 Children | 21 (28.8%) | 0 (0.0%) |
| 3 or 4 Children | 0 (0.0%) | 0 (0.0%) |
| 5 or more Children | 0 (0.0%) | 0 (0.0%) |
| Total | 42 (8.3%) | 0 (0.0%) |
Race in Dexter
The most populous races in Dexter are White / Caucasian (1,647 | 94.4%), Two or more Races (98 | 5.6%), and Hispanic or Latino (9 | 0.5%).
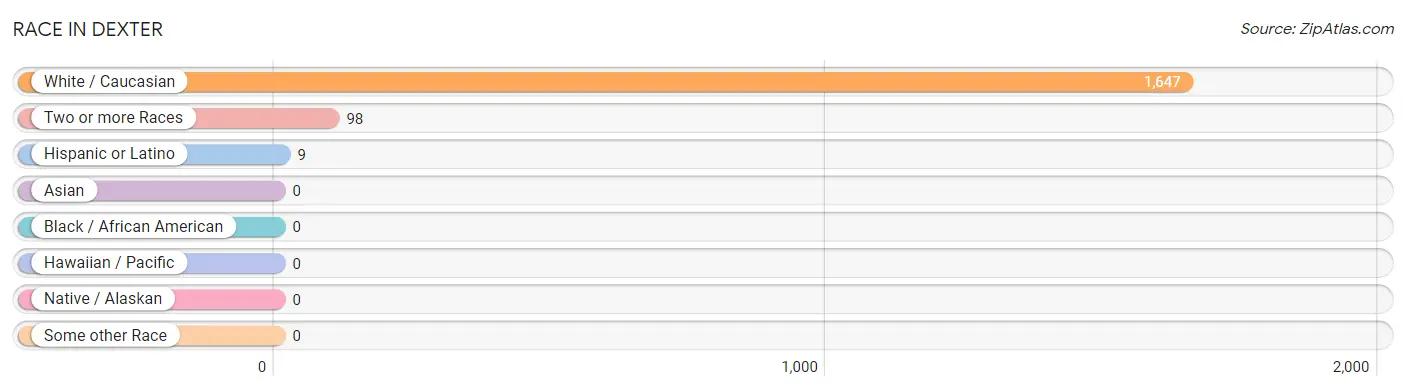
| Race | # Population | % Population |
| Asian | 0 | 0.0% |
| Black / African American | 0 | 0.0% |
| Hawaiian / Pacific | 0 | 0.0% |
| Hispanic or Latino | 9 | 0.5% |
| Native / Alaskan | 0 | 0.0% |
| White / Caucasian | 1,647 | 94.4% |
| Two or more Races | 98 | 5.6% |
| Some other Race | 0 | 0.0% |
| Total | 1,745 | 100.0% |
Ancestry in Dexter
The most populous ancestries reported in Dexter are English (418 | 23.9%), Irish (350 | 20.1%), French (321 | 18.4%), German (220 | 12.6%), and French Canadian (88 | 5.0%), together accounting for 80.1% of all Dexter residents.
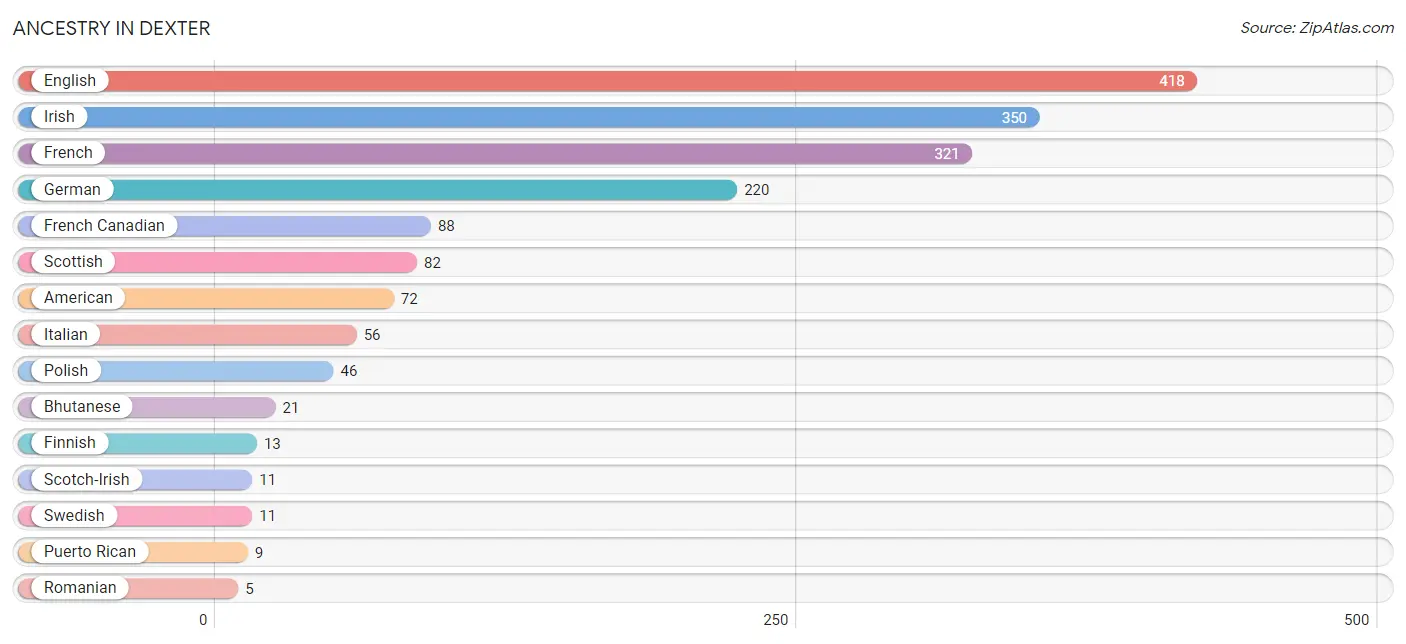
| Ancestry | # Population | % Population |
| American | 72 | 4.1% |
| Bhutanese | 21 | 1.2% |
| English | 418 | 23.9% |
| Finnish | 13 | 0.7% |
| French | 321 | 18.4% |
| French Canadian | 88 | 5.0% |
| German | 220 | 12.6% |
| Irish | 350 | 20.1% |
| Italian | 56 | 3.2% |
| Polish | 46 | 2.6% |
| Puerto Rican | 9 | 0.5% |
| Romanian | 5 | 0.3% |
| Scotch-Irish | 11 | 0.6% |
| Scottish | 82 | 4.7% |
| Swedish | 11 | 0.6% | View All 15 Rows |
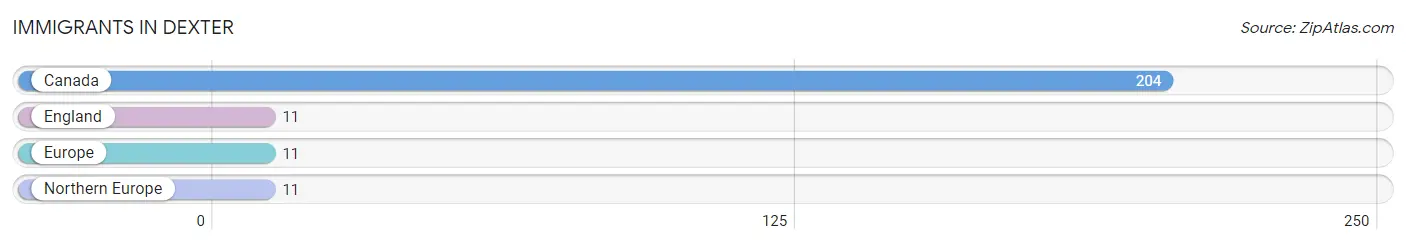
Immigrants in Dexter
The most numerous immigrant groups reported in Dexter came from Canada (204 | 11.7%), England (11 | 0.6%), Europe (11 | 0.6%), and Northern Europe (11 | 0.6%), together accounting for 13.6% of all Dexter residents.
| Immigration Origin | # Population | % Population |
| Canada | 204 | 11.7% |
| England | 11 | 0.6% |
| Europe | 11 | 0.6% |
| Northern Europe | 11 | 0.6% | View All 4 Rows |
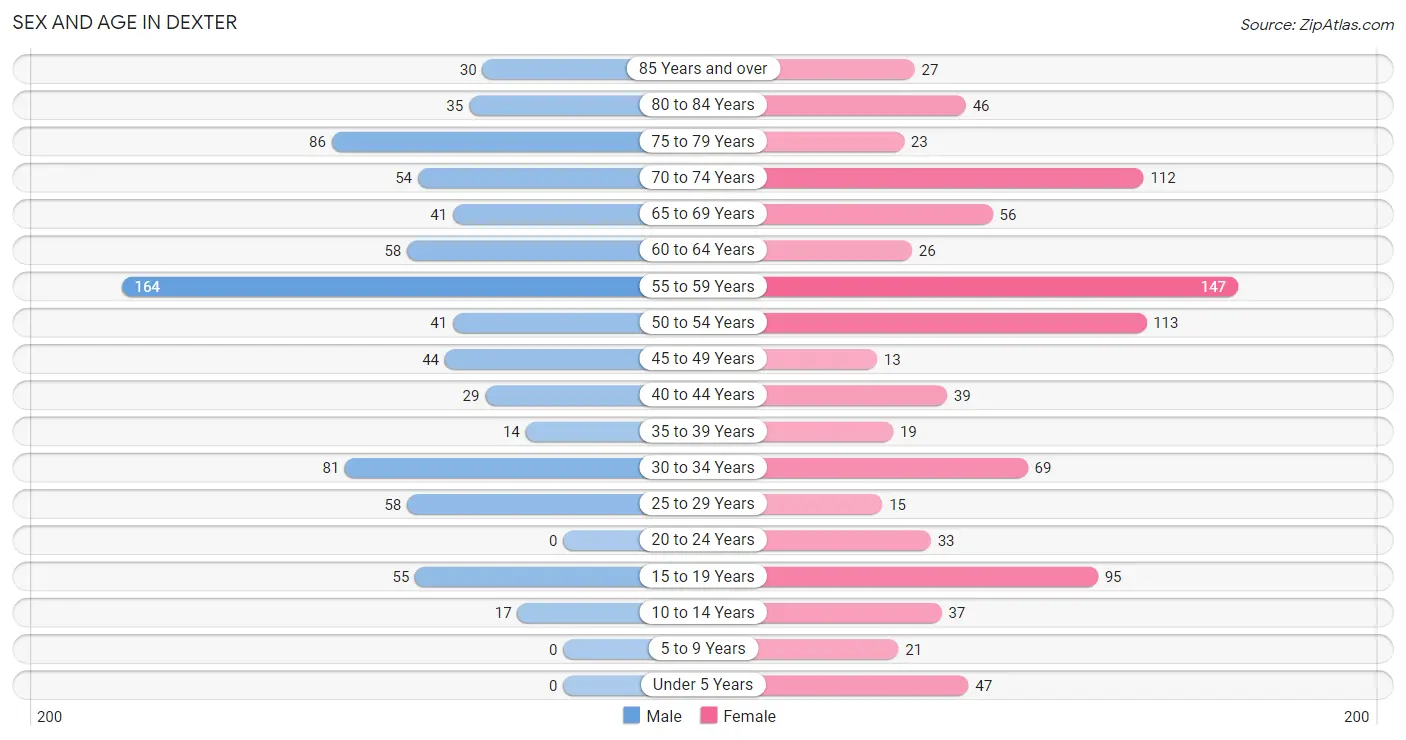
Sex and Age in Dexter
Sex and Age in Dexter
The most populous age groups in Dexter are 55 to 59 Years (164 | 20.3%) for men and 55 to 59 Years (147 | 15.7%) for women.
| Age Bracket | Male | Female |
| Under 5 Years | 0 (0.0%) | 47 (5.0%) |
| 5 to 9 Years | 0 (0.0%) | 21 (2.2%) |
| 10 to 14 Years | 17 (2.1%) | 37 (3.9%) |
| 15 to 19 Years | 55 (6.8%) | 95 (10.1%) |
| 20 to 24 Years | 0 (0.0%) | 33 (3.5%) |
| 25 to 29 Years | 58 (7.2%) | 15 (1.6%) |
| 30 to 34 Years | 81 (10.0%) | 69 (7.4%) |
| 35 to 39 Years | 14 (1.7%) | 19 (2.0%) |
| 40 to 44 Years | 29 (3.6%) | 39 (4.2%) |
| 45 to 49 Years | 44 (5.4%) | 13 (1.4%) |
| 50 to 54 Years | 41 (5.1%) | 113 (12.0%) |
| 55 to 59 Years | 164 (20.3%) | 147 (15.7%) |
| 60 to 64 Years | 58 (7.2%) | 26 (2.8%) |
| 65 to 69 Years | 41 (5.1%) | 56 (6.0%) |
| 70 to 74 Years | 54 (6.7%) | 112 (11.9%) |
| 75 to 79 Years | 86 (10.7%) | 23 (2.5%) |
| 80 to 84 Years | 35 (4.3%) | 46 (4.9%) |
| 85 Years and over | 30 (3.7%) | 27 (2.9%) |
| Total | 807 (100.0%) | 938 (100.0%) |
Families and Households in Dexter
Median Family Size in Dexter
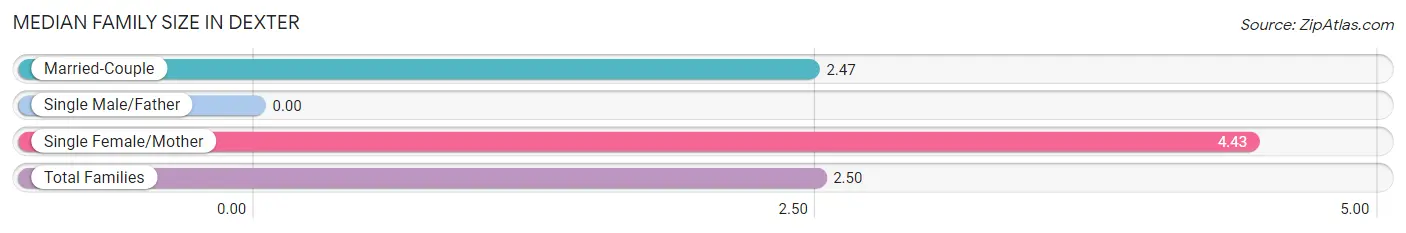
| Family Type | # Families | Family Size |
| Married-Couple | 504 (98.6%) | 2.47 |
| Single Male/Father | 0 (0.0%) | - |
| Single Female/Mother | 7 (1.4%) | 4.43 |
| Total Families | 511 (100.0%) | 2.50 |
Median Household Size in Dexter
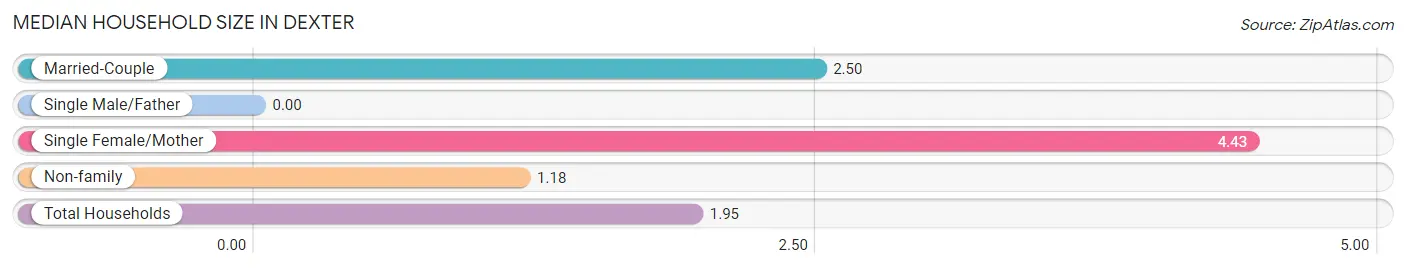
| Household Type | # Households | Household Size |
| Married-Couple | 504 (56.2%) | 2.50 |
| Single Male/Father | 0 (0.0%) | - |
| Single Female/Mother | 7 (0.8%) | 4.43 |
| Non-family | 385 (43.0%) | 1.18 |
| Total Households | 896 (100.0%) | 1.95 |
Household Size by Marriage Status in Dexter
Out of a total of 896 households in Dexter, 511 (57.0%) are family households, while 385 (43.0%) are nonfamily households. The most numerous type of family households are 2-person households, comprising 368, and the most common type of nonfamily households are 1-person households, comprising 321.
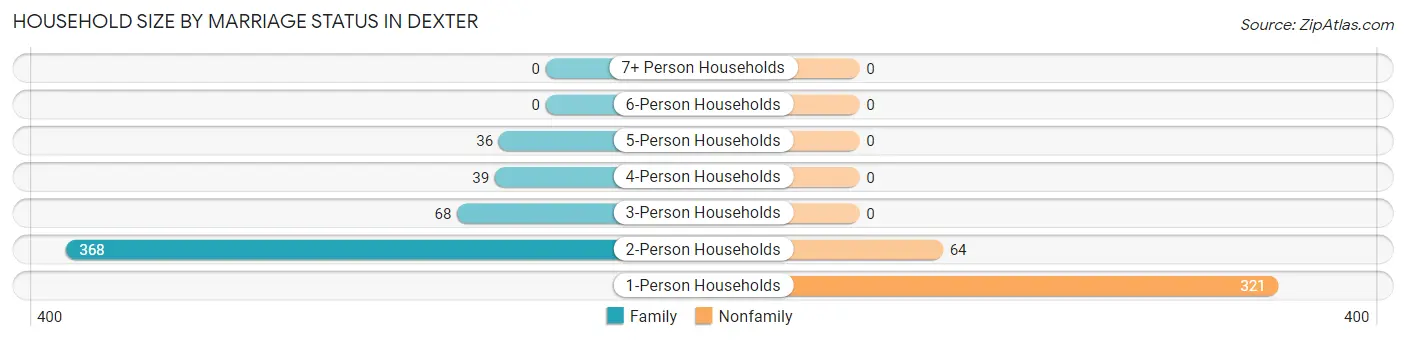
| Household Size | Family Households | Nonfamily Households |
| 1-Person Households | - | 321 (35.8%) |
| 2-Person Households | 368 (41.1%) | 64 (7.1%) |
| 3-Person Households | 68 (7.6%) | 0 (0.0%) |
| 4-Person Households | 39 (4.3%) | 0 (0.0%) |
| 5-Person Households | 36 (4.0%) | 0 (0.0%) |
| 6-Person Households | 0 (0.0%) | 0 (0.0%) |
| 7+ Person Households | 0 (0.0%) | 0 (0.0%) |
| Total | 511 (57.0%) | 385 (43.0%) |
Female Fertility in Dexter
Fertility by Age in Dexter
Average fertility rate in Dexter is 28.0 births per 1,000 women. Women in the age bracket of 35 to 50 years have the highest fertility rate with 113.0 births per 1,000 women. Women in the age bracket of 35 to 50 years acount for 100.0% of all women with births.
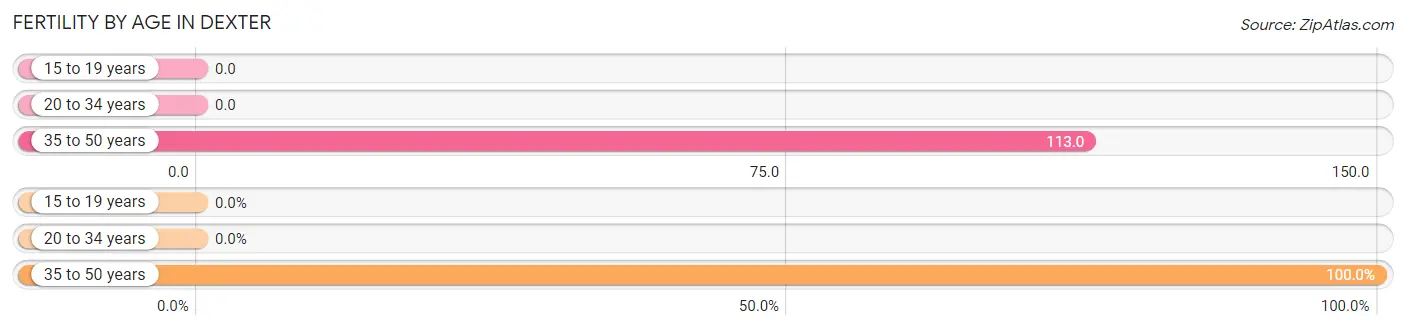
| Age Bracket | Women with Births | Births / 1,000 Women |
| 15 to 19 years | 0 (0.0%) | 0.0 |
| 20 to 34 years | 0 (0.0%) | 0.0 |
| 35 to 50 years | 8 (100.0%) | 113.0 |
| Total | 8 (100.0%) | 28.0 |
Fertility by Age by Marriage Status in Dexter
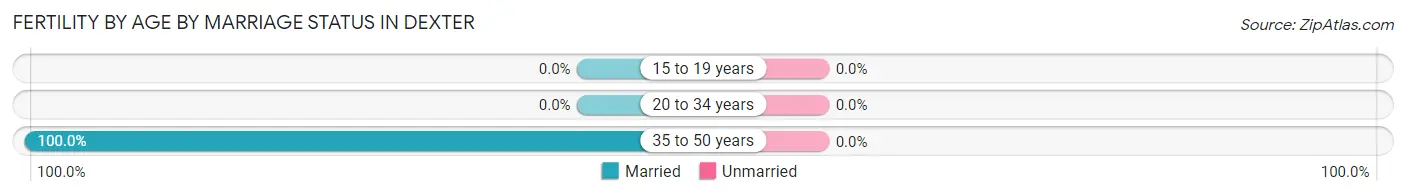
| Age Bracket | Married | Unmarried |
| 15 to 19 years | 0 (0.0%) | 0 (0.0%) |
| 20 to 34 years | 0 (0.0%) | 0 (0.0%) |
| 35 to 50 years | 8 (100.0%) | 0 (0.0%) |
| Total | 8 (100.0%) | 0 (0.0%) |
Fertility by Education in Dexter
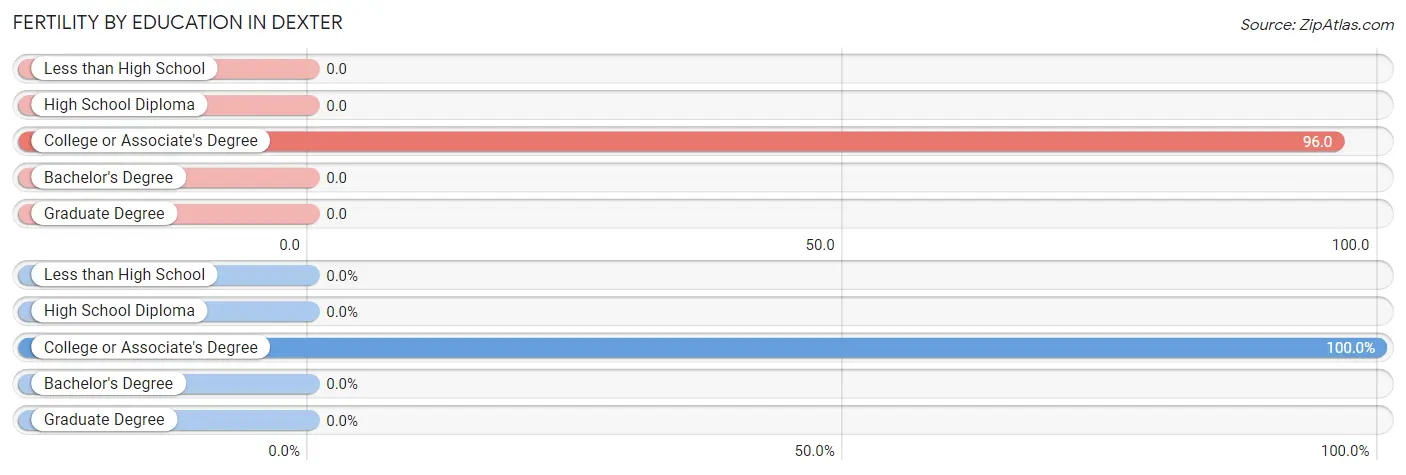
| Educational Attainment | Women with Births | Births / 1,000 Women |
| Less than High School | 0 (0.0%) | 0.0 |
| High School Diploma | 0 (0.0%) | 0.0 |
| College or Associate's Degree | 8 (100.0%) | 96.0 |
| Bachelor's Degree | 0 (0.0%) | 0.0 |
| Graduate Degree | 0 (0.0%) | 0.0 |
| Total | 8 (100.0%) | 28.0 |
Fertility by Education by Marriage Status in Dexter
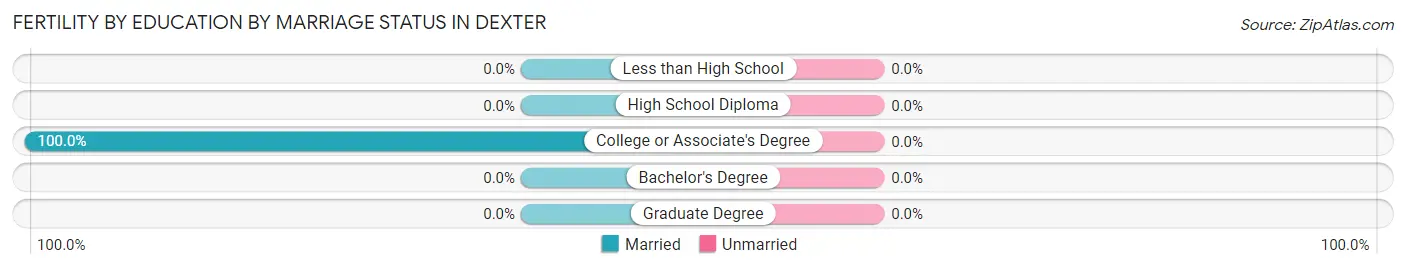
| Educational Attainment | Married | Unmarried |
| Less than High School | 0 (0.0%) | 0 (0.0%) |
| High School Diploma | 0 (0.0%) | 0 (0.0%) |
| College or Associate's Degree | 8 (100.0%) | 0 (0.0%) |
| Bachelor's Degree | 0 (0.0%) | 0 (0.0%) |
| Graduate Degree | 0 (0.0%) | 0 (0.0%) |
| Total | 8 (100.0%) | 0 (0.0%) |
Employment Characteristics in Dexter
Employment by Class of Employer in Dexter
Among the 897 employed individuals in Dexter, private company employees (329 | 36.7%), not-for-profit organizations (273 | 30.4%), and self-employed (not incorporated) (78 | 8.7%) make up the most common classes of employment.
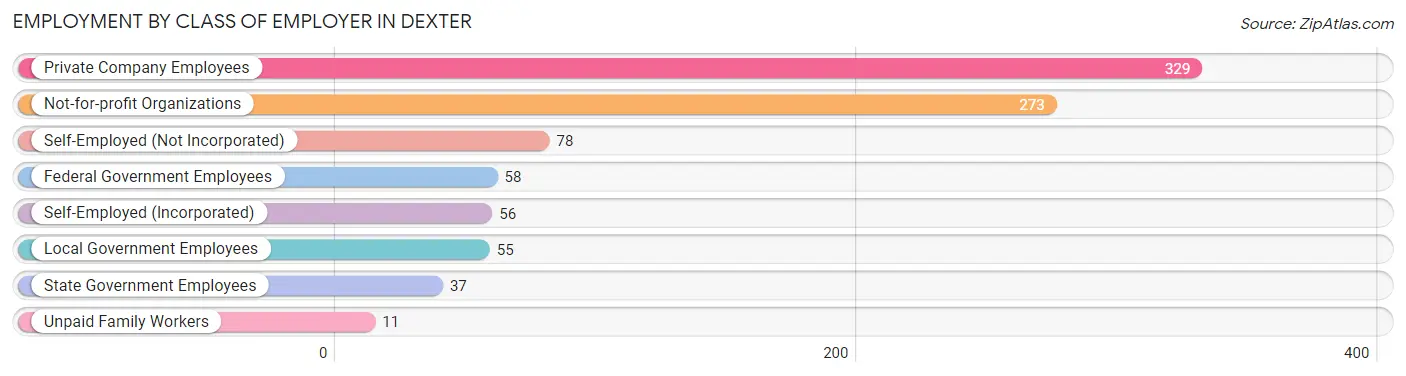
| Employer Class | # Employees | % Employees |
| Private Company Employees | 329 | 36.7% |
| Self-Employed (Incorporated) | 56 | 6.2% |
| Self-Employed (Not Incorporated) | 78 | 8.7% |
| Not-for-profit Organizations | 273 | 30.4% |
| Local Government Employees | 55 | 6.1% |
| State Government Employees | 37 | 4.1% |
| Federal Government Employees | 58 | 6.5% |
| Unpaid Family Workers | 11 | 1.2% |
| Total | 897 | 100.0% |
Employment Status by Age in Dexter
According to the labor force statistics for Dexter, out of the total population over 16 years of age (1,591), 59.8% or 951 individuals are in the labor force, with 4.7% or 45 of them unemployed. The age group with the highest labor force participation rate is 20 to 24 years, with 100.0% or 33 individuals in the labor force. Within the labor force, the 60 to 64 years age range has the highest percentage of unemployed individuals, with 47.7% or 21 of them being unemployed.
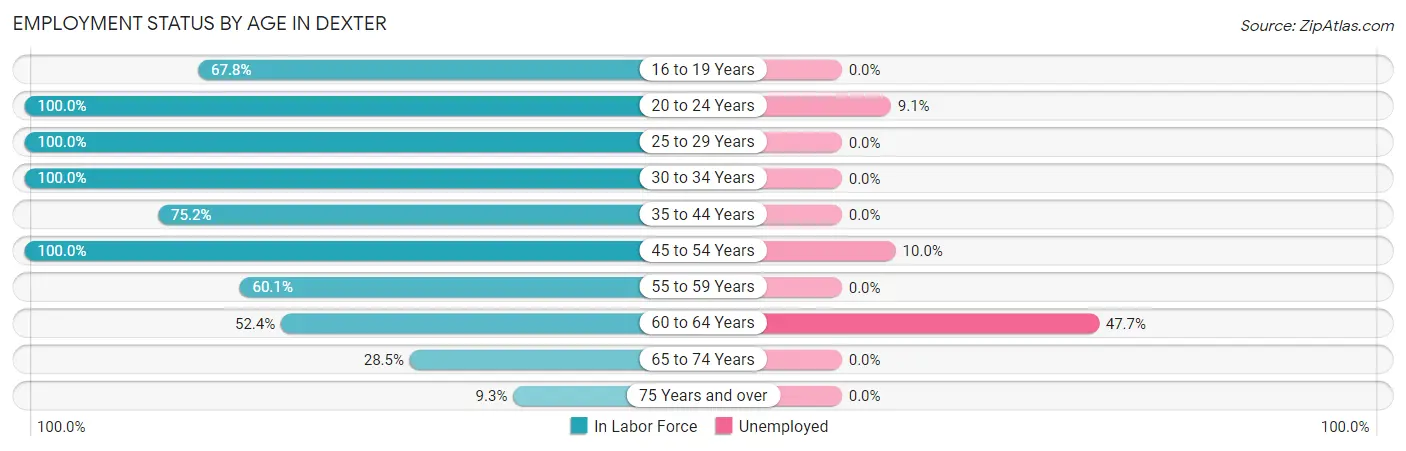
| Age Bracket | In Labor Force | Unemployed |
| 16 to 19 Years | 80 (67.8%) | 0 (0.0%) |
| 20 to 24 Years | 33 (100.0%) | 3 (9.1%) |
| 25 to 29 Years | 73 (100.0%) | 0 (0.0%) |
| 30 to 34 Years | 150 (100.0%) | 0 (0.0%) |
| 35 to 44 Years | 76 (75.2%) | 0 (0.0%) |
| 45 to 54 Years | 211 (100.0%) | 21 (10.0%) |
| 55 to 59 Years | 187 (60.1%) | 0 (0.0%) |
| 60 to 64 Years | 44 (52.4%) | 21 (47.7%) |
| 65 to 74 Years | 75 (28.5%) | 0 (0.0%) |
| 75 Years and over | 23 (9.3%) | 0 (0.0%) |
| Total | 951 (59.8%) | 45 (4.7%) |
Employment Status by Educational Attainment in Dexter
According to labor force statistics for Dexter, 79.7% of individuals (741) out of the total population between 25 and 64 years of age (930) are in the labor force, with 5.7% or 42 of them being unemployed. The group with the highest labor force participation rate are those with the educational attainment of less than high school, with 100.0% or 88 individuals in the labor force. Within the labor force, individuals with high school diploma education have the highest percentage of unemployment, with 12.8% or 34 of them being unemployed.
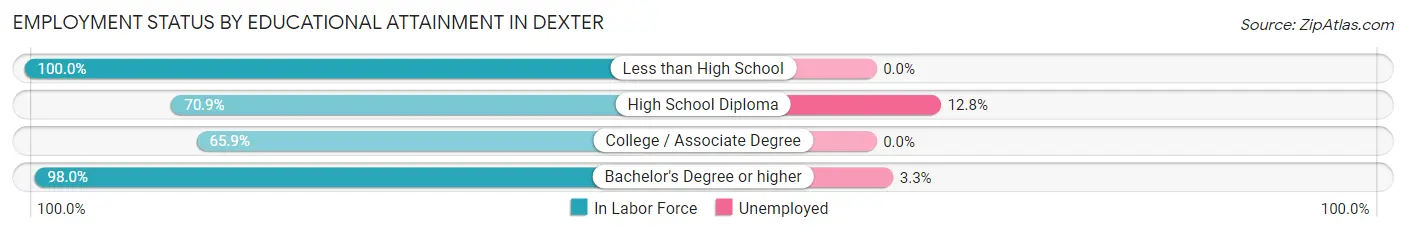
| Educational Attainment | In Labor Force | Unemployed |
| Less than High School | 88 (100.0%) | 0 (0.0%) |
| High School Diploma | 265 (70.9%) | 48 (12.8%) |
| College / Associate Degree | 145 (65.9%) | 0 (0.0%) |
| Bachelor's Degree or higher | 243 (98.0%) | 8 (3.3%) |
| Total | 741 (79.7%) | 53 (5.7%) |
Employment Occupations by Sex in Dexter
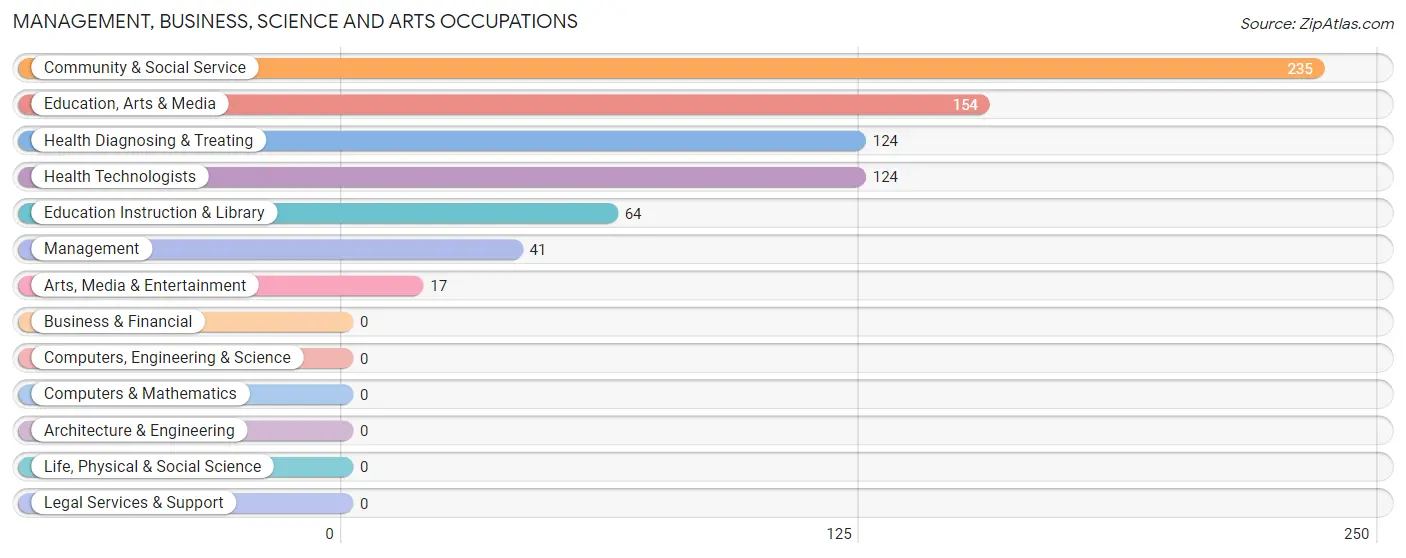
Management, Business, Science and Arts Occupations
The most common Management, Business, Science and Arts occupations in Dexter are Community & Social Service (235 | 25.9%), Education, Arts & Media (154 | 17.0%), Health Diagnosing & Treating (124 | 13.7%), Health Technologists (124 | 13.7%), and Education Instruction & Library (64 | 7.1%).
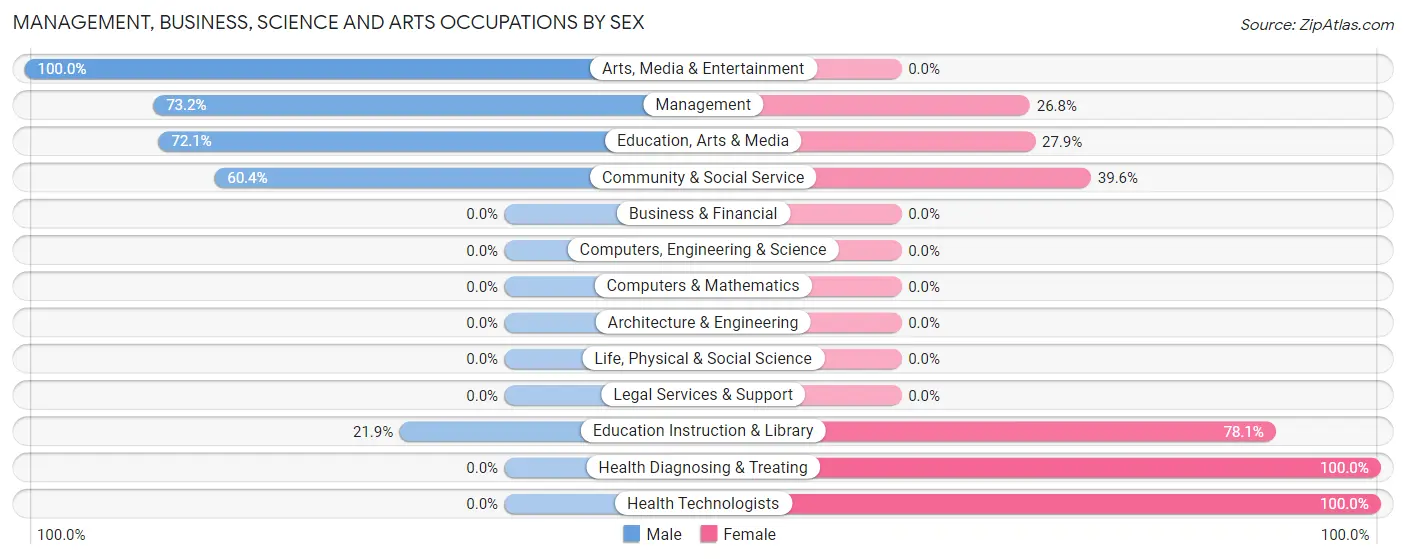
Management, Business, Science and Arts Occupations by Sex
Within the Management, Business, Science and Arts occupations in Dexter, the most male-oriented occupations are Arts, Media & Entertainment (100.0%), Management (73.2%), and Education, Arts & Media (72.1%), while the most female-oriented occupations are Health Diagnosing & Treating (100.0%), Health Technologists (100.0%), and Education Instruction & Library (78.1%).
| Occupation | Male | Female |
| Management | 30 (73.2%) | 11 (26.8%) |
| Business & Financial | 0 (0.0%) | 0 (0.0%) |
| Computers, Engineering & Science | 0 (0.0%) | 0 (0.0%) |
| Computers & Mathematics | 0 (0.0%) | 0 (0.0%) |
| Architecture & Engineering | 0 (0.0%) | 0 (0.0%) |
| Life, Physical & Social Science | 0 (0.0%) | 0 (0.0%) |
| Community & Social Service | 142 (60.4%) | 93 (39.6%) |
| Education, Arts & Media | 111 (72.1%) | 43 (27.9%) |
| Legal Services & Support | 0 (0.0%) | 0 (0.0%) |
| Education Instruction & Library | 14 (21.9%) | 50 (78.1%) |
| Arts, Media & Entertainment | 17 (100.0%) | 0 (0.0%) |
| Health Diagnosing & Treating | 0 (0.0%) | 124 (100.0%) |
| Health Technologists | 0 (0.0%) | 124 (100.0%) |
| Total (Category) | 172 (43.0%) | 228 (57.0%) |
| Total (Overall) | 457 (50.4%) | 450 (49.6%) |
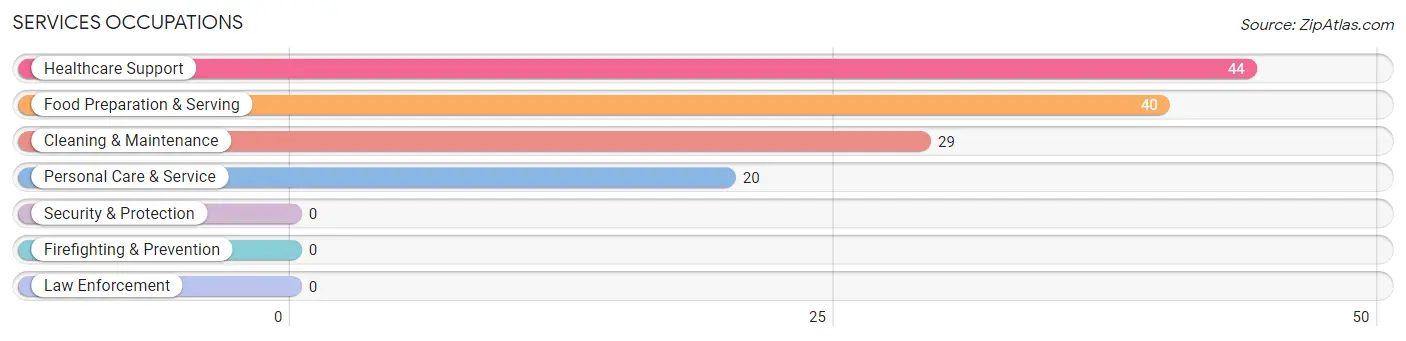
Services Occupations
The most common Services occupations in Dexter are Healthcare Support (44 | 4.9%), Food Preparation & Serving (40 | 4.4%), Cleaning & Maintenance (29 | 3.2%), and Personal Care & Service (20 | 2.2%).
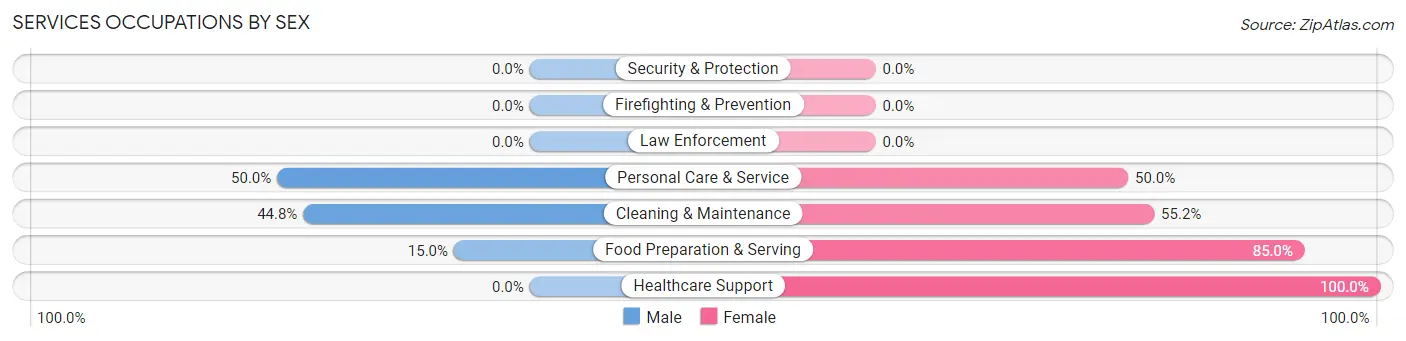
Services Occupations by Sex
Within the Services occupations in Dexter, the most male-oriented occupations are Personal Care & Service (50.0%), Cleaning & Maintenance (44.8%), and Food Preparation & Serving (15.0%), while the most female-oriented occupations are Healthcare Support (100.0%), Food Preparation & Serving (85.0%), and Cleaning & Maintenance (55.2%).
| Occupation | Male | Female |
| Healthcare Support | 0 (0.0%) | 44 (100.0%) |
| Security & Protection | 0 (0.0%) | 0 (0.0%) |
| Firefighting & Prevention | 0 (0.0%) | 0 (0.0%) |
| Law Enforcement | 0 (0.0%) | 0 (0.0%) |
| Food Preparation & Serving | 6 (15.0%) | 34 (85.0%) |
| Cleaning & Maintenance | 13 (44.8%) | 16 (55.2%) |
| Personal Care & Service | 10 (50.0%) | 10 (50.0%) |
| Total (Category) | 29 (21.8%) | 104 (78.2%) |
| Total (Overall) | 457 (50.4%) | 450 (49.6%) |
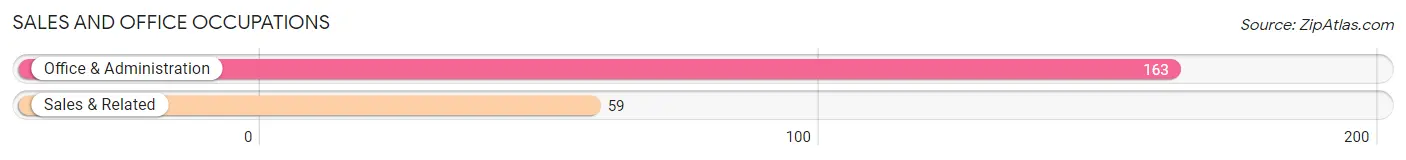
Sales and Office Occupations
The most common Sales and Office occupations in Dexter are Office & Administration (163 | 18.0%), and Sales & Related (59 | 6.5%).
Sales and Office Occupations by Sex
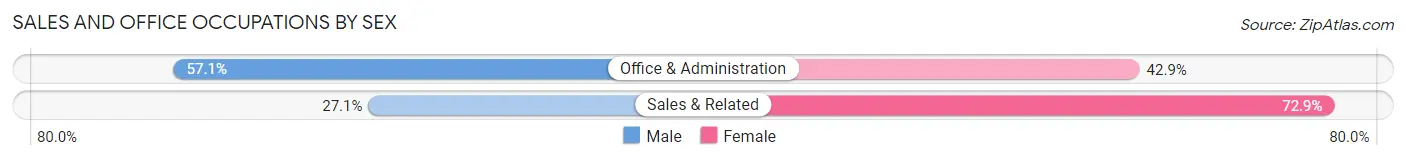
| Occupation | Male | Female |
| Sales & Related | 16 (27.1%) | 43 (72.9%) |
| Office & Administration | 93 (57.1%) | 70 (42.9%) |
| Total (Category) | 109 (49.1%) | 113 (50.9%) |
| Total (Overall) | 457 (50.4%) | 450 (49.6%) |
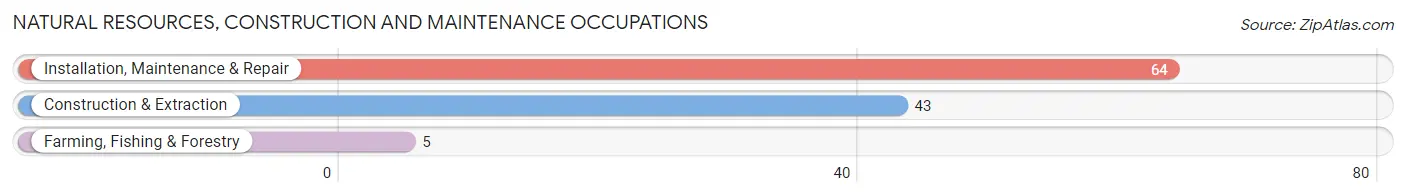
Natural Resources, Construction and Maintenance Occupations
The most common Natural Resources, Construction and Maintenance occupations in Dexter are Installation, Maintenance & Repair (64 | 7.1%), Construction & Extraction (43 | 4.7%), and Farming, Fishing & Forestry (5 | 0.5%).
Natural Resources, Construction and Maintenance Occupations by Sex
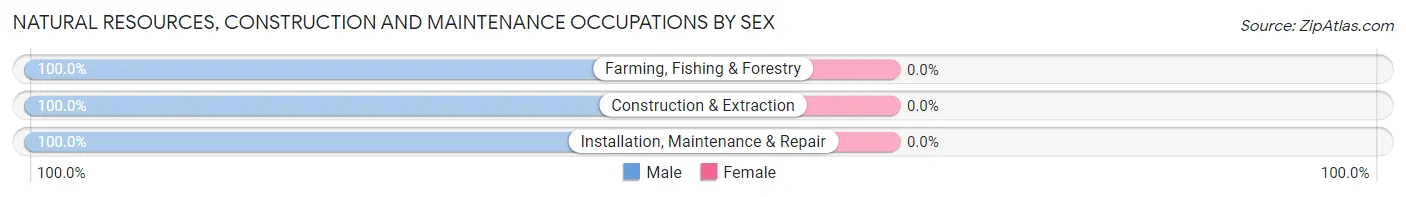
| Occupation | Male | Female |
| Farming, Fishing & Forestry | 5 (100.0%) | 0 (0.0%) |
| Construction & Extraction | 43 (100.0%) | 0 (0.0%) |
| Installation, Maintenance & Repair | 64 (100.0%) | 0 (0.0%) |
| Total (Category) | 112 (100.0%) | 0 (0.0%) |
| Total (Overall) | 457 (50.4%) | 450 (49.6%) |
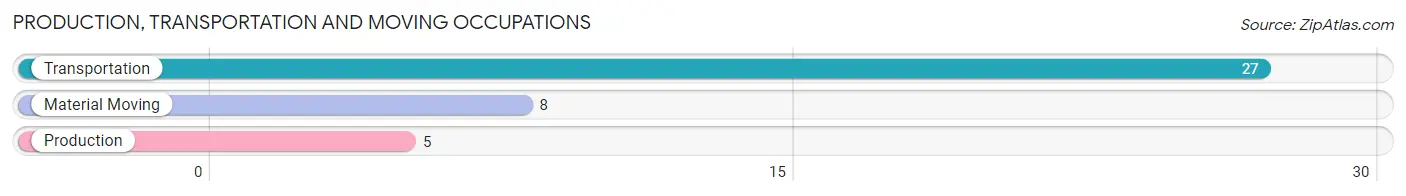
Production, Transportation and Moving Occupations
The most common Production, Transportation and Moving occupations in Dexter are Transportation (27 | 3.0%), Material Moving (8 | 0.9%), and Production (5 | 0.5%).
Production, Transportation and Moving Occupations by Sex
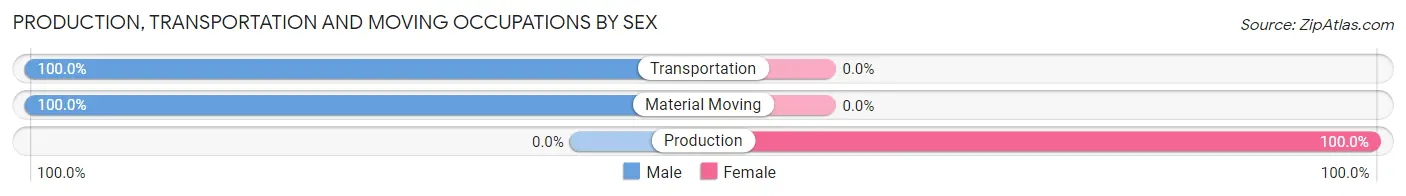
| Occupation | Male | Female |
| Production | 0 (0.0%) | 5 (100.0%) |
| Transportation | 27 (100.0%) | 0 (0.0%) |
| Material Moving | 8 (100.0%) | 0 (0.0%) |
| Total (Category) | 35 (87.5%) | 5 (12.5%) |
| Total (Overall) | 457 (50.4%) | 450 (49.6%) |
Employment Industries by Sex in Dexter
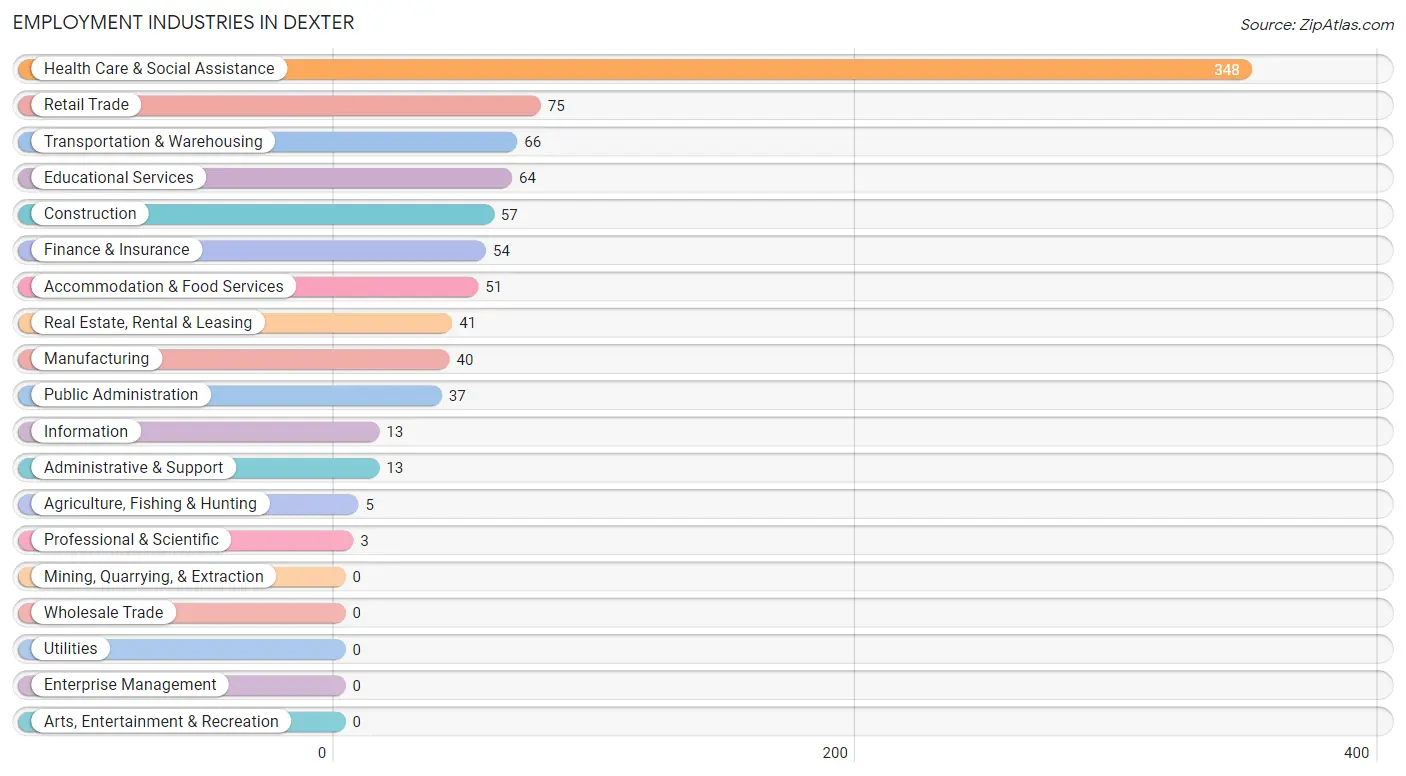
Employment Industries in Dexter
The major employment industries in Dexter include Health Care & Social Assistance (348 | 38.4%), Retail Trade (75 | 8.3%), Transportation & Warehousing (66 | 7.3%), Educational Services (64 | 7.1%), and Construction (57 | 6.3%).
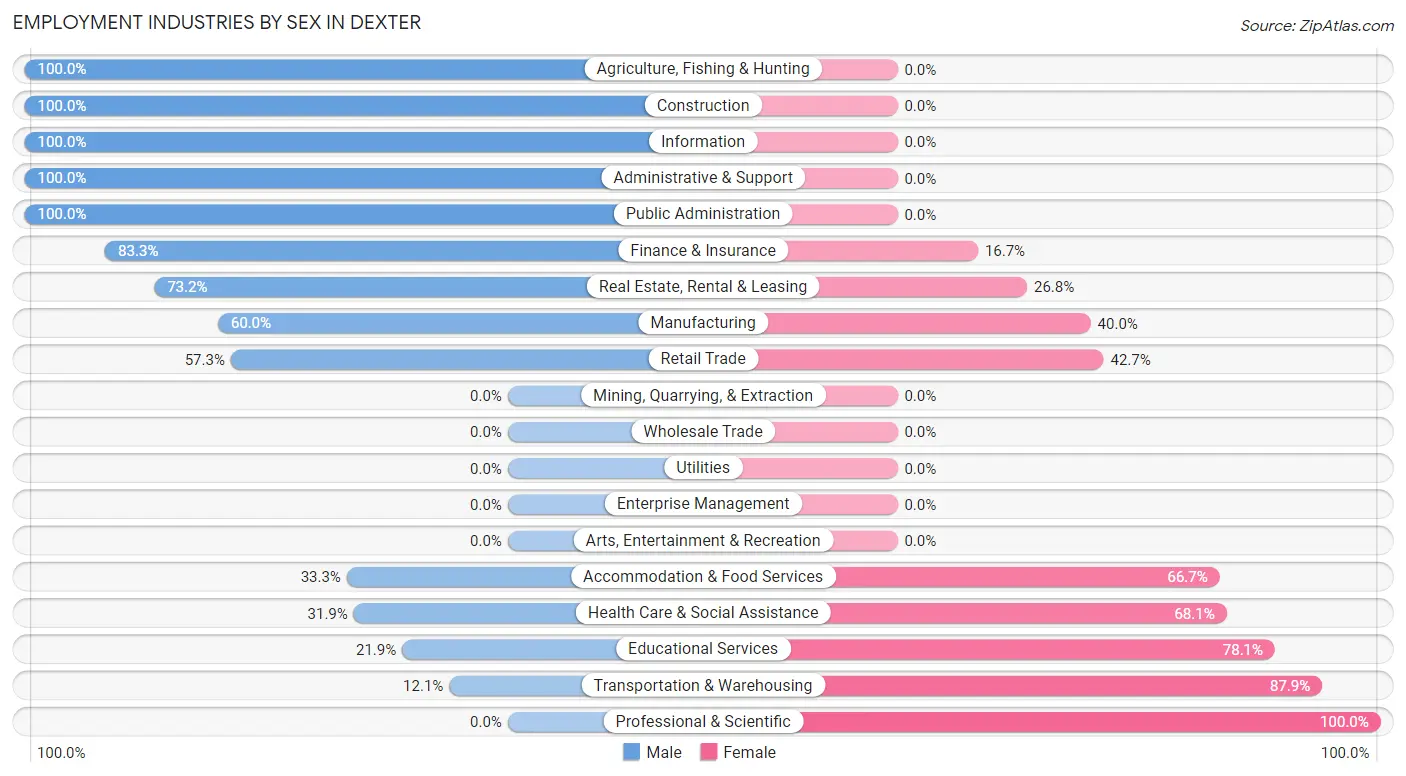
Employment Industries by Sex in Dexter
The Dexter industries that see more men than women are Agriculture, Fishing & Hunting (100.0%), Construction (100.0%), and Information (100.0%), whereas the industries that tend to have a higher number of women are Professional & Scientific (100.0%), Transportation & Warehousing (87.9%), and Educational Services (78.1%).
| Industry | Male | Female |
| Agriculture, Fishing & Hunting | 5 (100.0%) | 0 (0.0%) |
| Mining, Quarrying, & Extraction | 0 (0.0%) | 0 (0.0%) |
| Construction | 57 (100.0%) | 0 (0.0%) |
| Manufacturing | 24 (60.0%) | 16 (40.0%) |
| Wholesale Trade | 0 (0.0%) | 0 (0.0%) |
| Retail Trade | 43 (57.3%) | 32 (42.7%) |
| Transportation & Warehousing | 8 (12.1%) | 58 (87.9%) |
| Utilities | 0 (0.0%) | 0 (0.0%) |
| Information | 13 (100.0%) | 0 (0.0%) |
| Finance & Insurance | 45 (83.3%) | 9 (16.7%) |
| Real Estate, Rental & Leasing | 30 (73.2%) | 11 (26.8%) |
| Professional & Scientific | 0 (0.0%) | 3 (100.0%) |
| Enterprise Management | 0 (0.0%) | 0 (0.0%) |
| Administrative & Support | 13 (100.0%) | 0 (0.0%) |
| Educational Services | 14 (21.9%) | 50 (78.1%) |
| Health Care & Social Assistance | 111 (31.9%) | 237 (68.1%) |
| Arts, Entertainment & Recreation | 0 (0.0%) | 0 (0.0%) |
| Accommodation & Food Services | 17 (33.3%) | 34 (66.7%) |
| Public Administration | 37 (100.0%) | 0 (0.0%) |
| Total | 457 (50.4%) | 450 (49.6%) |
Education in Dexter
School Enrollment in Dexter
The most common levels of schooling among the 282 students in Dexter are high school (118 | 41.8%), middle school (49 | 17.4%), and college / undergraduate (42 | 14.9%).
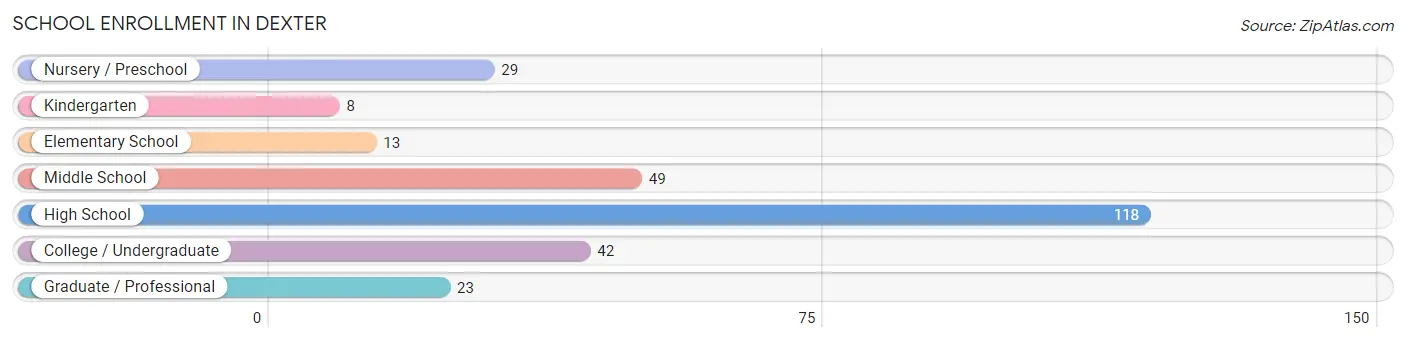
| School Level | # Students | % Students |
| Nursery / Preschool | 29 | 10.3% |
| Kindergarten | 8 | 2.8% |
| Elementary School | 13 | 4.6% |
| Middle School | 49 | 17.4% |
| High School | 118 | 41.8% |
| College / Undergraduate | 42 | 14.9% |
| Graduate / Professional | 23 | 8.2% |
| Total | 282 | 100.0% |
School Enrollment by Age by Funding Source in Dexter
Out of a total of 282 students who are enrolled in schools in Dexter, 40 (14.2%) attend a private institution, while the remaining 242 (85.8%) are enrolled in public schools. The age group of 35 years and over has the highest likelihood of being enrolled in private schools, with 23 (100.0% in the age bracket) enrolled. Conversely, the age group of 3 to 4 year olds has the lowest likelihood of being enrolled in a private school, with 29 (100.0% in the age bracket) attending a public institution.
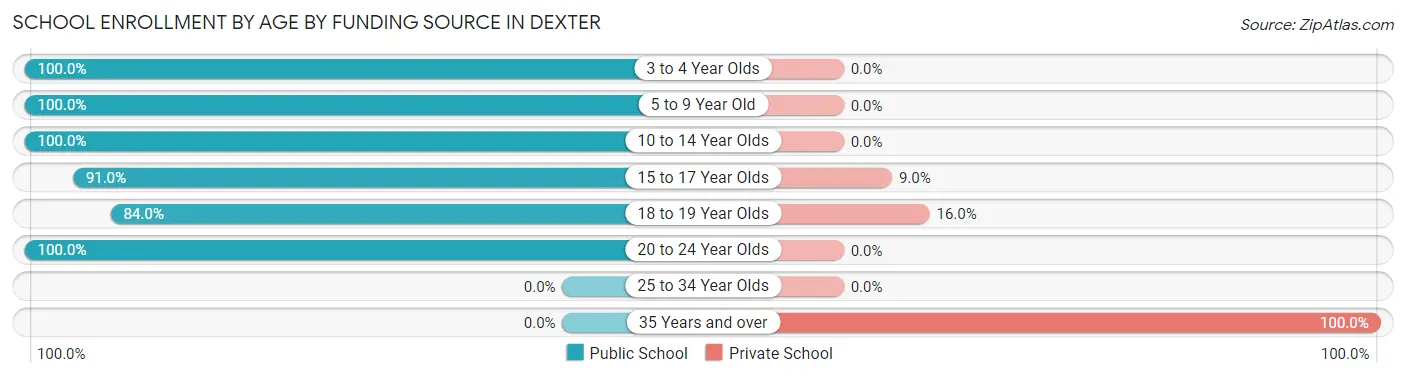
| Age Bracket | Public School | Private School |
| 3 to 4 Year Olds | 29 (100.0%) | 0 (0.0%) |
| 5 to 9 Year Old | 21 (100.0%) | 0 (0.0%) |
| 10 to 14 Year Olds | 49 (100.0%) | 0 (0.0%) |
| 15 to 17 Year Olds | 91 (91.0%) | 9 (9.0%) |
| 18 to 19 Year Olds | 42 (84.0%) | 8 (16.0%) |
| 20 to 24 Year Olds | 10 (100.0%) | 0 (0.0%) |
| 25 to 34 Year Olds | 0 (0.0%) | 0 (0.0%) |
| 35 Years and over | 0 (0.0%) | 23 (100.0%) |
| Total | 242 (85.8%) | 40 (14.2%) |
Educational Attainment by Field of Study in Dexter
Science & technology (165 | 50.1%), arts & humanities (57 | 17.3%), education (40 | 12.2%), business (23 | 7.0%), and communications (20 | 6.1%) are the most common fields of study among 329 individuals in Dexter who have obtained a bachelor's degree or higher.
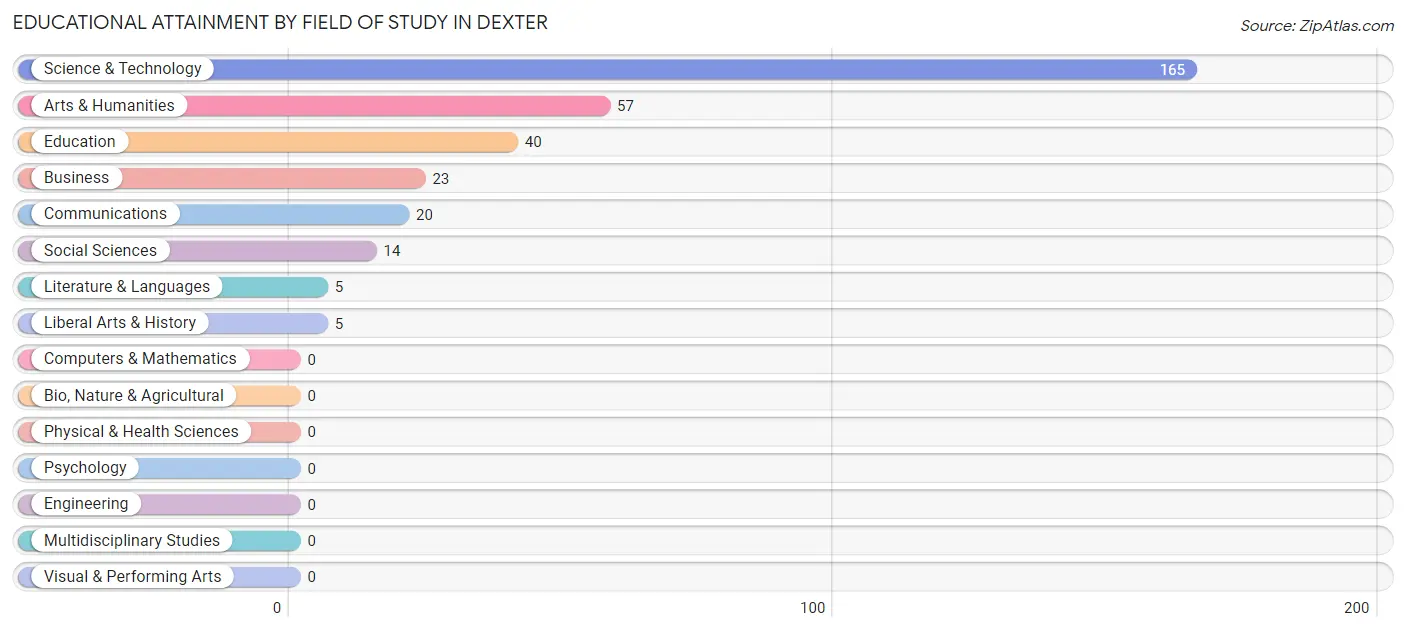
| Field of Study | # Graduates | % Graduates |
| Computers & Mathematics | 0 | 0.0% |
| Bio, Nature & Agricultural | 0 | 0.0% |
| Physical & Health Sciences | 0 | 0.0% |
| Psychology | 0 | 0.0% |
| Social Sciences | 14 | 4.3% |
| Engineering | 0 | 0.0% |
| Multidisciplinary Studies | 0 | 0.0% |
| Science & Technology | 165 | 50.1% |
| Business | 23 | 7.0% |
| Education | 40 | 12.2% |
| Literature & Languages | 5 | 1.5% |
| Liberal Arts & History | 5 | 1.5% |
| Visual & Performing Arts | 0 | 0.0% |
| Communications | 20 | 6.1% |
| Arts & Humanities | 57 | 17.3% |
| Total | 329 | 100.0% |
Transportation & Commute in Dexter
Vehicle Availability by Sex in Dexter
The most prevalent vehicle ownership categories in Dexter are males with 2 vehicles (145, accounting for 32.4%) and females with 2 vehicles (213, making up 32.2%).
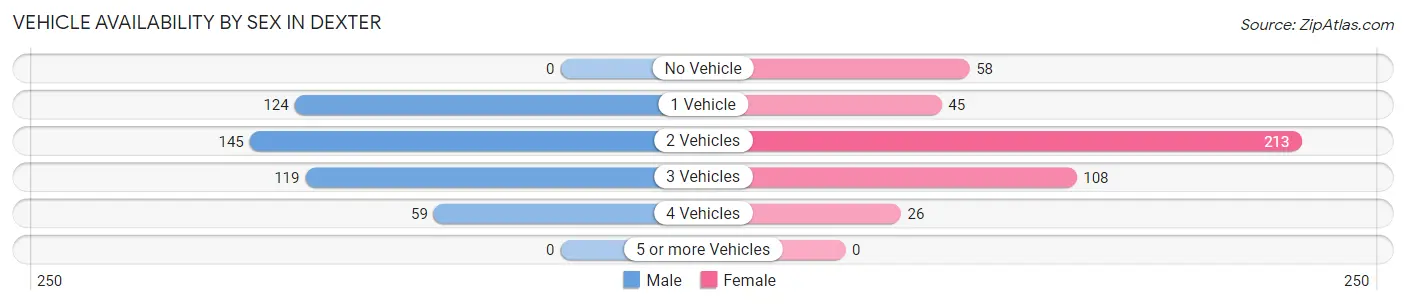
| Vehicles Available | Male | Female |
| No Vehicle | 0 (0.0%) | 58 (12.9%) |
| 1 Vehicle | 124 (27.7%) | 45 (10.0%) |
| 2 Vehicles | 145 (32.4%) | 213 (47.3%) |
| 3 Vehicles | 119 (26.6%) | 108 (24.0%) |
| 4 Vehicles | 59 (13.2%) | 26 (5.8%) |
| 5 or more Vehicles | 0 (0.0%) | 0 (0.0%) |
| Total | 447 (100.0%) | 450 (100.0%) |
Commute Time in Dexter
The most frequently occuring commute durations in Dexter are 20 to 24 minutes (296 commuters, 35.4%), 5 to 9 minutes (154 commuters, 18.4%), and 15 to 19 minutes (90 commuters, 10.8%).
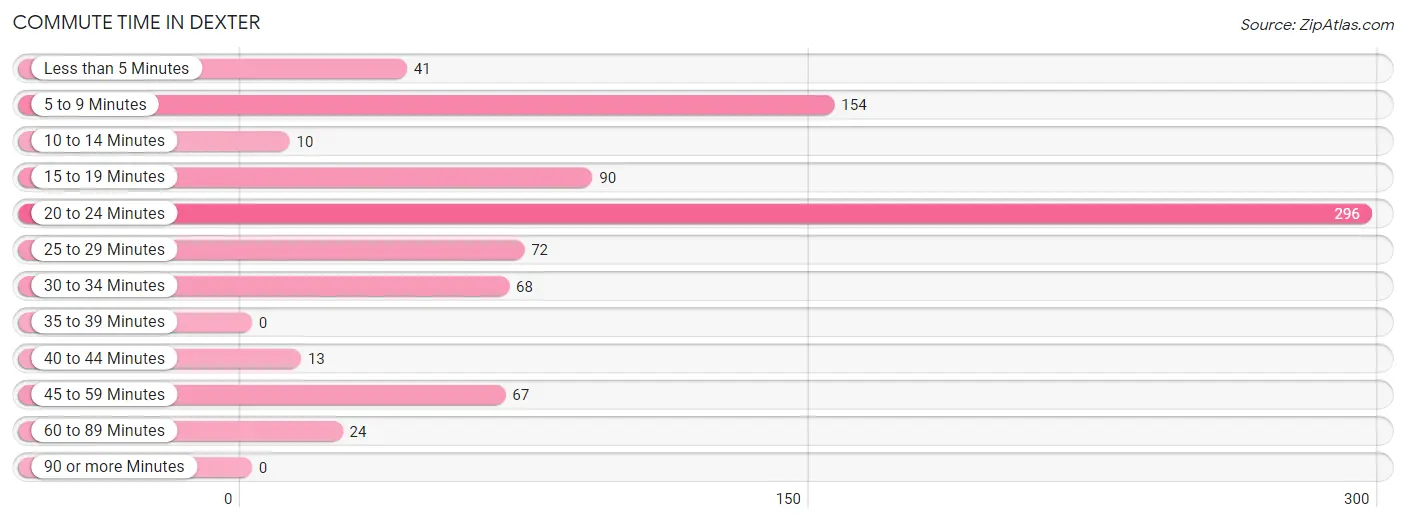
| Commute Time | # Commuters | % Commuters |
| Less than 5 Minutes | 41 | 4.9% |
| 5 to 9 Minutes | 154 | 18.4% |
| 10 to 14 Minutes | 10 | 1.2% |
| 15 to 19 Minutes | 90 | 10.8% |
| 20 to 24 Minutes | 296 | 35.4% |
| 25 to 29 Minutes | 72 | 8.6% |
| 30 to 34 Minutes | 68 | 8.1% |
| 35 to 39 Minutes | 0 | 0.0% |
| 40 to 44 Minutes | 13 | 1.6% |
| 45 to 59 Minutes | 67 | 8.0% |
| 60 to 89 Minutes | 24 | 2.9% |
| 90 or more Minutes | 0 | 0.0% |
Commute Time by Sex in Dexter
The most common commute times in Dexter are 5 to 9 minutes (134 commuters, 30.8%) for males and 20 to 24 minutes (231 commuters, 57.8%) for females.
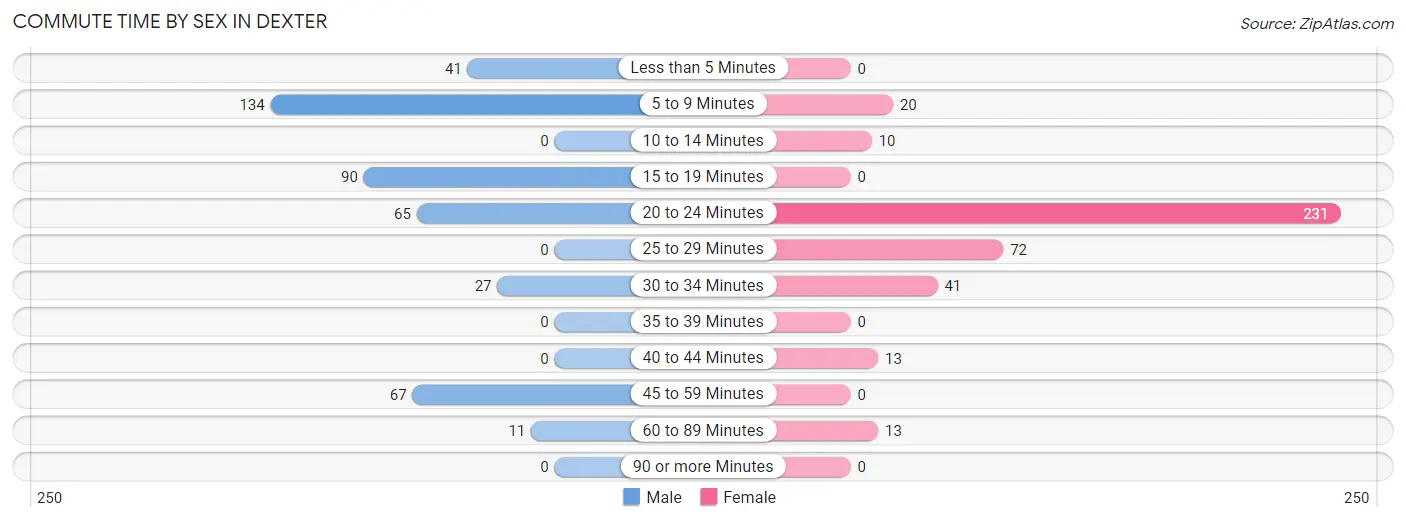
| Commute Time | Male | Female |
| Less than 5 Minutes | 41 (9.4%) | 0 (0.0%) |
| 5 to 9 Minutes | 134 (30.8%) | 20 (5.0%) |
| 10 to 14 Minutes | 0 (0.0%) | 10 (2.5%) |
| 15 to 19 Minutes | 90 (20.7%) | 0 (0.0%) |
| 20 to 24 Minutes | 65 (14.9%) | 231 (57.8%) |
| 25 to 29 Minutes | 0 (0.0%) | 72 (18.0%) |
| 30 to 34 Minutes | 27 (6.2%) | 41 (10.2%) |
| 35 to 39 Minutes | 0 (0.0%) | 0 (0.0%) |
| 40 to 44 Minutes | 0 (0.0%) | 13 (3.3%) |
| 45 to 59 Minutes | 67 (15.4%) | 0 (0.0%) |
| 60 to 89 Minutes | 11 (2.5%) | 13 (3.3%) |
| 90 or more Minutes | 0 (0.0%) | 0 (0.0%) |
Time of Departure to Work by Sex in Dexter
The most frequent times of departure to work in Dexter are 12:00 AM to 4:59 AM (130, 29.9%) for males and 9:00 AM to 9:59 AM (107, 26.8%) for females.
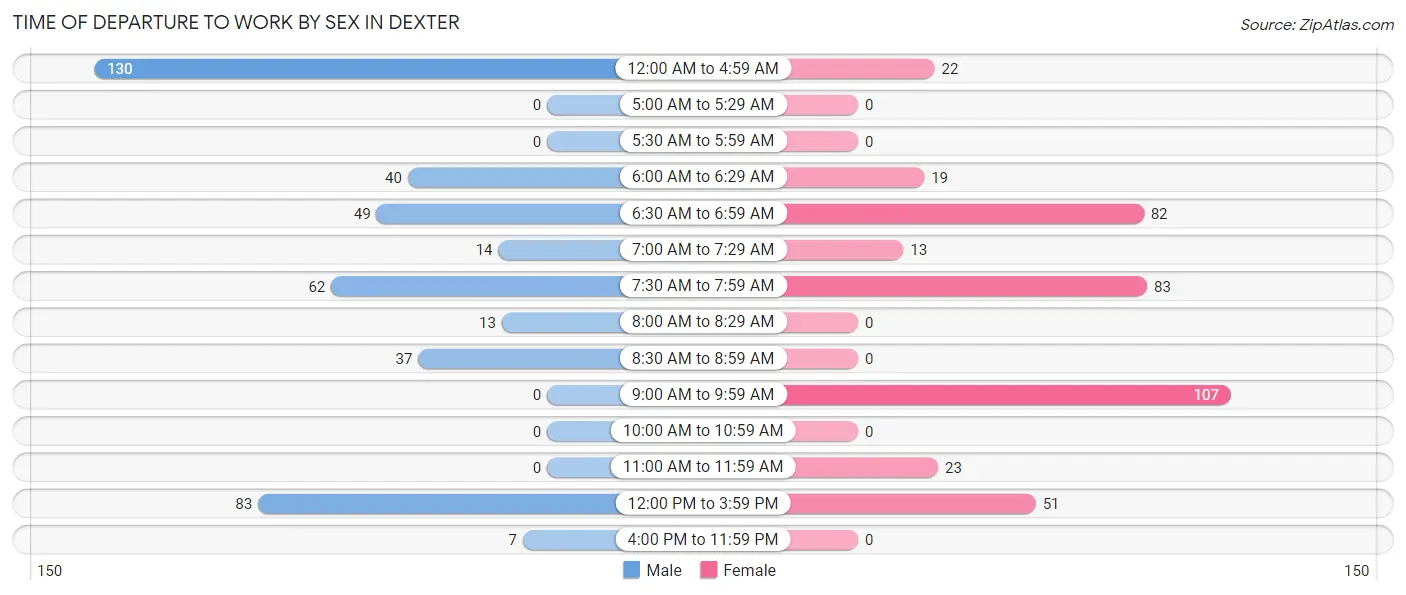
| Time of Departure | Male | Female |
| 12:00 AM to 4:59 AM | 130 (29.9%) | 22 (5.5%) |
| 5:00 AM to 5:29 AM | 0 (0.0%) | 0 (0.0%) |
| 5:30 AM to 5:59 AM | 0 (0.0%) | 0 (0.0%) |
| 6:00 AM to 6:29 AM | 40 (9.2%) | 19 (4.8%) |
| 6:30 AM to 6:59 AM | 49 (11.3%) | 82 (20.5%) |
| 7:00 AM to 7:29 AM | 14 (3.2%) | 13 (3.3%) |
| 7:30 AM to 7:59 AM | 62 (14.2%) | 83 (20.7%) |
| 8:00 AM to 8:29 AM | 13 (3.0%) | 0 (0.0%) |
| 8:30 AM to 8:59 AM | 37 (8.5%) | 0 (0.0%) |
| 9:00 AM to 9:59 AM | 0 (0.0%) | 107 (26.8%) |
| 10:00 AM to 10:59 AM | 0 (0.0%) | 0 (0.0%) |
| 11:00 AM to 11:59 AM | 0 (0.0%) | 23 (5.8%) |
| 12:00 PM to 3:59 PM | 83 (19.1%) | 51 (12.8%) |
| 4:00 PM to 11:59 PM | 7 (1.6%) | 0 (0.0%) |
| Total | 435 (100.0%) | 400 (100.0%) |
Housing Occupancy in Dexter
Occupancy by Ownership in Dexter
Of the total 896 dwellings in Dexter, owner-occupied units account for 466 (52.0%), while renter-occupied units make up 430 (48.0%).
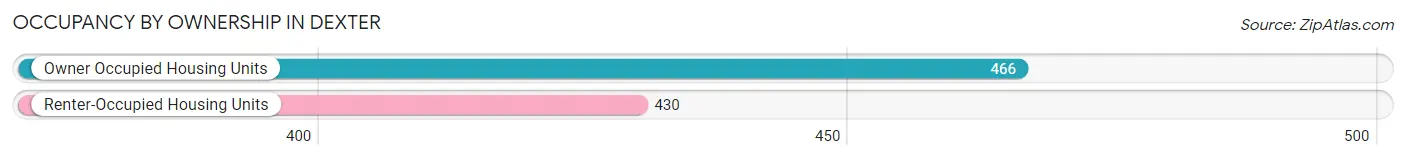
| Occupancy | # Housing Units | % Housing Units |
| Owner Occupied Housing Units | 466 | 52.0% |
| Renter-Occupied Housing Units | 430 | 48.0% |
| Total Occupied Housing Units | 896 | 100.0% |
Occupancy by Household Size in Dexter
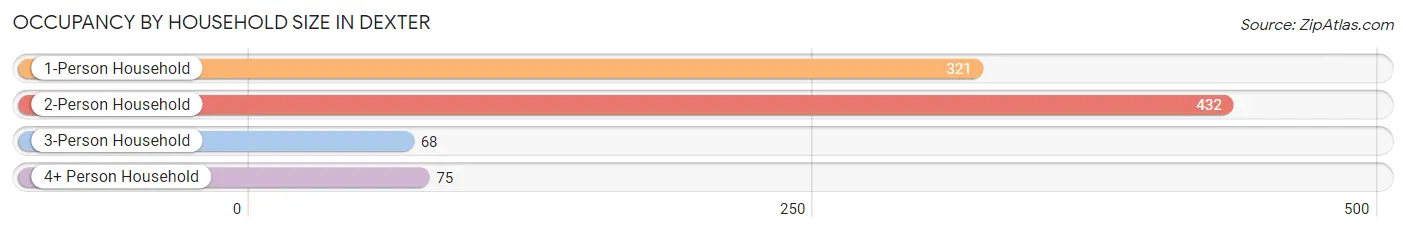
| Household Size | # Housing Units | % Housing Units |
| 1-Person Household | 321 | 35.8% |
| 2-Person Household | 432 | 48.2% |
| 3-Person Household | 68 | 7.6% |
| 4+ Person Household | 75 | 8.4% |
| Total Housing Units | 896 | 100.0% |
Occupancy by Ownership by Household Size in Dexter
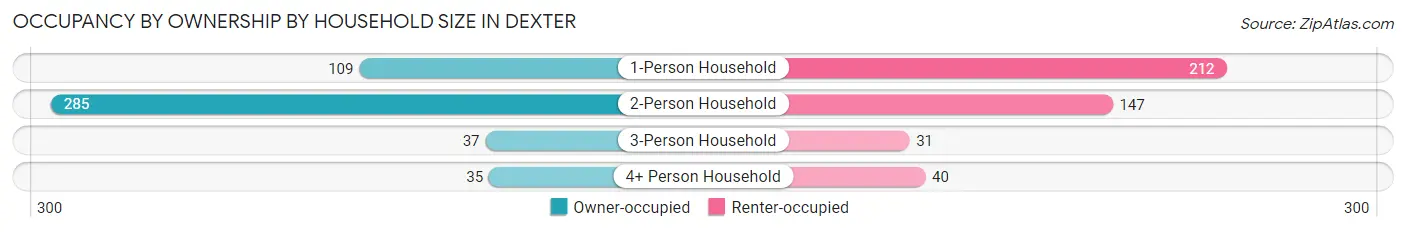
| Household Size | Owner-occupied | Renter-occupied |
| 1-Person Household | 109 (34.0%) | 212 (66.0%) |
| 2-Person Household | 285 (66.0%) | 147 (34.0%) |
| 3-Person Household | 37 (54.4%) | 31 (45.6%) |
| 4+ Person Household | 35 (46.7%) | 40 (53.3%) |
| Total Housing Units | 466 (52.0%) | 430 (48.0%) |
Occupancy by Educational Attainment in Dexter
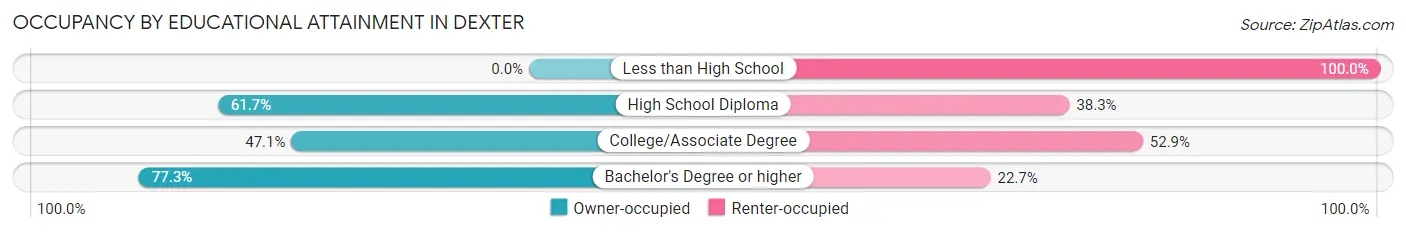
| Household Size | Owner-occupied | Renter-occupied |
| Less than High School | 0 (0.0%) | 117 (100.0%) |
| High School Diploma | 227 (61.7%) | 141 (38.3%) |
| College/Associate Degree | 123 (47.1%) | 138 (52.9%) |
| Bachelor's Degree or higher | 116 (77.3%) | 34 (22.7%) |
Occupancy by Age of Householder in Dexter
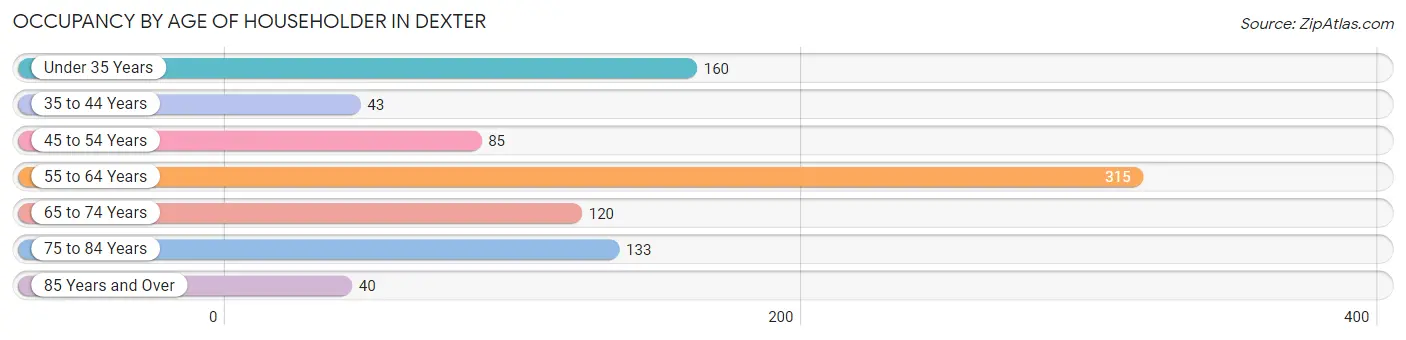
| Age Bracket | # Households | % Households |
| Under 35 Years | 160 | 17.9% |
| 35 to 44 Years | 43 | 4.8% |
| 45 to 54 Years | 85 | 9.5% |
| 55 to 64 Years | 315 | 35.2% |
| 65 to 74 Years | 120 | 13.4% |
| 75 to 84 Years | 133 | 14.8% |
| 85 Years and Over | 40 | 4.5% |
| Total | 896 | 100.0% |
Housing Finances in Dexter
Median Income by Occupancy in Dexter
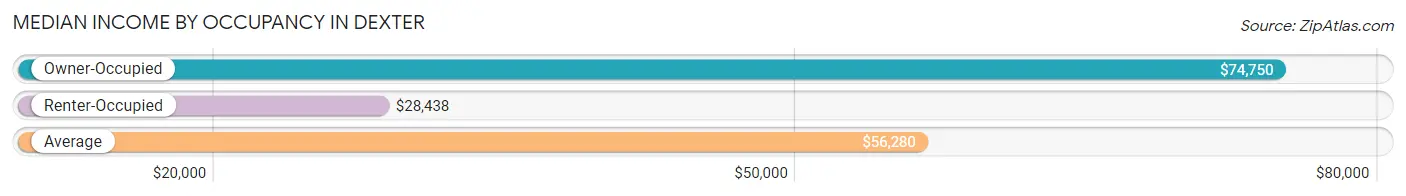
| Occupancy Type | # Households | Median Income |
| Owner-Occupied | 466 (52.0%) | $74,750 |
| Renter-Occupied | 430 (48.0%) | $28,438 |
| Average | 896 (100.0%) | $56,280 |
Occupancy by Householder Income Bracket in Dexter
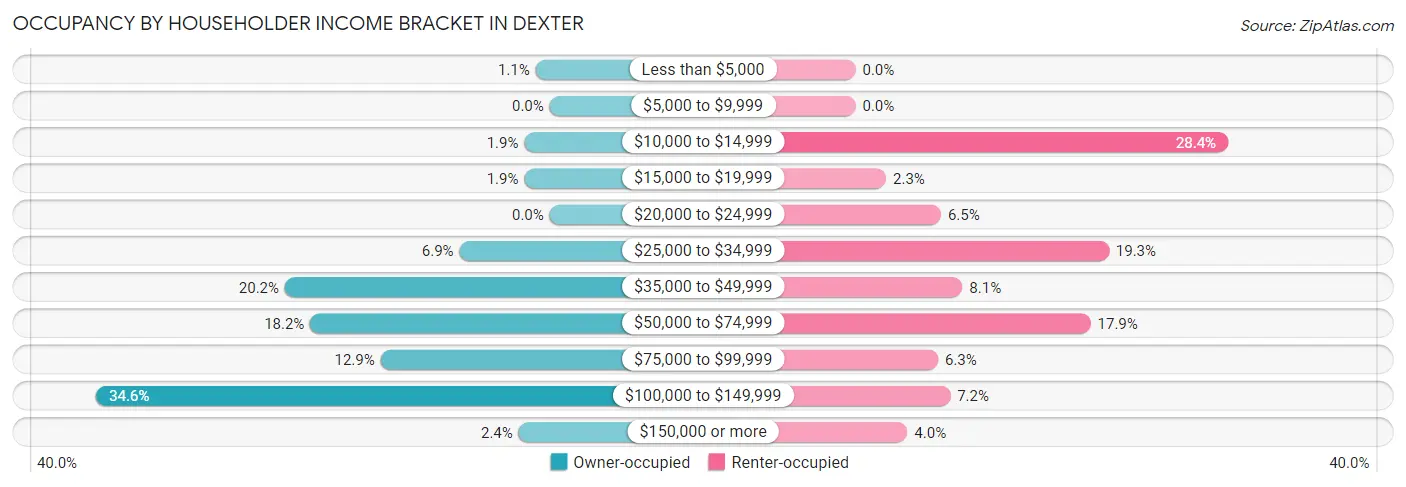
| Income Bracket | Owner-occupied | Renter-occupied |
| Less than $5,000 | 5 (1.1%) | 0 (0.0%) |
| $5,000 to $9,999 | 0 (0.0%) | 0 (0.0%) |
| $10,000 to $14,999 | 9 (1.9%) | 122 (28.4%) |
| $15,000 to $19,999 | 9 (1.9%) | 10 (2.3%) |
| $20,000 to $24,999 | 0 (0.0%) | 28 (6.5%) |
| $25,000 to $34,999 | 32 (6.9%) | 83 (19.3%) |
| $35,000 to $49,999 | 94 (20.2%) | 35 (8.1%) |
| $50,000 to $74,999 | 85 (18.2%) | 77 (17.9%) |
| $75,000 to $99,999 | 60 (12.9%) | 27 (6.3%) |
| $100,000 to $149,999 | 161 (34.5%) | 31 (7.2%) |
| $150,000 or more | 11 (2.4%) | 17 (4.0%) |
| Total | 466 (100.0%) | 430 (100.0%) |
Monthly Housing Cost Tiers in Dexter
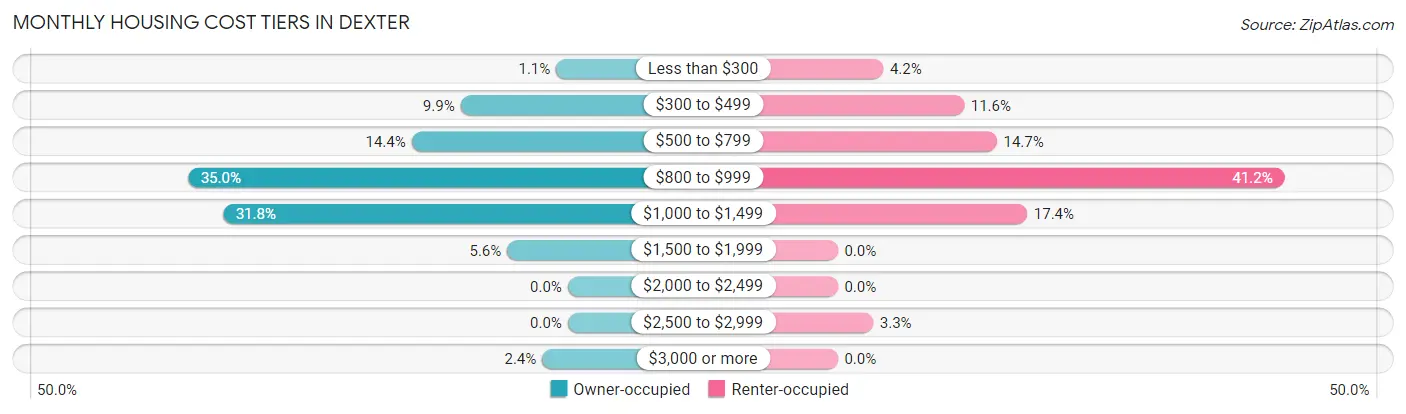
| Monthly Cost | Owner-occupied | Renter-occupied |
| Less than $300 | 5 (1.1%) | 18 (4.2%) |
| $300 to $499 | 46 (9.9%) | 50 (11.6%) |
| $500 to $799 | 67 (14.4%) | 63 (14.6%) |
| $800 to $999 | 163 (35.0%) | 177 (41.2%) |
| $1,000 to $1,499 | 148 (31.8%) | 75 (17.4%) |
| $1,500 to $1,999 | 26 (5.6%) | 0 (0.0%) |
| $2,000 to $2,499 | 0 (0.0%) | 0 (0.0%) |
| $2,500 to $2,999 | 0 (0.0%) | 14 (3.3%) |
| $3,000 or more | 11 (2.4%) | 0 (0.0%) |
| Total | 466 (100.0%) | 430 (100.0%) |
Physical Housing Characteristics in Dexter
Housing Structures in Dexter
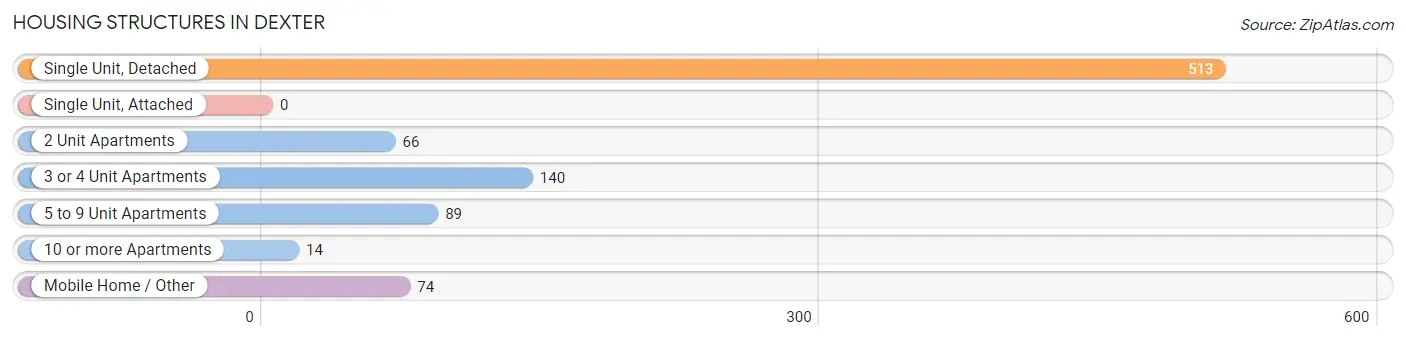
| Structure Type | # Housing Units | % Housing Units |
| Single Unit, Detached | 513 | 57.3% |
| Single Unit, Attached | 0 | 0.0% |
| 2 Unit Apartments | 66 | 7.4% |
| 3 or 4 Unit Apartments | 140 | 15.6% |
| 5 to 9 Unit Apartments | 89 | 9.9% |
| 10 or more Apartments | 14 | 1.6% |
| Mobile Home / Other | 74 | 8.3% |
| Total | 896 | 100.0% |
Housing Structures by Occupancy in Dexter
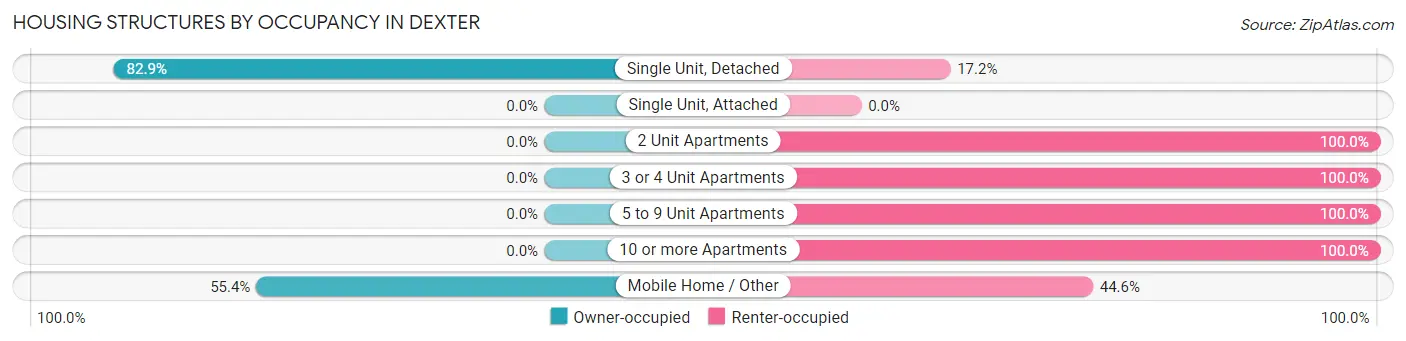
| Structure Type | Owner-occupied | Renter-occupied |
| Single Unit, Detached | 425 (82.9%) | 88 (17.2%) |
| Single Unit, Attached | 0 (0.0%) | 0 (0.0%) |
| 2 Unit Apartments | 0 (0.0%) | 66 (100.0%) |
| 3 or 4 Unit Apartments | 0 (0.0%) | 140 (100.0%) |
| 5 to 9 Unit Apartments | 0 (0.0%) | 89 (100.0%) |
| 10 or more Apartments | 0 (0.0%) | 14 (100.0%) |
| Mobile Home / Other | 41 (55.4%) | 33 (44.6%) |
| Total | 466 (52.0%) | 430 (48.0%) |
Housing Structures by Number of Rooms in Dexter
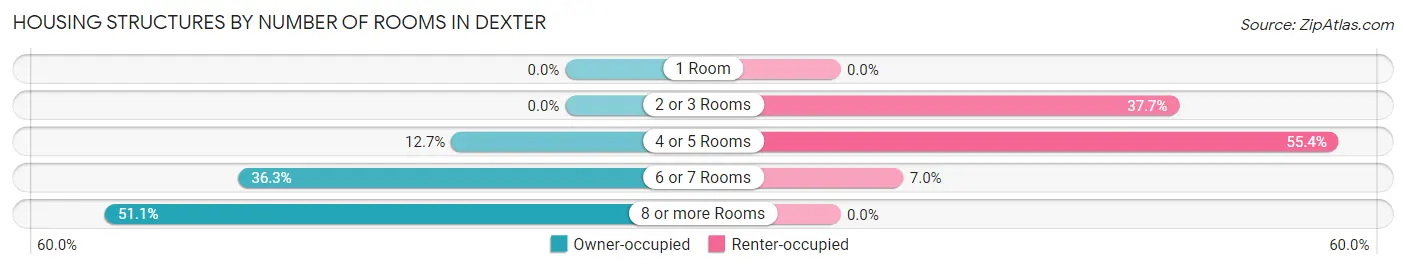
| Number of Rooms | Owner-occupied | Renter-occupied |
| 1 Room | 0 (0.0%) | 0 (0.0%) |
| 2 or 3 Rooms | 0 (0.0%) | 162 (37.7%) |
| 4 or 5 Rooms | 59 (12.7%) | 238 (55.3%) |
| 6 or 7 Rooms | 169 (36.3%) | 30 (7.0%) |
| 8 or more Rooms | 238 (51.1%) | 0 (0.0%) |
| Total | 466 (100.0%) | 430 (100.0%) |
Housing Structure by Heating Type in Dexter
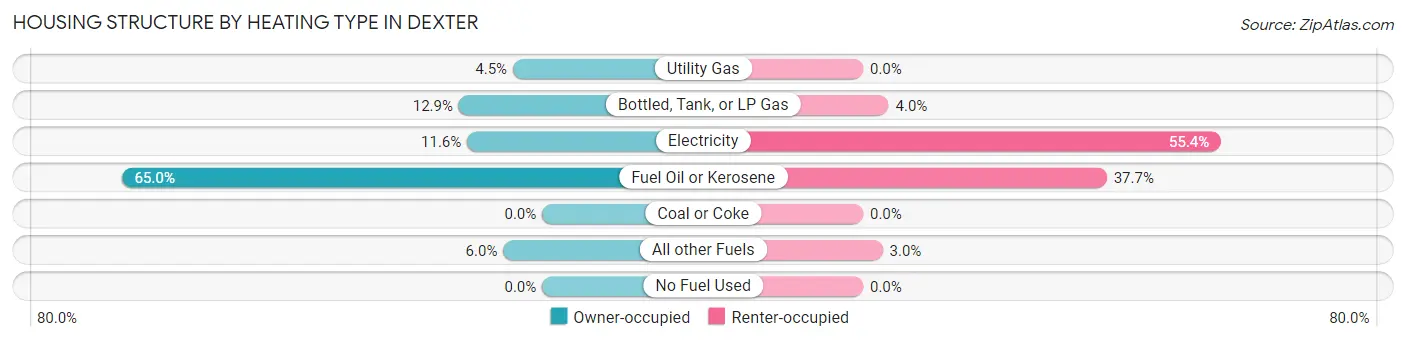
| Heating Type | Owner-occupied | Renter-occupied |
| Utility Gas | 21 (4.5%) | 0 (0.0%) |
| Bottled, Tank, or LP Gas | 60 (12.9%) | 17 (4.0%) |
| Electricity | 54 (11.6%) | 238 (55.3%) |
| Fuel Oil or Kerosene | 303 (65.0%) | 162 (37.7%) |
| Coal or Coke | 0 (0.0%) | 0 (0.0%) |
| All other Fuels | 28 (6.0%) | 13 (3.0%) |
| No Fuel Used | 0 (0.0%) | 0 (0.0%) |
| Total | 466 (100.0%) | 430 (100.0%) |
Household Vehicle Usage in Dexter
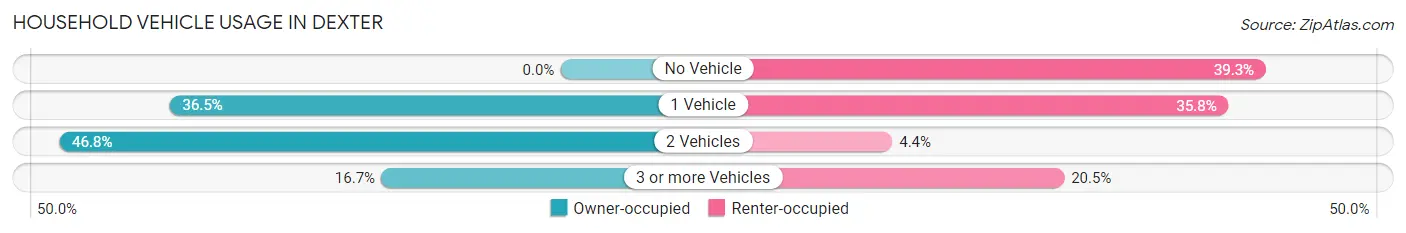
| Vehicles per Household | Owner-occupied | Renter-occupied |
| No Vehicle | 0 (0.0%) | 169 (39.3%) |
| 1 Vehicle | 170 (36.5%) | 154 (35.8%) |
| 2 Vehicles | 218 (46.8%) | 19 (4.4%) |
| 3 or more Vehicles | 78 (16.7%) | 88 (20.5%) |
| Total | 466 (100.0%) | 430 (100.0%) |
Real Estate & Mortgages in Dexter
Real Estate and Mortgage Overview in Dexter
| Characteristic | Without Mortgage | With Mortgage |
| Housing Units | 246 | 220 |
| Median Property Value | $119,600 | $139,500 |
| Median Household Income | $117,273 | $0 |
| Monthly Housing Costs | $917 | $11 |
| Real Estate Taxes | $2,366 | $45 |
Property Value by Mortgage Status in Dexter
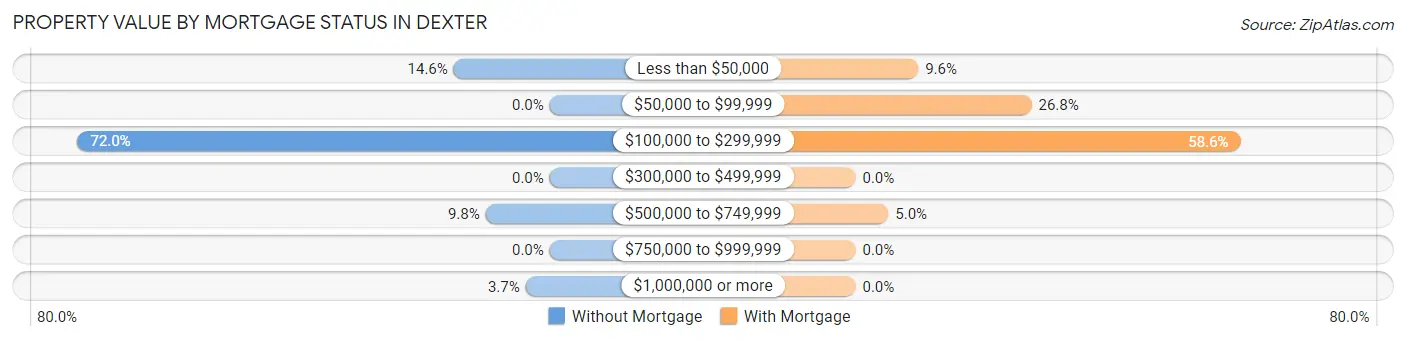
| Property Value | Without Mortgage | With Mortgage |
| Less than $50,000 | 36 (14.6%) | 21 (9.6%) |
| $50,000 to $99,999 | 0 (0.0%) | 59 (26.8%) |
| $100,000 to $299,999 | 177 (72.0%) | 129 (58.6%) |
| $300,000 to $499,999 | 0 (0.0%) | 0 (0.0%) |
| $500,000 to $749,999 | 24 (9.8%) | 11 (5.0%) |
| $750,000 to $999,999 | 0 (0.0%) | 0 (0.0%) |
| $1,000,000 or more | 9 (3.7%) | 0 (0.0%) |
| Total | 246 (100.0%) | 220 (100.0%) |
Household Income by Mortgage Status in Dexter
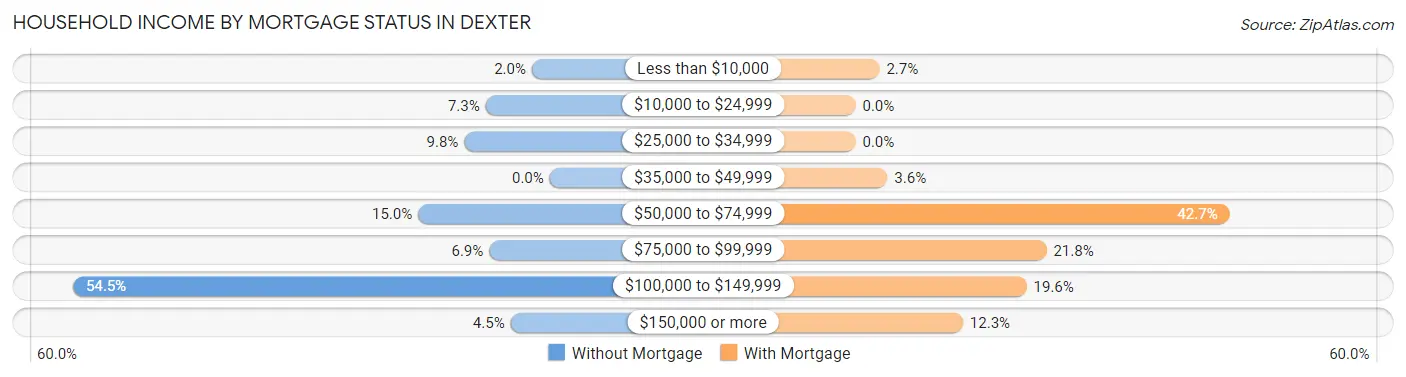
| Household Income | Without Mortgage | With Mortgage |
| Less than $10,000 | 5 (2.0%) | 6 (2.7%) |
| $10,000 to $24,999 | 18 (7.3%) | 0 (0.0%) |
| $25,000 to $34,999 | 24 (9.8%) | 0 (0.0%) |
| $35,000 to $49,999 | 0 (0.0%) | 8 (3.6%) |
| $50,000 to $74,999 | 37 (15.0%) | 94 (42.7%) |
| $75,000 to $99,999 | 17 (6.9%) | 48 (21.8%) |
| $100,000 to $149,999 | 134 (54.5%) | 43 (19.6%) |
| $150,000 or more | 11 (4.5%) | 27 (12.3%) |
| Total | 246 (100.0%) | 220 (100.0%) |
Property Value to Household Income Ratio in Dexter
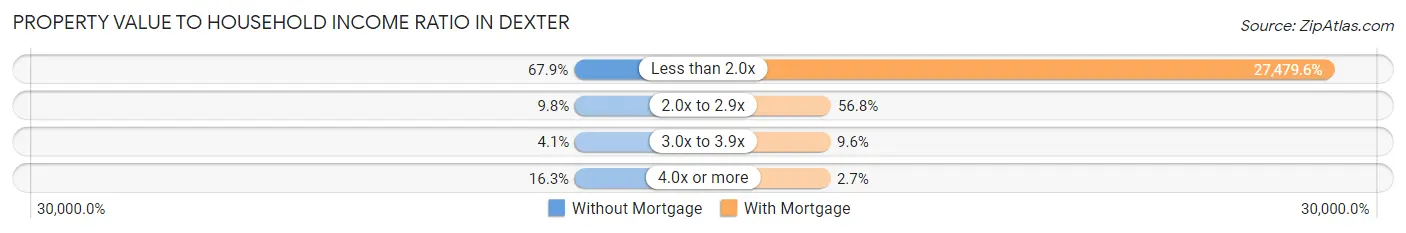
| Value-to-Income Ratio | Without Mortgage | With Mortgage |
| Less than 2.0x | 167 (67.9%) | 60,455 (27,479.6%) |
| 2.0x to 2.9x | 24 (9.8%) | 125 (56.8%) |
| 3.0x to 3.9x | 10 (4.1%) | 21 (9.6%) |
| 4.0x or more | 40 (16.3%) | 6 (2.7%) |
| Total | 246 (100.0%) | 220 (100.0%) |
Real Estate Taxes by Mortgage Status in Dexter
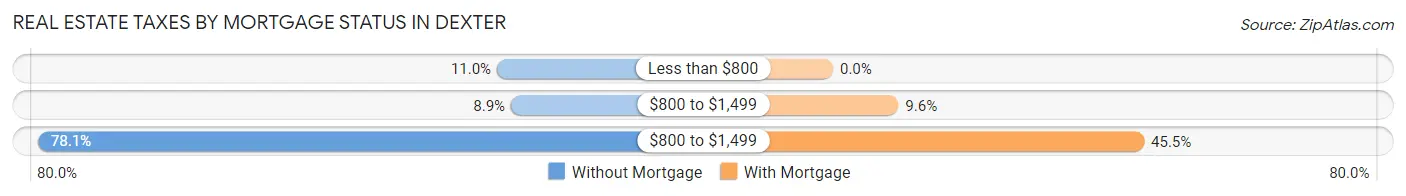
| Property Taxes | Without Mortgage | With Mortgage |
| Less than $800 | 27 (11.0%) | 0 (0.0%) |
| $800 to $1,499 | 22 (8.9%) | 21 (9.6%) |
| $800 to $1,499 | 192 (78.0%) | 100 (45.5%) |
| Total | 246 (100.0%) | 220 (100.0%) |
Health & Disability in Dexter
Health Insurance Coverage by Age in Dexter
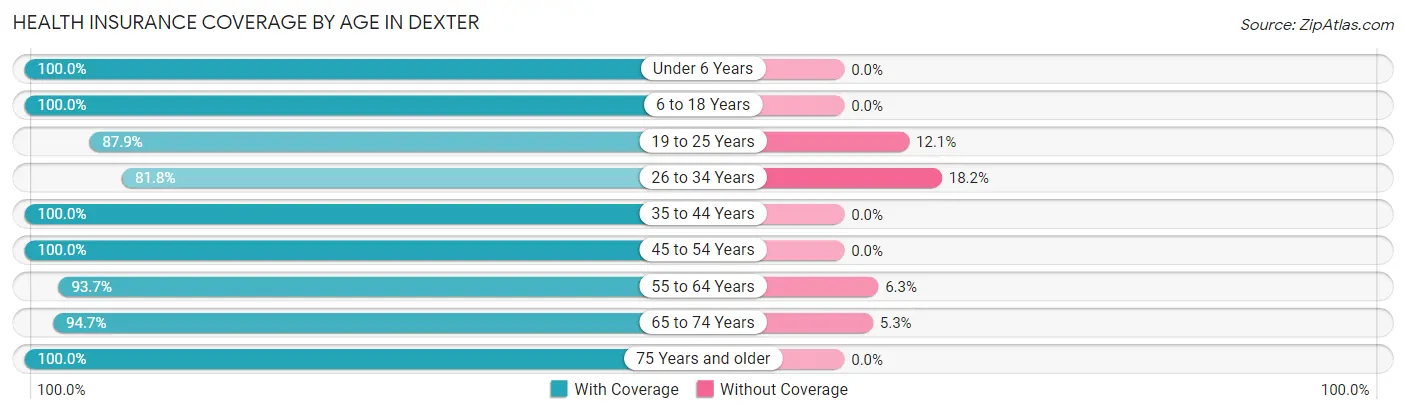
| Age Bracket | With Coverage | Without Coverage |
| Under 6 Years | 55 (100.0%) | 0 (0.0%) |
| 6 to 18 Years | 217 (100.0%) | 0 (0.0%) |
| 19 to 25 Years | 80 (87.9%) | 11 (12.1%) |
| 26 to 34 Years | 135 (81.8%) | 30 (18.2%) |
| 35 to 44 Years | 101 (100.0%) | 0 (0.0%) |
| 45 to 54 Years | 211 (100.0%) | 0 (0.0%) |
| 55 to 64 Years | 370 (93.7%) | 25 (6.3%) |
| 65 to 74 Years | 249 (94.7%) | 14 (5.3%) |
| 75 Years and older | 247 (100.0%) | 0 (0.0%) |
| Total | 1,665 (95.4%) | 80 (4.6%) |
Health Insurance Coverage by Citizenship Status in Dexter
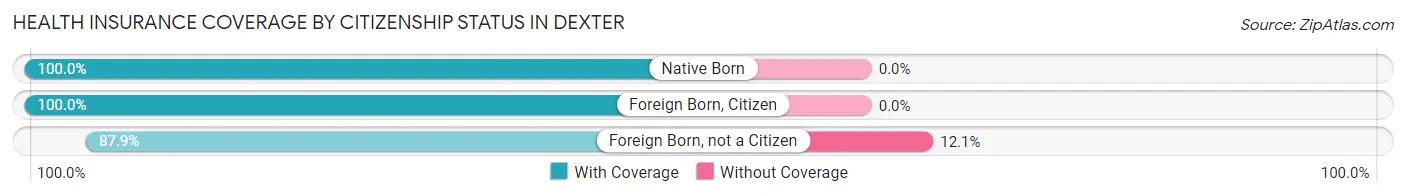
| Citizenship Status | With Coverage | Without Coverage |
| Native Born | 55 (100.0%) | 0 (0.0%) |
| Foreign Born, Citizen | 217 (100.0%) | 0 (0.0%) |
| Foreign Born, not a Citizen | 80 (87.9%) | 11 (12.1%) |
Health Insurance Coverage by Household Income in Dexter
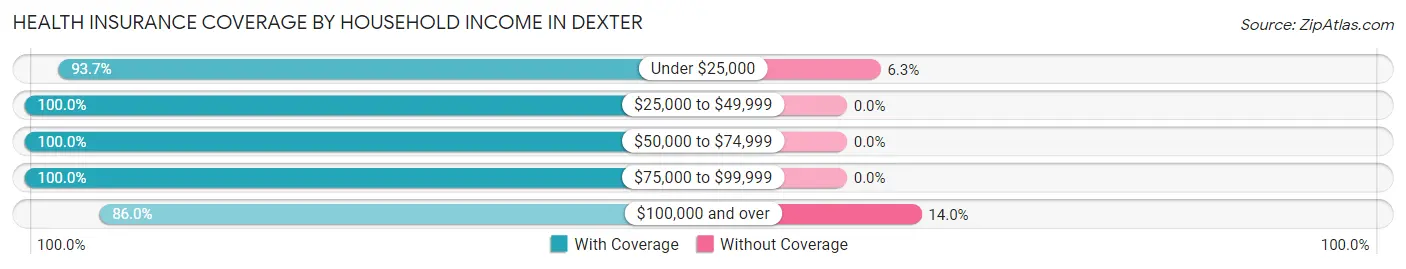
| Household Income | With Coverage | Without Coverage |
| Under $25,000 | 208 (93.7%) | 14 (6.3%) |
| $25,000 to $49,999 | 437 (100.0%) | 0 (0.0%) |
| $50,000 to $74,999 | 322 (100.0%) | 0 (0.0%) |
| $75,000 to $99,999 | 292 (100.0%) | 0 (0.0%) |
| $100,000 and over | 406 (86.0%) | 66 (14.0%) |
Public vs Private Health Insurance Coverage by Age in Dexter
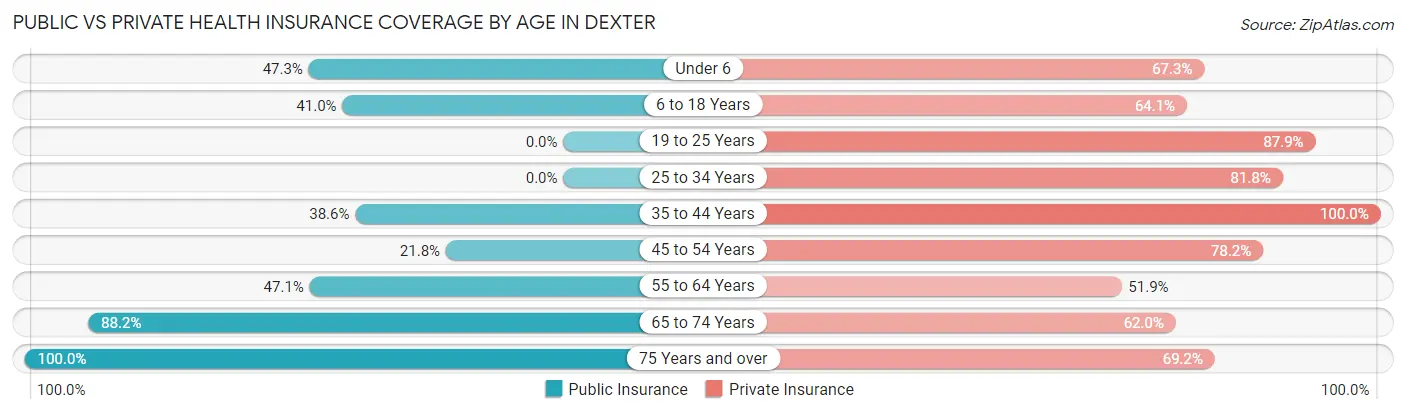
| Age Bracket | Public Insurance | Private Insurance |
| Under 6 | 26 (47.3%) | 37 (67.3%) |
| 6 to 18 Years | 89 (41.0%) | 139 (64.1%) |
| 19 to 25 Years | 0 (0.0%) | 80 (87.9%) |
| 25 to 34 Years | 0 (0.0%) | 135 (81.8%) |
| 35 to 44 Years | 39 (38.6%) | 101 (100.0%) |
| 45 to 54 Years | 46 (21.8%) | 165 (78.2%) |
| 55 to 64 Years | 186 (47.1%) | 205 (51.9%) |
| 65 to 74 Years | 232 (88.2%) | 163 (62.0%) |
| 75 Years and over | 247 (100.0%) | 171 (69.2%) |
| Total | 865 (49.6%) | 1,196 (68.5%) |
Disability Status by Sex by Age in Dexter
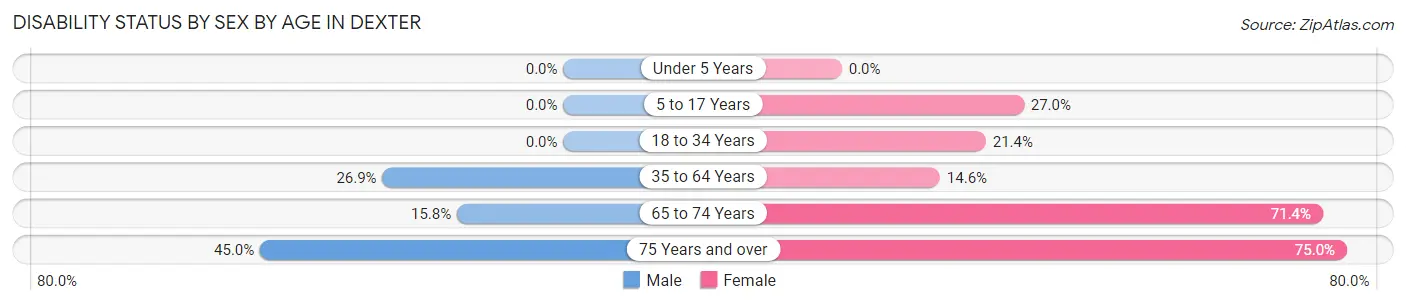
| Age Bracket | Male | Female |
| Under 5 Years | 0 (0.0%) | 0 (0.0%) |
| 5 to 17 Years | 0 (0.0%) | 30 (27.0%) |
| 18 to 34 Years | 0 (0.0%) | 34 (21.4%) |
| 35 to 64 Years | 94 (26.9%) | 52 (14.6%) |
| 65 to 74 Years | 15 (15.8%) | 120 (71.4%) |
| 75 Years and over | 68 (45.0%) | 72 (75.0%) |
Disability Class by Sex by Age in Dexter
Disability Class: Hearing Difficulty
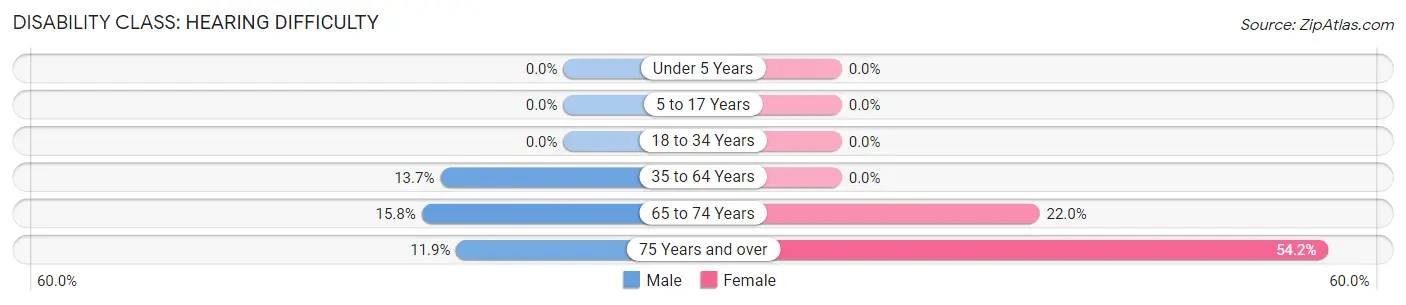
| Age Bracket | Male | Female |
| Under 5 Years | 0 (0.0%) | 0 (0.0%) |
| 5 to 17 Years | 0 (0.0%) | 0 (0.0%) |
| 18 to 34 Years | 0 (0.0%) | 0 (0.0%) |
| 35 to 64 Years | 48 (13.7%) | 0 (0.0%) |
| 65 to 74 Years | 15 (15.8%) | 37 (22.0%) |
| 75 Years and over | 18 (11.9%) | 52 (54.2%) |
Disability Class: Vision Difficulty
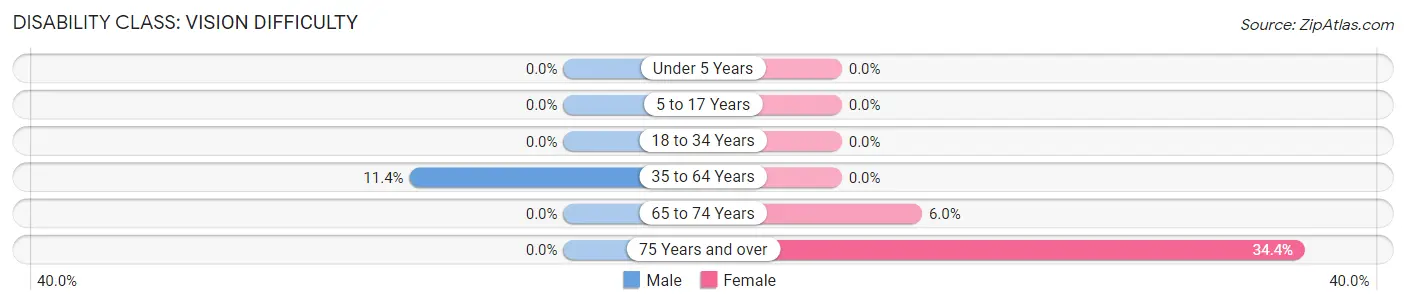
| Age Bracket | Male | Female |
| Under 5 Years | 0 (0.0%) | 0 (0.0%) |
| 5 to 17 Years | 0 (0.0%) | 0 (0.0%) |
| 18 to 34 Years | 0 (0.0%) | 0 (0.0%) |
| 35 to 64 Years | 40 (11.4%) | 0 (0.0%) |
| 65 to 74 Years | 0 (0.0%) | 10 (5.9%) |
| 75 Years and over | 0 (0.0%) | 33 (34.4%) |
Disability Class: Cognitive Difficulty
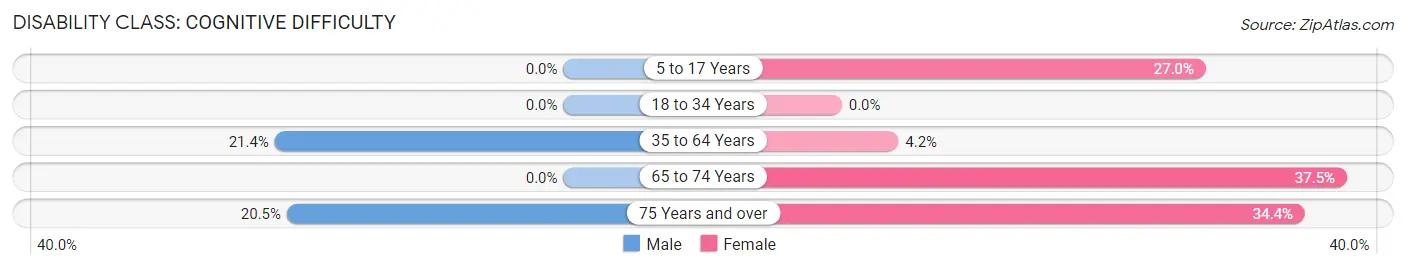
| Age Bracket | Male | Female |
| 5 to 17 Years | 0 (0.0%) | 30 (27.0%) |
| 18 to 34 Years | 0 (0.0%) | 0 (0.0%) |
| 35 to 64 Years | 75 (21.4%) | 15 (4.2%) |
| 65 to 74 Years | 0 (0.0%) | 63 (37.5%) |
| 75 Years and over | 31 (20.5%) | 33 (34.4%) |
Disability Class: Ambulatory Difficulty
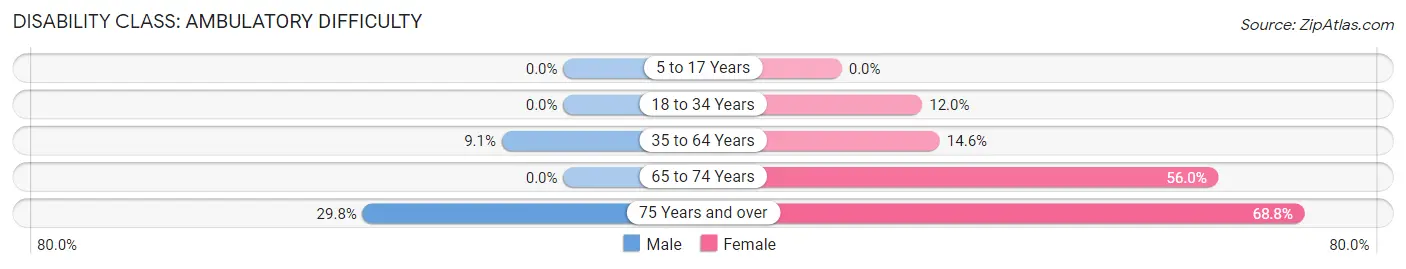
| Age Bracket | Male | Female |
| 5 to 17 Years | 0 (0.0%) | 0 (0.0%) |
| 18 to 34 Years | 0 (0.0%) | 19 (11.9%) |
| 35 to 64 Years | 32 (9.1%) | 52 (14.6%) |
| 65 to 74 Years | 0 (0.0%) | 94 (55.9%) |
| 75 Years and over | 45 (29.8%) | 66 (68.8%) |
Disability Class: Self-Care Difficulty
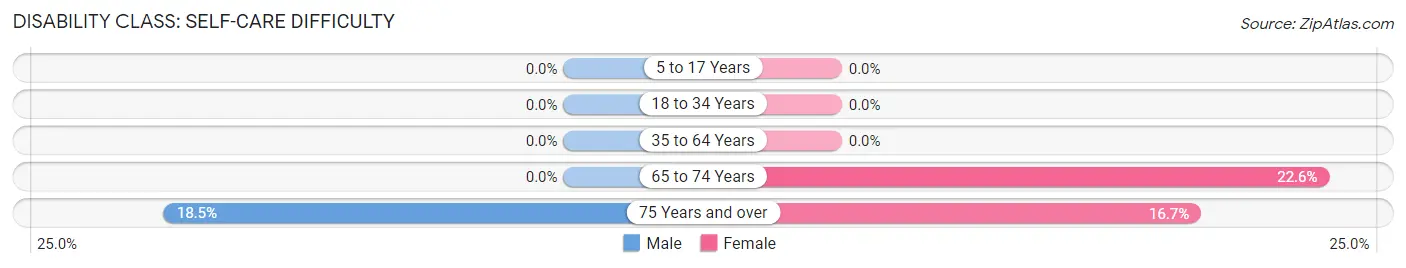
| Age Bracket | Male | Female |
| 5 to 17 Years | 0 (0.0%) | 0 (0.0%) |
| 18 to 34 Years | 0 (0.0%) | 0 (0.0%) |
| 35 to 64 Years | 0 (0.0%) | 0 (0.0%) |
| 65 to 74 Years | 0 (0.0%) | 38 (22.6%) |
| 75 Years and over | 28 (18.5%) | 16 (16.7%) |
Technology Access in Dexter
Computing Device Access in Dexter
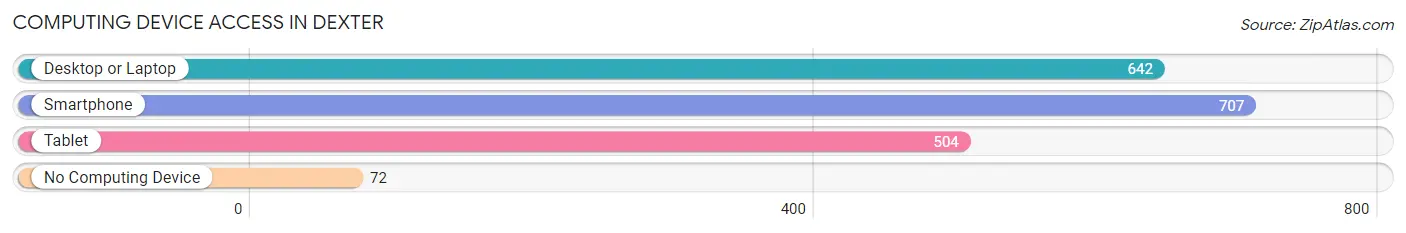
| Device Type | # Households | % Households |
| Desktop or Laptop | 642 | 71.7% |
| Smartphone | 707 | 78.9% |
| Tablet | 504 | 56.2% |
| No Computing Device | 72 | 8.0% |
| Total | 896 | 100.0% |
Internet Access in Dexter
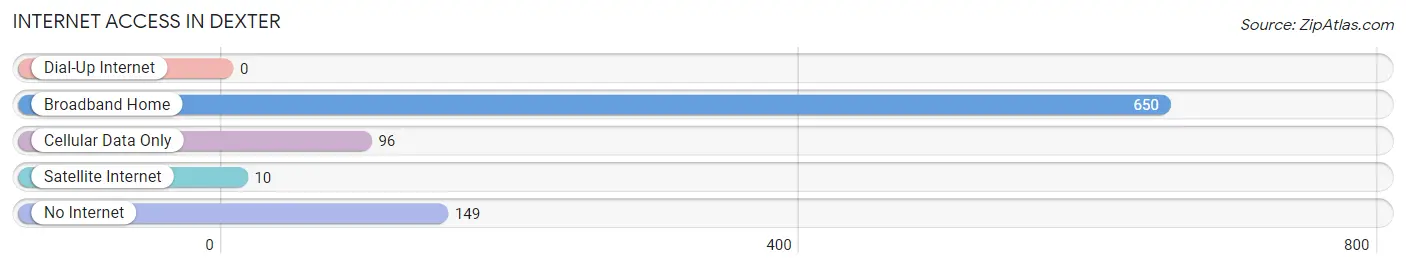
| Internet Type | # Households | % Households |
| Dial-Up Internet | 0 | 0.0% |
| Broadband Home | 650 | 72.5% |
| Cellular Data Only | 96 | 10.7% |
| Satellite Internet | 10 | 1.1% |
| No Internet | 149 | 16.6% |
| Total | 896 | 100.0% |
Dexter Summary
Dexter, Maine is a small town located in Penobscot County, in the state of Maine. It is situated on the banks of the Sebasticook River, and is home to a population of approximately 2,500 people.
History
The area that is now Dexter was first settled in 1794 by a group of settlers from Massachusetts. The town was incorporated in 1816, and was named after Samuel Dexter, a prominent politician from Massachusetts. The town was initially an agricultural community, with the main crops being potatoes, hay, and apples. In the late 19th century, Dexter began to develop into an industrial center, with the establishment of several mills and factories. The most notable of these was the Dexter Shoe Company, which was founded in 1887 and was one of the largest employers in the area.
Geography
Dexter is located in the northern part of Penobscot County, in the state of Maine. It is situated on the banks of the Sebasticook River, and is bordered by the towns of Garland, Corinna, and Exeter. The town has a total area of 24.2 square miles, of which 23.7 square miles is land and 0.5 square miles is water. The highest point in the town is located at the summit of Mount Pleasant, which has an elevation of 1,068 feet.
Economy
The economy of Dexter is largely based on agriculture and manufacturing. The town is home to several farms, which produce a variety of crops, including potatoes, hay, and apples. The Dexter Shoe Company is still a major employer in the area, and produces a variety of footwear. Other industries in the town include wood products, metal fabrication, and plastics.
Demographics
As of the 2010 census, there were 2,521 people, 1,039 households, and 690 families residing in the town. The population density was 106.2 people per square mile. The racial makeup of the town was 97.2% White, 0.4% African American, 0.3% Native American, 0.4% Asian, 0.1% Pacific Islander, 0.2% from other races, and 1.4% from two or more races. Hispanic or Latino of any race were 0.9% of the population.
The median income for a household in the town was $37,917, and the median income for a family was $45,938. The per capita income for the town was $19,945. About 11.2% of families and 14.2% of the population were below the poverty line, including 19.2% of those under age 18 and 8.2% of those age 65 or over.
Common Questions
What is Per Capita Income in Dexter?
Per Capita income in Dexter is $33,392.
What is the Median Family Income in Dexter?
Median Family Income in Dexter is $87,147.
What is the Median Household income in Dexter?
Median Household Income in Dexter is $56,280.
What is Income or Wage Gap in Dexter?
Income or Wage Gap in Dexter is 16.3%.
Women in Dexter earn 83.7 cents for every dollar earned by a man.
What is Family Income Deficit in Dexter?
Family Income Deficit in Dexter is $1,936.
Families that are below poverty line in Dexter earn $1,936 less on average than the poverty threshold level.
What is Inequality or Gini Index in Dexter?
Inequality or Gini Index in Dexter is 0.40.
What is the Total Population of Dexter?
Total Population of Dexter is 1,745.
What is the Total Male Population of Dexter?
Total Male Population of Dexter is 807.
What is the Total Female Population of Dexter?
Total Female Population of Dexter is 938.
What is the Ratio of Males per 100 Females in Dexter?
There are 86.03 Males per 100 Females in Dexter.
What is the Ratio of Females per 100 Males in Dexter?
There are 116.23 Females per 100 Males in Dexter.
What is the Median Population Age in Dexter?
Median Population Age in Dexter is 55.2 Years.
What is the Average Family Size in Dexter
Average Family Size in Dexter is 2.5 People.
What is the Average Household Size in Dexter
Average Household Size in Dexter is 1.9 People.
How Large is the Labor Force in Dexter?
There are 951 People in the Labor Forcein in Dexter.
What is the Percentage of People in the Labor Force in Dexter?
59.8% of People are in the Labor Force in Dexter.
What is the Unemployment Rate in Dexter?
Unemployment Rate in Dexter is 4.7%.