Oxford, ME Map & Demographics
Oxford Map
Oxford Overview
$36,286
PER CAPITA INCOME
$79,063
AVG FAMILY INCOME
$75,065
AVG HOUSEHOLD INCOME
52.6%
WAGE / INCOME GAP [ % ]
47.4¢/ $1
WAGE / INCOME GAP [ $ ]
0.47
INEQUALITY / GINI INDEX
1,100
TOTAL POPULATION
490
MALE POPULATION
610
FEMALE POPULATION
80.33
MALES / 100 FEMALES
124.49
FEMALES / 100 MALES
40.8
MEDIAN AGE
3.1
AVG FAMILY SIZE
2.4
AVG HOUSEHOLD SIZE
509
LABOR FORCE [ PEOPLE ]
58.8%
PERCENT IN LABOR FORCE
17.5%
UNEMPLOYMENT RATE
Oxford Zip Codes
Oxford Area Codes
Income in Oxford
Income Overview in Oxford
Per Capita Income in Oxford is $36,286, while median incomes of families and households are $79,063 and $75,065 respectively.
| Characteristic | Number | Measure |
| Per Capita Income | 1,100 | $36,286 |
| Median Family Income | 265 | $79,063 |
| Mean Family Income | 265 | $106,363 |
| Median Household Income | 461 | $75,065 |
| Mean Household Income | 461 | $87,951 |
| Income Deficit | 265 | $0 |
| Wage / Income Gap (%) | 1,100 | 52.60% |
| Wage / Income Gap ($) | 1,100 | 47.40¢ per $1 |
| Gini / Inequality Index | 1,100 | 0.47 |
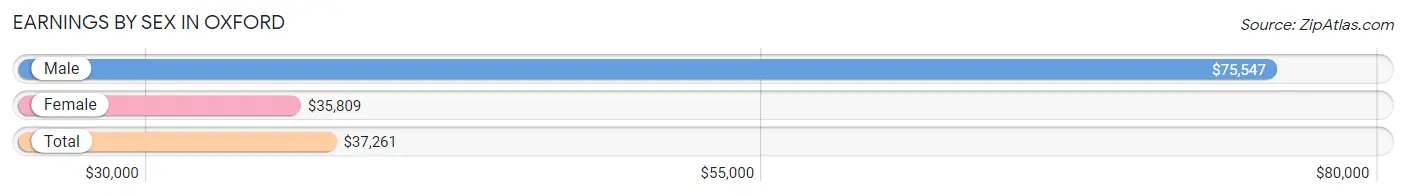
Earnings by Sex in Oxford
Average Earnings in Oxford are $37,261, $75,547 for men and $35,809 for women, a difference of 52.6%.
| Sex | Number | Average Earnings |
| Male | 185 (41.9%) | $75,547 |
| Female | 256 (58.1%) | $35,809 |
| Total | 441 (100.0%) | $37,261 |
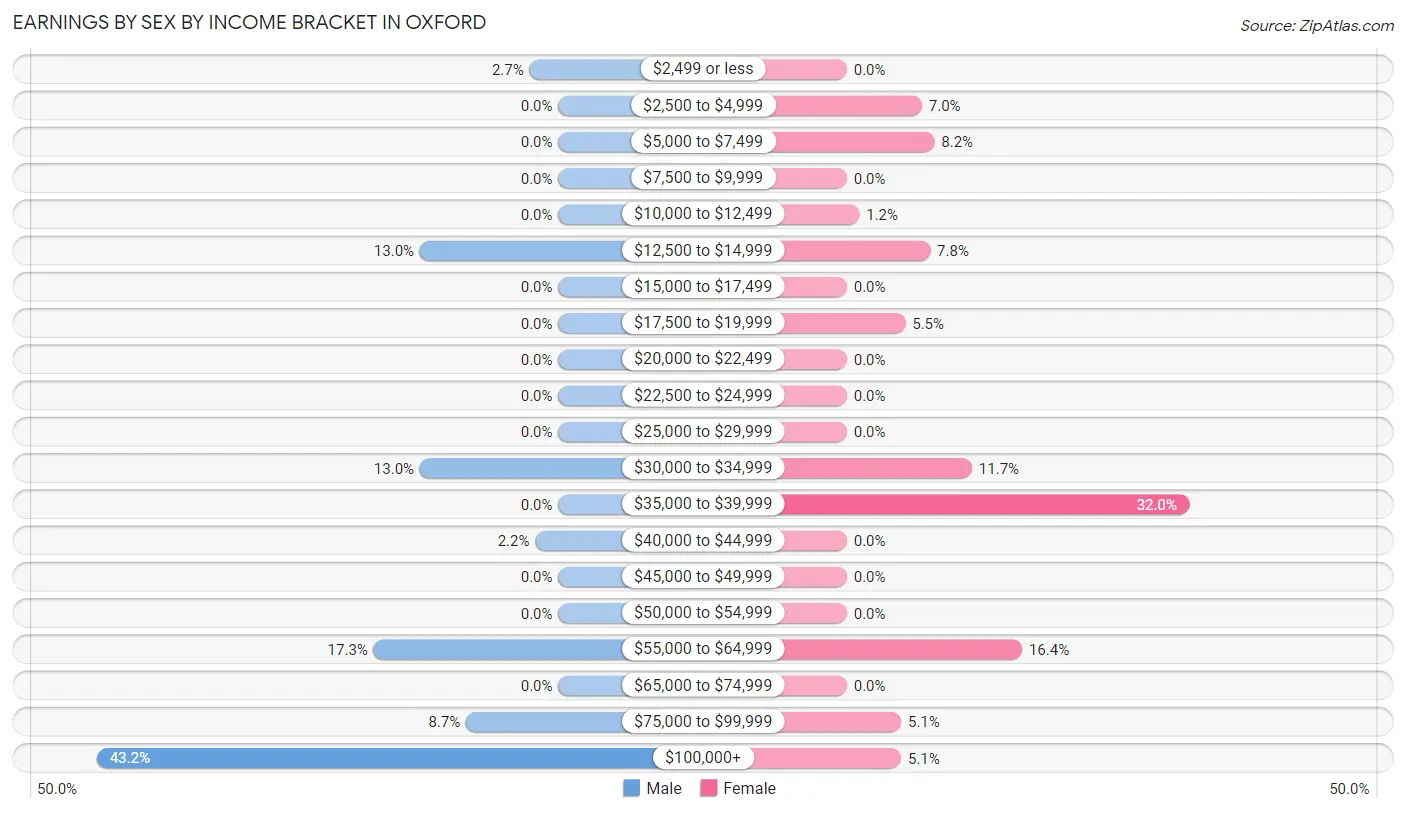
Earnings by Sex by Income Bracket in Oxford
The most common earnings brackets in Oxford are $100,000+ for men (80 | 43.2%) and $35,000 to $39,999 for women (82 | 32.0%).
| Income | Male | Female |
| $2,499 or less | 5 (2.7%) | 0 (0.0%) |
| $2,500 to $4,999 | 0 (0.0%) | 18 (7.0%) |
| $5,000 to $7,499 | 0 (0.0%) | 21 (8.2%) |
| $7,500 to $9,999 | 0 (0.0%) | 0 (0.0%) |
| $10,000 to $12,499 | 0 (0.0%) | 3 (1.2%) |
| $12,500 to $14,999 | 24 (13.0%) | 20 (7.8%) |
| $15,000 to $17,499 | 0 (0.0%) | 0 (0.0%) |
| $17,500 to $19,999 | 0 (0.0%) | 14 (5.5%) |
| $20,000 to $22,499 | 0 (0.0%) | 0 (0.0%) |
| $22,500 to $24,999 | 0 (0.0%) | 0 (0.0%) |
| $25,000 to $29,999 | 0 (0.0%) | 0 (0.0%) |
| $30,000 to $34,999 | 24 (13.0%) | 30 (11.7%) |
| $35,000 to $39,999 | 0 (0.0%) | 82 (32.0%) |
| $40,000 to $44,999 | 4 (2.2%) | 0 (0.0%) |
| $45,000 to $49,999 | 0 (0.0%) | 0 (0.0%) |
| $50,000 to $54,999 | 0 (0.0%) | 0 (0.0%) |
| $55,000 to $64,999 | 32 (17.3%) | 42 (16.4%) |
| $65,000 to $74,999 | 0 (0.0%) | 0 (0.0%) |
| $75,000 to $99,999 | 16 (8.6%) | 13 (5.1%) |
| $100,000+ | 80 (43.2%) | 13 (5.1%) |
| Total | 185 (100.0%) | 256 (100.0%) |
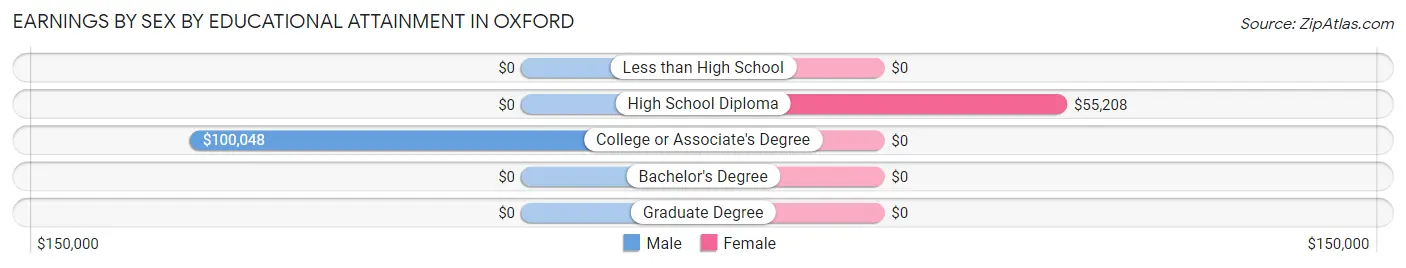
Earnings by Sex by Educational Attainment in Oxford
| Educational Attainment | Male Income | Female Income |
| Less than High School | - | - |
| High School Diploma | - | - |
| College or Associate's Degree | $100,048 | $0 |
| Bachelor's Degree | - | - |
| Graduate Degree | - | - |
| Total | - | - |
Family Income in Oxford
Family Income Brackets in Oxford
According to the Oxford family income data, there are 57 families falling into the $200,000+ income range, which is the most common income bracket and makes up 21.5% of all families.
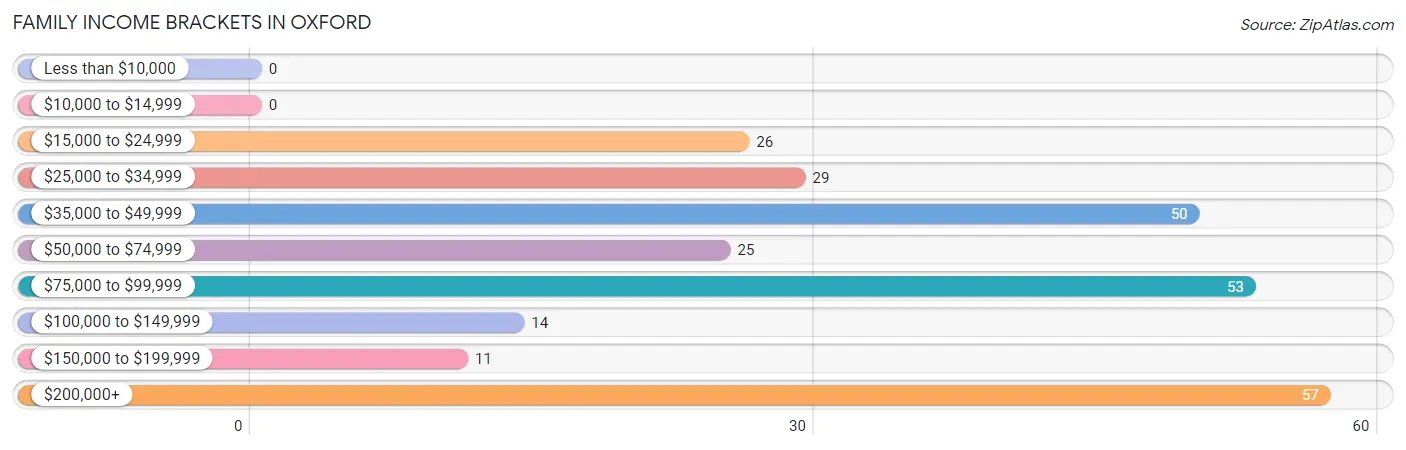
| Income Bracket | # Families | % Families |
| Less than $10,000 | 0 | 0.0% |
| $10,000 to $14,999 | 0 | 0.0% |
| $15,000 to $24,999 | 26 | 9.8% |
| $25,000 to $34,999 | 29 | 10.9% |
| $35,000 to $49,999 | 50 | 18.9% |
| $50,000 to $74,999 | 25 | 9.4% |
| $75,000 to $99,999 | 53 | 20.0% |
| $100,000 to $149,999 | 14 | 5.3% |
| $150,000 to $199,999 | 11 | 4.2% |
| $200,000+ | 57 | 21.5% |
Family Income by Famaliy Size in Oxford
4-person families (56 | 21.1%) account for the highest median family income in Oxford with $250,001 per family, while 4-person families (56 | 21.1%) have the highest median income of $62,500 per family member.
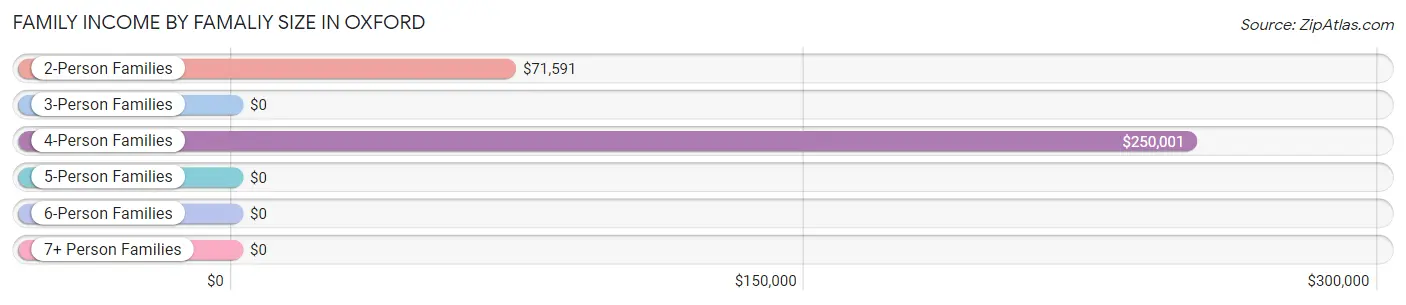
| Income Bracket | # Families | Median Income |
| 2-Person Families | 114 (43.0%) | $71,591 |
| 3-Person Families | 59 (22.3%) | $0 |
| 4-Person Families | 56 (21.1%) | $250,001 |
| 5-Person Families | 0 (0.0%) | $0 |
| 6-Person Families | 0 (0.0%) | $0 |
| 7+ Person Families | 36 (13.6%) | $0 |
| Total | 265 (100.0%) | $79,063 |
Family Income by Number of Earners in Oxford
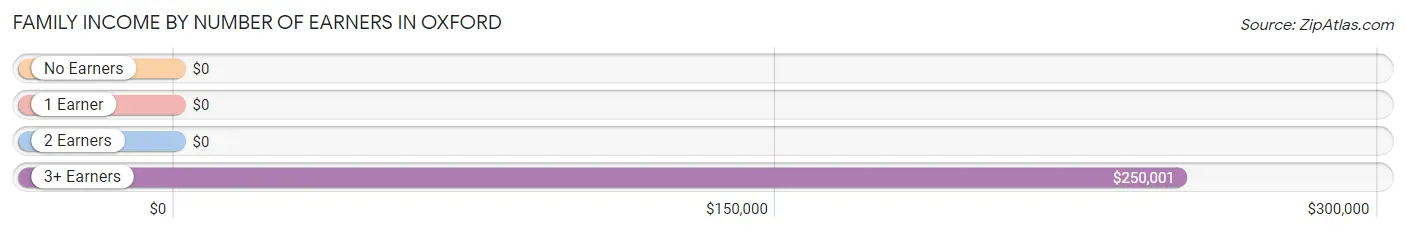
| Number of Earners | # Families | Median Income |
| No Earners | 86 (32.5%) | $0 |
| 1 Earner | 85 (32.1%) | $0 |
| 2 Earners | 35 (13.2%) | $0 |
| 3+ Earners | 59 (22.3%) | $250,001 |
| Total | 265 (100.0%) | $79,063 |
Household Income in Oxford
Household Income Brackets in Oxford
With 111 households falling in the category, the $75,000 to $99,999 income range is the most frequent in Oxford, accounting for 24.1% of all households.
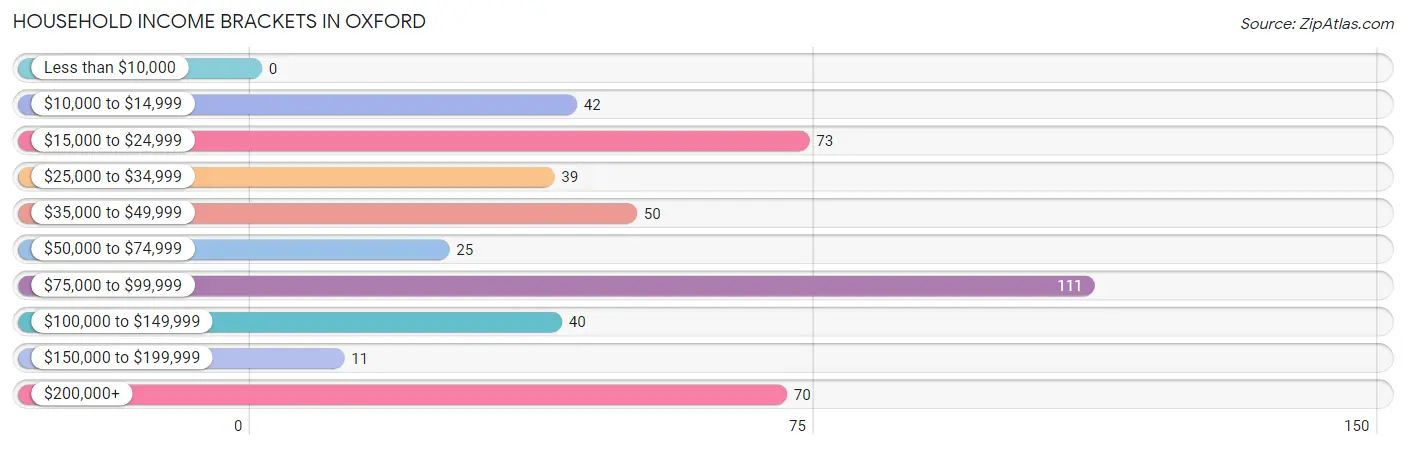
| Income Bracket | # Households | % Households |
| Less than $10,000 | 0 | 0.0% |
| $10,000 to $14,999 | 42 | 9.1% |
| $15,000 to $24,999 | 73 | 15.8% |
| $25,000 to $34,999 | 39 | 8.5% |
| $35,000 to $49,999 | 50 | 10.8% |
| $50,000 to $74,999 | 25 | 5.4% |
| $75,000 to $99,999 | 111 | 24.1% |
| $100,000 to $149,999 | 40 | 8.7% |
| $150,000 to $199,999 | 11 | 2.4% |
| $200,000+ | 70 | 15.2% |
Household Income by Householder Age in Oxford
The median household income in Oxford is $75,065, with the highest median household income of $93,274 found in the 45 to 64 years age bracket for the primary householder. A total of 165 households (35.8%) fall into this category.
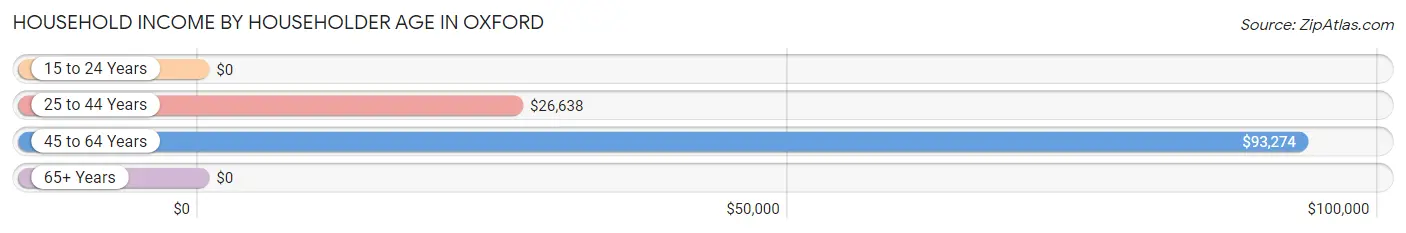
| Income Bracket | # Households | Median Income |
| 15 to 24 Years | 0 (0.0%) | $0 |
| 25 to 44 Years | 174 (37.7%) | $26,638 |
| 45 to 64 Years | 165 (35.8%) | $93,274 |
| 65+ Years | 122 (26.5%) | $0 |
| Total | 461 (100.0%) | $75,065 |
Poverty in Oxford
Income Below Poverty by Sex and Age in Oxford
With 21.0% poverty level for males and 38.0% for females among the residents of Oxford, 5 year old males and 6 to 11 year old females are the most vulnerable to poverty, with 35 males (100.0%) and 63 females (100.0%) in their respective age groups living below the poverty level.
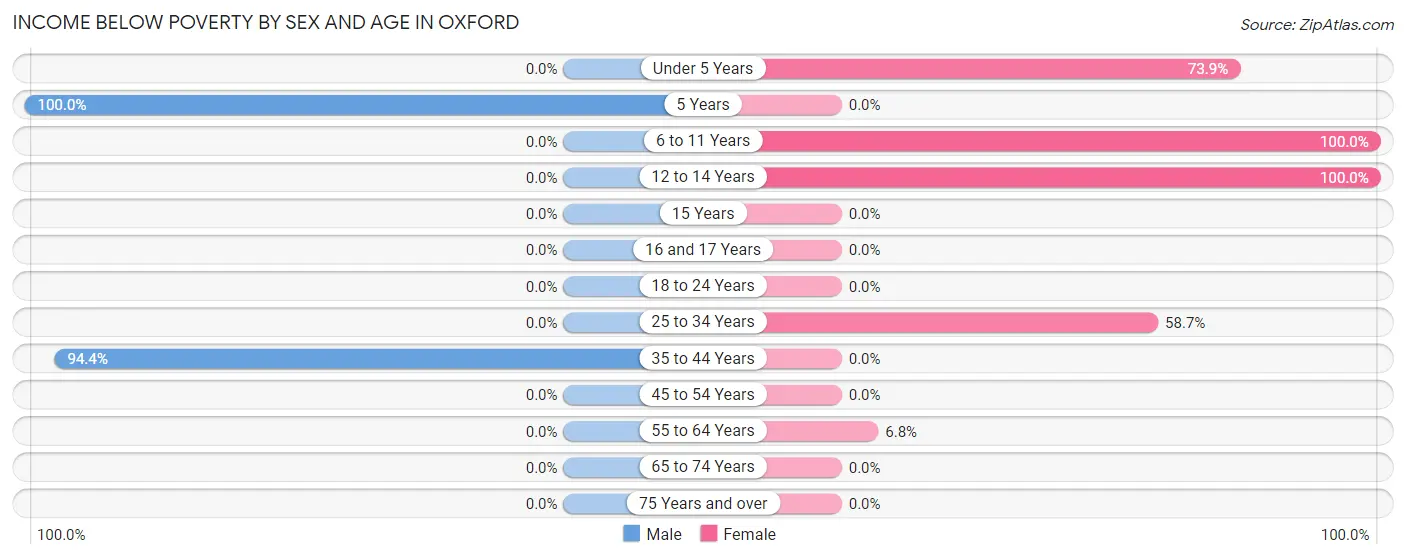
| Age Bracket | Male | Female |
| Under 5 Years | 0 (0.0%) | 34 (73.9%) |
| 5 Years | 35 (100.0%) | 0 (0.0%) |
| 6 to 11 Years | 0 (0.0%) | 63 (100.0%) |
| 12 to 14 Years | 0 (0.0%) | 63 (100.0%) |
| 15 Years | 0 (0.0%) | 0 (0.0%) |
| 16 and 17 Years | 0 (0.0%) | 0 (0.0%) |
| 18 to 24 Years | 0 (0.0%) | 0 (0.0%) |
| 25 to 34 Years | 0 (0.0%) | 64 (58.7%) |
| 35 to 44 Years | 68 (94.4%) | 0 (0.0%) |
| 45 to 54 Years | 0 (0.0%) | 0 (0.0%) |
| 55 to 64 Years | 0 (0.0%) | 8 (6.8%) |
| 65 to 74 Years | 0 (0.0%) | 0 (0.0%) |
| 75 Years and over | 0 (0.0%) | 0 (0.0%) |
| Total | 103 (21.0%) | 232 (38.0%) |
Income Above Poverty by Sex and Age in Oxford
According to the poverty statistics in Oxford, males aged under 5 years and females aged 18 to 24 years are the age groups that are most secure financially, with 100.0% of males and 100.0% of females in these age groups living above the poverty line.
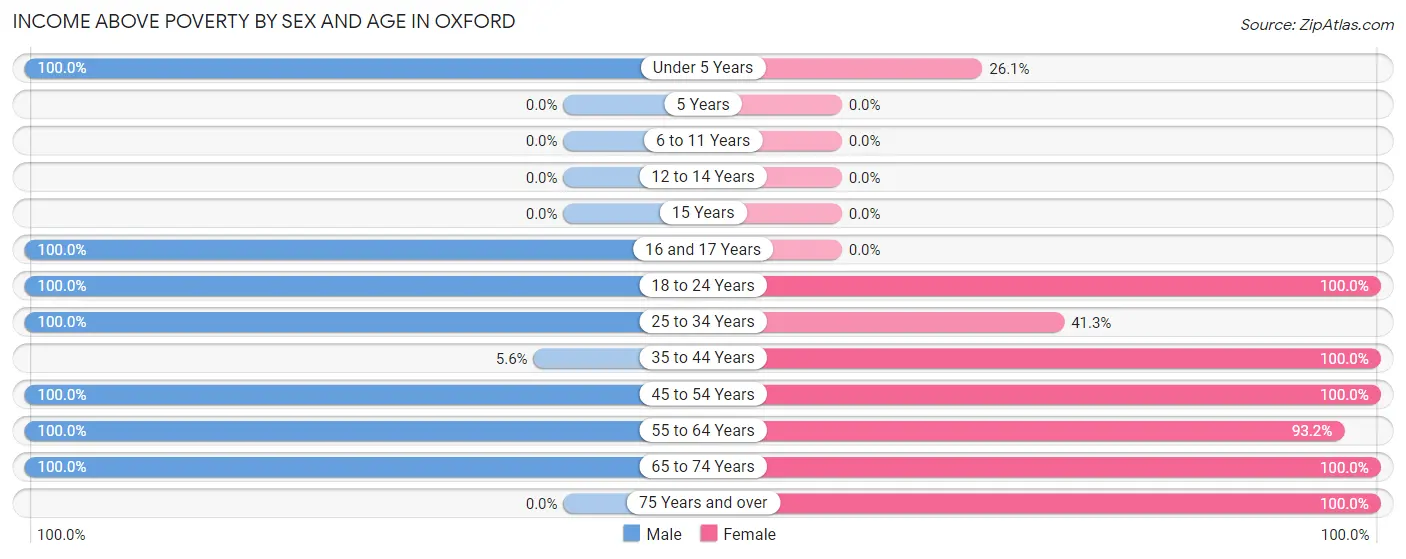
| Age Bracket | Male | Female |
| Under 5 Years | 27 (100.0%) | 12 (26.1%) |
| 5 Years | 0 (0.0%) | 0 (0.0%) |
| 6 to 11 Years | 0 (0.0%) | 0 (0.0%) |
| 12 to 14 Years | 0 (0.0%) | 0 (0.0%) |
| 15 Years | 0 (0.0%) | 0 (0.0%) |
| 16 and 17 Years | 24 (100.0%) | 0 (0.0%) |
| 18 to 24 Years | 69 (100.0%) | 25 (100.0%) |
| 25 to 34 Years | 37 (100.0%) | 45 (41.3%) |
| 35 to 44 Years | 4 (5.6%) | 38 (100.0%) |
| 45 to 54 Years | 90 (100.0%) | 28 (100.0%) |
| 55 to 64 Years | 81 (100.0%) | 110 (93.2%) |
| 65 to 74 Years | 55 (100.0%) | 95 (100.0%) |
| 75 Years and over | 0 (0.0%) | 25 (100.0%) |
| Total | 387 (79.0%) | 378 (62.0%) |
Income Below Poverty Among Married-Couple Families in Oxford
The poverty statistics for married-couple families in Oxford show that 11.4% or 26 of the total 229 families live below the poverty line. Families with no children have the highest poverty rate of 13.8%, comprising of 26 families. On the other hand, families with 1 or 2 children have the lowest poverty rate of 0.0%, which includes 0 families.
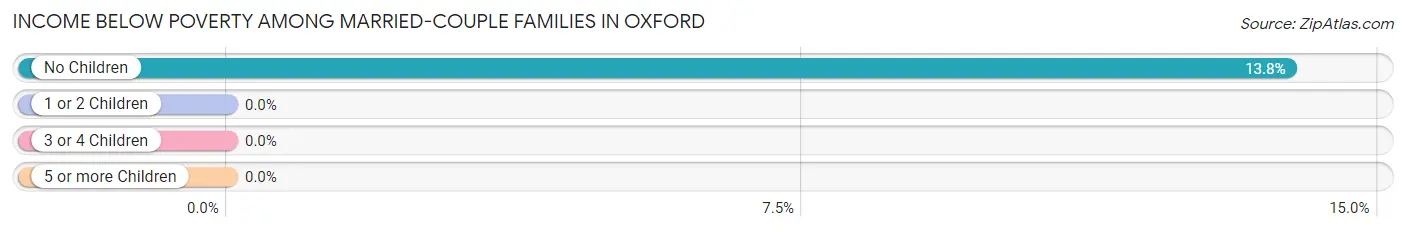
| Children | Above Poverty | Below Poverty |
| No Children | 162 (86.2%) | 26 (13.8%) |
| 1 or 2 Children | 41 (100.0%) | 0 (0.0%) |
| 3 or 4 Children | 0 (0.0%) | 0 (0.0%) |
| 5 or more Children | 0 (0.0%) | 0 (0.0%) |
| Total | 203 (88.6%) | 26 (11.4%) |
Income Below Poverty Among Single-Parent Households in Oxford
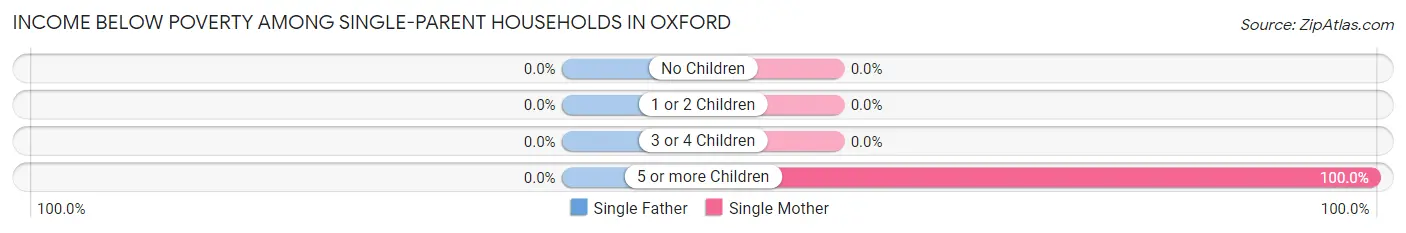
| Children | Single Father | Single Mother |
| No Children | 0 (0.0%) | 0 (0.0%) |
| 1 or 2 Children | 0 (0.0%) | 0 (0.0%) |
| 3 or 4 Children | 0 (0.0%) | 0 (0.0%) |
| 5 or more Children | 0 (0.0%) | 36 (100.0%) |
| Total | 0 (0.0%) | 36 (100.0%) |
Income Below Poverty Among Married-Couple vs Single-Parent Households in Oxford
The poverty data for Oxford shows that 26 of the married-couple family households (11.4%) and 36 of the single-parent households (100.0%) are living below the poverty level. Within the married-couple family households, those with no children have the highest poverty rate, with 26 households (13.8%) falling below the poverty line. Among the single-parent households, those with 5 or more children have the highest poverty rate, with 36 household (100.0%) living below poverty.
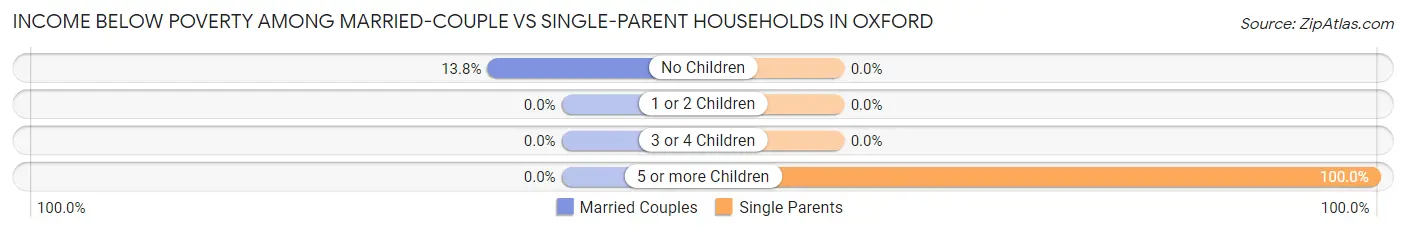
| Children | Married-Couple Families | Single-Parent Households |
| No Children | 26 (13.8%) | 0 (0.0%) |
| 1 or 2 Children | 0 (0.0%) | 0 (0.0%) |
| 3 or 4 Children | 0 (0.0%) | 0 (0.0%) |
| 5 or more Children | 0 (0.0%) | 36 (100.0%) |
| Total | 26 (11.4%) | 36 (100.0%) |
Race in Oxford
The most populous races in Oxford are White / Caucasian (1,056 | 96.0%), Two or more Races (28 | 2.5%), and Native / Alaskan (16 | 1.5%).
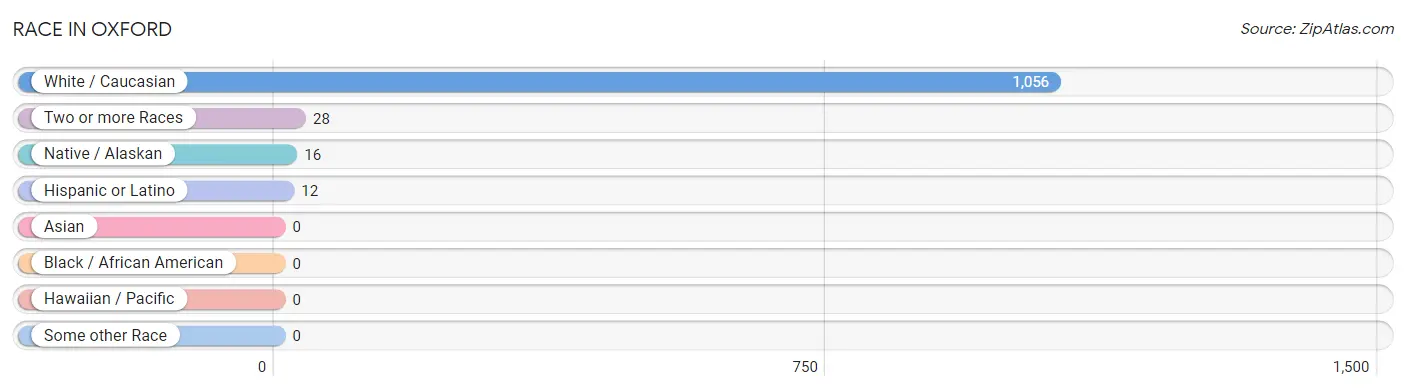
| Race | # Population | % Population |
| Asian | 0 | 0.0% |
| Black / African American | 0 | 0.0% |
| Hawaiian / Pacific | 0 | 0.0% |
| Hispanic or Latino | 12 | 1.1% |
| Native / Alaskan | 16 | 1.5% |
| White / Caucasian | 1,056 | 96.0% |
| Two or more Races | 28 | 2.5% |
| Some other Race | 0 | 0.0% |
| Total | 1,100 | 100.0% |
Ancestry in Oxford
The most populous ancestries reported in Oxford are Irish (199 | 18.1%), English (184 | 16.7%), Polish (121 | 11.0%), German (117 | 10.6%), and French Canadian (83 | 7.5%), together accounting for 64.0% of all Oxford residents.
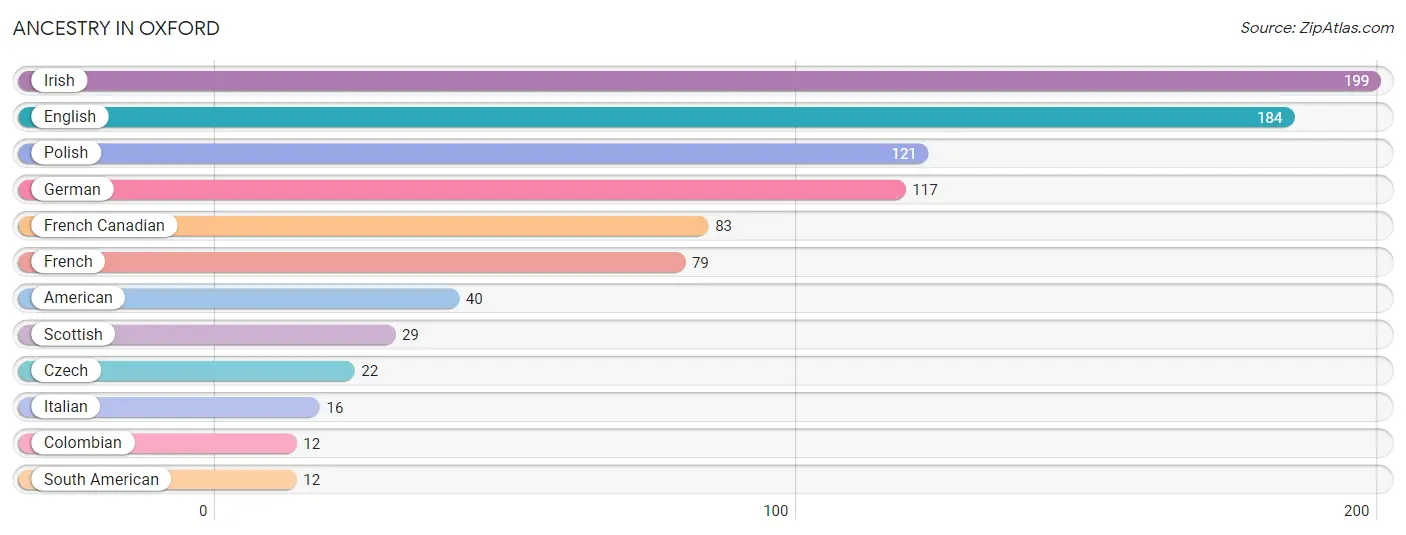
| Ancestry | # Population | % Population |
| American | 40 | 3.6% |
| Colombian | 12 | 1.1% |
| Czech | 22 | 2.0% |
| English | 184 | 16.7% |
| French | 79 | 7.2% |
| French Canadian | 83 | 7.5% |
| German | 117 | 10.6% |
| Irish | 199 | 18.1% |
| Italian | 16 | 1.5% |
| Polish | 121 | 11.0% |
| Scottish | 29 | 2.6% |
| South American | 12 | 1.1% | View All 12 Rows |
Immigrants in Oxford

| Immigration Origin | # Population | % Population | View All 0 Rows |
Sex and Age in Oxford
Sex and Age in Oxford
The most populous age groups in Oxford are 45 to 49 Years (74 | 15.1%) for men and 30 to 34 Years (109 | 17.9%) for women.
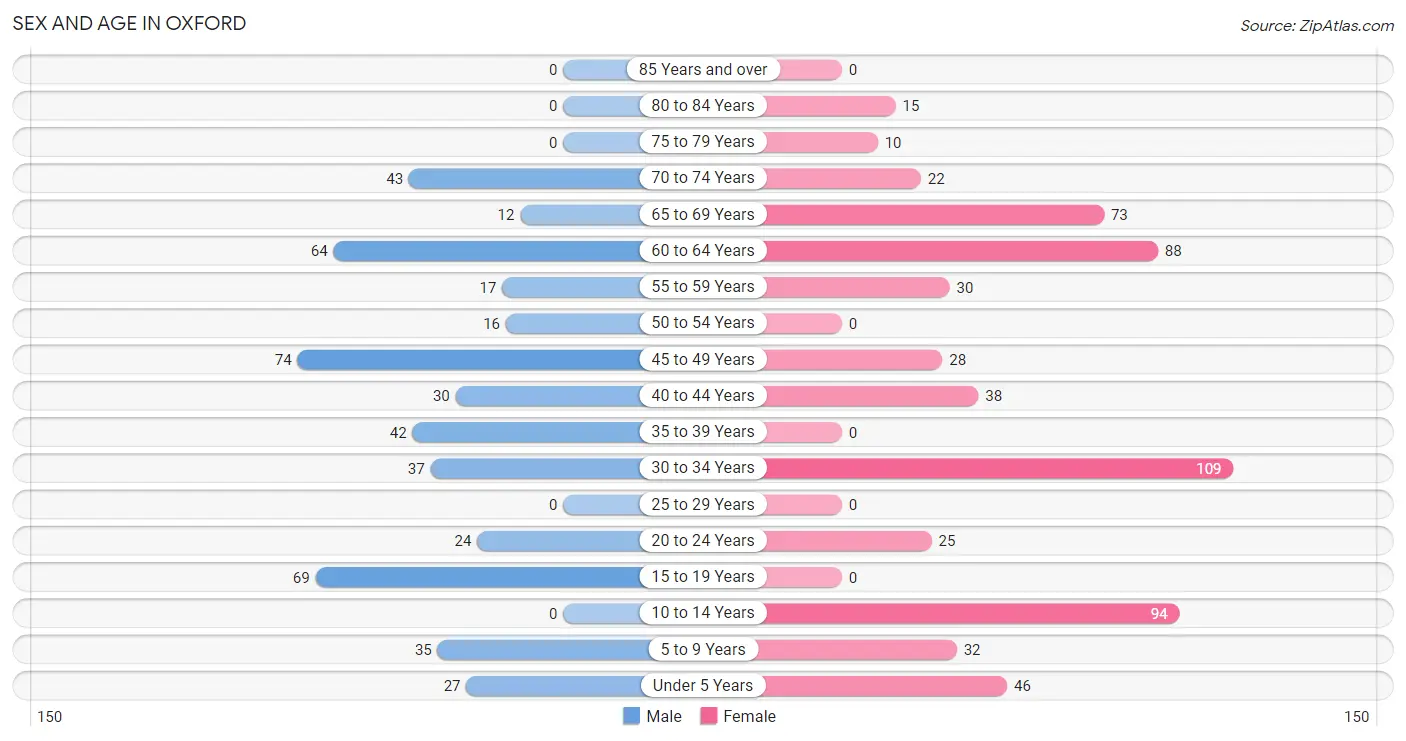
| Age Bracket | Male | Female |
| Under 5 Years | 27 (5.5%) | 46 (7.5%) |
| 5 to 9 Years | 35 (7.1%) | 32 (5.2%) |
| 10 to 14 Years | 0 (0.0%) | 94 (15.4%) |
| 15 to 19 Years | 69 (14.1%) | 0 (0.0%) |
| 20 to 24 Years | 24 (4.9%) | 25 (4.1%) |
| 25 to 29 Years | 0 (0.0%) | 0 (0.0%) |
| 30 to 34 Years | 37 (7.5%) | 109 (17.9%) |
| 35 to 39 Years | 42 (8.6%) | 0 (0.0%) |
| 40 to 44 Years | 30 (6.1%) | 38 (6.2%) |
| 45 to 49 Years | 74 (15.1%) | 28 (4.6%) |
| 50 to 54 Years | 16 (3.3%) | 0 (0.0%) |
| 55 to 59 Years | 17 (3.5%) | 30 (4.9%) |
| 60 to 64 Years | 64 (13.1%) | 88 (14.4%) |
| 65 to 69 Years | 12 (2.5%) | 73 (12.0%) |
| 70 to 74 Years | 43 (8.8%) | 22 (3.6%) |
| 75 to 79 Years | 0 (0.0%) | 10 (1.6%) |
| 80 to 84 Years | 0 (0.0%) | 15 (2.5%) |
| 85 Years and over | 0 (0.0%) | 0 (0.0%) |
| Total | 490 (100.0%) | 610 (100.0%) |
Families and Households in Oxford
Median Family Size in Oxford
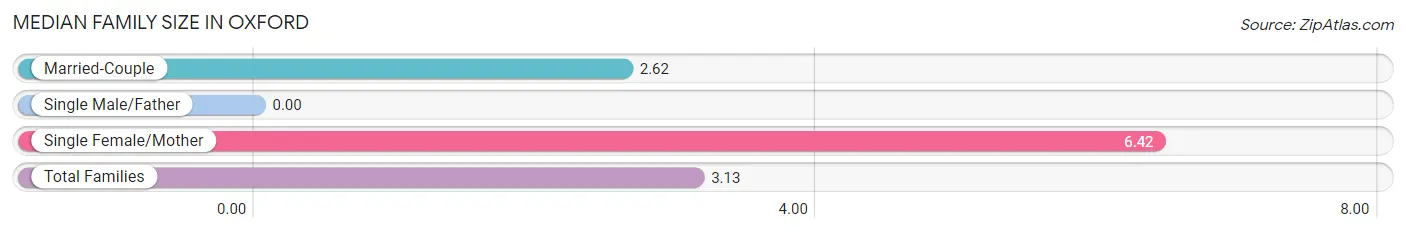
| Family Type | # Families | Family Size |
| Married-Couple | 229 (86.4%) | 2.62 |
| Single Male/Father | 0 (0.0%) | - |
| Single Female/Mother | 36 (13.6%) | 6.42 |
| Total Families | 265 (100.0%) | 3.13 |
Median Household Size in Oxford
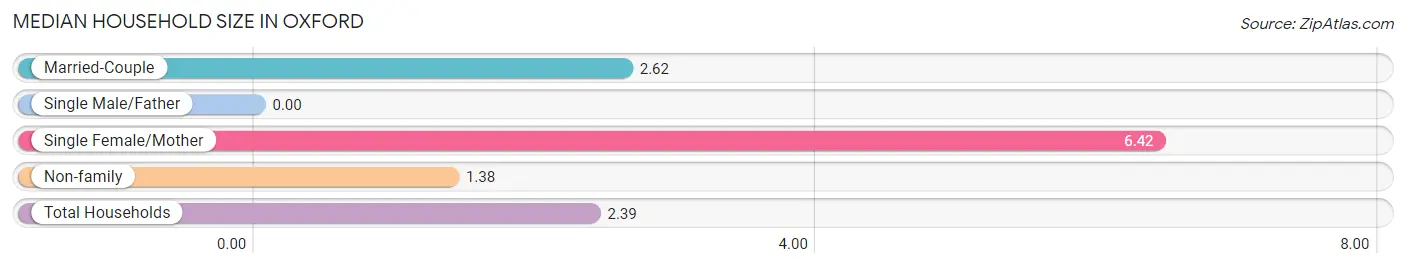
| Household Type | # Households | Household Size |
| Married-Couple | 229 (49.7%) | 2.62 |
| Single Male/Father | 0 (0.0%) | - |
| Single Female/Mother | 36 (7.8%) | 6.42 |
| Non-family | 196 (42.5%) | 1.38 |
| Total Households | 461 (100.0%) | 2.39 |
Household Size by Marriage Status in Oxford
Out of a total of 461 households in Oxford, 265 (57.5%) are family households, while 196 (42.5%) are nonfamily households. The most numerous type of family households are 2-person households, comprising 114, and the most common type of nonfamily households are 1-person households, comprising 127.
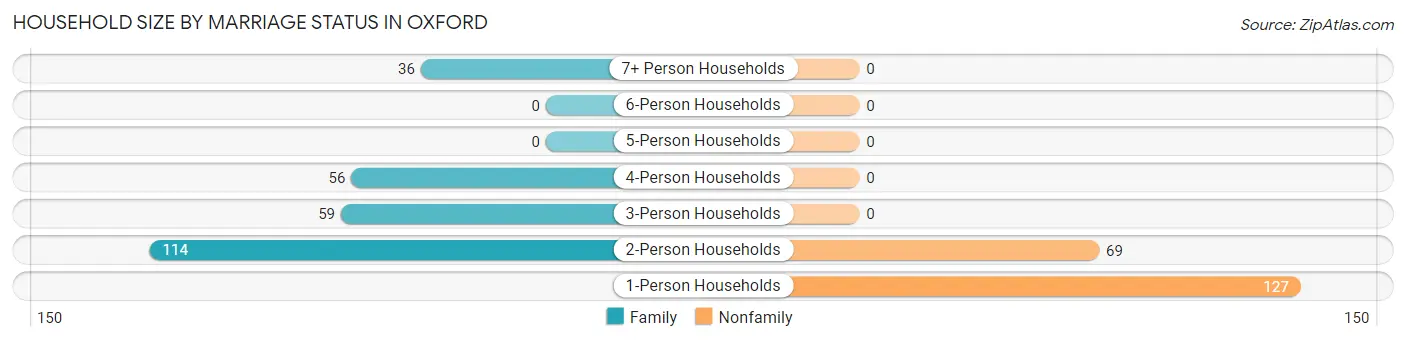
| Household Size | Family Households | Nonfamily Households |
| 1-Person Households | - | 127 (27.6%) |
| 2-Person Households | 114 (24.7%) | 69 (15.0%) |
| 3-Person Households | 59 (12.8%) | 0 (0.0%) |
| 4-Person Households | 56 (12.1%) | 0 (0.0%) |
| 5-Person Households | 0 (0.0%) | 0 (0.0%) |
| 6-Person Households | 0 (0.0%) | 0 (0.0%) |
| 7+ Person Households | 36 (7.8%) | 0 (0.0%) |
| Total | 265 (57.5%) | 196 (42.5%) |
Female Fertility in Oxford
Fertility by Age in Oxford
| Age Bracket | Women with Births | Births / 1,000 Women |
| 15 to 19 years | 0 (0.0%) | 0.0 |
| 20 to 34 years | 0 (0.0%) | 0.0 |
| 35 to 50 years | 0 (0.0%) | 0.0 |
| Total | 0 (0.0%) | 0.0 |
Fertility by Age by Marriage Status in Oxford
| Age Bracket | Married | Unmarried |
| 15 to 19 years | 0 (0.0%) | 0 (0.0%) |
| 20 to 34 years | 0 (0.0%) | 0 (0.0%) |
| 35 to 50 years | 0 (0.0%) | 0 (0.0%) |
| Total | 0 (0.0%) | 0 (0.0%) |
Fertility by Education in Oxford
| Educational Attainment | Women with Births | Births / 1,000 Women |
| Less than High School | 0 (0.0%) | 0.0 |
| High School Diploma | 0 (0.0%) | 0.0 |
| College or Associate's Degree | 0 (0.0%) | 0.0 |
| Bachelor's Degree | 0 (0.0%) | 0.0 |
| Graduate Degree | 0 (0.0%) | 0.0 |
| Total | 0 (0.0%) | 0.0 |
Fertility by Education by Marriage Status in Oxford
| Educational Attainment | Married | Unmarried |
| Less than High School | 0 (0.0%) | 0 (0.0%) |
| High School Diploma | 0 (0.0%) | 0 (0.0%) |
| College or Associate's Degree | 0 (0.0%) | 0 (0.0%) |
| Bachelor's Degree | 0 (0.0%) | 0 (0.0%) |
| Graduate Degree | 0 (0.0%) | 0 (0.0%) |
| Total | 0 (0.0%) | 0 (0.0%) |
Employment Characteristics in Oxford
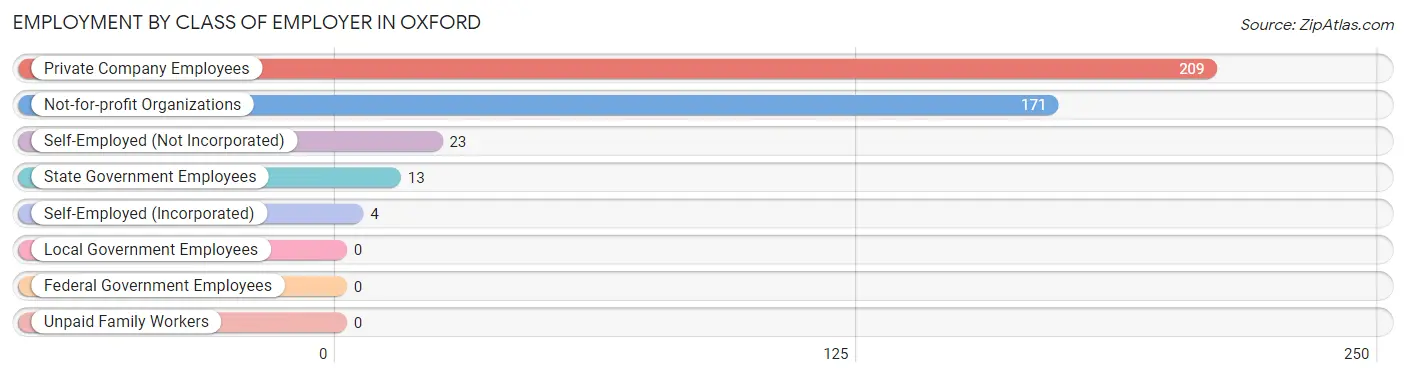
Employment by Class of Employer in Oxford
Among the 420 employed individuals in Oxford, private company employees (209 | 49.8%), not-for-profit organizations (171 | 40.7%), and self-employed (not incorporated) (23 | 5.5%) make up the most common classes of employment.
| Employer Class | # Employees | % Employees |
| Private Company Employees | 209 | 49.8% |
| Self-Employed (Incorporated) | 4 | 0.9% |
| Self-Employed (Not Incorporated) | 23 | 5.5% |
| Not-for-profit Organizations | 171 | 40.7% |
| Local Government Employees | 0 | 0.0% |
| State Government Employees | 13 | 3.1% |
| Federal Government Employees | 0 | 0.0% |
| Unpaid Family Workers | 0 | 0.0% |
| Total | 420 | 100.0% |
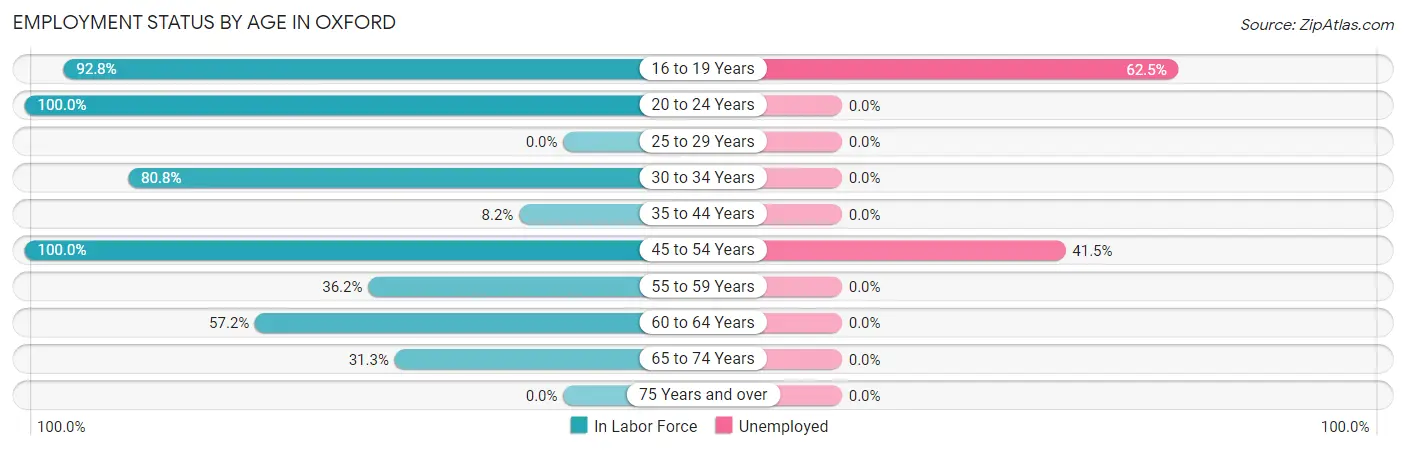
Employment Status by Age in Oxford
According to the labor force statistics for Oxford, out of the total population over 16 years of age (866), 58.8% or 509 individuals are in the labor force, with 17.5% or 89 of them unemployed. The age group with the highest labor force participation rate is 20 to 24 years, with 100.0% or 49 individuals in the labor force. Within the labor force, the 16 to 19 years age range has the highest percentage of unemployed individuals, with 62.5% or 40 of them being unemployed.
| Age Bracket | In Labor Force | Unemployed |
| 16 to 19 Years | 64 (92.8%) | 40 (62.5%) |
| 20 to 24 Years | 49 (100.0%) | 0 (0.0%) |
| 25 to 29 Years | 0 (0.0%) | 0 (0.0%) |
| 30 to 34 Years | 118 (80.8%) | 0 (0.0%) |
| 35 to 44 Years | 9 (8.2%) | 0 (0.0%) |
| 45 to 54 Years | 118 (100.0%) | 49 (41.5%) |
| 55 to 59 Years | 17 (36.2%) | 0 (0.0%) |
| 60 to 64 Years | 87 (57.2%) | 0 (0.0%) |
| 65 to 74 Years | 47 (31.3%) | 0 (0.0%) |
| 75 Years and over | 0 (0.0%) | 0 (0.0%) |
| Total | 509 (58.8%) | 89 (17.5%) |
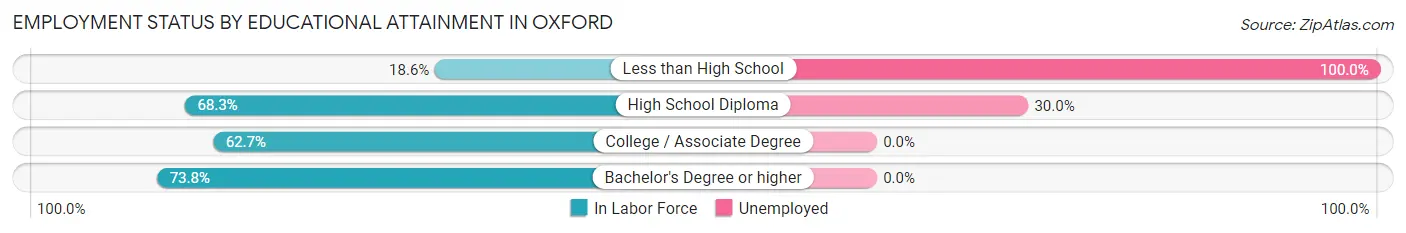
Employment Status by Educational Attainment in Oxford
According to labor force statistics for Oxford, 60.9% of individuals (349) out of the total population between 25 and 64 years of age (573) are in the labor force, with 14.0% or 49 of them being unemployed. The group with the highest labor force participation rate are those with the educational attainment of bachelor's degree or higher, with 73.8% or 124 individuals in the labor force. Within the labor force, individuals with less than high school education have the highest percentage of unemployment, with 100.0% or 16 of them being unemployed.
| Educational Attainment | In Labor Force | Unemployed |
| Less than High School | 16 (18.6%) | 86 (100.0%) |
| High School Diploma | 110 (68.3%) | 48 (30.0%) |
| College / Associate Degree | 99 (62.7%) | 0 (0.0%) |
| Bachelor's Degree or higher | 124 (73.8%) | 0 (0.0%) |
| Total | 349 (60.9%) | 80 (14.0%) |
Employment Occupations by Sex in Oxford
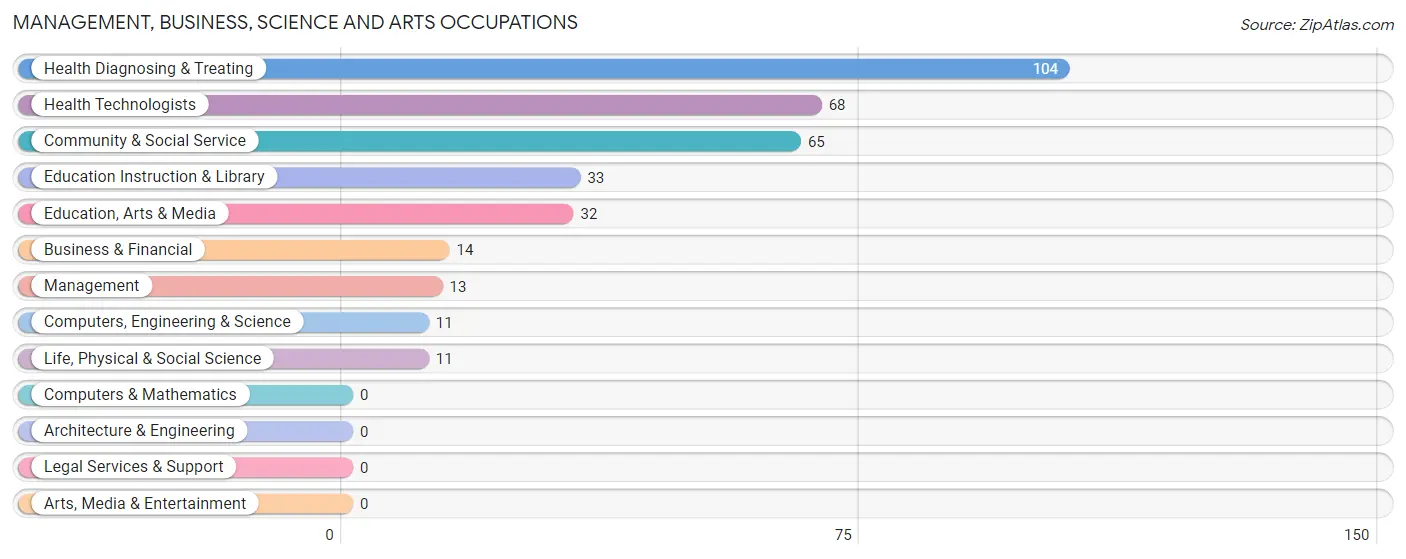
Management, Business, Science and Arts Occupations
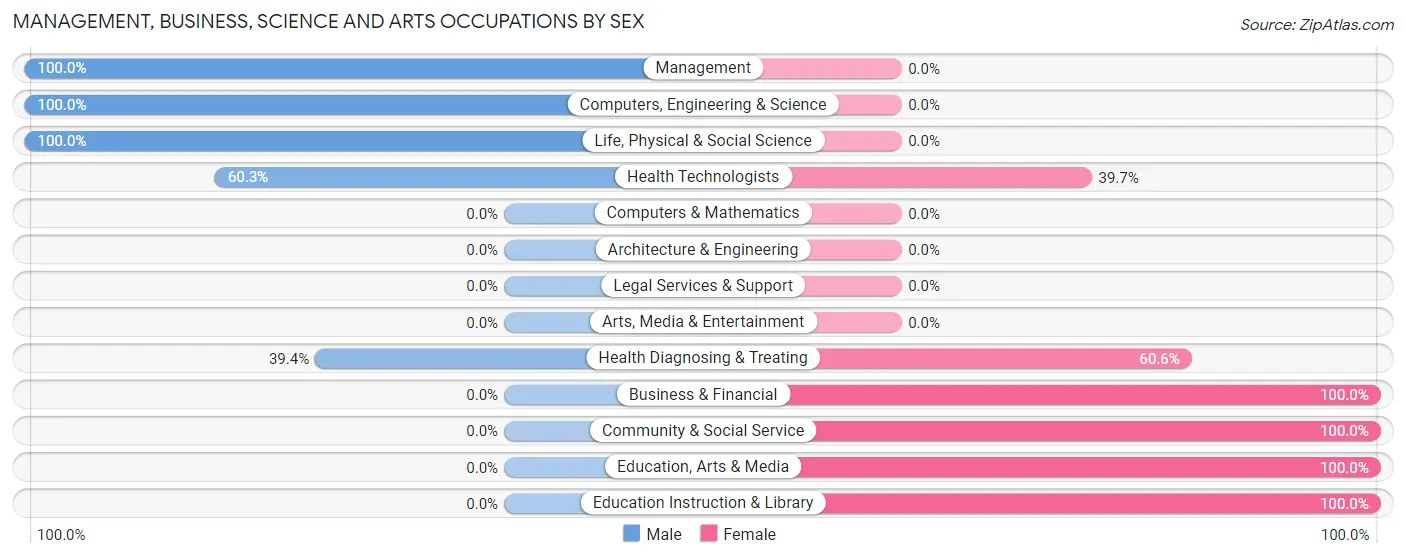
The most common Management, Business, Science and Arts occupations in Oxford are Health Diagnosing & Treating (104 | 24.8%), Health Technologists (68 | 16.2%), Community & Social Service (65 | 15.5%), Education Instruction & Library (33 | 7.9%), and Education, Arts & Media (32 | 7.6%).
Management, Business, Science and Arts Occupations by Sex
Within the Management, Business, Science and Arts occupations in Oxford, the most male-oriented occupations are Management (100.0%), Computers, Engineering & Science (100.0%), and Life, Physical & Social Science (100.0%), while the most female-oriented occupations are Business & Financial (100.0%), Community & Social Service (100.0%), and Education, Arts & Media (100.0%).
| Occupation | Male | Female |
| Management | 13 (100.0%) | 0 (0.0%) |
| Business & Financial | 0 (0.0%) | 14 (100.0%) |
| Computers, Engineering & Science | 11 (100.0%) | 0 (0.0%) |
| Computers & Mathematics | 0 (0.0%) | 0 (0.0%) |
| Architecture & Engineering | 0 (0.0%) | 0 (0.0%) |
| Life, Physical & Social Science | 11 (100.0%) | 0 (0.0%) |
| Community & Social Service | 0 (0.0%) | 65 (100.0%) |
| Education, Arts & Media | 0 (0.0%) | 32 (100.0%) |
| Legal Services & Support | 0 (0.0%) | 0 (0.0%) |
| Education Instruction & Library | 0 (0.0%) | 33 (100.0%) |
| Arts, Media & Entertainment | 0 (0.0%) | 0 (0.0%) |
| Health Diagnosing & Treating | 41 (39.4%) | 63 (60.6%) |
| Health Technologists | 41 (60.3%) | 27 (39.7%) |
| Total (Category) | 65 (31.4%) | 142 (68.6%) |
| Total (Overall) | 164 (39.1%) | 256 (61.0%) |
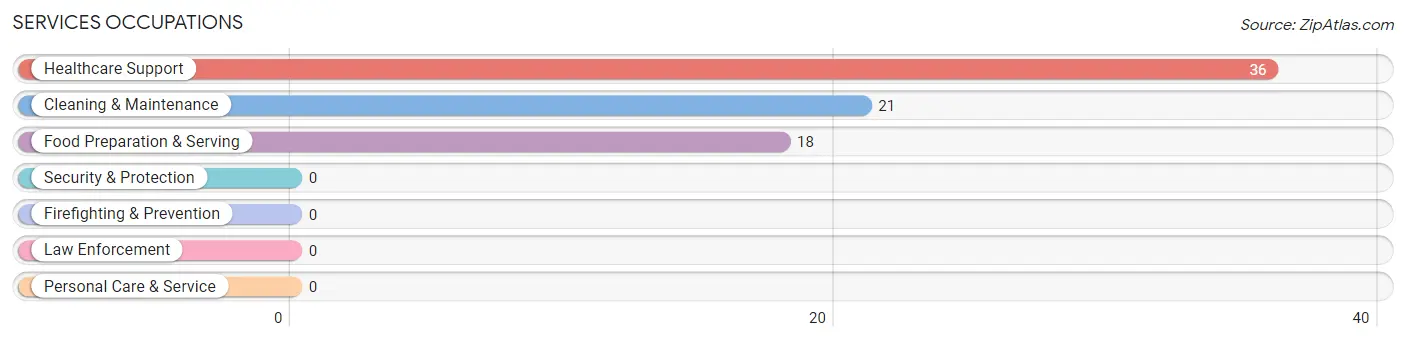
Services Occupations
The most common Services occupations in Oxford are Healthcare Support (36 | 8.6%), Cleaning & Maintenance (21 | 5.0%), and Food Preparation & Serving (18 | 4.3%).
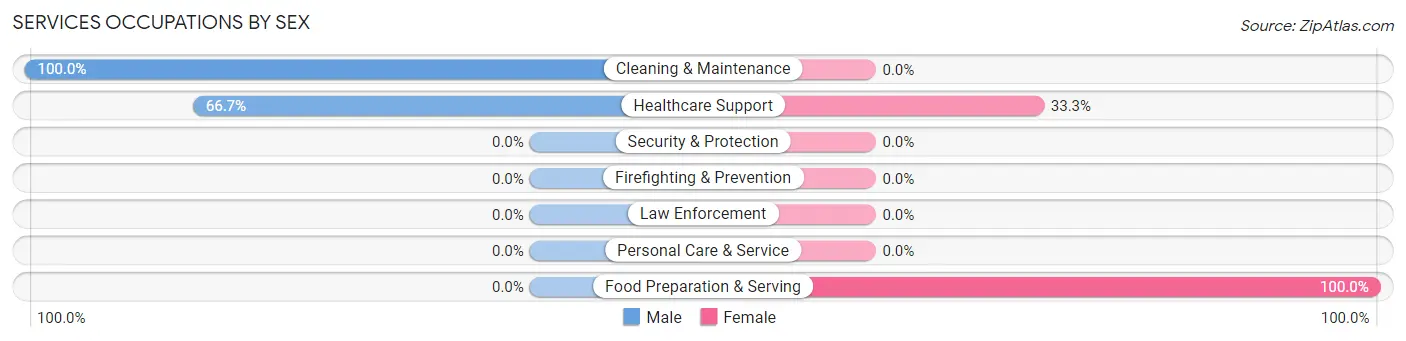
Services Occupations by Sex
Within the Services occupations in Oxford, the most male-oriented occupations are Cleaning & Maintenance (100.0%), and Healthcare Support (66.7%), while the most female-oriented occupations are Food Preparation & Serving (100.0%), and Healthcare Support (33.3%).
| Occupation | Male | Female |
| Healthcare Support | 24 (66.7%) | 12 (33.3%) |
| Security & Protection | 0 (0.0%) | 0 (0.0%) |
| Firefighting & Prevention | 0 (0.0%) | 0 (0.0%) |
| Law Enforcement | 0 (0.0%) | 0 (0.0%) |
| Food Preparation & Serving | 0 (0.0%) | 18 (100.0%) |
| Cleaning & Maintenance | 21 (100.0%) | 0 (0.0%) |
| Personal Care & Service | 0 (0.0%) | 0 (0.0%) |
| Total (Category) | 45 (60.0%) | 30 (40.0%) |
| Total (Overall) | 164 (39.1%) | 256 (61.0%) |
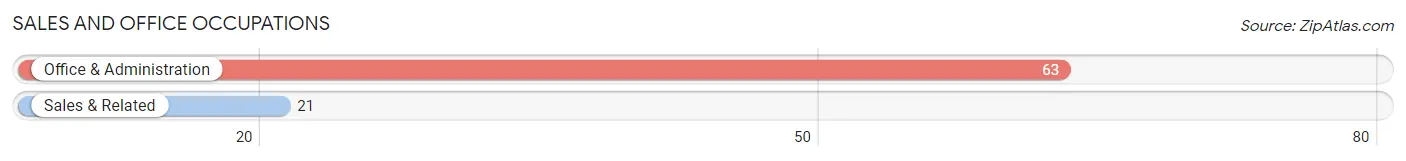
Sales and Office Occupations
The most common Sales and Office occupations in Oxford are Office & Administration (63 | 15.0%), and Sales & Related (21 | 5.0%).
Sales and Office Occupations by Sex
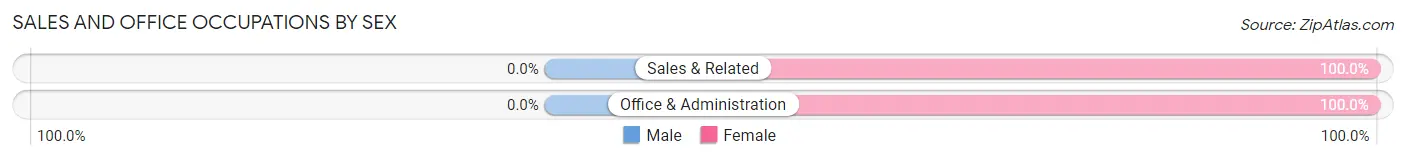
| Occupation | Male | Female |
| Sales & Related | 0 (0.0%) | 21 (100.0%) |
| Office & Administration | 0 (0.0%) | 63 (100.0%) |
| Total (Category) | 0 (0.0%) | 84 (100.0%) |
| Total (Overall) | 164 (39.1%) | 256 (61.0%) |
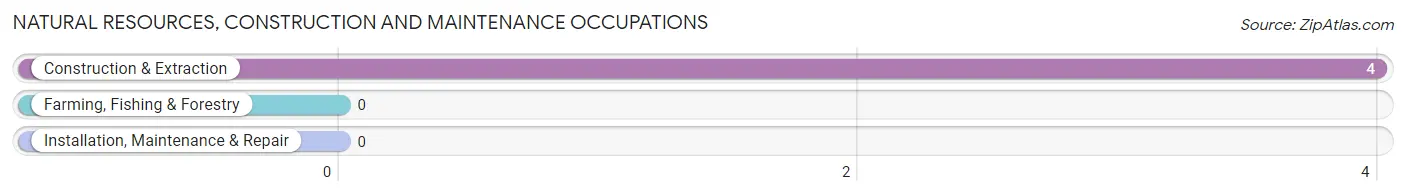
Natural Resources, Construction and Maintenance Occupations
The most common Natural Resources, Construction and Maintenance occupations in Oxford are , and Construction & Extraction (4 | 0.9%).
Natural Resources, Construction and Maintenance Occupations by Sex
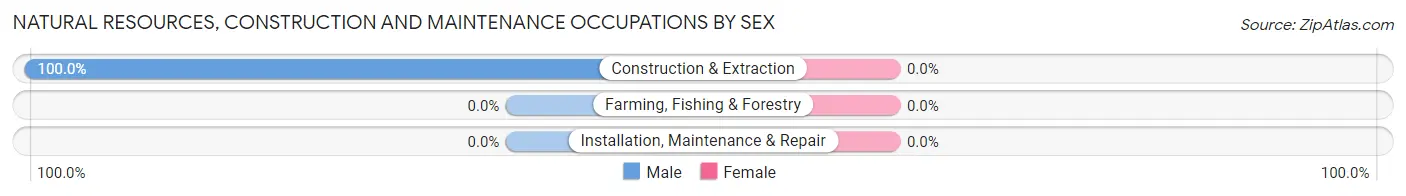
| Occupation | Male | Female |
| Farming, Fishing & Forestry | 0 (0.0%) | 0 (0.0%) |
| Construction & Extraction | 4 (100.0%) | 0 (0.0%) |
| Installation, Maintenance & Repair | 0 (0.0%) | 0 (0.0%) |
| Total (Category) | 4 (100.0%) | 0 (0.0%) |
| Total (Overall) | 164 (39.1%) | 256 (61.0%) |
Production, Transportation and Moving Occupations
The most common Production, Transportation and Moving occupations in Oxford are Production (26 | 6.2%), and Material Moving (24 | 5.7%).
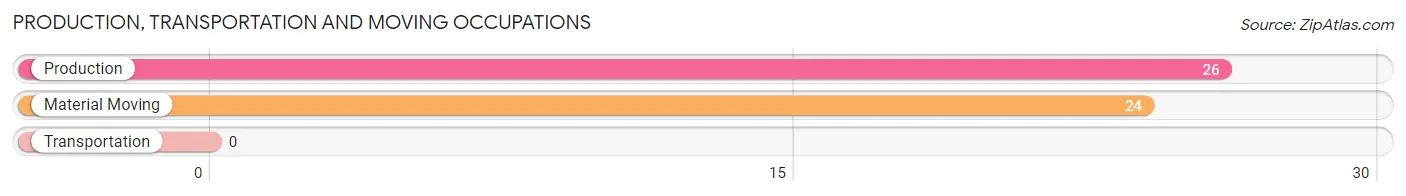
Production, Transportation and Moving Occupations by Sex
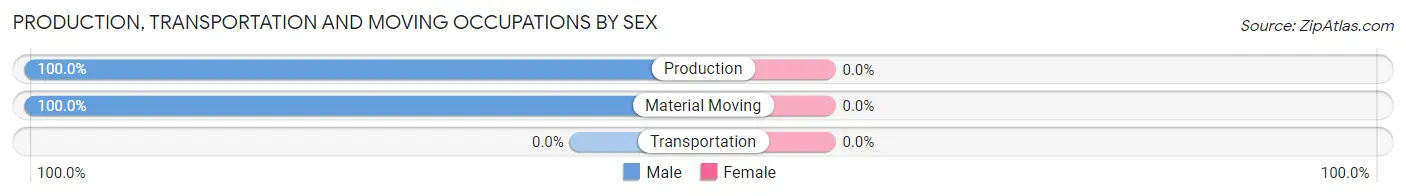
| Occupation | Male | Female |
| Production | 26 (100.0%) | 0 (0.0%) |
| Transportation | 0 (0.0%) | 0 (0.0%) |
| Material Moving | 24 (100.0%) | 0 (0.0%) |
| Total (Category) | 50 (100.0%) | 0 (0.0%) |
| Total (Overall) | 164 (39.1%) | 256 (61.0%) |
Employment Industries by Sex in Oxford
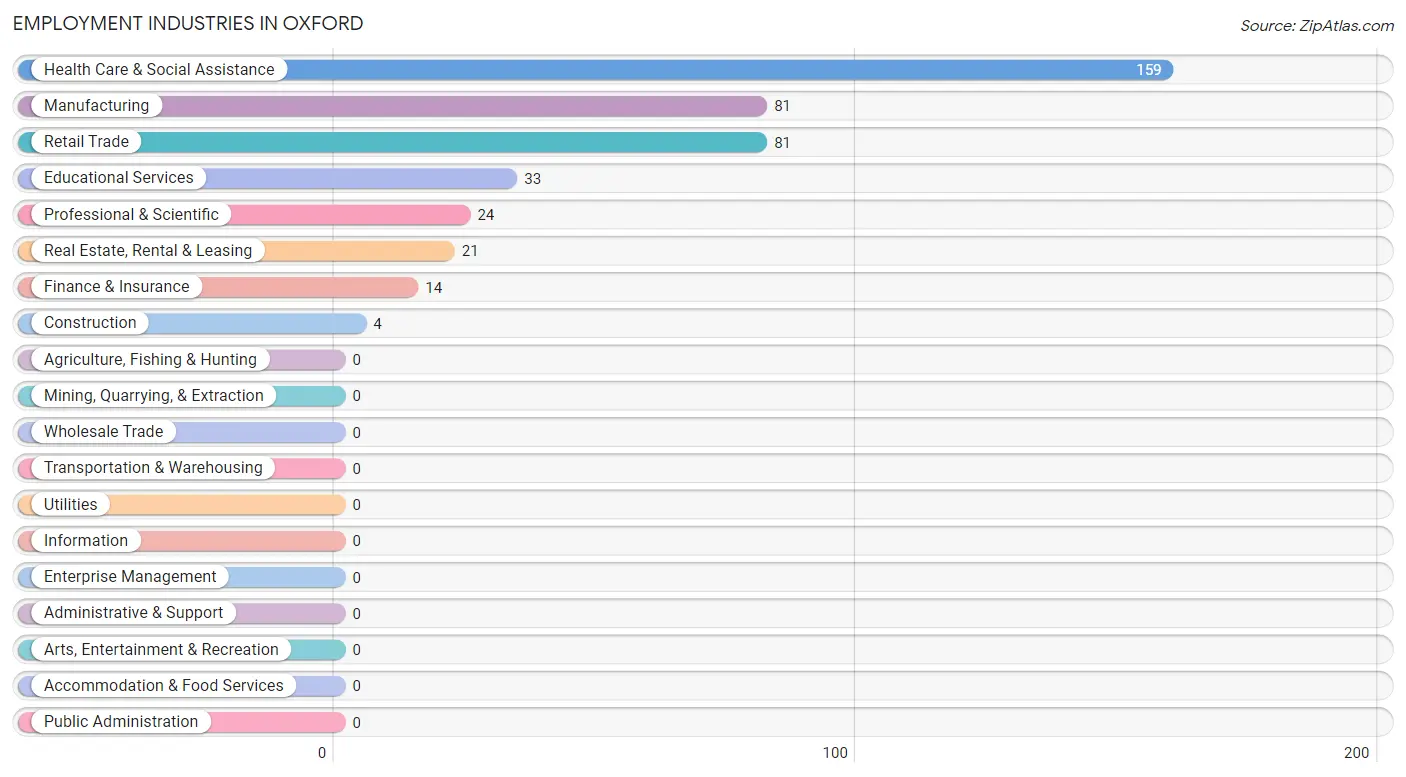
Employment Industries in Oxford
The major employment industries in Oxford include Health Care & Social Assistance (159 | 37.9%), Manufacturing (81 | 19.3%), Retail Trade (81 | 19.3%), Educational Services (33 | 7.9%), and Professional & Scientific (24 | 5.7%).
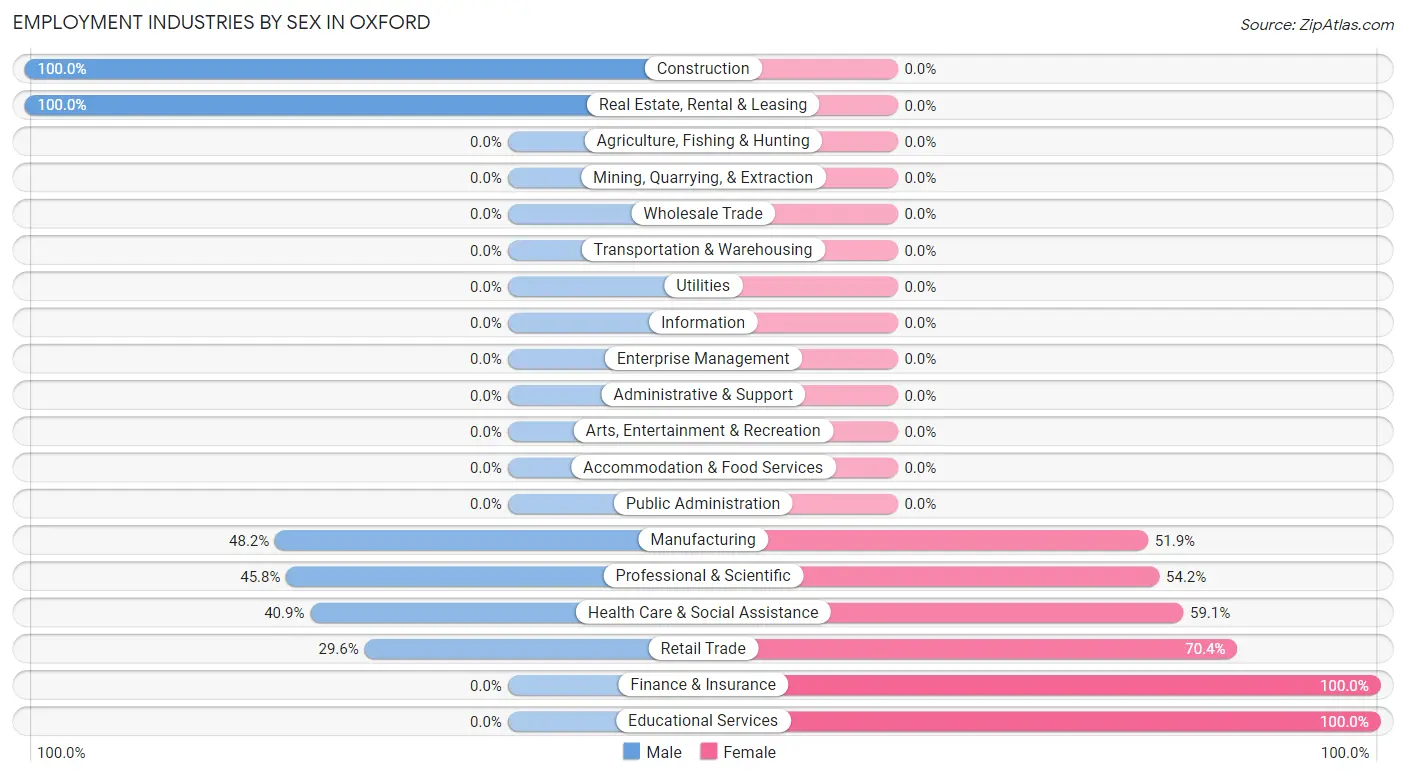
Employment Industries by Sex in Oxford
The Oxford industries that see more men than women are Construction (100.0%), Real Estate, Rental & Leasing (100.0%), and Manufacturing (48.1%), whereas the industries that tend to have a higher number of women are Finance & Insurance (100.0%), Educational Services (100.0%), and Retail Trade (70.4%).
| Industry | Male | Female |
| Agriculture, Fishing & Hunting | 0 (0.0%) | 0 (0.0%) |
| Mining, Quarrying, & Extraction | 0 (0.0%) | 0 (0.0%) |
| Construction | 4 (100.0%) | 0 (0.0%) |
| Manufacturing | 39 (48.1%) | 42 (51.8%) |
| Wholesale Trade | 0 (0.0%) | 0 (0.0%) |
| Retail Trade | 24 (29.6%) | 57 (70.4%) |
| Transportation & Warehousing | 0 (0.0%) | 0 (0.0%) |
| Utilities | 0 (0.0%) | 0 (0.0%) |
| Information | 0 (0.0%) | 0 (0.0%) |
| Finance & Insurance | 0 (0.0%) | 14 (100.0%) |
| Real Estate, Rental & Leasing | 21 (100.0%) | 0 (0.0%) |
| Professional & Scientific | 11 (45.8%) | 13 (54.2%) |
| Enterprise Management | 0 (0.0%) | 0 (0.0%) |
| Administrative & Support | 0 (0.0%) | 0 (0.0%) |
| Educational Services | 0 (0.0%) | 33 (100.0%) |
| Health Care & Social Assistance | 65 (40.9%) | 94 (59.1%) |
| Arts, Entertainment & Recreation | 0 (0.0%) | 0 (0.0%) |
| Accommodation & Food Services | 0 (0.0%) | 0 (0.0%) |
| Public Administration | 0 (0.0%) | 0 (0.0%) |
| Total | 164 (39.1%) | 256 (61.0%) |
Education in Oxford
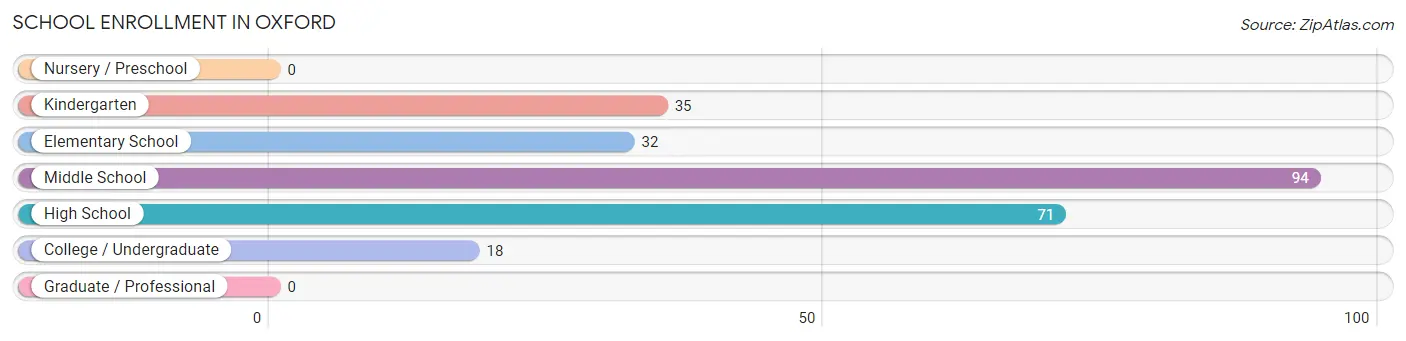
School Enrollment in Oxford
The most common levels of schooling among the 250 students in Oxford are middle school (94 | 37.6%), high school (71 | 28.4%), and kindergarten (35 | 14.0%).
| School Level | # Students | % Students |
| Nursery / Preschool | 0 | 0.0% |
| Kindergarten | 35 | 14.0% |
| Elementary School | 32 | 12.8% |
| Middle School | 94 | 37.6% |
| High School | 71 | 28.4% |
| College / Undergraduate | 18 | 7.2% |
| Graduate / Professional | 0 | 0.0% |
| Total | 250 | 100.0% |
School Enrollment by Age by Funding Source in Oxford
Out of a total of 250 students who are enrolled in schools in Oxford, 7 (2.8%) attend a private institution, while the remaining 243 (97.2%) are enrolled in public schools. The age group of 20 to 24 year olds has the highest likelihood of being enrolled in private schools, with 7 (28.0% in the age bracket) enrolled. Conversely, the age group of 5 to 9 year old has the lowest likelihood of being enrolled in a private school, with 67 (100.0% in the age bracket) attending a public institution.
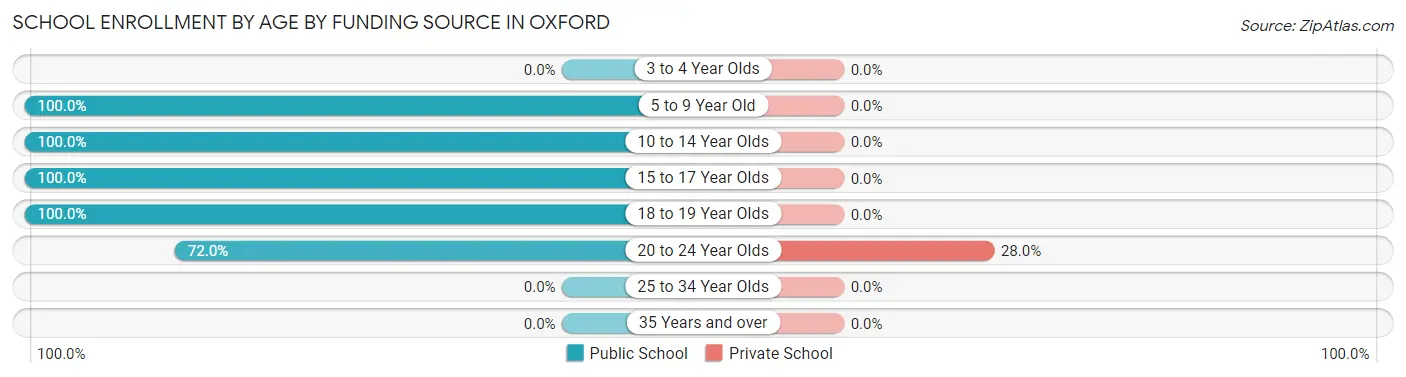
| Age Bracket | Public School | Private School |
| 3 to 4 Year Olds | 0 (0.0%) | 0 (0.0%) |
| 5 to 9 Year Old | 67 (100.0%) | 0 (0.0%) |
| 10 to 14 Year Olds | 94 (100.0%) | 0 (0.0%) |
| 15 to 17 Year Olds | 24 (100.0%) | 0 (0.0%) |
| 18 to 19 Year Olds | 40 (100.0%) | 0 (0.0%) |
| 20 to 24 Year Olds | 18 (72.0%) | 7 (28.0%) |
| 25 to 34 Year Olds | 0 (0.0%) | 0 (0.0%) |
| 35 Years and over | 0 (0.0%) | 0 (0.0%) |
| Total | 243 (97.2%) | 7 (2.8%) |
Educational Attainment by Field of Study in Oxford
Education (59 | 28.8%), science & technology (55 | 26.8%), multidisciplinary studies (32 | 15.6%), computers & mathematics (22 | 10.7%), and business (13 | 6.3%) are the most common fields of study among 205 individuals in Oxford who have obtained a bachelor's degree or higher.
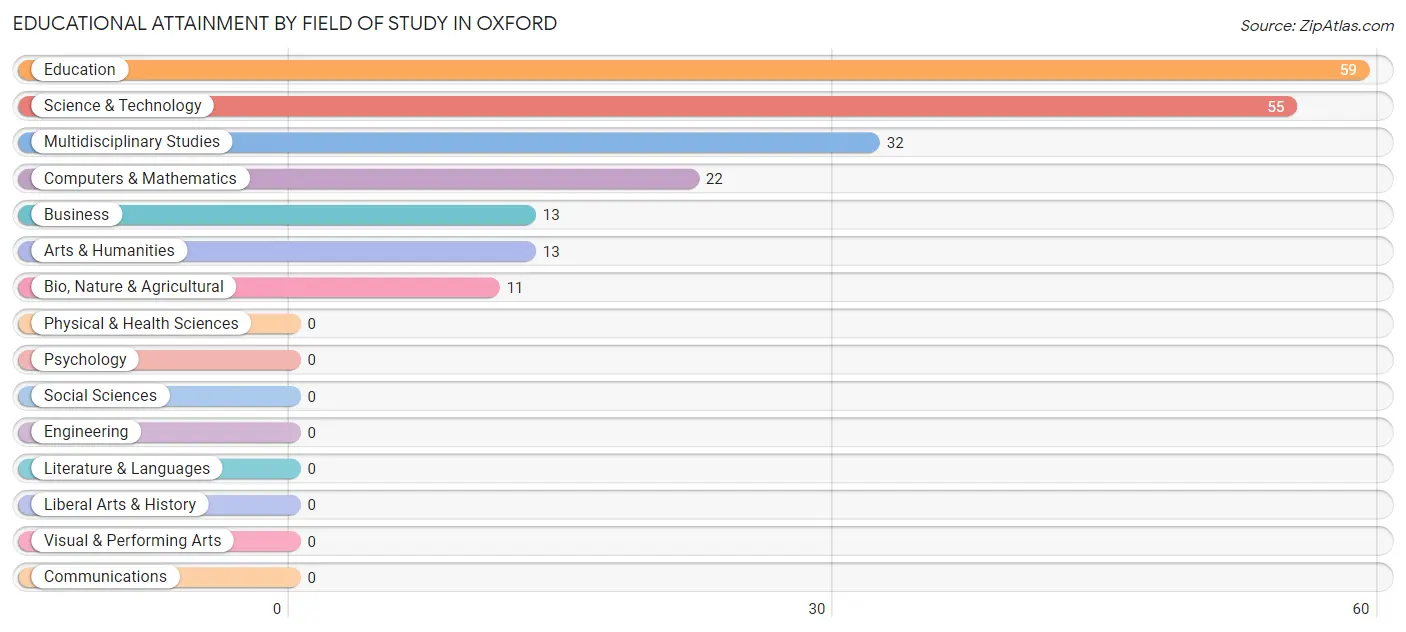
| Field of Study | # Graduates | % Graduates |
| Computers & Mathematics | 22 | 10.7% |
| Bio, Nature & Agricultural | 11 | 5.4% |
| Physical & Health Sciences | 0 | 0.0% |
| Psychology | 0 | 0.0% |
| Social Sciences | 0 | 0.0% |
| Engineering | 0 | 0.0% |
| Multidisciplinary Studies | 32 | 15.6% |
| Science & Technology | 55 | 26.8% |
| Business | 13 | 6.3% |
| Education | 59 | 28.8% |
| Literature & Languages | 0 | 0.0% |
| Liberal Arts & History | 0 | 0.0% |
| Visual & Performing Arts | 0 | 0.0% |
| Communications | 0 | 0.0% |
| Arts & Humanities | 13 | 6.3% |
| Total | 205 | 100.0% |
Transportation & Commute in Oxford
Vehicle Availability by Sex in Oxford
The most prevalent vehicle ownership categories in Oxford are males with 5 or more vehicles (69, accounting for 42.1%) and females with 5 or more vehicles (35, making up 27.0%).
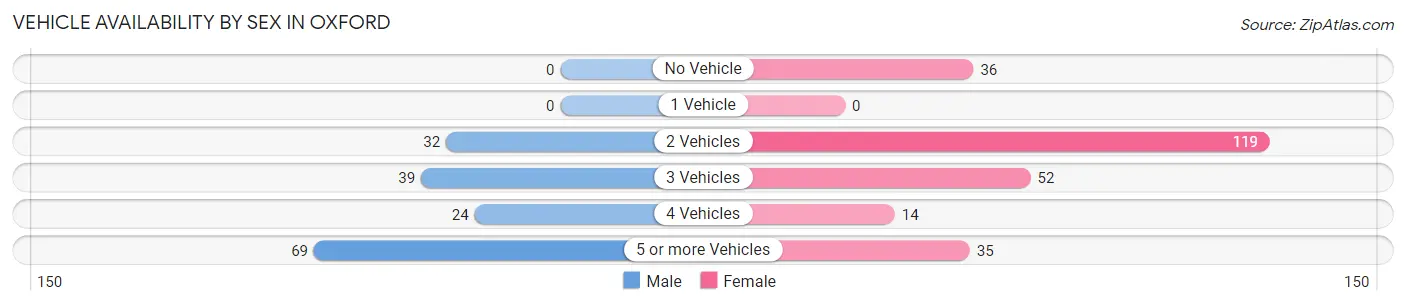
| Vehicles Available | Male | Female |
| No Vehicle | 0 (0.0%) | 36 (14.1%) |
| 1 Vehicle | 0 (0.0%) | 0 (0.0%) |
| 2 Vehicles | 32 (19.5%) | 119 (46.5%) |
| 3 Vehicles | 39 (23.8%) | 52 (20.3%) |
| 4 Vehicles | 24 (14.6%) | 14 (5.5%) |
| 5 or more Vehicles | 69 (42.1%) | 35 (13.7%) |
| Total | 164 (100.0%) | 256 (100.0%) |
Commute Time in Oxford
The most frequently occuring commute durations in Oxford are 15 to 19 minutes (96 commuters, 25.8%), 25 to 29 minutes (78 commuters, 21.0%), and 35 to 39 minutes (62 commuters, 16.7%).
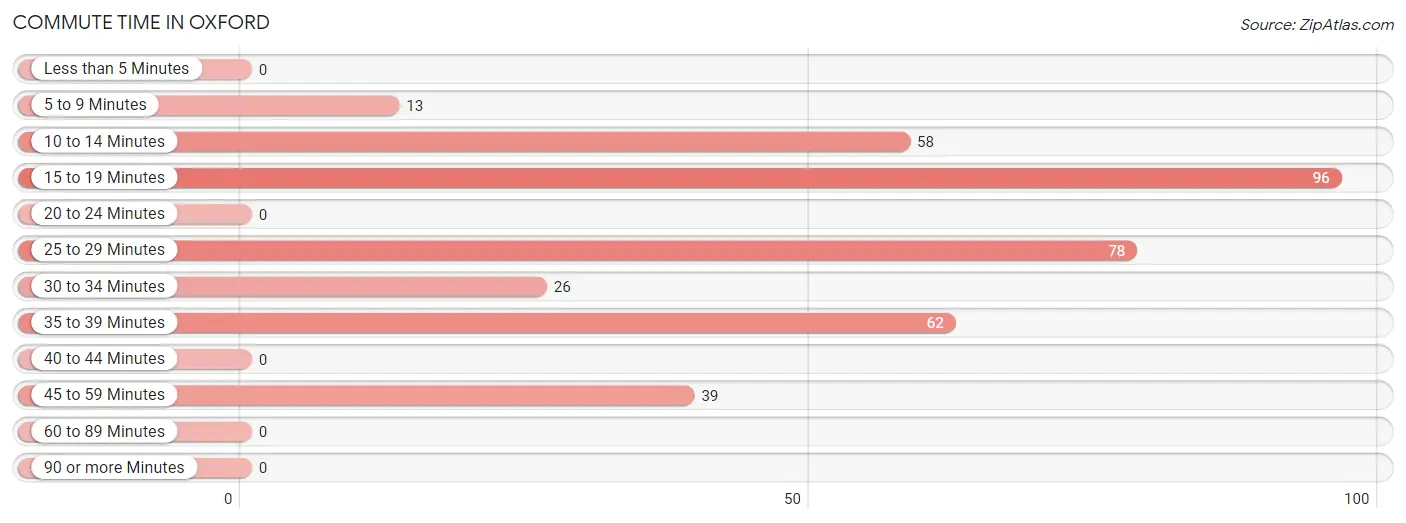
| Commute Time | # Commuters | % Commuters |
| Less than 5 Minutes | 0 | 0.0% |
| 5 to 9 Minutes | 13 | 3.5% |
| 10 to 14 Minutes | 58 | 15.6% |
| 15 to 19 Minutes | 96 | 25.8% |
| 20 to 24 Minutes | 0 | 0.0% |
| 25 to 29 Minutes | 78 | 21.0% |
| 30 to 34 Minutes | 26 | 7.0% |
| 35 to 39 Minutes | 62 | 16.7% |
| 40 to 44 Minutes | 0 | 0.0% |
| 45 to 59 Minutes | 39 | 10.5% |
| 60 to 89 Minutes | 0 | 0.0% |
| 90 or more Minutes | 0 | 0.0% |
Commute Time by Sex in Oxford
The most common commute times in Oxford are 35 to 39 minutes (62 commuters, 37.8%) for males and 15 to 19 minutes (68 commuters, 32.7%) for females.
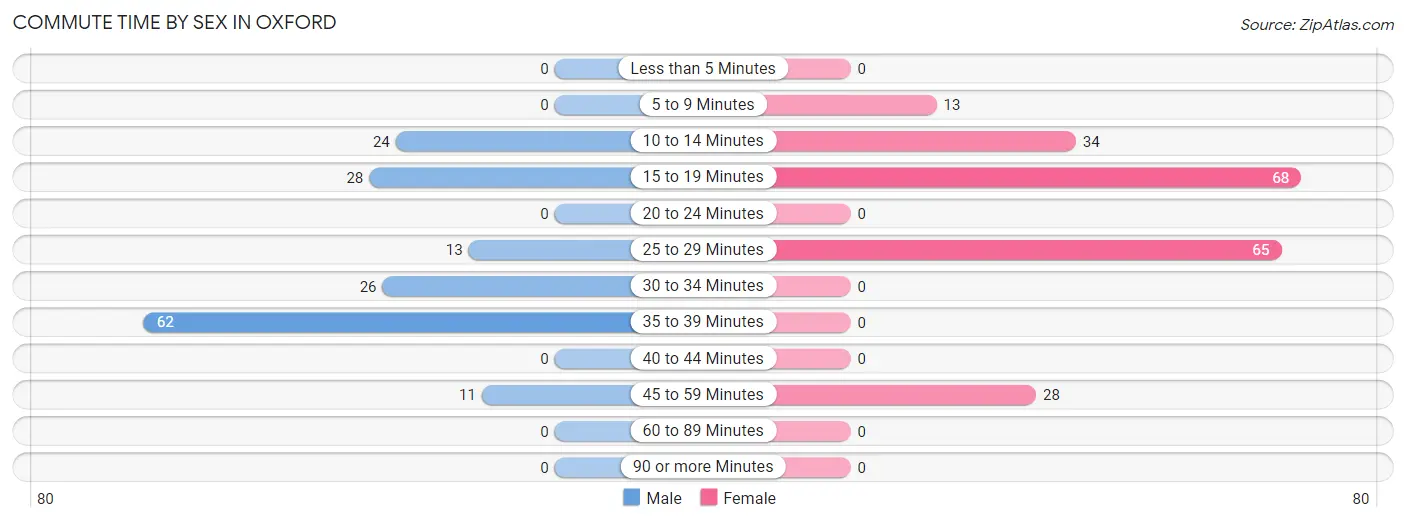
| Commute Time | Male | Female |
| Less than 5 Minutes | 0 (0.0%) | 0 (0.0%) |
| 5 to 9 Minutes | 0 (0.0%) | 13 (6.2%) |
| 10 to 14 Minutes | 24 (14.6%) | 34 (16.4%) |
| 15 to 19 Minutes | 28 (17.1%) | 68 (32.7%) |
| 20 to 24 Minutes | 0 (0.0%) | 0 (0.0%) |
| 25 to 29 Minutes | 13 (7.9%) | 65 (31.2%) |
| 30 to 34 Minutes | 26 (15.9%) | 0 (0.0%) |
| 35 to 39 Minutes | 62 (37.8%) | 0 (0.0%) |
| 40 to 44 Minutes | 0 (0.0%) | 0 (0.0%) |
| 45 to 59 Minutes | 11 (6.7%) | 28 (13.5%) |
| 60 to 89 Minutes | 0 (0.0%) | 0 (0.0%) |
| 90 or more Minutes | 0 (0.0%) | 0 (0.0%) |
Time of Departure to Work by Sex in Oxford
The most frequent times of departure to work in Oxford are 12:00 PM to 3:59 PM (74, 45.1%) for males and 6:00 AM to 6:29 AM (53, 25.5%) for females.
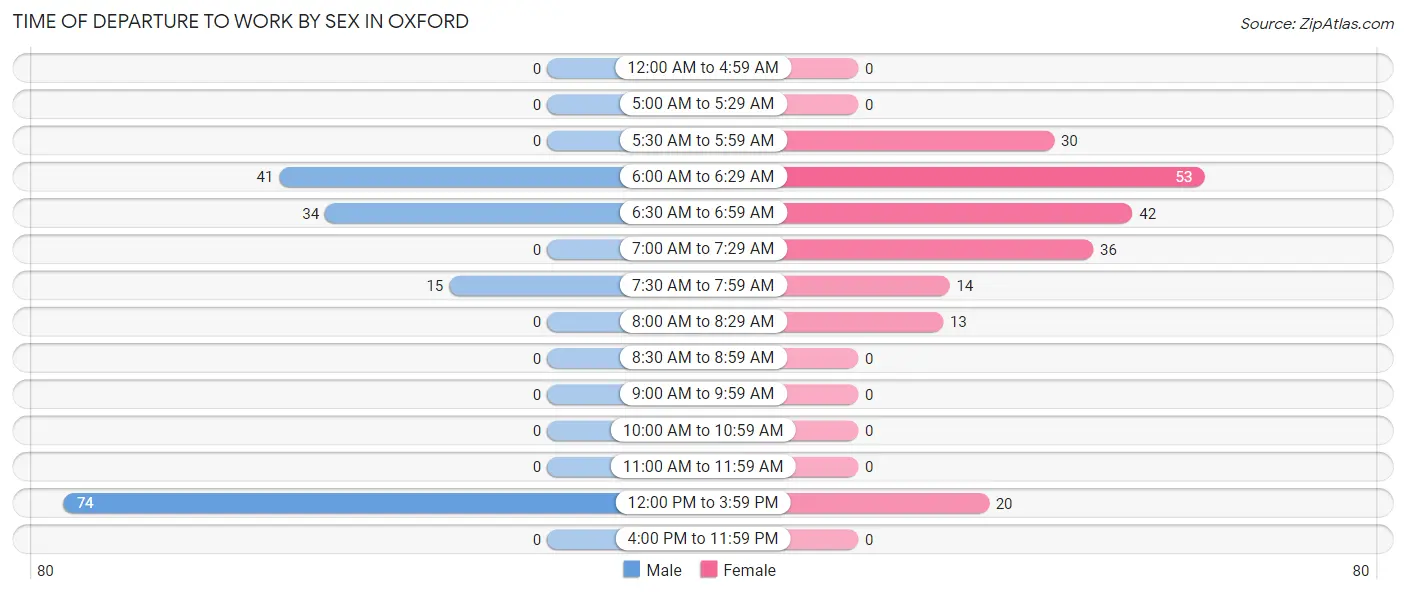
| Time of Departure | Male | Female |
| 12:00 AM to 4:59 AM | 0 (0.0%) | 0 (0.0%) |
| 5:00 AM to 5:29 AM | 0 (0.0%) | 0 (0.0%) |
| 5:30 AM to 5:59 AM | 0 (0.0%) | 30 (14.4%) |
| 6:00 AM to 6:29 AM | 41 (25.0%) | 53 (25.5%) |
| 6:30 AM to 6:59 AM | 34 (20.7%) | 42 (20.2%) |
| 7:00 AM to 7:29 AM | 0 (0.0%) | 36 (17.3%) |
| 7:30 AM to 7:59 AM | 15 (9.1%) | 14 (6.7%) |
| 8:00 AM to 8:29 AM | 0 (0.0%) | 13 (6.2%) |
| 8:30 AM to 8:59 AM | 0 (0.0%) | 0 (0.0%) |
| 9:00 AM to 9:59 AM | 0 (0.0%) | 0 (0.0%) |
| 10:00 AM to 10:59 AM | 0 (0.0%) | 0 (0.0%) |
| 11:00 AM to 11:59 AM | 0 (0.0%) | 0 (0.0%) |
| 12:00 PM to 3:59 PM | 74 (45.1%) | 20 (9.6%) |
| 4:00 PM to 11:59 PM | 0 (0.0%) | 0 (0.0%) |
| Total | 164 (100.0%) | 208 (100.0%) |
Housing Occupancy in Oxford
Occupancy by Ownership in Oxford
Of the total 461 dwellings in Oxford, owner-occupied units account for 421 (91.3%), while renter-occupied units make up 40 (8.7%).
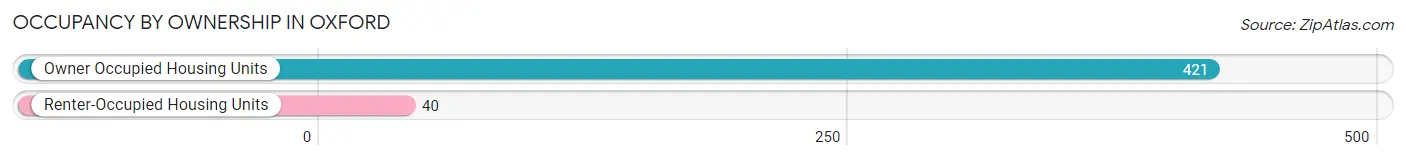
| Occupancy | # Housing Units | % Housing Units |
| Owner Occupied Housing Units | 421 | 91.3% |
| Renter-Occupied Housing Units | 40 | 8.7% |
| Total Occupied Housing Units | 461 | 100.0% |
Occupancy by Household Size in Oxford
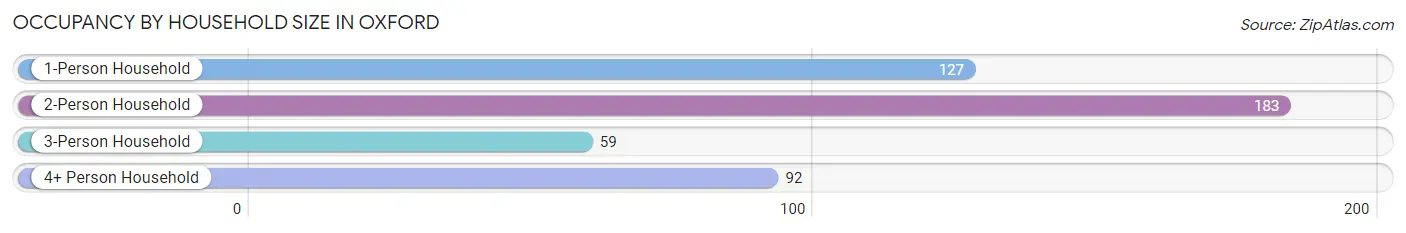
| Household Size | # Housing Units | % Housing Units |
| 1-Person Household | 127 | 27.6% |
| 2-Person Household | 183 | 39.7% |
| 3-Person Household | 59 | 12.8% |
| 4+ Person Household | 92 | 20.0% |
| Total Housing Units | 461 | 100.0% |
Occupancy by Ownership by Household Size in Oxford
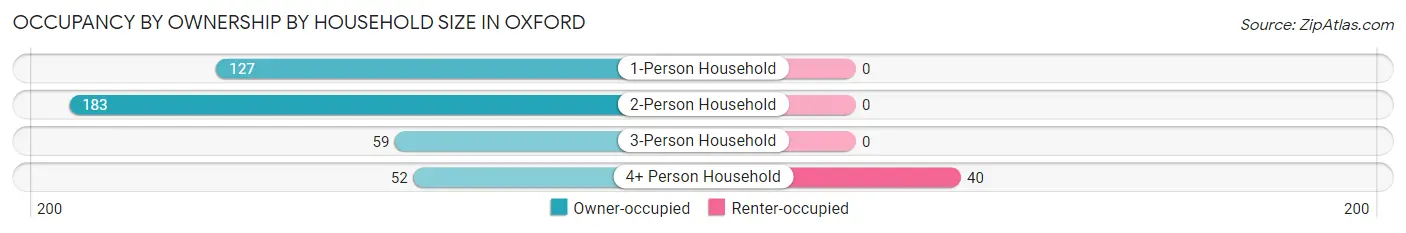
| Household Size | Owner-occupied | Renter-occupied |
| 1-Person Household | 127 (100.0%) | 0 (0.0%) |
| 2-Person Household | 183 (100.0%) | 0 (0.0%) |
| 3-Person Household | 59 (100.0%) | 0 (0.0%) |
| 4+ Person Household | 52 (56.5%) | 40 (43.5%) |
| Total Housing Units | 421 (91.3%) | 40 (8.7%) |
Occupancy by Educational Attainment in Oxford
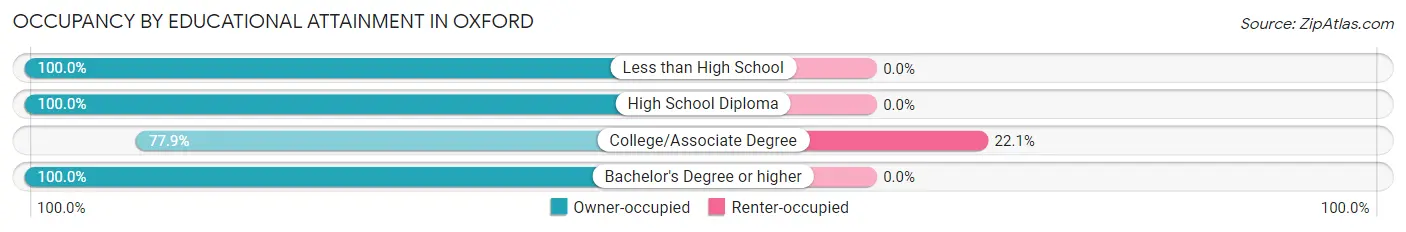
| Household Size | Owner-occupied | Renter-occupied |
| Less than High School | 52 (100.0%) | 0 (0.0%) |
| High School Diploma | 125 (100.0%) | 0 (0.0%) |
| College/Associate Degree | 141 (77.9%) | 40 (22.1%) |
| Bachelor's Degree or higher | 103 (100.0%) | 0 (0.0%) |
Occupancy by Age of Householder in Oxford
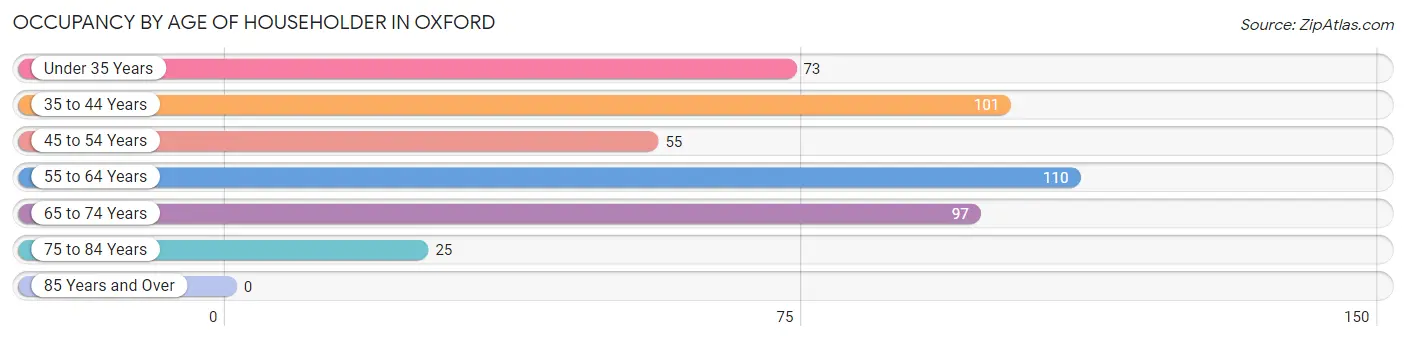
| Age Bracket | # Households | % Households |
| Under 35 Years | 73 | 15.8% |
| 35 to 44 Years | 101 | 21.9% |
| 45 to 54 Years | 55 | 11.9% |
| 55 to 64 Years | 110 | 23.9% |
| 65 to 74 Years | 97 | 21.0% |
| 75 to 84 Years | 25 | 5.4% |
| 85 Years and Over | 0 | 0.0% |
| Total | 461 | 100.0% |
Housing Finances in Oxford
Median Income by Occupancy in Oxford
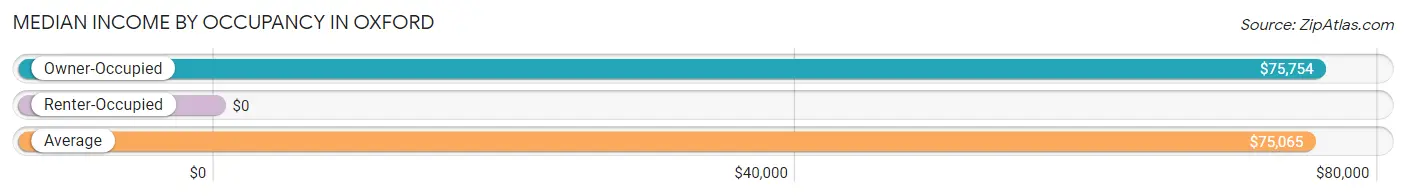
| Occupancy Type | # Households | Median Income |
| Owner-Occupied | 421 (91.3%) | $75,754 |
| Renter-Occupied | 40 (8.7%) | $0 |
| Average | 461 (100.0%) | $75,065 |
Occupancy by Householder Income Bracket in Oxford
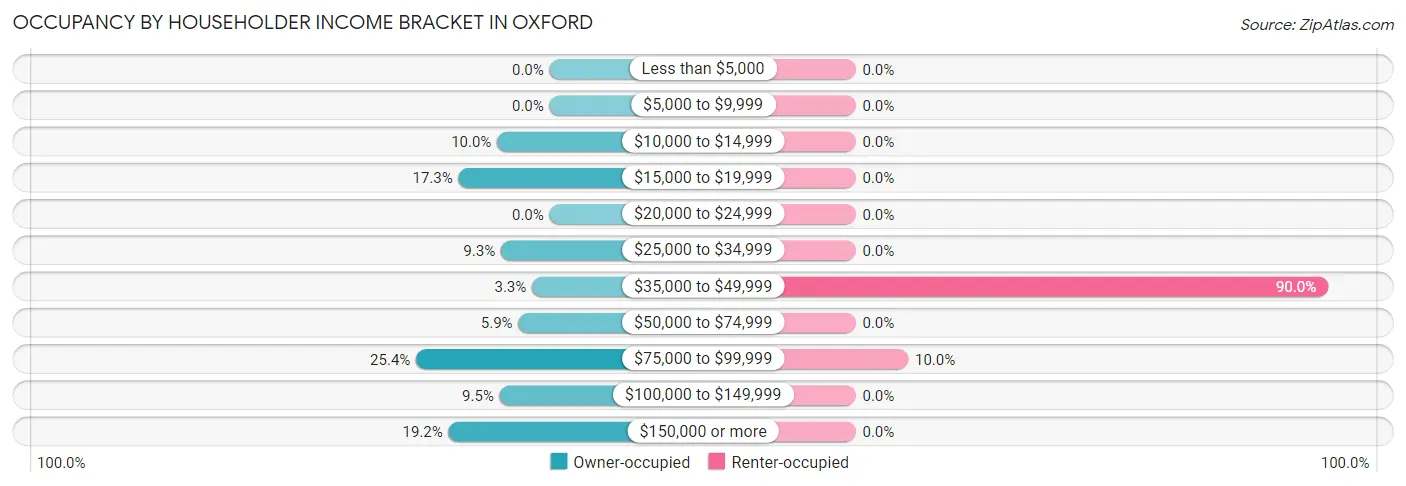
| Income Bracket | Owner-occupied | Renter-occupied |
| Less than $5,000 | 0 (0.0%) | 0 (0.0%) |
| $5,000 to $9,999 | 0 (0.0%) | 0 (0.0%) |
| $10,000 to $14,999 | 42 (10.0%) | 0 (0.0%) |
| $15,000 to $19,999 | 73 (17.3%) | 0 (0.0%) |
| $20,000 to $24,999 | 0 (0.0%) | 0 (0.0%) |
| $25,000 to $34,999 | 39 (9.3%) | 0 (0.0%) |
| $35,000 to $49,999 | 14 (3.3%) | 36 (90.0%) |
| $50,000 to $74,999 | 25 (5.9%) | 0 (0.0%) |
| $75,000 to $99,999 | 107 (25.4%) | 4 (10.0%) |
| $100,000 to $149,999 | 40 (9.5%) | 0 (0.0%) |
| $150,000 or more | 81 (19.2%) | 0 (0.0%) |
| Total | 421 (100.0%) | 40 (100.0%) |
Monthly Housing Cost Tiers in Oxford
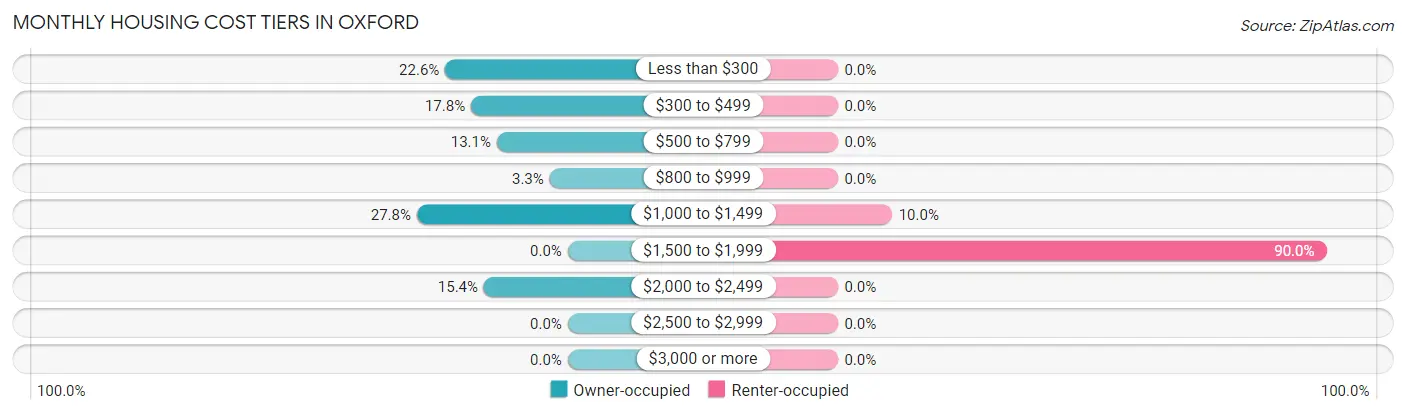
| Monthly Cost | Owner-occupied | Renter-occupied |
| Less than $300 | 95 (22.6%) | 0 (0.0%) |
| $300 to $499 | 75 (17.8%) | 0 (0.0%) |
| $500 to $799 | 55 (13.1%) | 0 (0.0%) |
| $800 to $999 | 14 (3.3%) | 0 (0.0%) |
| $1,000 to $1,499 | 117 (27.8%) | 4 (10.0%) |
| $1,500 to $1,999 | 0 (0.0%) | 36 (90.0%) |
| $2,000 to $2,499 | 65 (15.4%) | 0 (0.0%) |
| $2,500 to $2,999 | 0 (0.0%) | 0 (0.0%) |
| $3,000 or more | 0 (0.0%) | 0 (0.0%) |
| Total | 421 (100.0%) | 40 (100.0%) |
Physical Housing Characteristics in Oxford
Housing Structures in Oxford
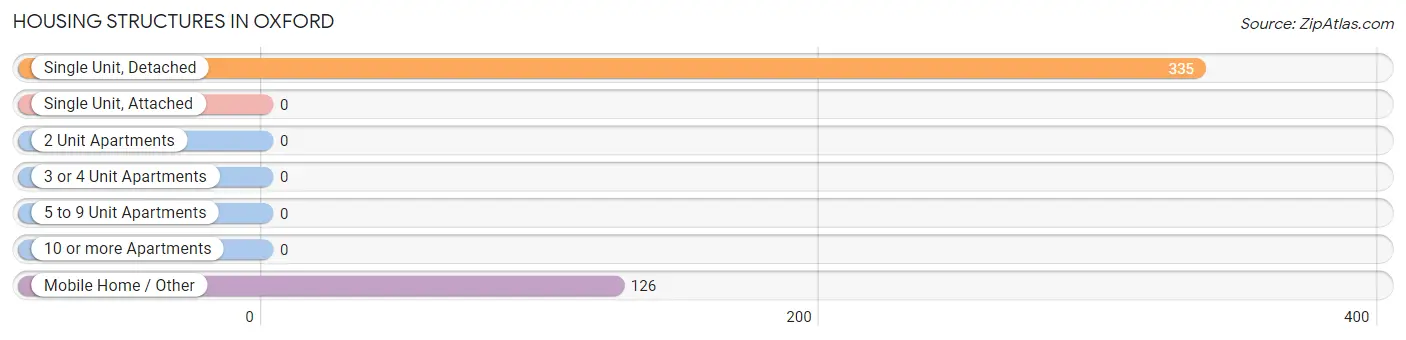
| Structure Type | # Housing Units | % Housing Units |
| Single Unit, Detached | 335 | 72.7% |
| Single Unit, Attached | 0 | 0.0% |
| 2 Unit Apartments | 0 | 0.0% |
| 3 or 4 Unit Apartments | 0 | 0.0% |
| 5 to 9 Unit Apartments | 0 | 0.0% |
| 10 or more Apartments | 0 | 0.0% |
| Mobile Home / Other | 126 | 27.3% |
| Total | 461 | 100.0% |
Housing Structures by Occupancy in Oxford
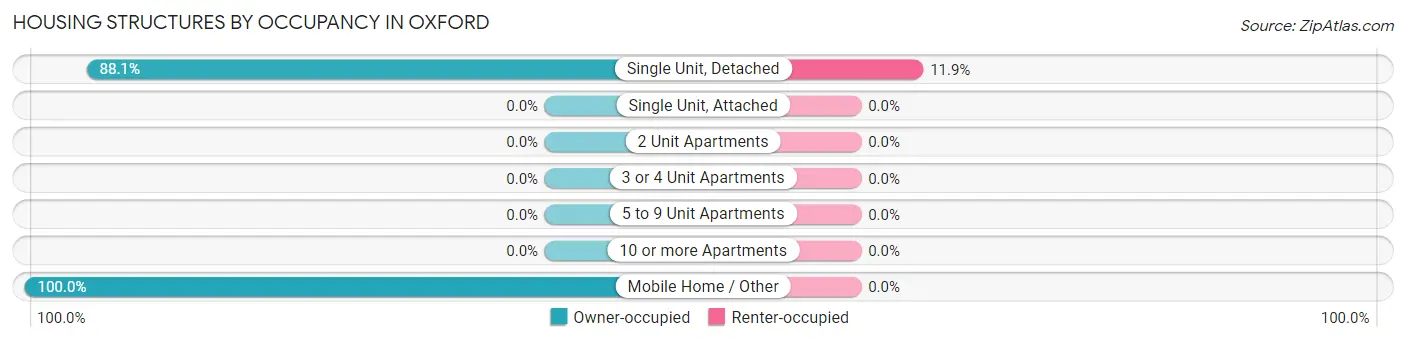
| Structure Type | Owner-occupied | Renter-occupied |
| Single Unit, Detached | 295 (88.1%) | 40 (11.9%) |
| Single Unit, Attached | 0 (0.0%) | 0 (0.0%) |
| 2 Unit Apartments | 0 (0.0%) | 0 (0.0%) |
| 3 or 4 Unit Apartments | 0 (0.0%) | 0 (0.0%) |
| 5 to 9 Unit Apartments | 0 (0.0%) | 0 (0.0%) |
| 10 or more Apartments | 0 (0.0%) | 0 (0.0%) |
| Mobile Home / Other | 126 (100.0%) | 0 (0.0%) |
| Total | 421 (91.3%) | 40 (8.7%) |
Housing Structures by Number of Rooms in Oxford
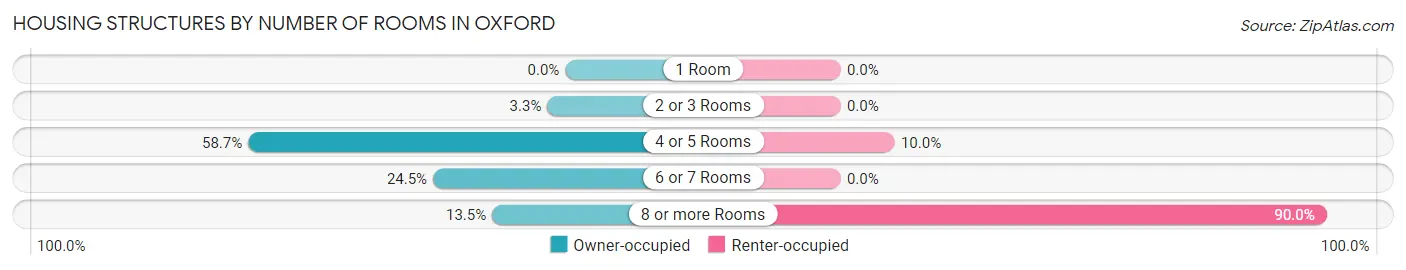
| Number of Rooms | Owner-occupied | Renter-occupied |
| 1 Room | 0 (0.0%) | 0 (0.0%) |
| 2 or 3 Rooms | 14 (3.3%) | 0 (0.0%) |
| 4 or 5 Rooms | 247 (58.7%) | 4 (10.0%) |
| 6 or 7 Rooms | 103 (24.5%) | 0 (0.0%) |
| 8 or more Rooms | 57 (13.5%) | 36 (90.0%) |
| Total | 421 (100.0%) | 40 (100.0%) |
Housing Structure by Heating Type in Oxford
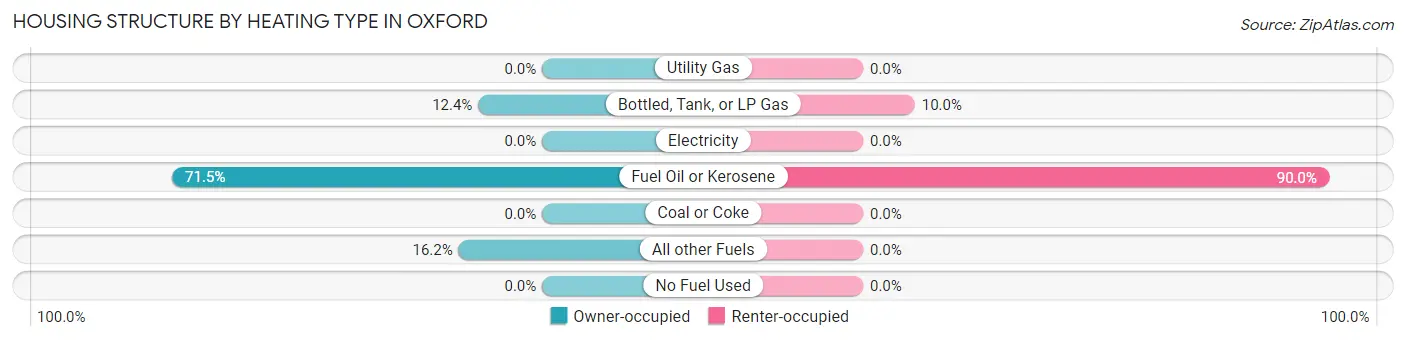
| Heating Type | Owner-occupied | Renter-occupied |
| Utility Gas | 0 (0.0%) | 0 (0.0%) |
| Bottled, Tank, or LP Gas | 52 (12.3%) | 4 (10.0%) |
| Electricity | 0 (0.0%) | 0 (0.0%) |
| Fuel Oil or Kerosene | 301 (71.5%) | 36 (90.0%) |
| Coal or Coke | 0 (0.0%) | 0 (0.0%) |
| All other Fuels | 68 (16.2%) | 0 (0.0%) |
| No Fuel Used | 0 (0.0%) | 0 (0.0%) |
| Total | 421 (100.0%) | 40 (100.0%) |
Household Vehicle Usage in Oxford
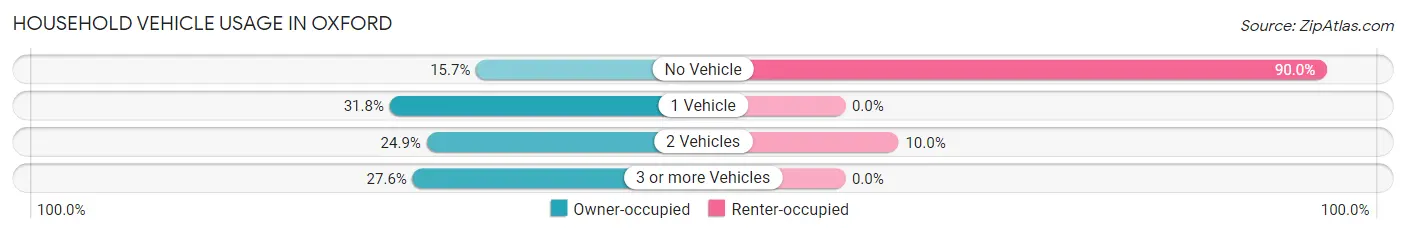
| Vehicles per Household | Owner-occupied | Renter-occupied |
| No Vehicle | 66 (15.7%) | 36 (90.0%) |
| 1 Vehicle | 134 (31.8%) | 0 (0.0%) |
| 2 Vehicles | 105 (24.9%) | 4 (10.0%) |
| 3 or more Vehicles | 116 (27.6%) | 0 (0.0%) |
| Total | 421 (100.0%) | 40 (100.0%) |
Real Estate & Mortgages in Oxford
Real Estate and Mortgage Overview in Oxford
| Characteristic | Without Mortgage | With Mortgage |
| Housing Units | 251 | 170 |
| Median Property Value | $142,000 | $219,300 |
| Median Household Income | $25,673 | $65 |
| Monthly Housing Costs | $426 | $0 |
| Real Estate Taxes | $1,756 | $0 |
Property Value by Mortgage Status in Oxford
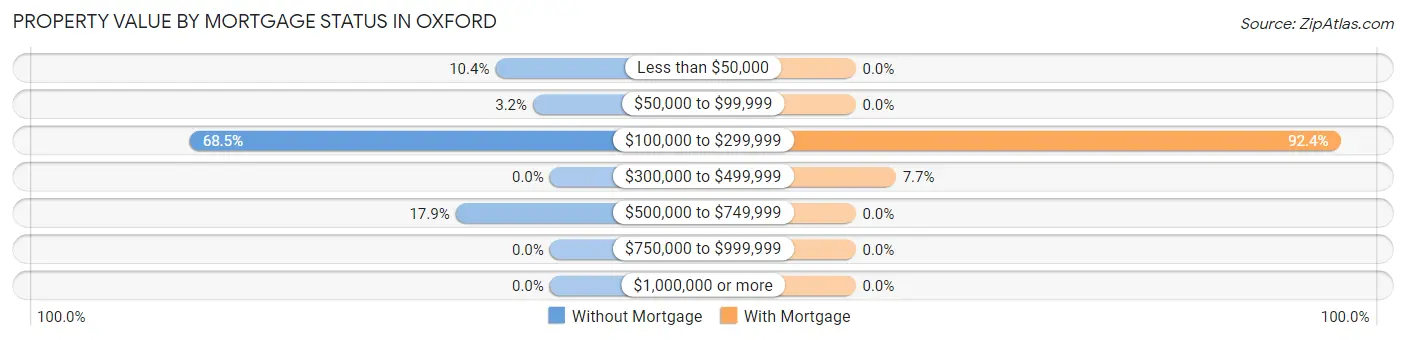
| Property Value | Without Mortgage | With Mortgage |
| Less than $50,000 | 26 (10.4%) | 0 (0.0%) |
| $50,000 to $99,999 | 8 (3.2%) | 0 (0.0%) |
| $100,000 to $299,999 | 172 (68.5%) | 157 (92.3%) |
| $300,000 to $499,999 | 0 (0.0%) | 13 (7.6%) |
| $500,000 to $749,999 | 45 (17.9%) | 0 (0.0%) |
| $750,000 to $999,999 | 0 (0.0%) | 0 (0.0%) |
| $1,000,000 or more | 0 (0.0%) | 0 (0.0%) |
| Total | 251 (100.0%) | 170 (100.0%) |
Household Income by Mortgage Status in Oxford
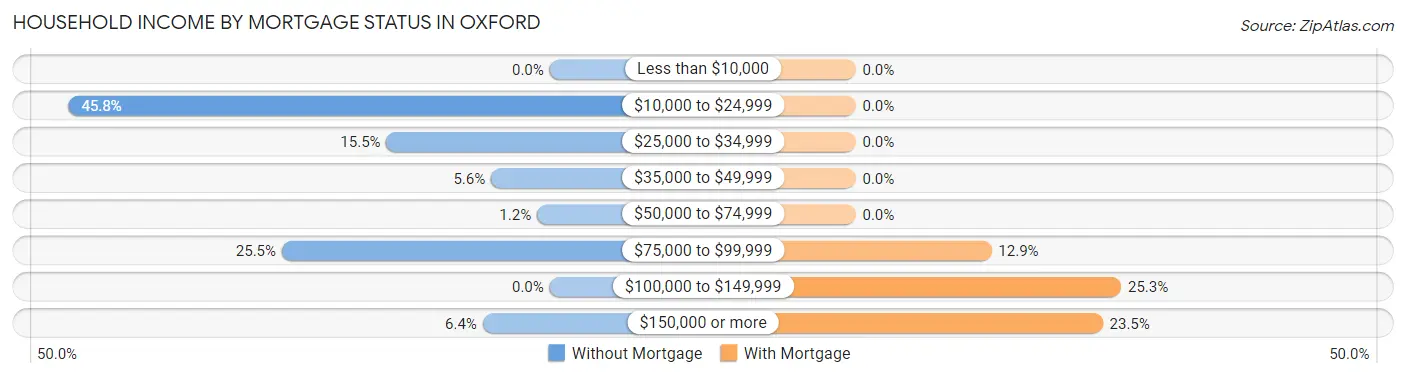
| Household Income | Without Mortgage | With Mortgage |
| Less than $10,000 | 0 (0.0%) | 0 (0.0%) |
| $10,000 to $24,999 | 115 (45.8%) | 0 (0.0%) |
| $25,000 to $34,999 | 39 (15.5%) | 0 (0.0%) |
| $35,000 to $49,999 | 14 (5.6%) | 0 (0.0%) |
| $50,000 to $74,999 | 3 (1.2%) | 0 (0.0%) |
| $75,000 to $99,999 | 64 (25.5%) | 22 (12.9%) |
| $100,000 to $149,999 | 0 (0.0%) | 43 (25.3%) |
| $150,000 or more | 16 (6.4%) | 40 (23.5%) |
| Total | 251 (100.0%) | 170 (100.0%) |
Property Value to Household Income Ratio in Oxford
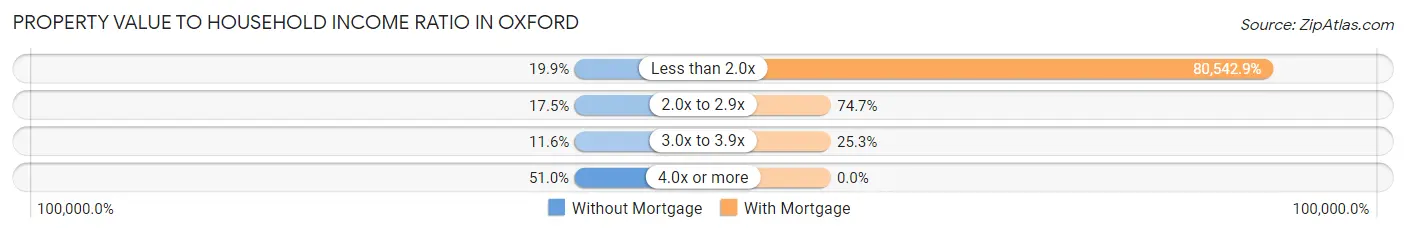
| Value-to-Income Ratio | Without Mortgage | With Mortgage |
| Less than 2.0x | 50 (19.9%) | 136,923 (80,542.9%) |
| 2.0x to 2.9x | 44 (17.5%) | 127 (74.7%) |
| 3.0x to 3.9x | 29 (11.6%) | 43 (25.3%) |
| 4.0x or more | 128 (51.0%) | 0 (0.0%) |
| Total | 251 (100.0%) | 170 (100.0%) |
Real Estate Taxes by Mortgage Status in Oxford
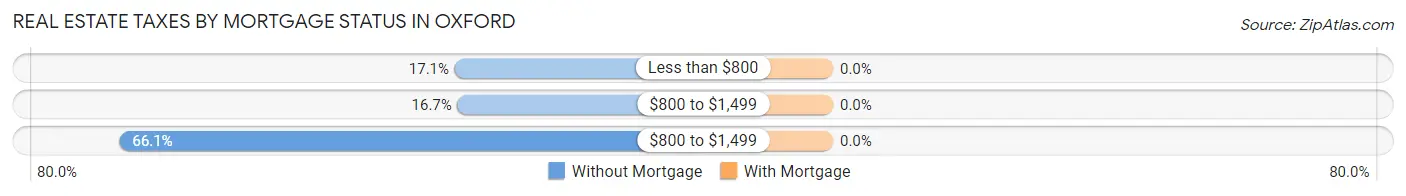
| Property Taxes | Without Mortgage | With Mortgage |
| Less than $800 | 43 (17.1%) | 0 (0.0%) |
| $800 to $1,499 | 42 (16.7%) | 0 (0.0%) |
| $800 to $1,499 | 166 (66.1%) | 0 (0.0%) |
| Total | 251 (100.0%) | 170 (100.0%) |
Health & Disability in Oxford
Health Insurance Coverage by Age in Oxford
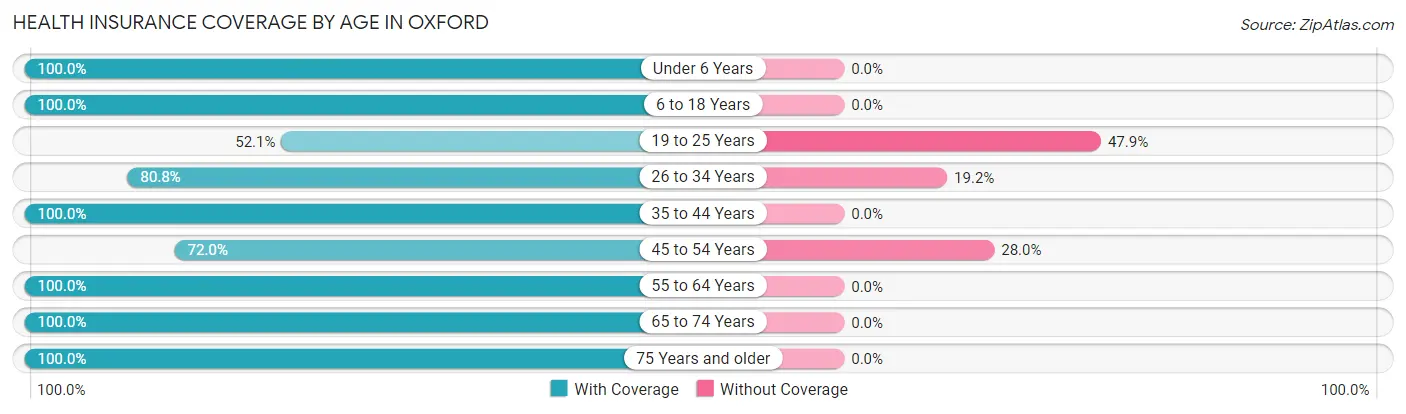
| Age Bracket | With Coverage | Without Coverage |
| Under 6 Years | 108 (100.0%) | 0 (0.0%) |
| 6 to 18 Years | 150 (100.0%) | 0 (0.0%) |
| 19 to 25 Years | 49 (52.1%) | 45 (47.9%) |
| 26 to 34 Years | 118 (80.8%) | 28 (19.2%) |
| 35 to 44 Years | 110 (100.0%) | 0 (0.0%) |
| 45 to 54 Years | 85 (72.0%) | 33 (28.0%) |
| 55 to 64 Years | 199 (100.0%) | 0 (0.0%) |
| 65 to 74 Years | 150 (100.0%) | 0 (0.0%) |
| 75 Years and older | 25 (100.0%) | 0 (0.0%) |
| Total | 994 (90.4%) | 106 (9.6%) |
Health Insurance Coverage by Citizenship Status in Oxford
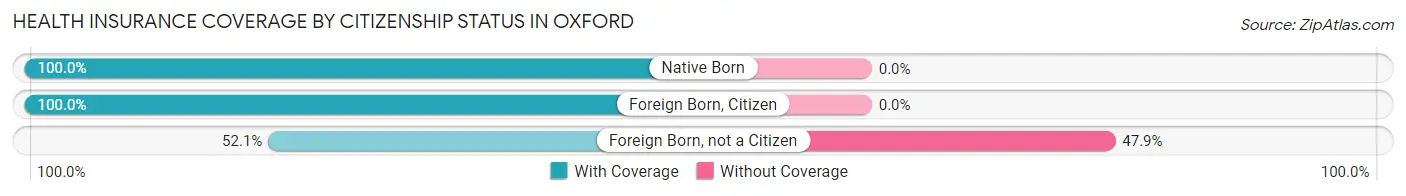
| Citizenship Status | With Coverage | Without Coverage |
| Native Born | 108 (100.0%) | 0 (0.0%) |
| Foreign Born, Citizen | 150 (100.0%) | 0 (0.0%) |
| Foreign Born, not a Citizen | 49 (52.1%) | 45 (47.9%) |
Health Insurance Coverage by Household Income in Oxford
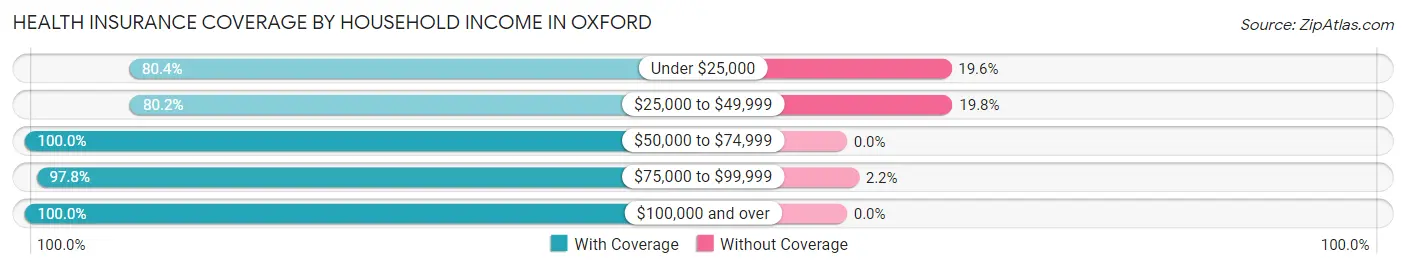
| Household Income | With Coverage | Without Coverage |
| Under $25,000 | 115 (80.4%) | 28 (19.6%) |
| $25,000 to $49,999 | 296 (80.2%) | 73 (19.8%) |
| $50,000 to $74,999 | 51 (100.0%) | 0 (0.0%) |
| $75,000 to $99,999 | 218 (97.8%) | 5 (2.2%) |
| $100,000 and over | 314 (100.0%) | 0 (0.0%) |
Public vs Private Health Insurance Coverage by Age in Oxford
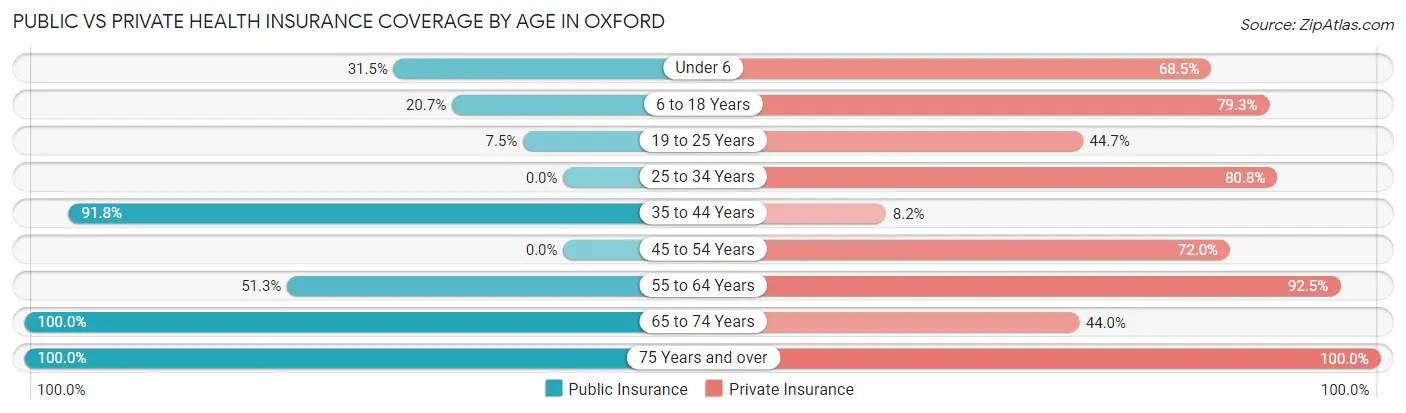
| Age Bracket | Public Insurance | Private Insurance |
| Under 6 | 34 (31.5%) | 74 (68.5%) |
| 6 to 18 Years | 31 (20.7%) | 119 (79.3%) |
| 19 to 25 Years | 7 (7.4%) | 42 (44.7%) |
| 25 to 34 Years | 0 (0.0%) | 118 (80.8%) |
| 35 to 44 Years | 101 (91.8%) | 9 (8.2%) |
| 45 to 54 Years | 0 (0.0%) | 85 (72.0%) |
| 55 to 64 Years | 102 (51.3%) | 184 (92.5%) |
| 65 to 74 Years | 150 (100.0%) | 66 (44.0%) |
| 75 Years and over | 25 (100.0%) | 25 (100.0%) |
| Total | 450 (40.9%) | 722 (65.6%) |
Disability Status by Sex by Age in Oxford
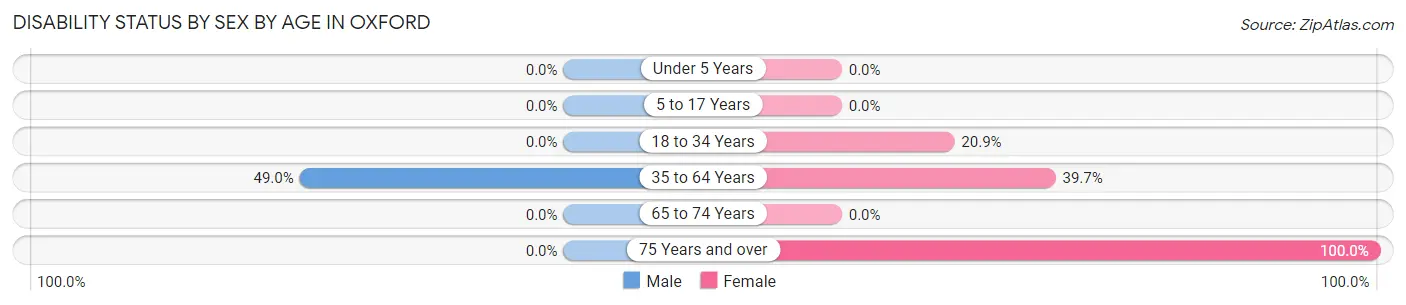
| Age Bracket | Male | Female |
| Under 5 Years | 0 (0.0%) | 0 (0.0%) |
| 5 to 17 Years | 0 (0.0%) | 0 (0.0%) |
| 18 to 34 Years | 0 (0.0%) | 28 (20.9%) |
| 35 to 64 Years | 119 (49.0%) | 73 (39.7%) |
| 65 to 74 Years | 0 (0.0%) | 0 (0.0%) |
| 75 Years and over | 0 (0.0%) | 25 (100.0%) |
Disability Class by Sex by Age in Oxford
Disability Class: Hearing Difficulty
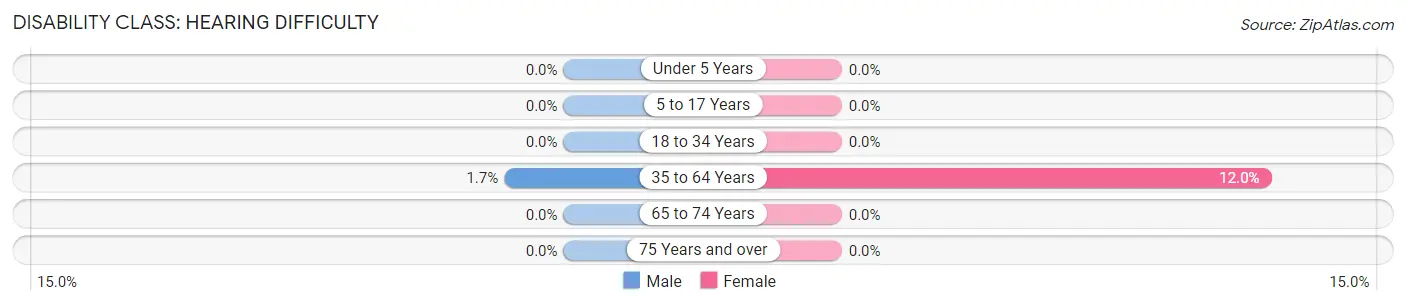
| Age Bracket | Male | Female |
| Under 5 Years | 0 (0.0%) | 0 (0.0%) |
| 5 to 17 Years | 0 (0.0%) | 0 (0.0%) |
| 18 to 34 Years | 0 (0.0%) | 0 (0.0%) |
| 35 to 64 Years | 4 (1.7%) | 22 (12.0%) |
| 65 to 74 Years | 0 (0.0%) | 0 (0.0%) |
| 75 Years and over | 0 (0.0%) | 0 (0.0%) |
Disability Class: Vision Difficulty
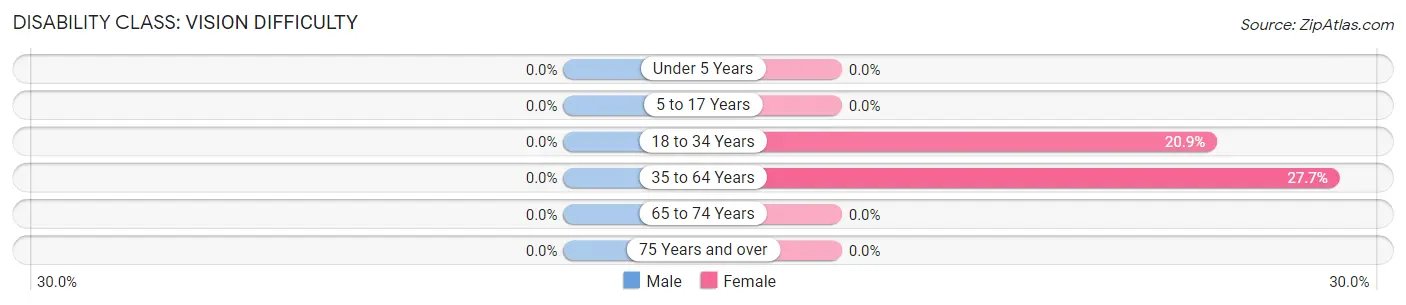
| Age Bracket | Male | Female |
| Under 5 Years | 0 (0.0%) | 0 (0.0%) |
| 5 to 17 Years | 0 (0.0%) | 0 (0.0%) |
| 18 to 34 Years | 0 (0.0%) | 28 (20.9%) |
| 35 to 64 Years | 0 (0.0%) | 51 (27.7%) |
| 65 to 74 Years | 0 (0.0%) | 0 (0.0%) |
| 75 Years and over | 0 (0.0%) | 0 (0.0%) |
Disability Class: Cognitive Difficulty
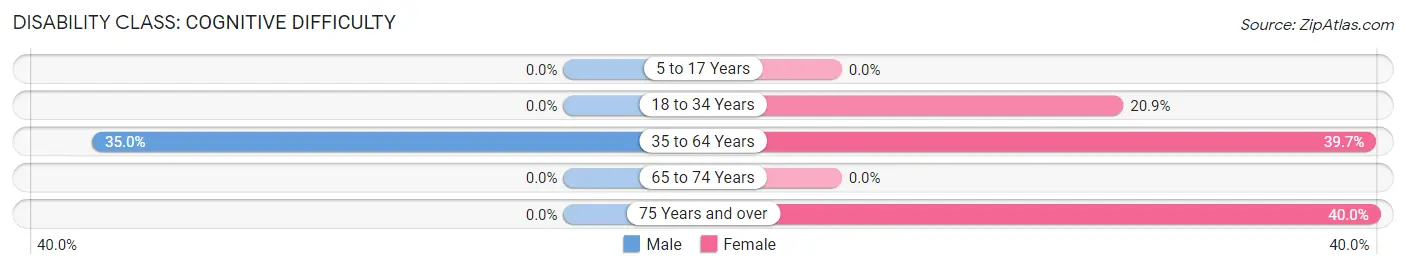
| Age Bracket | Male | Female |
| 5 to 17 Years | 0 (0.0%) | 0 (0.0%) |
| 18 to 34 Years | 0 (0.0%) | 28 (20.9%) |
| 35 to 64 Years | 85 (35.0%) | 73 (39.7%) |
| 65 to 74 Years | 0 (0.0%) | 0 (0.0%) |
| 75 Years and over | 0 (0.0%) | 10 (40.0%) |
Disability Class: Ambulatory Difficulty
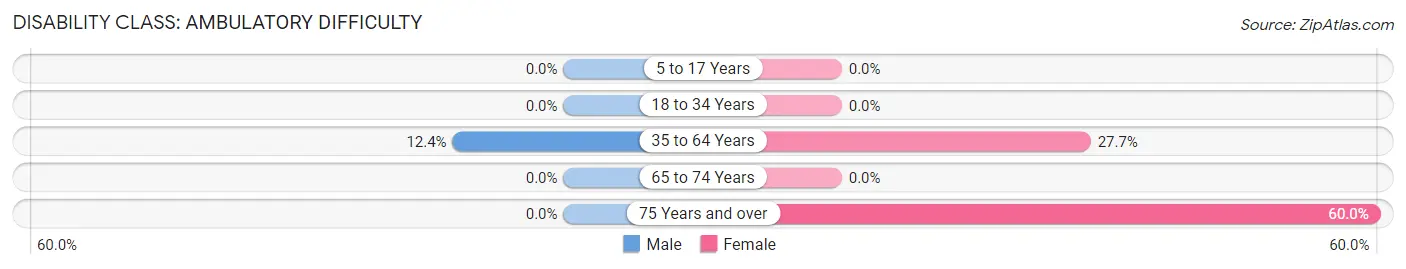
| Age Bracket | Male | Female |
| 5 to 17 Years | 0 (0.0%) | 0 (0.0%) |
| 18 to 34 Years | 0 (0.0%) | 0 (0.0%) |
| 35 to 64 Years | 30 (12.3%) | 51 (27.7%) |
| 65 to 74 Years | 0 (0.0%) | 0 (0.0%) |
| 75 Years and over | 0 (0.0%) | 15 (60.0%) |
Disability Class: Self-Care Difficulty
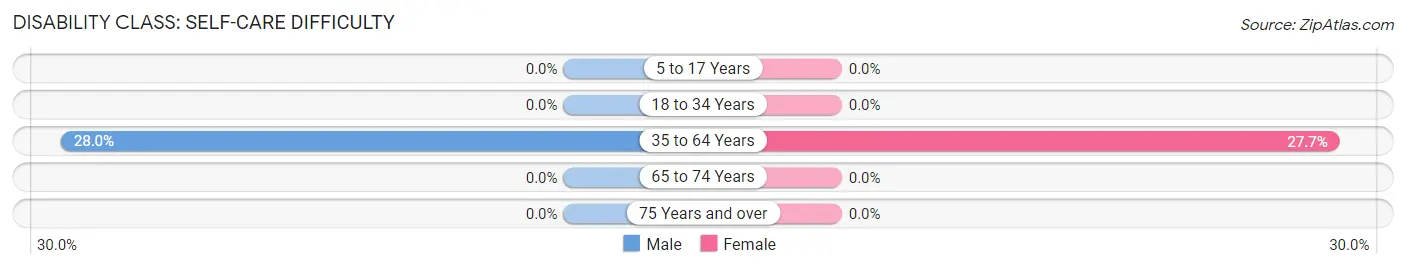
| Age Bracket | Male | Female |
| 5 to 17 Years | 0 (0.0%) | 0 (0.0%) |
| 18 to 34 Years | 0 (0.0%) | 0 (0.0%) |
| 35 to 64 Years | 68 (28.0%) | 51 (27.7%) |
| 65 to 74 Years | 0 (0.0%) | 0 (0.0%) |
| 75 Years and over | 0 (0.0%) | 0 (0.0%) |
Technology Access in Oxford
Computing Device Access in Oxford
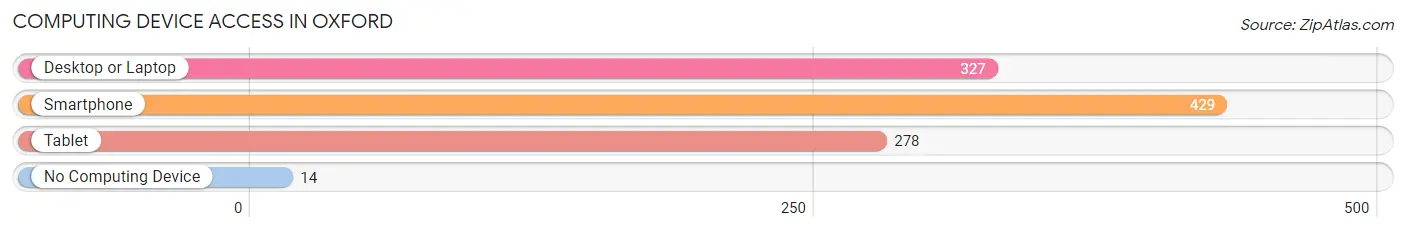
| Device Type | # Households | % Households |
| Desktop or Laptop | 327 | 70.9% |
| Smartphone | 429 | 93.1% |
| Tablet | 278 | 60.3% |
| No Computing Device | 14 | 3.0% |
| Total | 461 | 100.0% |
Internet Access in Oxford
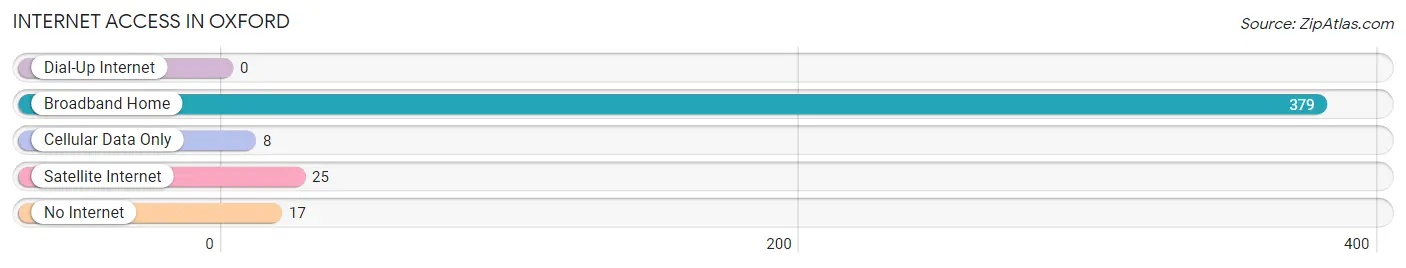
| Internet Type | # Households | % Households |
| Dial-Up Internet | 0 | 0.0% |
| Broadband Home | 379 | 82.2% |
| Cellular Data Only | 8 | 1.7% |
| Satellite Internet | 25 | 5.4% |
| No Internet | 17 | 3.7% |
| Total | 461 | 100.0% |
Oxford Summary
Oxford, Maine is a small town located in the western part of the state, in Oxford County. It is situated on the Androscoggin River, and is bordered by the towns of Hebron, Otisfield, and Norway. The town has a population of approximately 2,500 people, and is home to a variety of businesses, including a paper mill, a sawmill, and a number of small businesses.
History
Oxford was first settled in 1794 by a group of settlers from Massachusetts. The town was named after Oxford, England, and was incorporated in 1829. The town was originally a farming community, but in the mid-1800s, the paper industry began to take hold in the area. The Oxford Paper Company was established in 1867, and the Oxford Mill was built in 1872. The mill was the largest employer in the area for many years, and was the main source of income for the town.
Geography
Oxford is located in western Maine, in Oxford County. It is situated on the Androscoggin River, and is bordered by the towns of Hebron, Otisfield, and Norway. The town has a total area of 24.2 square miles, of which 23.7 square miles is land and 0.5 square miles is water. The town is located in the foothills of the White Mountains, and is home to several small lakes and ponds.
Economy
Oxford’s economy is largely based on the paper industry. The Oxford Mill is the largest employer in the area, and is the main source of income for the town. The mill produces paper products, such as newsprint, cardboard, and paperboard. In addition to the paper mill, the town is also home to a number of small businesses, including a sawmill, a lumber mill, and a variety of retail stores.
Demographics
As of the 2010 census, the population of Oxford was 2,541. The racial makeup of the town was 97.2% White, 0.7% African American, 0.3% Native American, 0.3% Asian, 0.1% Pacific Islander, 0.3% from other races, and 1.2% from two or more races. The median household income in the town was $41,944, and the median family income was $50,917. The per capita income for the town was $20,945. Approximately 11.2% of the population was below the poverty line.
Common Questions
What is Per Capita Income in Oxford?
Per Capita income in Oxford is $36,286.
What is the Median Family Income in Oxford?
Median Family Income in Oxford is $79,063.
What is the Median Household income in Oxford?
Median Household Income in Oxford is $75,065.
What is Income or Wage Gap in Oxford?
Income or Wage Gap in Oxford is 52.6%.
Women in Oxford earn 47.4 cents for every dollar earned by a man.
What is Inequality or Gini Index in Oxford?
Inequality or Gini Index in Oxford is 0.47.
What is the Total Population of Oxford?
Total Population of Oxford is 1,100.
What is the Total Male Population of Oxford?
Total Male Population of Oxford is 490.
What is the Total Female Population of Oxford?
Total Female Population of Oxford is 610.
What is the Ratio of Males per 100 Females in Oxford?
There are 80.33 Males per 100 Females in Oxford.
What is the Ratio of Females per 100 Males in Oxford?
There are 124.49 Females per 100 Males in Oxford.
What is the Median Population Age in Oxford?
Median Population Age in Oxford is 40.8 Years.
What is the Average Family Size in Oxford
Average Family Size in Oxford is 3.1 People.
What is the Average Household Size in Oxford
Average Household Size in Oxford is 2.4 People.
How Large is the Labor Force in Oxford?
There are 509 People in the Labor Forcein in Oxford.
What is the Percentage of People in the Labor Force in Oxford?
58.8% of People are in the Labor Force in Oxford.
What is the Unemployment Rate in Oxford?
Unemployment Rate in Oxford is 17.5%.