Zip Codes with the Highest Percentage of Population with a Degree in Liberal Arts and History in Boston, MA
RELATED REPORTS & OPTIONS
Liberal Arts and History
Boston
Compare Zip Codes
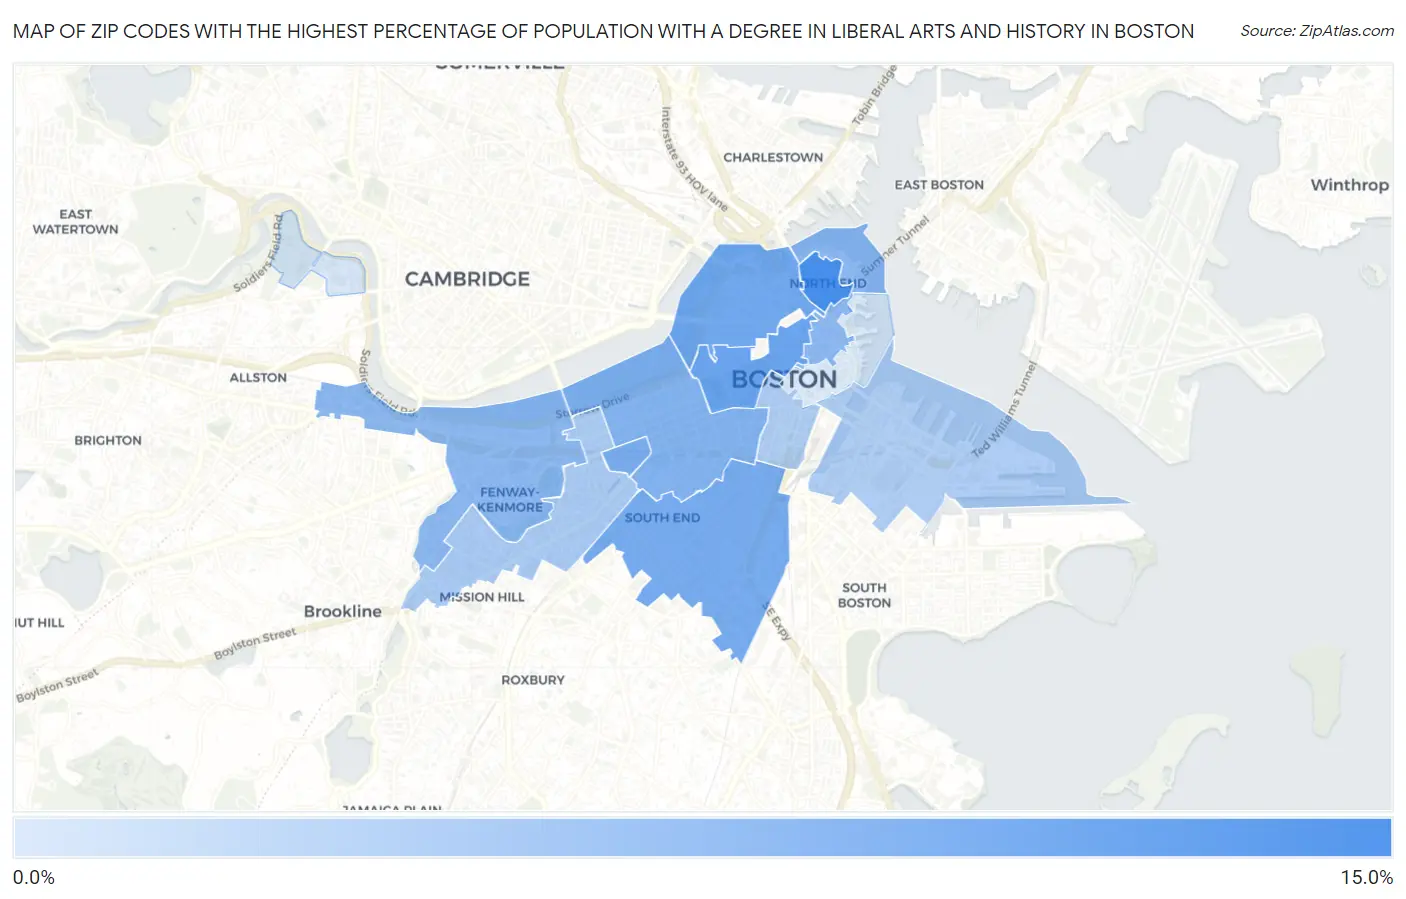
Map of Zip Codes with the Highest Percentage of Population with a Degree in Liberal Arts and History in Boston
1.1%
11.1%
Zip Codes with the Highest Percentage of Population with a Degree in Liberal Arts and History in Boston, MA
| Zip Code | % Graduates | vs State | vs National | |
| 1. | 02113 | 11.1% | 5.5%(+5.60)#34 | 4.9%(+6.21)#2,528 |
| 2. | 02108 | 8.5% | 5.5%(+3.02)#84 | 4.9%(+3.63)#4,335 |
| 3. | 02114 | 8.0% | 5.5%(+2.56)#98 | 4.9%(+3.17)#4,846 |
| 4. | 02118 | 7.8% | 5.5%(+2.29)#113 | 4.9%(+2.90)#5,209 |
| 5. | 02199 | 7.5% | 5.5%(+2.02)#123 | 4.9%(+2.63)#5,577 |
| 6. | 02116 | 7.0% | 5.5%(+1.55)#142 | 4.9%(+2.15)#6,348 |
| 7. | 02109 | 6.3% | 5.5%(+0.854)#169 | 4.9%(+1.46)#7,701 |
| 8. | 02215 | 6.3% | 5.5%(+0.846)#172 | 4.9%(+1.45)#7,726 |
| 9. | 02115 | 4.3% | 5.5%(-1.14)#326 | 4.9%(-0.534)#13,511 |
| 10. | 02111 | 4.1% | 5.5%(-1.41)#347 | 4.9%(-0.801)#14,508 |
| 11. | 02210 | 4.0% | 5.5%(-1.47)#350 | 4.9%(-0.863)#14,739 |
| 12. | 02163 | 1.4% | 5.5%(-4.11)#482 | 4.9%(-3.50)#22,737 |
| 13. | 02110 | 1.1% | 5.5%(-4.39)#485 | 4.9%(-3.78)#23,230 |
1
Common Questions
What are the Top 10 Zip Codes with the Highest Percentage of Population with a Degree in Liberal Arts and History in Boston, MA?
Top 10 Zip Codes with the Highest Percentage of Population with a Degree in Liberal Arts and History in Boston, MA are:
What zip code has the Highest Percentage of Population with a Degree in Liberal Arts and History in Boston, MA?
02113 has the Highest Percentage of Population with a Degree in Liberal Arts and History in Boston, MA with 11.1%.
What is the Percentage of Population with a Degree in Liberal Arts and History in Boston, MA?
Percentage of Population with a Degree in Liberal Arts and History in Boston is 6.3%.
What is the Percentage of Population with a Degree in Liberal Arts and History in Massachusetts?
Percentage of Population with a Degree in Liberal Arts and History in Massachusetts is 5.5%.
What is the Percentage of Population with a Degree in Liberal Arts and History in the United States?
Percentage of Population with a Degree in Liberal Arts and History in the United States is 4.9%.