Zip Codes with the Highest Percentage of Population with a Degree in Liberal Arts and History in Quincy, MA
RELATED REPORTS & OPTIONS
Liberal Arts and History
Quincy
Compare Zip Codes
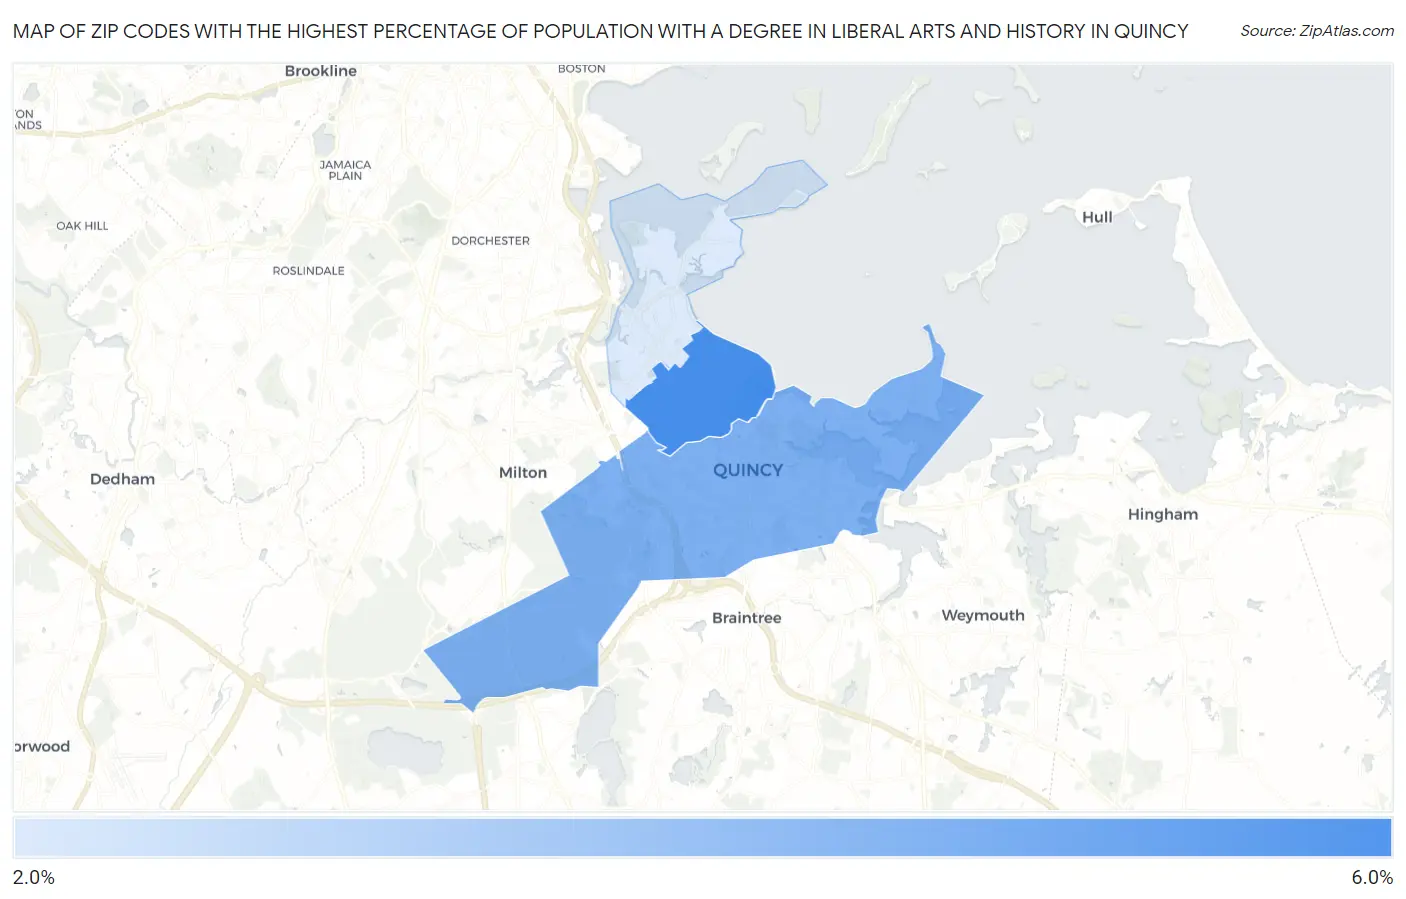
Map of Zip Codes with the Highest Percentage of Population with a Degree in Liberal Arts and History in Quincy
3.0%
5.5%
Zip Codes with the Highest Percentage of Population with a Degree in Liberal Arts and History in Quincy, MA
| Zip Code | % Graduates | vs State | vs National | |
| 1. | 02170 | 5.5% | 5.5%(+0.049)#229 | 4.9%(+0.658)#9,793 |
| 2. | 02169 | 4.6% | 5.5%(-0.846)#308 | 4.9%(-0.237)#12,536 |
| 3. | 02171 | 3.0% | 5.5%(-2.48)#428 | 4.9%(-1.87)#18,368 |
1
Common Questions
What are the Top Zip Codes with the Highest Percentage of Population with a Degree in Liberal Arts and History in Quincy, MA?
Top Zip Codes with the Highest Percentage of Population with a Degree in Liberal Arts and History in Quincy, MA are:
What zip code has the Highest Percentage of Population with a Degree in Liberal Arts and History in Quincy, MA?
02170 has the Highest Percentage of Population with a Degree in Liberal Arts and History in Quincy, MA with 5.5%.
What is the Percentage of Population with a Degree in Liberal Arts and History in Quincy, MA?
Percentage of Population with a Degree in Liberal Arts and History in Quincy is 4.4%.
What is the Percentage of Population with a Degree in Liberal Arts and History in Massachusetts?
Percentage of Population with a Degree in Liberal Arts and History in Massachusetts is 5.5%.
What is the Percentage of Population with a Degree in Liberal Arts and History in the United States?
Percentage of Population with a Degree in Liberal Arts and History in the United States is 4.9%.