Zip Codes with the Highest Percentage of Population with a Degree in Visual and Performing Arts in Fall River, MA
RELATED REPORTS & OPTIONS
Visual and Performing Arts
Fall River
Compare Zip Codes
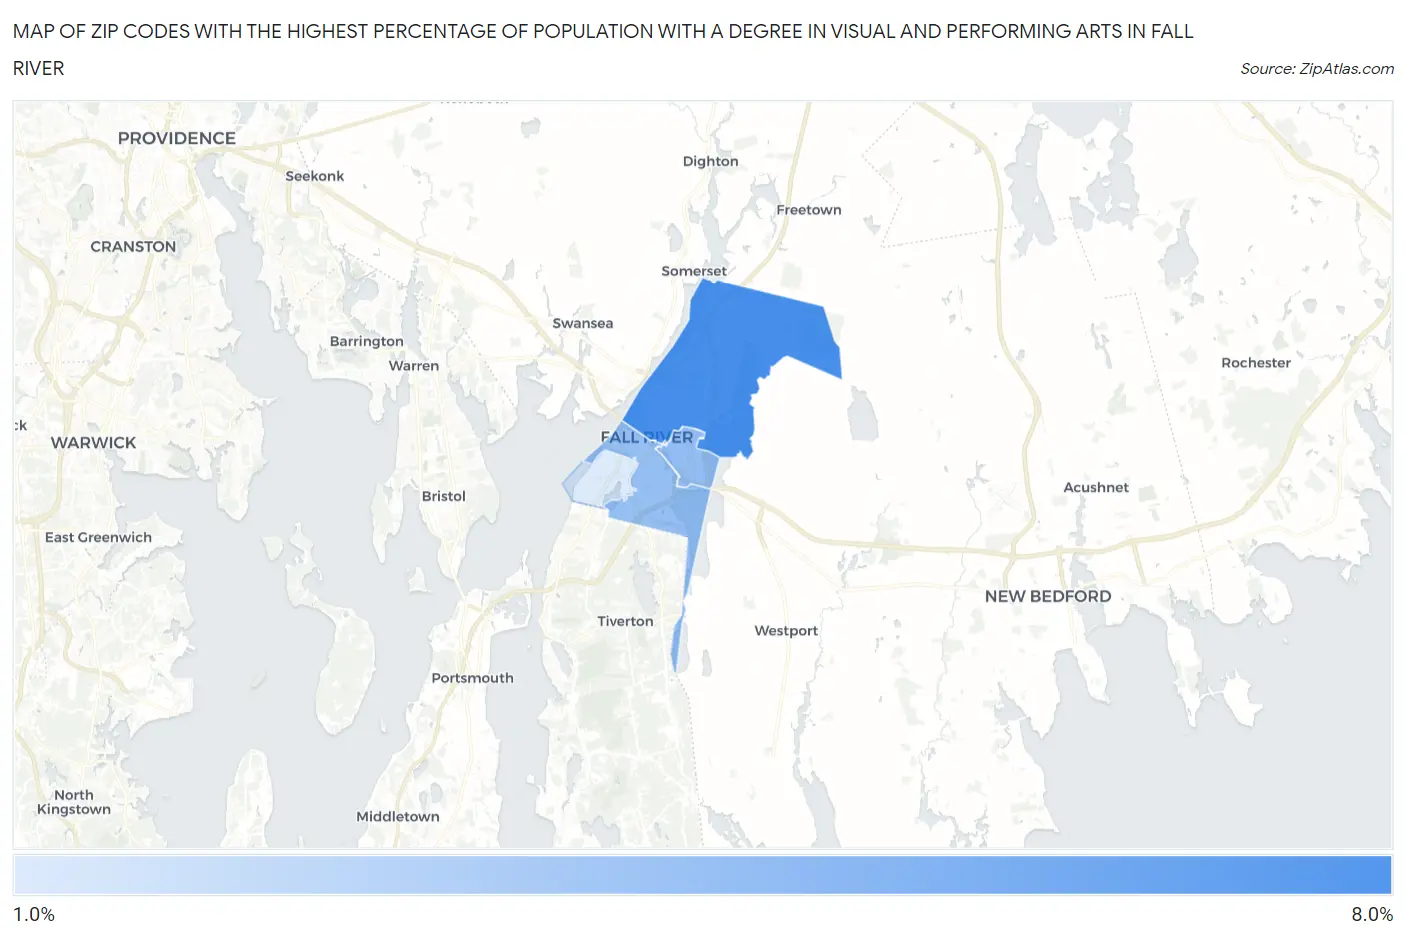
Map of Zip Codes with the Highest Percentage of Population with a Degree in Visual and Performing Arts in Fall River
2.0%
6.6%
Zip Codes with the Highest Percentage of Population with a Degree in Visual and Performing Arts in Fall River, MA
| Zip Code | % Graduates | vs State | vs National | |
| 1. | 02720 | 6.6% | 4.7%(+1.89)#105 | 4.3%(+2.35)#4,120 |
| 2. | 02723 | 4.2% | 4.7%(-0.526)#265 | 4.3%(-0.063)#8,653 |
| 3. | 02721 | 4.2% | 4.7%(-0.545)#267 | 4.3%(-0.082)#8,717 |
| 4. | 02724 | 2.0% | 4.7%(-2.75)#436 | 4.3%(-2.29)#16,563 |
1
Common Questions
What are the Top 3 Zip Codes with the Highest Percentage of Population with a Degree in Visual and Performing Arts in Fall River, MA?
Top 3 Zip Codes with the Highest Percentage of Population with a Degree in Visual and Performing Arts in Fall River, MA are:
What zip code has the Highest Percentage of Population with a Degree in Visual and Performing Arts in Fall River, MA?
02720 has the Highest Percentage of Population with a Degree in Visual and Performing Arts in Fall River, MA with 6.6%.
What is the Percentage of Population with a Degree in Visual and Performing Arts in Fall River, MA?
Percentage of Population with a Degree in Visual and Performing Arts in Fall River is 4.8%.
What is the Percentage of Population with a Degree in Visual and Performing Arts in Massachusetts?
Percentage of Population with a Degree in Visual and Performing Arts in Massachusetts is 4.7%.
What is the Percentage of Population with a Degree in Visual and Performing Arts in the United States?
Percentage of Population with a Degree in Visual and Performing Arts in the United States is 4.3%.