Zip Codes with the Highest Percentage of Households Without a Vehicle in Fall River, MA
RELATED REPORTS & OPTIONS
Households without a Cars
Fall River
Compare Zip Codes
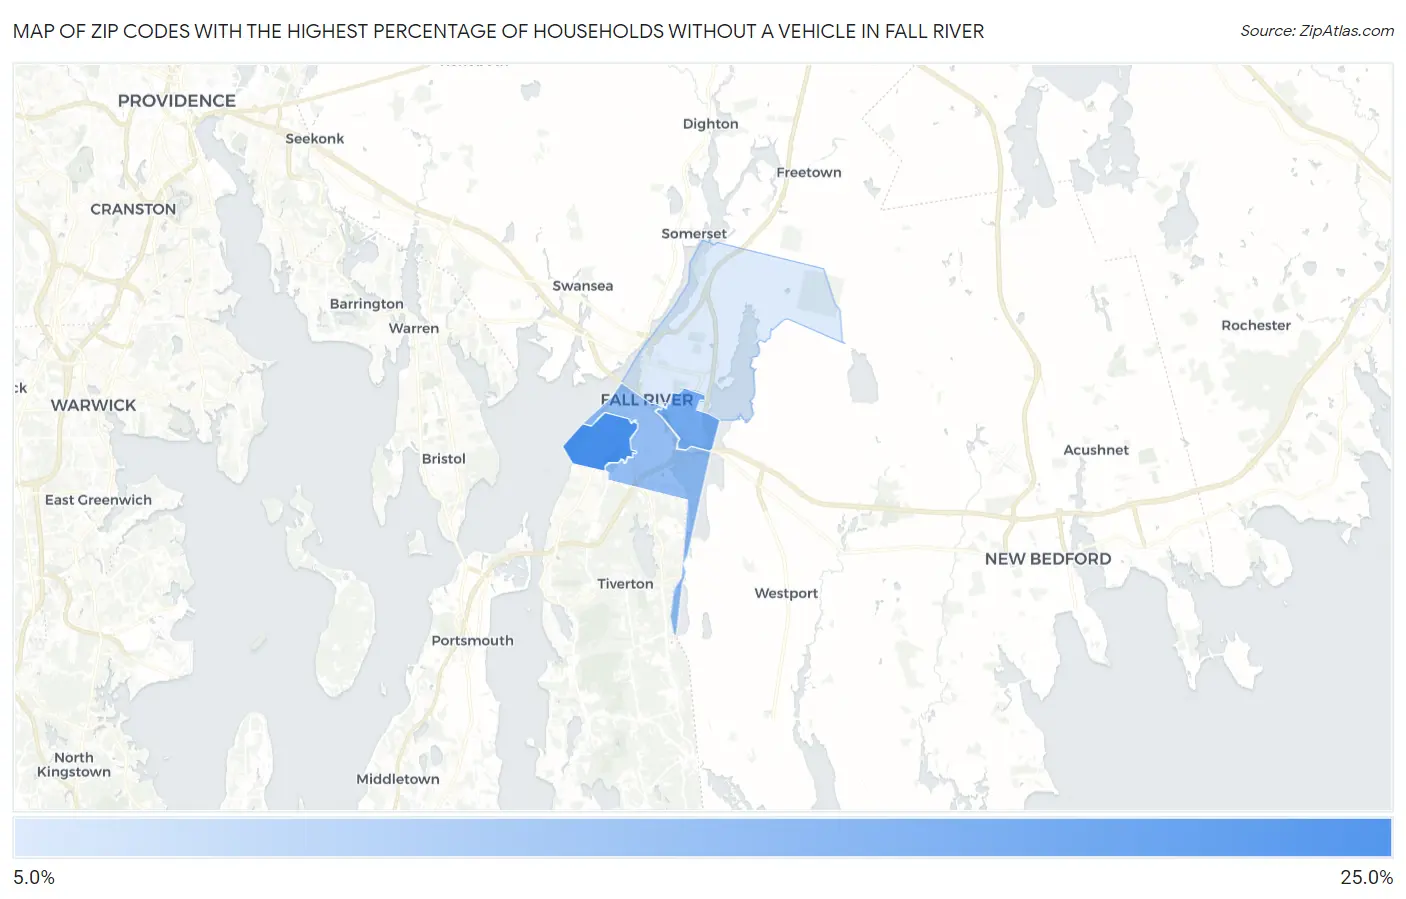
Map of Zip Codes with the Highest Percentage of Households Without a Vehicle in Fall River
11.2%
21.9%
Zip Codes with the Highest Percentage of Households Without a Vehicle in Fall River, MA
| Zip Code | Housholds Without a Car | vs State | vs National | |
| 1. | 02724 | 21.9% | 11.9%(+10.00)#48 | 8.3%(+13.6)#1,305 |
| 2. | 02723 | 18.6% | 11.9%(+6.70)#58 | 8.3%(+10.3)#1,696 |
| 3. | 02721 | 16.4% | 11.9%(+4.50)#70 | 8.3%(+8.10)#2,075 |
| 4. | 02720 | 11.2% | 11.9%(-0.700)#110 | 8.3%(+2.90)#4,014 |
1
Common Questions
What are the Top 3 Zip Codes with the Highest Percentage of Households Without a Vehicle in Fall River, MA?
Top 3 Zip Codes with the Highest Percentage of Households Without a Vehicle in Fall River, MA are:
What zip code has the Highest Percentage of Households Without a Vehicle in Fall River, MA?
02724 has the Highest Percentage of Households Without a Vehicle in Fall River, MA with 21.9%.
What is the Percentage of Households Without a Vehicle in Fall River, MA?
Percentage of Households Without a Vehicle in Fall River is 16.1%.
What is the Percentage of Households Without a Vehicle in Massachusetts?
Percentage of Households Without a Vehicle in Massachusetts is 11.9%.
What is the Percentage of Households Without a Vehicle in the United States?
Percentage of Households Without a Vehicle in the United States is 8.3%.