Immigrants from Poland vs Sioux In Labor Force | Age 16-19
COMPARE
Immigrants from Poland
Sioux
In Labor Force | Age 16-19
In Labor Force | Age 16-19 Comparison
Immigrants from Poland
Sioux
37.3%
IN LABOR FORCE | AGE 16-19
84.4/ 100
METRIC RATING
151st/ 347
METRIC RANK
41.5%
IN LABOR FORCE | AGE 16-19
100.0/ 100
METRIC RATING
38th/ 347
METRIC RANK
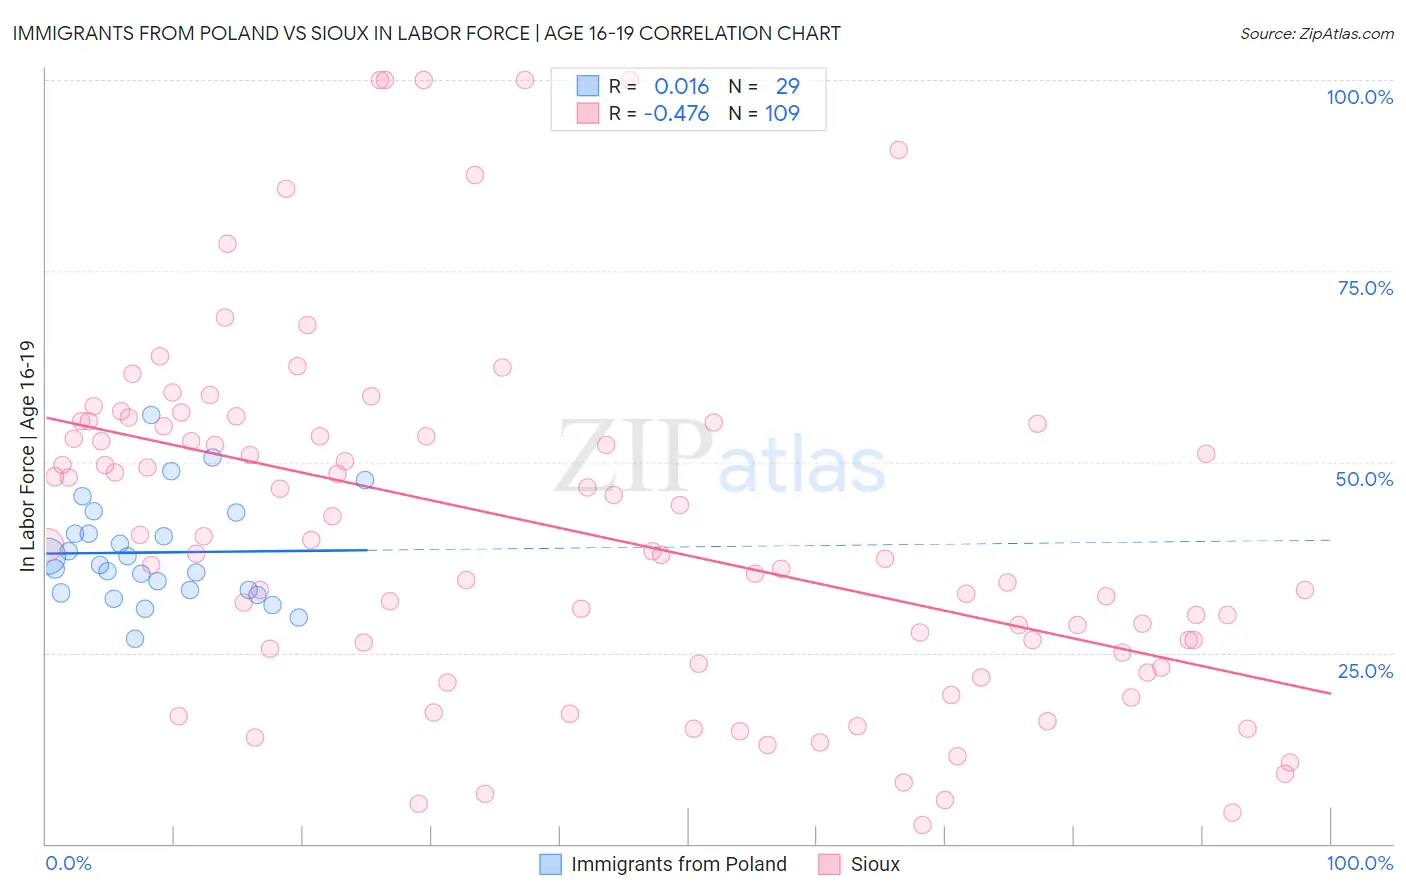
Immigrants from Poland vs Sioux In Labor Force | Age 16-19 Correlation Chart
The statistical analysis conducted on geographies consisting of 304,422,201 people shows no correlation between the proportion of Immigrants from Poland and labor force participation rate among population between the ages 16 and 19 in the United States with a correlation coefficient (R) of 0.016 and weighted average of 37.3%. Similarly, the statistical analysis conducted on geographies consisting of 233,888,038 people shows a moderate negative correlation between the proportion of Sioux and labor force participation rate among population between the ages 16 and 19 in the United States with a correlation coefficient (R) of -0.476 and weighted average of 41.5%, a difference of 11.3%.
In Labor Force | Age 16-19 Correlation Summary
| Measurement | Immigrants from Poland | Sioux |
| Minimum | 26.8% | 2.4% |
| Maximum | 56.2% | 100.0% |
| Range | 29.4% | 97.6% |
| Mean | 38.1% | 41.1% |
| Median | 36.4% | 38.3% |
| Interquartile 25% (IQ1) | 33.1% | 24.2% |
| Interquartile 75% (IQ3) | 42.0% | 54.9% |
| Interquartile Range (IQR) | 9.0% | 30.6% |
| Standard Deviation (Sample) | 6.8% | 23.0% |
| Standard Deviation (Population) | 6.7% | 22.9% |
Similar Demographics by In Labor Force | Age 16-19
Demographics Similar to Immigrants from Poland by In Labor Force | Age 16-19
In terms of in labor force | age 16-19, the demographic groups most similar to Immigrants from Poland are Tsimshian (37.4%, a difference of 0.030%), Native Hawaiian (37.4%, a difference of 0.050%), Immigrants from Sierra Leone (37.3%, a difference of 0.070%), Arapaho (37.3%, a difference of 0.23%), and Immigrants from Bulgaria (37.3%, a difference of 0.25%).
| Demographics | Rating | Rank | In Labor Force | Age 16-19 |
| Japanese | 89.3 /100 | #144 | Excellent 37.5% |
| Paiute | 89.3 /100 | #145 | Excellent 37.5% |
| Immigrants | Western Europe | 88.9 /100 | #146 | Excellent 37.5% |
| Brazilians | 88.7 /100 | #147 | Excellent 37.5% |
| Romanians | 87.3 /100 | #148 | Excellent 37.5% |
| Native Hawaiians | 85.0 /100 | #149 | Excellent 37.4% |
| Tsimshian | 84.7 /100 | #150 | Excellent 37.4% |
| Immigrants | Poland | 84.4 /100 | #151 | Excellent 37.3% |
| Immigrants | Sierra Leone | 83.6 /100 | #152 | Excellent 37.3% |
| Arapaho | 81.8 /100 | #153 | Excellent 37.3% |
| Immigrants | Bulgaria | 81.6 /100 | #154 | Excellent 37.3% |
| Immigrants | Lithuania | 80.7 /100 | #155 | Excellent 37.2% |
| Kiowa | 80.4 /100 | #156 | Excellent 37.2% |
| Immigrants | Brazil | 76.5 /100 | #157 | Good 37.1% |
| Ute | 75.7 /100 | #158 | Good 37.1% |
Demographics Similar to Sioux by In Labor Force | Age 16-19
In terms of in labor force | age 16-19, the demographic groups most similar to Sioux are Scotch-Irish (41.5%, a difference of 0.14%), Immigrants from Liberia (41.5%, a difference of 0.23%), Immigrants from Congo (41.7%, a difference of 0.35%), Immigrants from the Azores (41.7%, a difference of 0.42%), and Yugoslavian (41.8%, a difference of 0.57%).
| Demographics | Rating | Rank | In Labor Force | Age 16-19 |
| Irish | 100.0 /100 | #31 | Exceptional 42.0% |
| Czechoslovakians | 100.0 /100 | #32 | Exceptional 41.9% |
| Liberians | 100.0 /100 | #33 | Exceptional 41.8% |
| Immigrants | Bosnia and Herzegovina | 100.0 /100 | #34 | Exceptional 41.8% |
| Yugoslavians | 100.0 /100 | #35 | Exceptional 41.8% |
| Immigrants | Azores | 100.0 /100 | #36 | Exceptional 41.7% |
| Immigrants | Congo | 100.0 /100 | #37 | Exceptional 41.7% |
| Sioux | 100.0 /100 | #38 | Exceptional 41.5% |
| Scotch-Irish | 100.0 /100 | #39 | Exceptional 41.5% |
| Immigrants | Liberia | 100.0 /100 | #40 | Exceptional 41.5% |
| Celtics | 100.0 /100 | #41 | Exceptional 41.3% |
| Whites/Caucasians | 100.0 /100 | #42 | Exceptional 41.3% |
| Tongans | 100.0 /100 | #43 | Exceptional 41.2% |
| Europeans | 100.0 /100 | #44 | Exceptional 41.1% |
| Croatians | 100.0 /100 | #45 | Exceptional 41.1% |