Immigrants from Denmark vs Sioux In Labor Force | Age 16-19
COMPARE
Immigrants from Denmark
Sioux
In Labor Force | Age 16-19
In Labor Force | Age 16-19 Comparison
Immigrants from Denmark
Sioux
36.1%
IN LABOR FORCE | AGE 16-19
25.0/ 100
METRIC RATING
193rd/ 347
METRIC RANK
41.5%
IN LABOR FORCE | AGE 16-19
100.0/ 100
METRIC RATING
38th/ 347
METRIC RANK
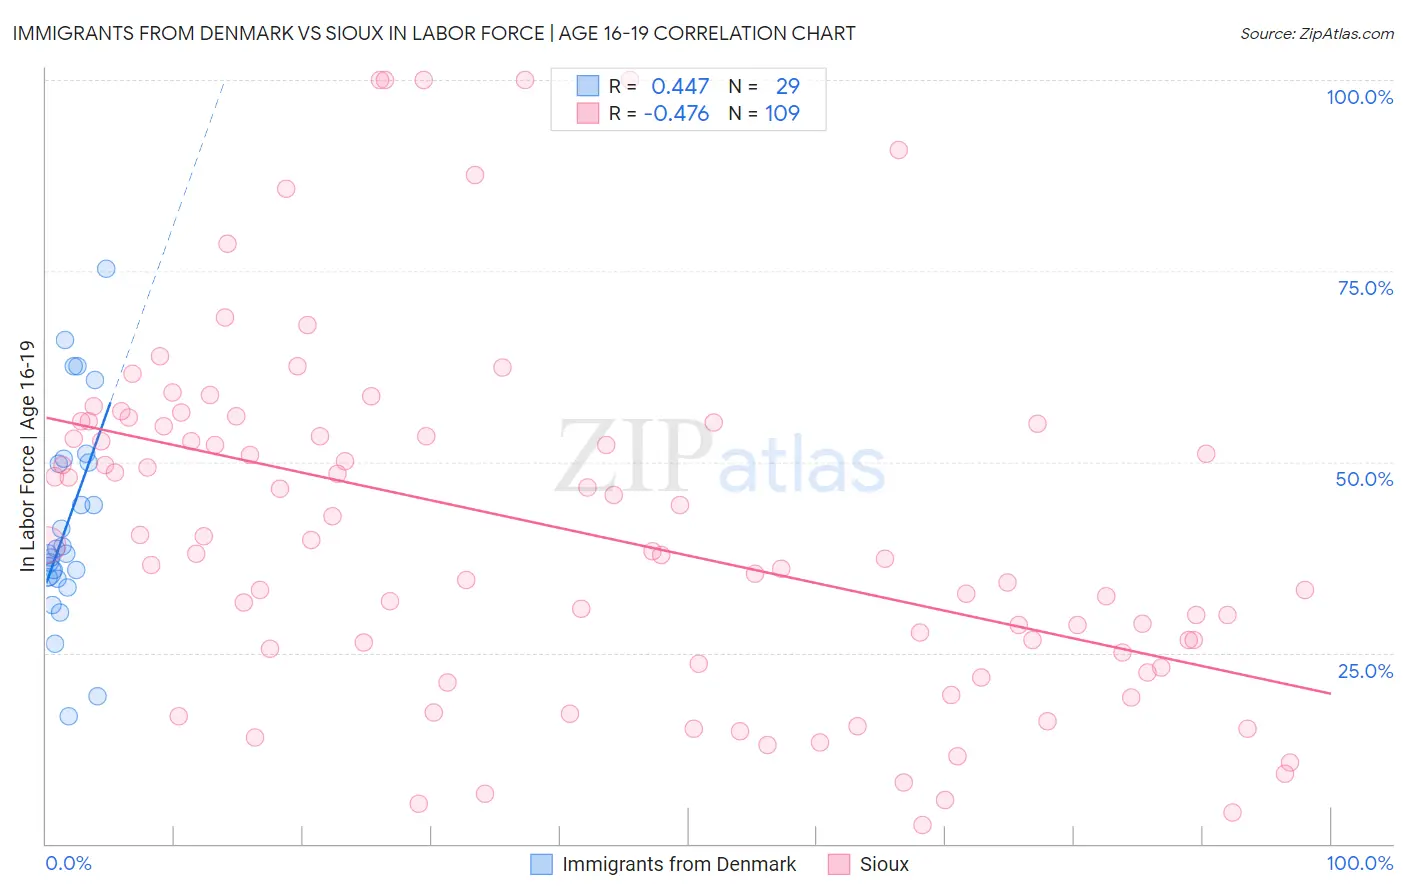
Immigrants from Denmark vs Sioux In Labor Force | Age 16-19 Correlation Chart
The statistical analysis conducted on geographies consisting of 136,287,705 people shows a moderate positive correlation between the proportion of Immigrants from Denmark and labor force participation rate among population between the ages 16 and 19 in the United States with a correlation coefficient (R) of 0.447 and weighted average of 36.1%. Similarly, the statistical analysis conducted on geographies consisting of 233,888,038 people shows a moderate negative correlation between the proportion of Sioux and labor force participation rate among population between the ages 16 and 19 in the United States with a correlation coefficient (R) of -0.476 and weighted average of 41.5%, a difference of 15.2%.
In Labor Force | Age 16-19 Correlation Summary
| Measurement | Immigrants from Denmark | Sioux |
| Minimum | 16.7% | 2.4% |
| Maximum | 75.3% | 100.0% |
| Range | 58.6% | 97.6% |
| Mean | 42.1% | 41.1% |
| Median | 38.0% | 38.3% |
| Interquartile 25% (IQ1) | 34.8% | 24.2% |
| Interquartile 75% (IQ3) | 50.2% | 54.9% |
| Interquartile Range (IQR) | 15.4% | 30.6% |
| Standard Deviation (Sample) | 13.6% | 23.0% |
| Standard Deviation (Population) | 13.4% | 22.9% |
Similar Demographics by In Labor Force | Age 16-19
Demographics Similar to Immigrants from Denmark by In Labor Force | Age 16-19
In terms of in labor force | age 16-19, the demographic groups most similar to Immigrants from Denmark are Nigerian (36.1%, a difference of 0.030%), Afghan (36.1%, a difference of 0.040%), Bolivian (36.0%, a difference of 0.12%), Immigrants from Croatia (36.1%, a difference of 0.17%), and Panamanian (36.1%, a difference of 0.23%).
| Demographics | Rating | Rank | In Labor Force | Age 16-19 |
| Immigrants | Romania | 34.0 /100 | #186 | Fair 36.3% |
| Immigrants | Afghanistan | 34.0 /100 | #187 | Fair 36.3% |
| Immigrants | Europe | 31.8 /100 | #188 | Fair 36.2% |
| Immigrants | Hungary | 28.8 /100 | #189 | Fair 36.2% |
| Panamanians | 28.6 /100 | #190 | Fair 36.1% |
| Immigrants | Croatia | 27.5 /100 | #191 | Fair 36.1% |
| Afghans | 25.7 /100 | #192 | Fair 36.1% |
| Immigrants | Denmark | 25.0 /100 | #193 | Fair 36.1% |
| Nigerians | 24.6 /100 | #194 | Fair 36.1% |
| Bolivians | 23.3 /100 | #195 | Fair 36.0% |
| Mexican American Indians | 21.1 /100 | #196 | Fair 36.0% |
| Immigrants | Serbia | 21.0 /100 | #197 | Fair 36.0% |
| Immigrants | Northern Africa | 19.9 /100 | #198 | Poor 35.9% |
| Immigrants | Norway | 19.8 /100 | #199 | Poor 35.9% |
| Immigrants | Sweden | 18.8 /100 | #200 | Poor 35.9% |
Demographics Similar to Sioux by In Labor Force | Age 16-19
In terms of in labor force | age 16-19, the demographic groups most similar to Sioux are Scotch-Irish (41.5%, a difference of 0.14%), Immigrants from Liberia (41.5%, a difference of 0.23%), Immigrants from Congo (41.7%, a difference of 0.35%), Immigrants from the Azores (41.7%, a difference of 0.42%), and Yugoslavian (41.8%, a difference of 0.57%).
| Demographics | Rating | Rank | In Labor Force | Age 16-19 |
| Irish | 100.0 /100 | #31 | Exceptional 42.0% |
| Czechoslovakians | 100.0 /100 | #32 | Exceptional 41.9% |
| Liberians | 100.0 /100 | #33 | Exceptional 41.8% |
| Immigrants | Bosnia and Herzegovina | 100.0 /100 | #34 | Exceptional 41.8% |
| Yugoslavians | 100.0 /100 | #35 | Exceptional 41.8% |
| Immigrants | Azores | 100.0 /100 | #36 | Exceptional 41.7% |
| Immigrants | Congo | 100.0 /100 | #37 | Exceptional 41.7% |
| Sioux | 100.0 /100 | #38 | Exceptional 41.5% |
| Scotch-Irish | 100.0 /100 | #39 | Exceptional 41.5% |
| Immigrants | Liberia | 100.0 /100 | #40 | Exceptional 41.5% |
| Celtics | 100.0 /100 | #41 | Exceptional 41.3% |
| Whites/Caucasians | 100.0 /100 | #42 | Exceptional 41.3% |
| Tongans | 100.0 /100 | #43 | Exceptional 41.2% |
| Europeans | 100.0 /100 | #44 | Exceptional 41.1% |
| Croatians | 100.0 /100 | #45 | Exceptional 41.1% |