Immigrants from Poland vs Immigrants from Lithuania In Labor Force | Age 16-19
COMPARE
Immigrants from Poland
Immigrants from Lithuania
In Labor Force | Age 16-19
In Labor Force | Age 16-19 Comparison
Immigrants from Poland
Immigrants from Lithuania
37.3%
IN LABOR FORCE | AGE 16-19
84.4/ 100
METRIC RATING
151st/ 347
METRIC RANK
37.2%
IN LABOR FORCE | AGE 16-19
80.7/ 100
METRIC RATING
155th/ 347
METRIC RANK
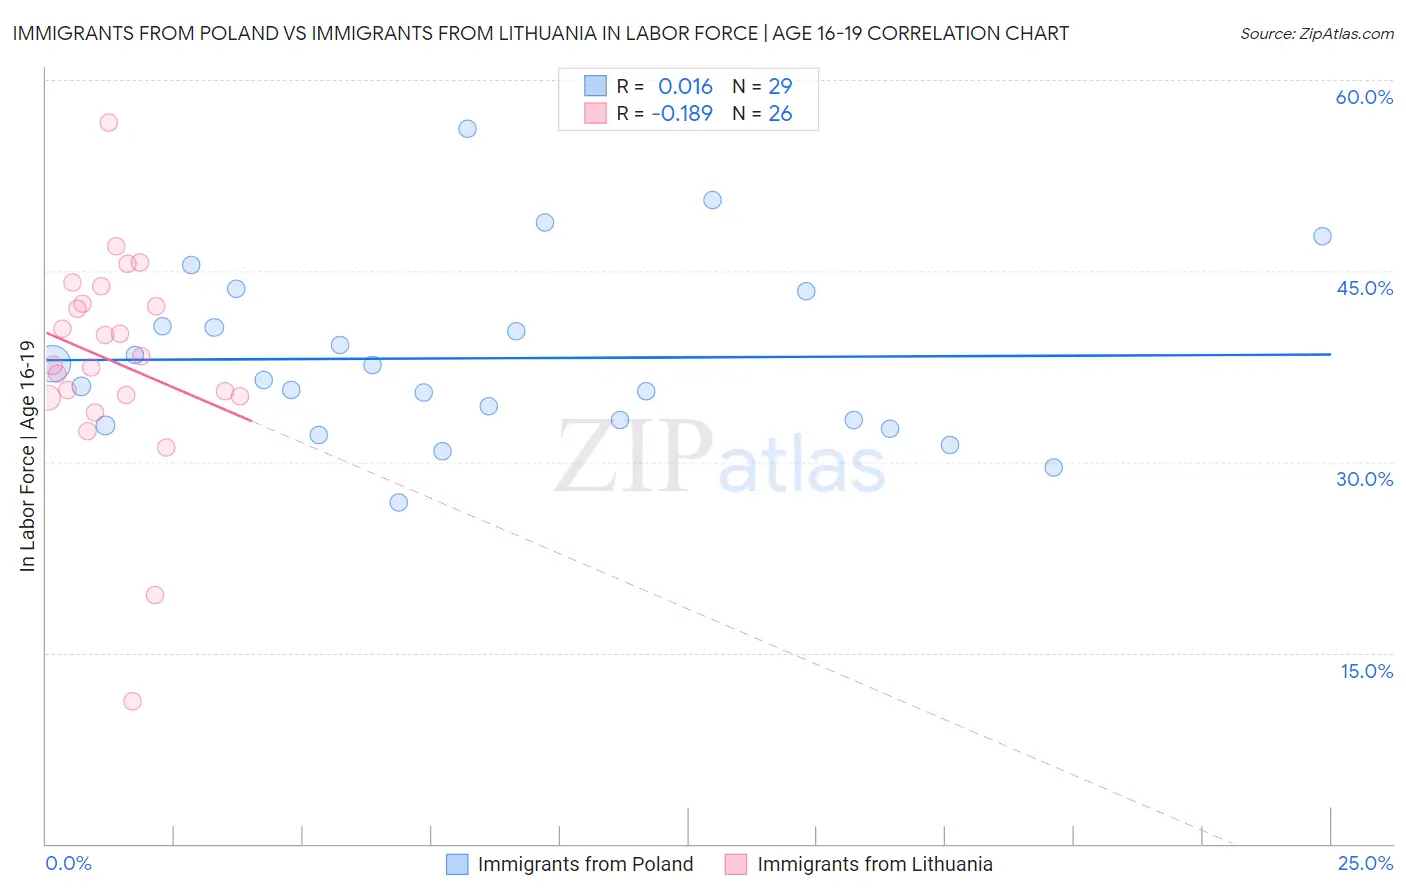
Immigrants from Poland vs Immigrants from Lithuania In Labor Force | Age 16-19 Correlation Chart
The statistical analysis conducted on geographies consisting of 304,422,201 people shows no correlation between the proportion of Immigrants from Poland and labor force participation rate among population between the ages 16 and 19 in the United States with a correlation coefficient (R) of 0.016 and weighted average of 37.3%. Similarly, the statistical analysis conducted on geographies consisting of 117,641,154 people shows a poor negative correlation between the proportion of Immigrants from Lithuania and labor force participation rate among population between the ages 16 and 19 in the United States with a correlation coefficient (R) of -0.189 and weighted average of 37.2%, a difference of 0.32%.
In Labor Force | Age 16-19 Correlation Summary
| Measurement | Immigrants from Poland | Immigrants from Lithuania |
| Minimum | 26.8% | 11.2% |
| Maximum | 56.2% | 56.7% |
| Range | 29.4% | 45.5% |
| Mean | 38.1% | 37.9% |
| Median | 36.4% | 37.9% |
| Interquartile 25% (IQ1) | 33.1% | 35.1% |
| Interquartile 75% (IQ3) | 42.0% | 42.5% |
| Interquartile Range (IQR) | 9.0% | 7.3% |
| Standard Deviation (Sample) | 6.8% | 8.7% |
| Standard Deviation (Population) | 6.7% | 8.5% |
Demographics Similar to Immigrants from Poland and Immigrants from Lithuania by In Labor Force | Age 16-19
In terms of in labor force | age 16-19, the demographic groups most similar to Immigrants from Poland are Tsimshian (37.4%, a difference of 0.030%), Native Hawaiian (37.4%, a difference of 0.050%), Immigrants from Sierra Leone (37.3%, a difference of 0.070%), Arapaho (37.3%, a difference of 0.23%), and Immigrants from Bulgaria (37.3%, a difference of 0.25%). Similarly, the demographic groups most similar to Immigrants from Lithuania are Kiowa (37.2%, a difference of 0.020%), Immigrants from Bulgaria (37.3%, a difference of 0.070%), Arapaho (37.3%, a difference of 0.090%), Immigrants from Sierra Leone (37.3%, a difference of 0.25%), and Immigrants from Brazil (37.1%, a difference of 0.31%).
| Demographics | Rating | Rank | In Labor Force | Age 16-19 |
| Pakistanis | 89.5 /100 | #143 | Excellent 37.6% |
| Japanese | 89.3 /100 | #144 | Excellent 37.5% |
| Paiute | 89.3 /100 | #145 | Excellent 37.5% |
| Immigrants | Western Europe | 88.9 /100 | #146 | Excellent 37.5% |
| Brazilians | 88.7 /100 | #147 | Excellent 37.5% |
| Romanians | 87.3 /100 | #148 | Excellent 37.5% |
| Native Hawaiians | 85.0 /100 | #149 | Excellent 37.4% |
| Tsimshian | 84.7 /100 | #150 | Excellent 37.4% |
| Immigrants | Poland | 84.4 /100 | #151 | Excellent 37.3% |
| Immigrants | Sierra Leone | 83.6 /100 | #152 | Excellent 37.3% |
| Arapaho | 81.8 /100 | #153 | Excellent 37.3% |
| Immigrants | Bulgaria | 81.6 /100 | #154 | Excellent 37.3% |
| Immigrants | Lithuania | 80.7 /100 | #155 | Excellent 37.2% |
| Kiowa | 80.4 /100 | #156 | Excellent 37.2% |
| Immigrants | Brazil | 76.5 /100 | #157 | Good 37.1% |
| Ute | 75.7 /100 | #158 | Good 37.1% |
| Yaqui | 74.4 /100 | #159 | Good 37.1% |
| Immigrants | Saudi Arabia | 73.9 /100 | #160 | Good 37.0% |
| Cambodians | 71.5 /100 | #161 | Good 37.0% |
| Immigrants | Jordan | 69.5 /100 | #162 | Good 36.9% |
| Bermudans | 69.3 /100 | #163 | Good 36.9% |