Immigrants from Poland vs Australian In Labor Force | Age 16-19
COMPARE
Immigrants from Poland
Australian
In Labor Force | Age 16-19
In Labor Force | Age 16-19 Comparison
Immigrants from Poland
Australians
37.3%
IN LABOR FORCE | AGE 16-19
84.4/ 100
METRIC RATING
151st/ 347
METRIC RANK
37.8%
IN LABOR FORCE | AGE 16-19
93.2/ 100
METRIC RATING
136th/ 347
METRIC RANK
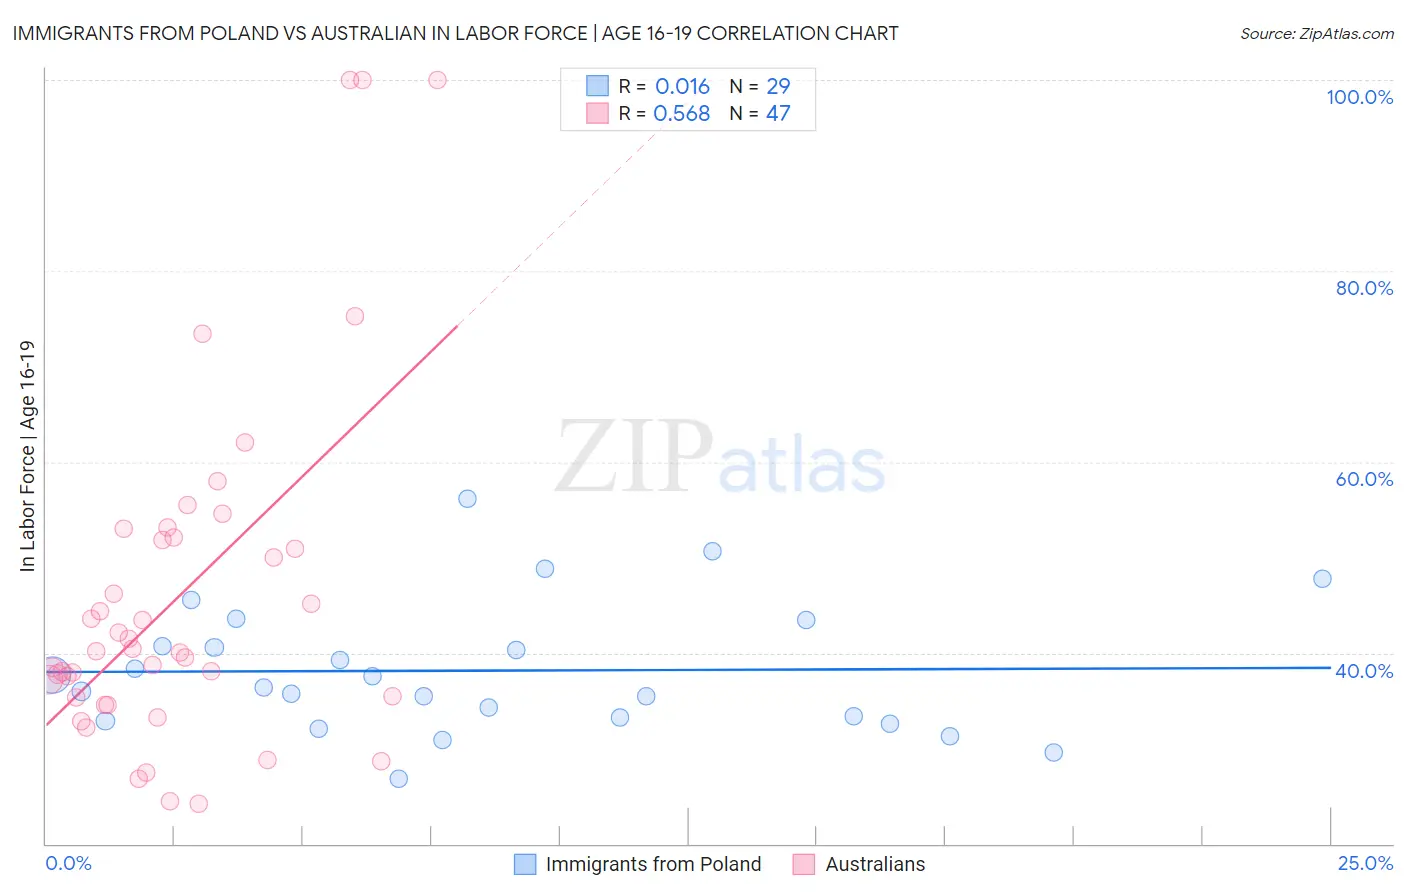
Immigrants from Poland vs Australian In Labor Force | Age 16-19 Correlation Chart
The statistical analysis conducted on geographies consisting of 304,422,201 people shows no correlation between the proportion of Immigrants from Poland and labor force participation rate among population between the ages 16 and 19 in the United States with a correlation coefficient (R) of 0.016 and weighted average of 37.3%. Similarly, the statistical analysis conducted on geographies consisting of 223,900,853 people shows a substantial positive correlation between the proportion of Australians and labor force participation rate among population between the ages 16 and 19 in the United States with a correlation coefficient (R) of 0.568 and weighted average of 37.8%, a difference of 1.1%.
In Labor Force | Age 16-19 Correlation Summary
| Measurement | Immigrants from Poland | Australian |
| Minimum | 26.8% | 24.2% |
| Maximum | 56.2% | 100.0% |
| Range | 29.4% | 75.8% |
| Mean | 38.1% | 45.9% |
| Median | 36.4% | 40.1% |
| Interquartile 25% (IQ1) | 33.1% | 35.3% |
| Interquartile 75% (IQ3) | 42.0% | 52.1% |
| Interquartile Range (IQR) | 9.0% | 16.8% |
| Standard Deviation (Sample) | 6.8% | 18.1% |
| Standard Deviation (Population) | 6.7% | 17.9% |
Demographics Similar to Immigrants from Poland and Australians by In Labor Force | Age 16-19
In terms of in labor force | age 16-19, the demographic groups most similar to Immigrants from Poland are Tsimshian (37.4%, a difference of 0.030%), Native Hawaiian (37.4%, a difference of 0.050%), Immigrants from Sierra Leone (37.3%, a difference of 0.070%), Arapaho (37.3%, a difference of 0.23%), and Romanian (37.5%, a difference of 0.29%). Similarly, the demographic groups most similar to Australians are Cajun (37.8%, a difference of 0.0%), Macedonian (37.8%, a difference of 0.030%), Immigrants from Netherlands (37.8%, a difference of 0.090%), Comanche (37.7%, a difference of 0.23%), and Immigrants from Moldova (37.7%, a difference of 0.24%).
| Demographics | Rating | Rank | In Labor Force | Age 16-19 |
| Cheyenne | 94.6 /100 | #133 | Exceptional 37.9% |
| Immigrants | Netherlands | 93.7 /100 | #134 | Exceptional 37.8% |
| Macedonians | 93.4 /100 | #135 | Exceptional 37.8% |
| Australians | 93.2 /100 | #136 | Exceptional 37.8% |
| Cajuns | 93.2 /100 | #137 | Exceptional 37.8% |
| Comanche | 91.9 /100 | #138 | Exceptional 37.7% |
| Immigrants | Moldova | 91.9 /100 | #139 | Exceptional 37.7% |
| Estonians | 91.7 /100 | #140 | Exceptional 37.7% |
| Syrians | 90.7 /100 | #141 | Exceptional 37.6% |
| Sierra Leoneans | 89.7 /100 | #142 | Excellent 37.6% |
| Pakistanis | 89.5 /100 | #143 | Excellent 37.6% |
| Japanese | 89.3 /100 | #144 | Excellent 37.5% |
| Paiute | 89.3 /100 | #145 | Excellent 37.5% |
| Immigrants | Western Europe | 88.9 /100 | #146 | Excellent 37.5% |
| Brazilians | 88.7 /100 | #147 | Excellent 37.5% |
| Romanians | 87.3 /100 | #148 | Excellent 37.5% |
| Native Hawaiians | 85.0 /100 | #149 | Excellent 37.4% |
| Tsimshian | 84.7 /100 | #150 | Excellent 37.4% |
| Immigrants | Poland | 84.4 /100 | #151 | Excellent 37.3% |
| Immigrants | Sierra Leone | 83.6 /100 | #152 | Excellent 37.3% |
| Arapaho | 81.8 /100 | #153 | Excellent 37.3% |