Immigrants from Poland vs British West Indian In Labor Force | Age 16-19
COMPARE
Immigrants from Poland
British West Indian
In Labor Force | Age 16-19
In Labor Force | Age 16-19 Comparison
Immigrants from Poland
British West Indians
37.3%
IN LABOR FORCE | AGE 16-19
84.4/ 100
METRIC RATING
151st/ 347
METRIC RANK
29.1%
IN LABOR FORCE | AGE 16-19
0.0/ 100
METRIC RATING
340th/ 347
METRIC RANK
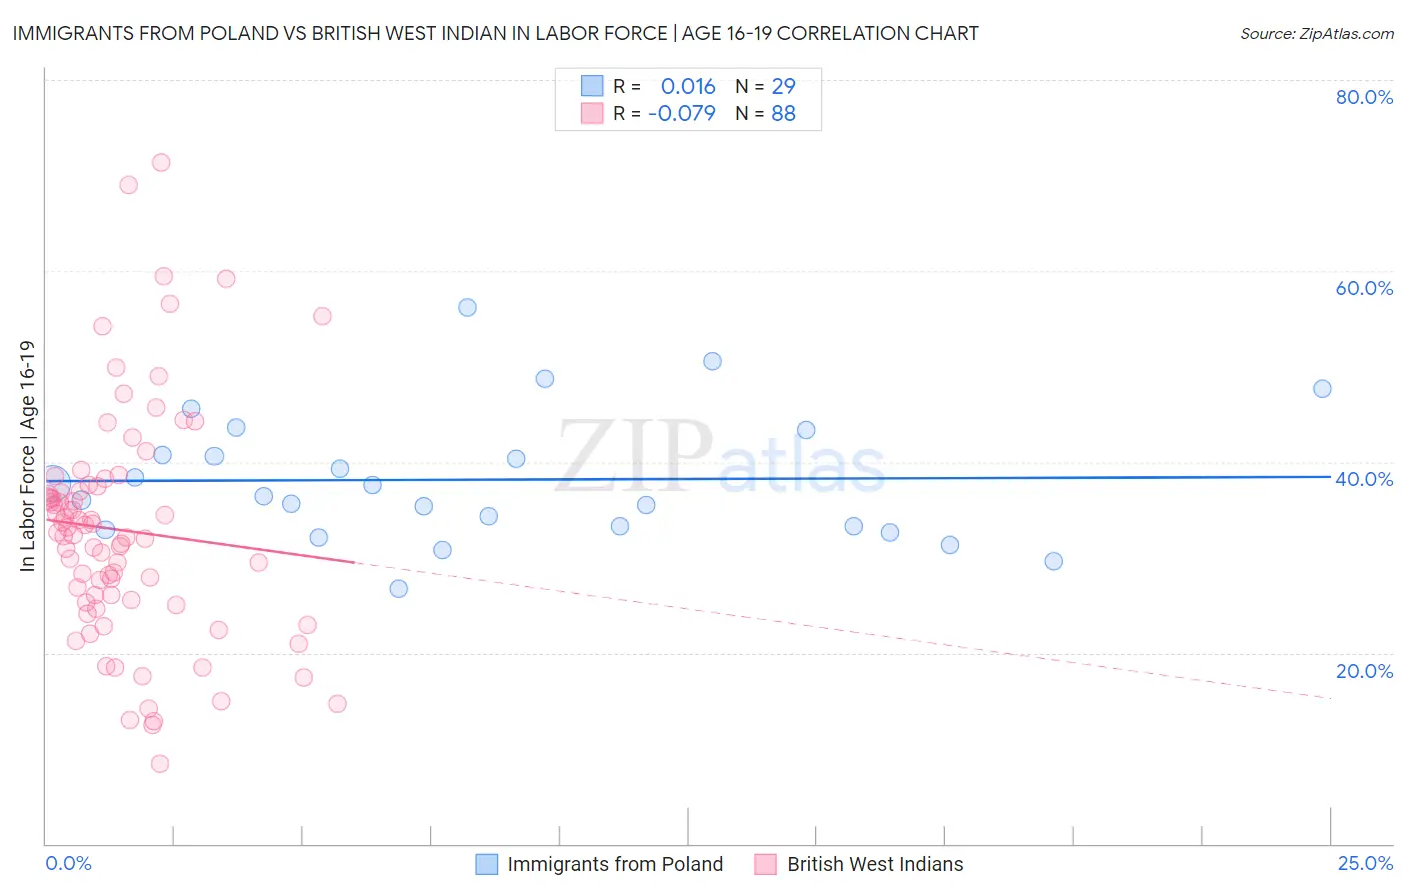
Immigrants from Poland vs British West Indian In Labor Force | Age 16-19 Correlation Chart
The statistical analysis conducted on geographies consisting of 304,422,201 people shows no correlation between the proportion of Immigrants from Poland and labor force participation rate among population between the ages 16 and 19 in the United States with a correlation coefficient (R) of 0.016 and weighted average of 37.3%. Similarly, the statistical analysis conducted on geographies consisting of 152,607,678 people shows a slight negative correlation between the proportion of British West Indians and labor force participation rate among population between the ages 16 and 19 in the United States with a correlation coefficient (R) of -0.079 and weighted average of 29.1%, a difference of 28.3%.
In Labor Force | Age 16-19 Correlation Summary
| Measurement | Immigrants from Poland | British West Indian |
| Minimum | 26.8% | 8.4% |
| Maximum | 56.2% | 71.4% |
| Range | 29.4% | 63.0% |
| Mean | 38.1% | 32.8% |
| Median | 36.4% | 32.5% |
| Interquartile 25% (IQ1) | 33.1% | 25.4% |
| Interquartile 75% (IQ3) | 42.0% | 37.2% |
| Interquartile Range (IQR) | 9.0% | 11.7% |
| Standard Deviation (Sample) | 6.8% | 12.1% |
| Standard Deviation (Population) | 6.7% | 12.0% |
Similar Demographics by In Labor Force | Age 16-19
Demographics Similar to Immigrants from Poland by In Labor Force | Age 16-19
In terms of in labor force | age 16-19, the demographic groups most similar to Immigrants from Poland are Tsimshian (37.4%, a difference of 0.030%), Native Hawaiian (37.4%, a difference of 0.050%), Immigrants from Sierra Leone (37.3%, a difference of 0.070%), Arapaho (37.3%, a difference of 0.23%), and Immigrants from Bulgaria (37.3%, a difference of 0.25%).
| Demographics | Rating | Rank | In Labor Force | Age 16-19 |
| Japanese | 89.3 /100 | #144 | Excellent 37.5% |
| Paiute | 89.3 /100 | #145 | Excellent 37.5% |
| Immigrants | Western Europe | 88.9 /100 | #146 | Excellent 37.5% |
| Brazilians | 88.7 /100 | #147 | Excellent 37.5% |
| Romanians | 87.3 /100 | #148 | Excellent 37.5% |
| Native Hawaiians | 85.0 /100 | #149 | Excellent 37.4% |
| Tsimshian | 84.7 /100 | #150 | Excellent 37.4% |
| Immigrants | Poland | 84.4 /100 | #151 | Excellent 37.3% |
| Immigrants | Sierra Leone | 83.6 /100 | #152 | Excellent 37.3% |
| Arapaho | 81.8 /100 | #153 | Excellent 37.3% |
| Immigrants | Bulgaria | 81.6 /100 | #154 | Excellent 37.3% |
| Immigrants | Lithuania | 80.7 /100 | #155 | Excellent 37.2% |
| Kiowa | 80.4 /100 | #156 | Excellent 37.2% |
| Immigrants | Brazil | 76.5 /100 | #157 | Good 37.1% |
| Ute | 75.7 /100 | #158 | Good 37.1% |
Demographics Similar to British West Indians by In Labor Force | Age 16-19
In terms of in labor force | age 16-19, the demographic groups most similar to British West Indians are Immigrants from Uzbekistan (29.2%, a difference of 0.20%), Immigrants from Armenia (29.0%, a difference of 0.23%), Immigrants from Barbados (29.0%, a difference of 0.38%), Vietnamese (29.6%, a difference of 1.6%), and Immigrants from Bangladesh (30.0%, a difference of 3.3%).
| Demographics | Rating | Rank | In Labor Force | Age 16-19 |
| Immigrants | Hong Kong | 0.0 /100 | #333 | Tragic 30.5% |
| Puerto Ricans | 0.0 /100 | #334 | Tragic 30.3% |
| Immigrants | Cuba | 0.0 /100 | #335 | Tragic 30.2% |
| Immigrants | Trinidad and Tobago | 0.0 /100 | #336 | Tragic 30.2% |
| Immigrants | Bangladesh | 0.0 /100 | #337 | Tragic 30.0% |
| Vietnamese | 0.0 /100 | #338 | Tragic 29.6% |
| Immigrants | Uzbekistan | 0.0 /100 | #339 | Tragic 29.2% |
| British West Indians | 0.0 /100 | #340 | Tragic 29.1% |
| Immigrants | Armenia | 0.0 /100 | #341 | Tragic 29.0% |
| Immigrants | Barbados | 0.0 /100 | #342 | Tragic 29.0% |
| Yuman | 0.0 /100 | #343 | Tragic 27.7% |
| Guyanese | 0.0 /100 | #344 | Tragic 27.4% |
| Immigrants | Guyana | 0.0 /100 | #345 | Tragic 27.3% |
| Immigrants | St. Vincent and the Grenadines | 0.0 /100 | #346 | Tragic 26.3% |
| Immigrants | Grenada | 0.0 /100 | #347 | Tragic 25.4% |