Immigrants from Poland vs Apache In Labor Force | Age 16-19
COMPARE
Immigrants from Poland
Apache
In Labor Force | Age 16-19
In Labor Force | Age 16-19 Comparison
Immigrants from Poland
Apache
37.3%
IN LABOR FORCE | AGE 16-19
84.4/ 100
METRIC RATING
151st/ 347
METRIC RANK
35.6%
IN LABOR FORCE | AGE 16-19
11.0/ 100
METRIC RATING
214th/ 347
METRIC RANK
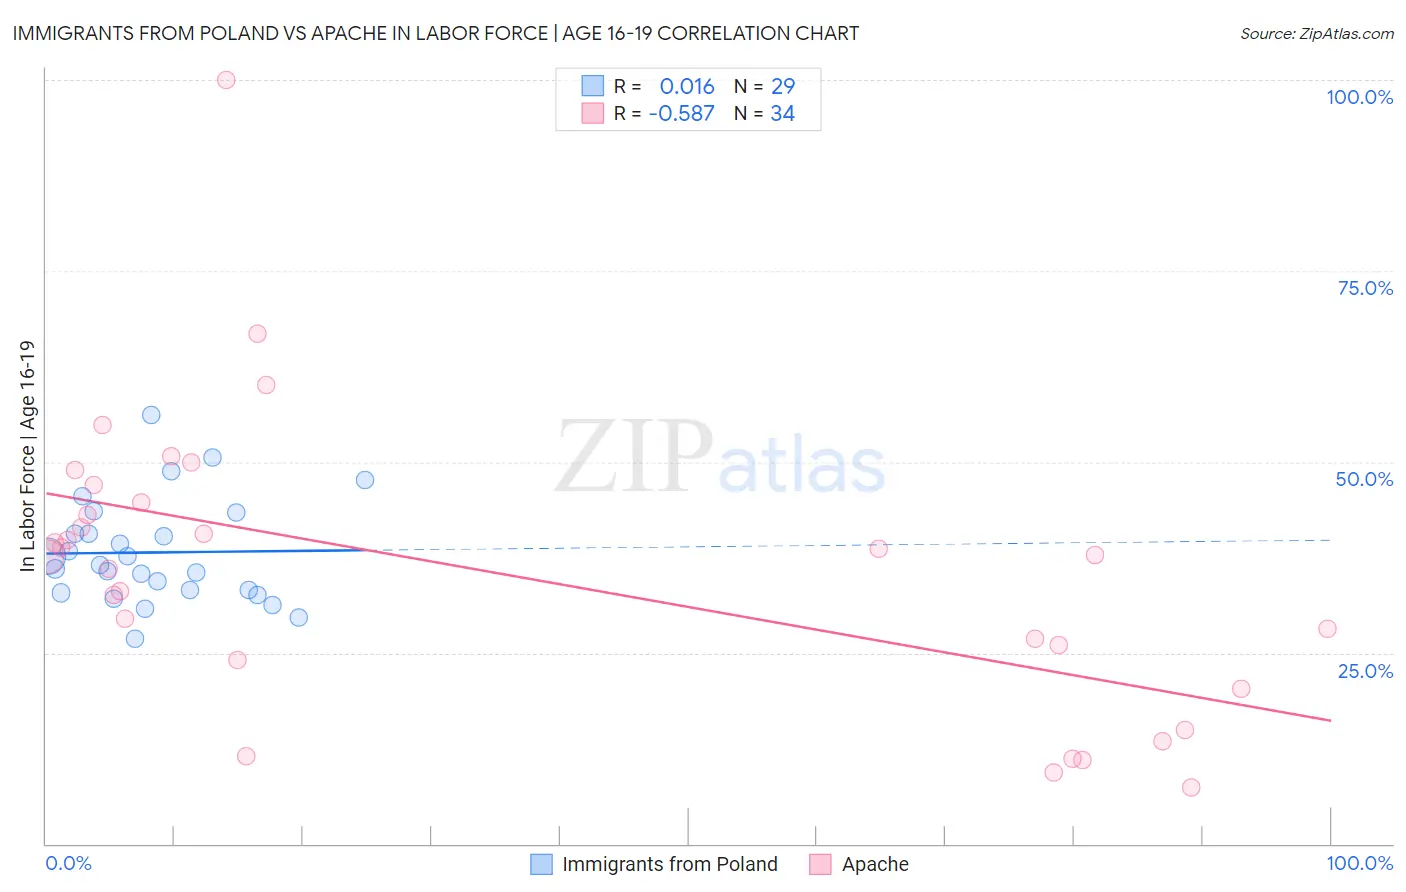
Immigrants from Poland vs Apache In Labor Force | Age 16-19 Correlation Chart
The statistical analysis conducted on geographies consisting of 304,422,201 people shows no correlation between the proportion of Immigrants from Poland and labor force participation rate among population between the ages 16 and 19 in the United States with a correlation coefficient (R) of 0.016 and weighted average of 37.3%. Similarly, the statistical analysis conducted on geographies consisting of 230,841,914 people shows a substantial negative correlation between the proportion of Apache and labor force participation rate among population between the ages 16 and 19 in the United States with a correlation coefficient (R) of -0.587 and weighted average of 35.6%, a difference of 4.9%.
In Labor Force | Age 16-19 Correlation Summary
| Measurement | Immigrants from Poland | Apache |
| Minimum | 26.8% | 7.4% |
| Maximum | 56.2% | 100.0% |
| Range | 29.4% | 92.6% |
| Mean | 38.1% | 35.7% |
| Median | 36.4% | 37.7% |
| Interquartile 25% (IQ1) | 33.1% | 24.0% |
| Interquartile 75% (IQ3) | 42.0% | 44.6% |
| Interquartile Range (IQR) | 9.0% | 20.6% |
| Standard Deviation (Sample) | 6.8% | 19.0% |
| Standard Deviation (Population) | 6.7% | 18.7% |
Similar Demographics by In Labor Force | Age 16-19
Demographics Similar to Immigrants from Poland by In Labor Force | Age 16-19
In terms of in labor force | age 16-19, the demographic groups most similar to Immigrants from Poland are Tsimshian (37.4%, a difference of 0.030%), Native Hawaiian (37.4%, a difference of 0.050%), Immigrants from Sierra Leone (37.3%, a difference of 0.070%), Arapaho (37.3%, a difference of 0.23%), and Immigrants from Bulgaria (37.3%, a difference of 0.25%).
| Demographics | Rating | Rank | In Labor Force | Age 16-19 |
| Japanese | 89.3 /100 | #144 | Excellent 37.5% |
| Paiute | 89.3 /100 | #145 | Excellent 37.5% |
| Immigrants | Western Europe | 88.9 /100 | #146 | Excellent 37.5% |
| Brazilians | 88.7 /100 | #147 | Excellent 37.5% |
| Romanians | 87.3 /100 | #148 | Excellent 37.5% |
| Native Hawaiians | 85.0 /100 | #149 | Excellent 37.4% |
| Tsimshian | 84.7 /100 | #150 | Excellent 37.4% |
| Immigrants | Poland | 84.4 /100 | #151 | Excellent 37.3% |
| Immigrants | Sierra Leone | 83.6 /100 | #152 | Excellent 37.3% |
| Arapaho | 81.8 /100 | #153 | Excellent 37.3% |
| Immigrants | Bulgaria | 81.6 /100 | #154 | Excellent 37.3% |
| Immigrants | Lithuania | 80.7 /100 | #155 | Excellent 37.2% |
| Kiowa | 80.4 /100 | #156 | Excellent 37.2% |
| Immigrants | Brazil | 76.5 /100 | #157 | Good 37.1% |
| Ute | 75.7 /100 | #158 | Good 37.1% |
Demographics Similar to Apache by In Labor Force | Age 16-19
In terms of in labor force | age 16-19, the demographic groups most similar to Apache are Houma (35.6%, a difference of 0.010%), Immigrants from Bolivia (35.6%, a difference of 0.010%), Immigrants from South Eastern Asia (35.6%, a difference of 0.020%), Dutch West Indian (35.6%, a difference of 0.040%), and Immigrants from Costa Rica (35.6%, a difference of 0.040%).
| Demographics | Rating | Rank | In Labor Force | Age 16-19 |
| Immigrants | Eastern Europe | 14.5 /100 | #207 | Poor 35.8% |
| Koreans | 13.3 /100 | #208 | Poor 35.7% |
| Moroccans | 12.7 /100 | #209 | Poor 35.7% |
| Immigrants | Switzerland | 11.9 /100 | #210 | Poor 35.6% |
| Mexicans | 11.9 /100 | #211 | Poor 35.6% |
| Houma | 11.0 /100 | #212 | Poor 35.6% |
| Immigrants | Bolivia | 11.0 /100 | #213 | Poor 35.6% |
| Apache | 11.0 /100 | #214 | Poor 35.6% |
| Immigrants | South Eastern Asia | 10.8 /100 | #215 | Poor 35.6% |
| Dutch West Indians | 10.7 /100 | #216 | Poor 35.6% |
| Immigrants | Costa Rica | 10.7 /100 | #217 | Poor 35.6% |
| Sri Lankans | 9.8 /100 | #218 | Tragic 35.5% |
| Guatemalans | 8.6 /100 | #219 | Tragic 35.5% |
| Immigrants | Bahamas | 8.3 /100 | #220 | Tragic 35.5% |
| Turks | 7.3 /100 | #221 | Tragic 35.4% |