Bahamian vs Immigrants from Lithuania In Labor Force | Age 16-19
COMPARE
Bahamian
Immigrants from Lithuania
In Labor Force | Age 16-19
In Labor Force | Age 16-19 Comparison
Bahamians
Immigrants from Lithuania
34.6%
IN LABOR FORCE | AGE 16-19
1.4/ 100
METRIC RATING
254th/ 347
METRIC RANK
37.2%
IN LABOR FORCE | AGE 16-19
80.7/ 100
METRIC RATING
155th/ 347
METRIC RANK
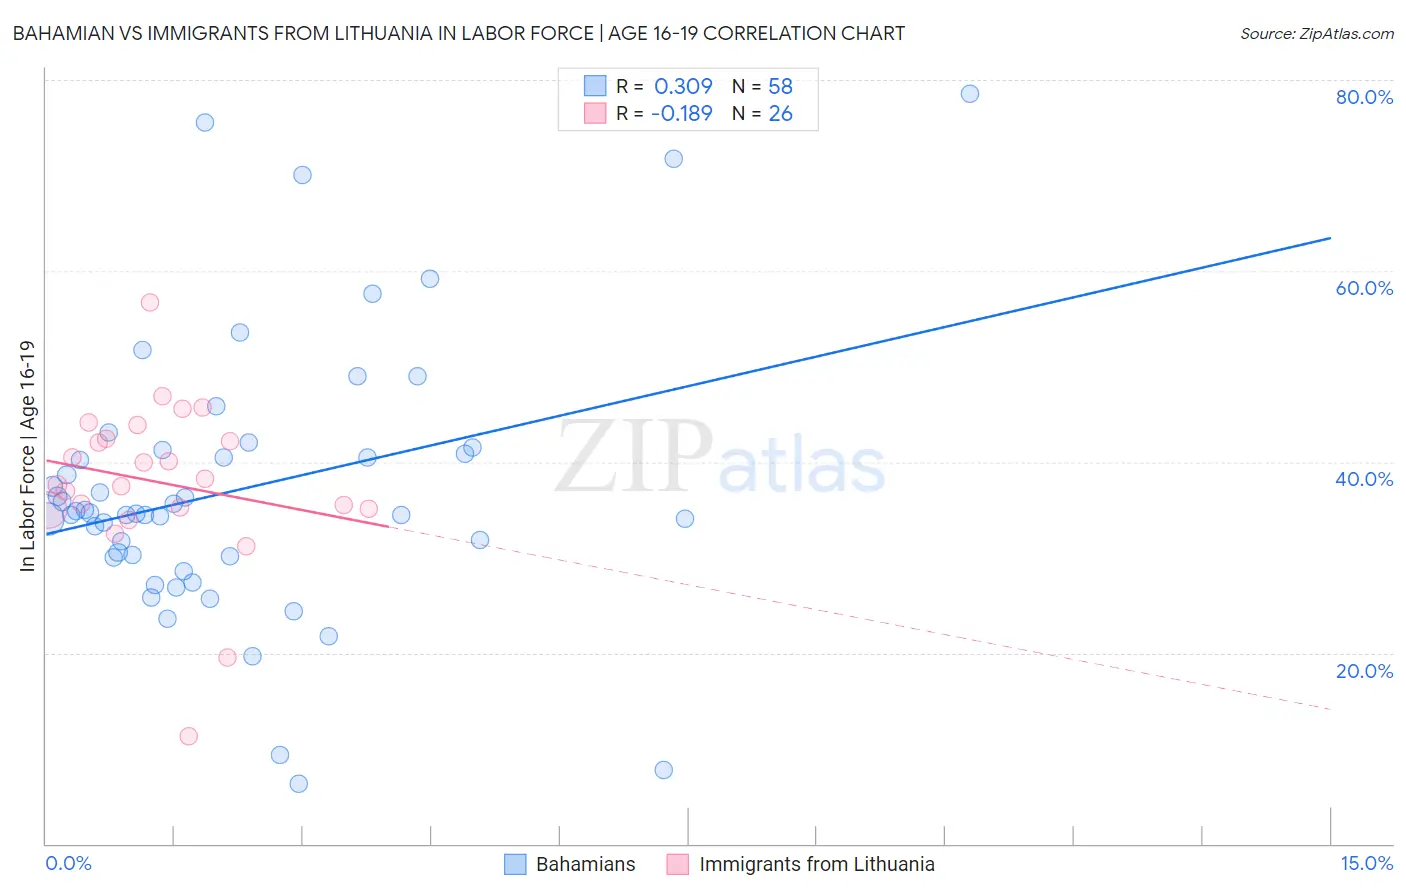
Bahamian vs Immigrants from Lithuania In Labor Force | Age 16-19 Correlation Chart
The statistical analysis conducted on geographies consisting of 112,651,679 people shows a mild positive correlation between the proportion of Bahamians and labor force participation rate among population between the ages 16 and 19 in the United States with a correlation coefficient (R) of 0.309 and weighted average of 34.6%. Similarly, the statistical analysis conducted on geographies consisting of 117,641,154 people shows a poor negative correlation between the proportion of Immigrants from Lithuania and labor force participation rate among population between the ages 16 and 19 in the United States with a correlation coefficient (R) of -0.189 and weighted average of 37.2%, a difference of 7.6%.
In Labor Force | Age 16-19 Correlation Summary
| Measurement | Bahamian | Immigrants from Lithuania |
| Minimum | 6.3% | 11.2% |
| Maximum | 78.5% | 56.7% |
| Range | 72.2% | 45.5% |
| Mean | 37.1% | 37.9% |
| Median | 34.6% | 37.9% |
| Interquartile 25% (IQ1) | 30.1% | 35.1% |
| Interquartile 75% (IQ3) | 41.2% | 42.5% |
| Interquartile Range (IQR) | 11.1% | 7.3% |
| Standard Deviation (Sample) | 14.4% | 8.7% |
| Standard Deviation (Population) | 14.3% | 8.5% |
Similar Demographics by In Labor Force | Age 16-19
Demographics Similar to Bahamians by In Labor Force | Age 16-19
In terms of in labor force | age 16-19, the demographic groups most similar to Bahamians are Peruvian (34.6%, a difference of 0.040%), Immigrants from Japan (34.7%, a difference of 0.12%), Immigrants from South Central Asia (34.6%, a difference of 0.15%), Immigrants from Egypt (34.6%, a difference of 0.15%), and Thai (34.6%, a difference of 0.16%).
| Demographics | Rating | Rank | In Labor Force | Age 16-19 |
| Laotians | 2.4 /100 | #247 | Tragic 34.9% |
| Central Americans | 2.2 /100 | #248 | Tragic 34.8% |
| Immigrants | Ukraine | 2.2 /100 | #249 | Tragic 34.8% |
| Immigrants | Pakistan | 2.0 /100 | #250 | Tragic 34.8% |
| Immigrants | Western Asia | 2.0 /100 | #251 | Tragic 34.8% |
| Immigrants | Chile | 2.0 /100 | #252 | Tragic 34.8% |
| Immigrants | Japan | 1.5 /100 | #253 | Tragic 34.7% |
| Bahamians | 1.4 /100 | #254 | Tragic 34.6% |
| Peruvians | 1.4 /100 | #255 | Tragic 34.6% |
| Immigrants | South Central Asia | 1.3 /100 | #256 | Tragic 34.6% |
| Immigrants | Egypt | 1.2 /100 | #257 | Tragic 34.6% |
| Thais | 1.2 /100 | #258 | Tragic 34.6% |
| Immigrants | Immigrants | 1.2 /100 | #259 | Tragic 34.6% |
| Egyptians | 1.2 /100 | #260 | Tragic 34.5% |
| Salvadorans | 1.1 /100 | #261 | Tragic 34.5% |
Demographics Similar to Immigrants from Lithuania by In Labor Force | Age 16-19
In terms of in labor force | age 16-19, the demographic groups most similar to Immigrants from Lithuania are Kiowa (37.2%, a difference of 0.020%), Immigrants from Bulgaria (37.3%, a difference of 0.070%), Arapaho (37.3%, a difference of 0.090%), Immigrants from Sierra Leone (37.3%, a difference of 0.25%), and Immigrants from Brazil (37.1%, a difference of 0.31%).
| Demographics | Rating | Rank | In Labor Force | Age 16-19 |
| Romanians | 87.3 /100 | #148 | Excellent 37.5% |
| Native Hawaiians | 85.0 /100 | #149 | Excellent 37.4% |
| Tsimshian | 84.7 /100 | #150 | Excellent 37.4% |
| Immigrants | Poland | 84.4 /100 | #151 | Excellent 37.3% |
| Immigrants | Sierra Leone | 83.6 /100 | #152 | Excellent 37.3% |
| Arapaho | 81.8 /100 | #153 | Excellent 37.3% |
| Immigrants | Bulgaria | 81.6 /100 | #154 | Excellent 37.3% |
| Immigrants | Lithuania | 80.7 /100 | #155 | Excellent 37.2% |
| Kiowa | 80.4 /100 | #156 | Excellent 37.2% |
| Immigrants | Brazil | 76.5 /100 | #157 | Good 37.1% |
| Ute | 75.7 /100 | #158 | Good 37.1% |
| Yaqui | 74.4 /100 | #159 | Good 37.1% |
| Immigrants | Saudi Arabia | 73.9 /100 | #160 | Good 37.0% |
| Cambodians | 71.5 /100 | #161 | Good 37.0% |
| Immigrants | Jordan | 69.5 /100 | #162 | Good 36.9% |