Zip Codes with the Highest Percentage of Population Employed in Transportation & Warehousing in Topeka, KS
RELATED REPORTS & OPTIONS
Transportation & Warehousing
Topeka
Compare Zip Codes
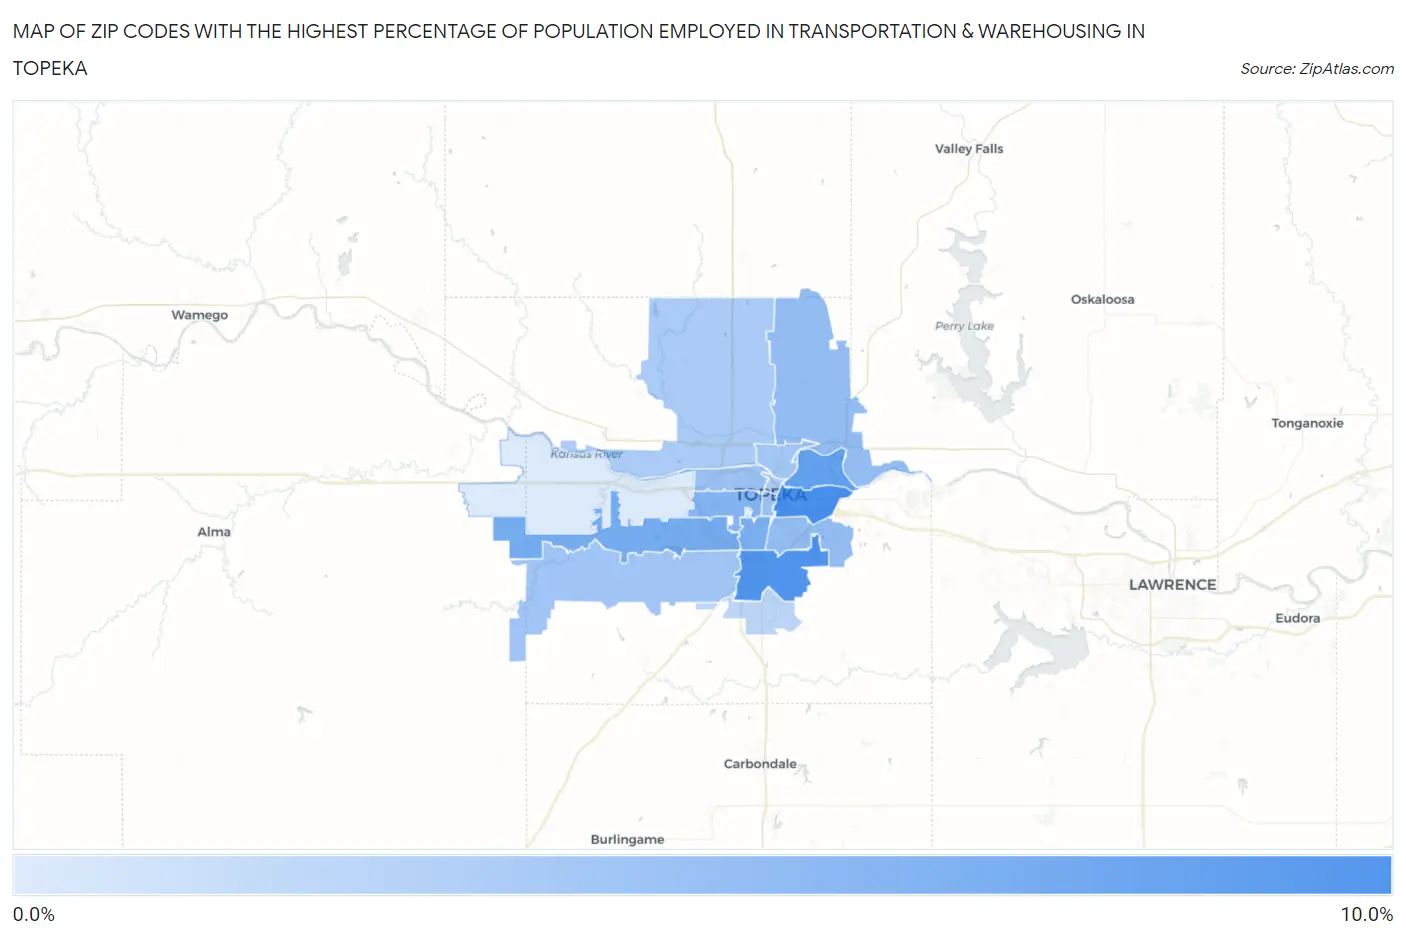
Map of Zip Codes with the Highest Percentage of Population Employed in Transportation & Warehousing in Topeka
0.0%
10.0%
Zip Codes with the Highest Percentage of Population Employed in Transportation & Warehousing in Topeka, KS
| Zip Code | % Employed | vs State | vs National | |
| 1. | 66607 | 8.5% | 4.3%(+4.17)#93 | 4.9%(+3.57)#4,258 |
| 2. | 66609 | 7.9% | 4.3%(+3.56)#107 | 4.9%(+2.96)#5,022 |
| 3. | 66616 | 6.9% | 4.3%(+2.52)#142 | 4.9%(+1.91)#6,837 |
| 4. | 66614 | 5.8% | 4.3%(+1.44)#196 | 4.9%(+0.837)#9,392 |
| 5. | 66611 | 5.5% | 4.3%(+1.14)#209 | 4.9%(+0.536)#10,304 |
| 6. | 66604 | 4.9% | 4.3%(+0.608)#242 | 4.9%(+0.003)#12,098 |
| 7. | 66605 | 4.2% | 4.3%(-0.152)#308 | 4.9%(-0.756)#15,056 |
| 8. | 66617 | 4.1% | 4.3%(-0.216)#318 | 4.9%(-0.820)#15,352 |
| 9. | 66606 | 3.8% | 4.3%(-0.539)#343 | 4.9%(-1.14)#16,787 |
| 10. | 66612 | 3.7% | 4.3%(-0.657)#355 | 4.9%(-1.26)#17,288 |
| 11. | 66610 | 3.3% | 4.3%(-1.02)#393 | 4.9%(-1.63)#18,846 |
| 12. | 66608 | 3.3% | 4.3%(-1.08)#397 | 4.9%(-1.68)#19,060 |
| 13. | 66618 | 2.9% | 4.3%(-1.46)#427 | 4.9%(-2.07)#20,781 |
| 14. | 66603 | 2.8% | 4.3%(-1.50)#433 | 4.9%(-2.11)#20,957 |
| 15. | 66619 | 1.8% | 4.3%(-2.55)#528 | 4.9%(-3.15)#24,966 |
| 16. | 66615 | 0.064% | 4.3%(-4.28)#616 | 4.9%(-4.88)#28,081 |
1
Common Questions
What are the Top 10 Zip Codes with the Highest Percentage of Population Employed in Transportation & Warehousing in Topeka, KS?
Top 10 Zip Codes with the Highest Percentage of Population Employed in Transportation & Warehousing in Topeka, KS are:
What zip code has the Highest Percentage of Population Employed in Transportation & Warehousing in Topeka, KS?
66607 has the Highest Percentage of Population Employed in Transportation & Warehousing in Topeka, KS with 8.5%.
What is the Percentage of Population Employed in Transportation & Warehousing in Topeka, KS?
Percentage of Population Employed in Transportation & Warehousing in Topeka is 4.9%.
What is the Percentage of Population Employed in Transportation & Warehousing in Kansas?
Percentage of Population Employed in Transportation & Warehousing in Kansas is 4.3%.
What is the Percentage of Population Employed in Transportation & Warehousing in the United States?
Percentage of Population Employed in Transportation & Warehousing in the United States is 4.9%.