Ethiopian vs Cree Per Capita Income
COMPARE
Ethiopian
Cree
Per Capita Income
Per Capita Income Comparison
Ethiopians
Cree
$46,569
PER CAPITA INCOME
96.3/ 100
METRIC RATING
106th/ 347
METRIC RANK
$40,056
PER CAPITA INCOME
1.7/ 100
METRIC RATING
246th/ 347
METRIC RANK
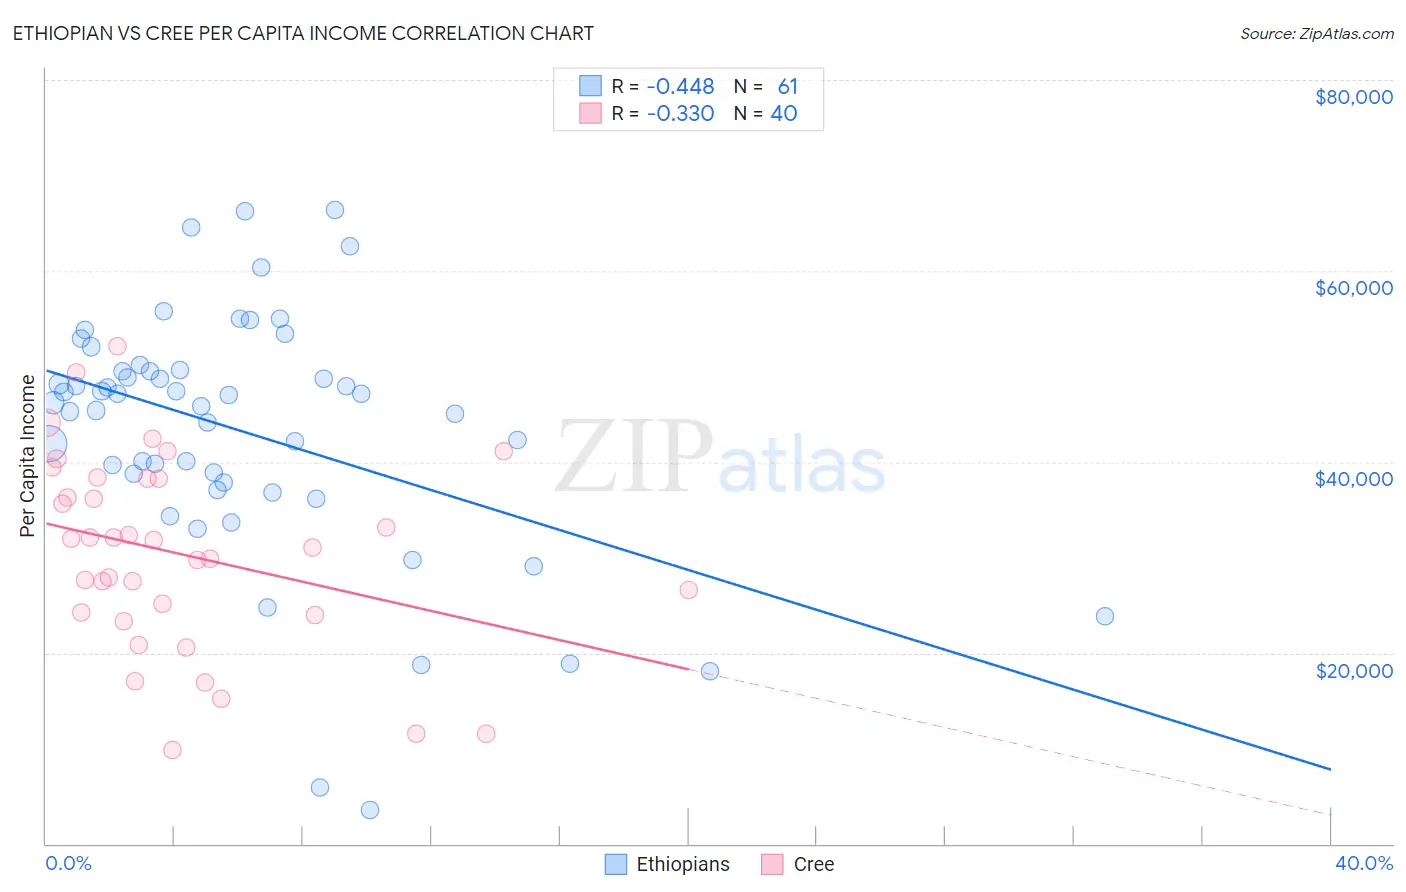
Ethiopian vs Cree Per Capita Income Correlation Chart
The statistical analysis conducted on geographies consisting of 223,280,317 people shows a moderate negative correlation between the proportion of Ethiopians and per capita income in the United States with a correlation coefficient (R) of -0.448 and weighted average of $46,569. Similarly, the statistical analysis conducted on geographies consisting of 76,211,685 people shows a mild negative correlation between the proportion of Cree and per capita income in the United States with a correlation coefficient (R) of -0.330 and weighted average of $40,056, a difference of 16.3%.
Per Capita Income Correlation Summary
| Measurement | Ethiopian | Cree |
| Minimum | $3,511 | $9,879 |
| Maximum | $66,352 | $52,079 |
| Range | $62,841 | $42,200 |
| Mean | $43,114 | $30,350 |
| Median | $46,234 | $31,398 |
| Interquartile 25% (IQ1) | $37,442 | $24,114 |
| Interquartile 75% (IQ3) | $49,561 | $38,235 |
| Interquartile Range (IQR) | $12,119 | $14,121 |
| Standard Deviation (Sample) | $12,938 | $10,115 |
| Standard Deviation (Population) | $12,832 | $9,988 |
Similar Demographics by Per Capita Income
Demographics Similar to Ethiopians by Per Capita Income
In terms of per capita income, the demographic groups most similar to Ethiopians are British ($46,571, a difference of 0.0%), Serbian ($46,551, a difference of 0.040%), Immigrants from Kuwait ($46,543, a difference of 0.060%), Immigrants from Northern Africa ($46,531, a difference of 0.080%), and Chilean ($46,459, a difference of 0.24%).
| Demographics | Rating | Rank | Per Capita Income |
| Laotians | 97.8 /100 | #99 | Exceptional $47,041 |
| Immigrants | Lebanon | 97.5 /100 | #100 | Exceptional $46,938 |
| Immigrants | Uzbekistan | 97.5 /100 | #101 | Exceptional $46,929 |
| Immigrants | Western Asia | 97.4 /100 | #102 | Exceptional $46,876 |
| Syrians | 97.2 /100 | #103 | Exceptional $46,837 |
| Brazilians | 96.8 /100 | #104 | Exceptional $46,700 |
| British | 96.3 /100 | #105 | Exceptional $46,571 |
| Ethiopians | 96.3 /100 | #106 | Exceptional $46,569 |
| Serbians | 96.2 /100 | #107 | Exceptional $46,551 |
| Immigrants | Kuwait | 96.2 /100 | #108 | Exceptional $46,543 |
| Immigrants | Northern Africa | 96.2 /100 | #109 | Exceptional $46,531 |
| Chileans | 95.9 /100 | #110 | Exceptional $46,459 |
| Taiwanese | 95.8 /100 | #111 | Exceptional $46,455 |
| Immigrants | Morocco | 95.7 /100 | #112 | Exceptional $46,430 |
| Immigrants | Albania | 95.5 /100 | #113 | Exceptional $46,387 |
Demographics Similar to Cree by Per Capita Income
In terms of per capita income, the demographic groups most similar to Cree are Immigrants from Somalia ($39,974, a difference of 0.20%), Subsaharan African ($40,152, a difference of 0.24%), Cape Verdean ($39,935, a difference of 0.30%), Japanese ($39,870, a difference of 0.46%), and French American Indian ($40,244, a difference of 0.47%).
| Demographics | Rating | Rank | Per Capita Income |
| Tsimshian | 2.4 /100 | #239 | Tragic $40,344 |
| Immigrants | Nigeria | 2.3 /100 | #240 | Tragic $40,339 |
| British West Indians | 2.3 /100 | #241 | Tragic $40,330 |
| Immigrants | Western Africa | 2.2 /100 | #242 | Tragic $40,294 |
| German Russians | 2.2 /100 | #243 | Tragic $40,266 |
| French American Indians | 2.1 /100 | #244 | Tragic $40,244 |
| Sub-Saharan Africans | 1.9 /100 | #245 | Tragic $40,152 |
| Cree | 1.7 /100 | #246 | Tragic $40,056 |
| Immigrants | Somalia | 1.6 /100 | #247 | Tragic $39,974 |
| Cape Verdeans | 1.5 /100 | #248 | Tragic $39,935 |
| Japanese | 1.4 /100 | #249 | Tragic $39,870 |
| Immigrants | Burma/Myanmar | 1.3 /100 | #250 | Tragic $39,827 |
| Samoans | 1.3 /100 | #251 | Tragic $39,826 |
| Immigrants | Azores | 1.0 /100 | #252 | Tragic $39,608 |
| Osage | 1.0 /100 | #253 | Tragic $39,568 |