Tlingit-Haida vs Australian Median Female Earnings
COMPARE
Tlingit-Haida
Australian
Median Female Earnings
Median Female Earnings Comparison
Tlingit-Haida
Australians
$39,513
MEDIAN FEMALE EARNINGS
40.5/ 100
METRIC RATING
182nd/ 347
METRIC RANK
$43,308
MEDIAN FEMALE EARNINGS
99.9/ 100
METRIC RATING
54th/ 347
METRIC RANK
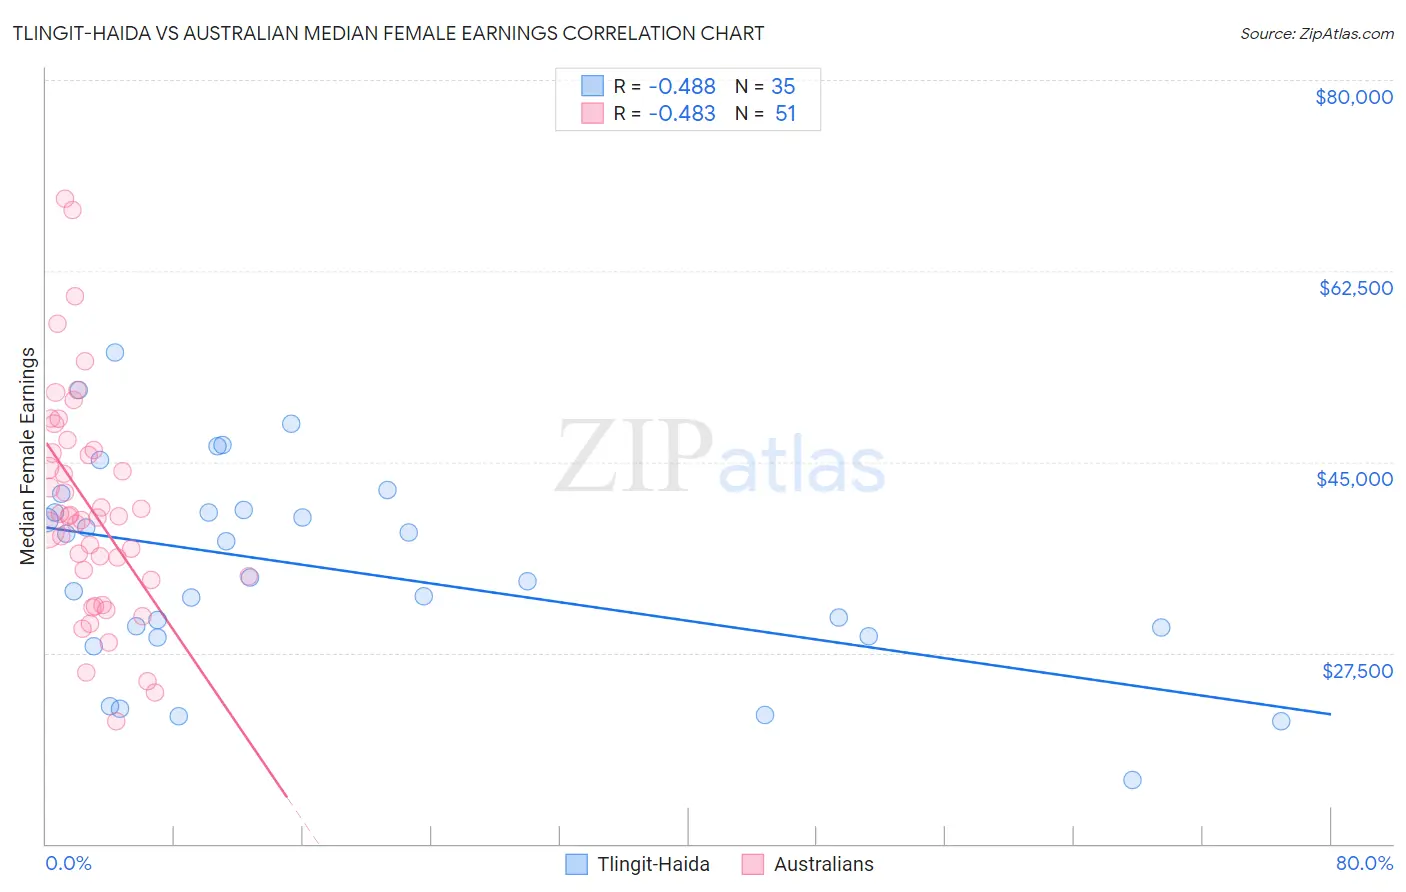
Tlingit-Haida vs Australian Median Female Earnings Correlation Chart
The statistical analysis conducted on geographies consisting of 60,850,593 people shows a moderate negative correlation between the proportion of Tlingit-Haida and median female earnings in the United States with a correlation coefficient (R) of -0.488 and weighted average of $39,513. Similarly, the statistical analysis conducted on geographies consisting of 224,101,413 people shows a moderate negative correlation between the proportion of Australians and median female earnings in the United States with a correlation coefficient (R) of -0.483 and weighted average of $43,308, a difference of 9.6%.
Median Female Earnings Correlation Summary
| Measurement | Tlingit-Haida | Australian |
| Minimum | $15,833 | $21,275 |
| Maximum | $55,000 | $69,107 |
| Range | $39,167 | $47,832 |
| Mean | $35,190 | $40,748 |
| Median | $34,397 | $40,021 |
| Interquartile 25% (IQ1) | $28,977 | $34,140 |
| Interquartile 75% (IQ3) | $40,590 | $46,088 |
| Interquartile Range (IQR) | $11,613 | $11,949 |
| Standard Deviation (Sample) | $9,336 | $10,236 |
| Standard Deviation (Population) | $9,202 | $10,135 |
Similar Demographics by Median Female Earnings
Demographics Similar to Tlingit-Haida by Median Female Earnings
In terms of median female earnings, the demographic groups most similar to Tlingit-Haida are Hungarian ($39,510, a difference of 0.010%), Tsimshian ($39,530, a difference of 0.050%), Immigrants from Kenya ($39,535, a difference of 0.060%), European ($39,457, a difference of 0.14%), and Immigrants from West Indies ($39,441, a difference of 0.18%).
| Demographics | Rating | Rank | Median Female Earnings |
| Immigrants | South America | 47.2 /100 | #175 | Average $39,643 |
| Nigerians | 47.0 /100 | #176 | Average $39,641 |
| Costa Ricans | 46.1 /100 | #177 | Average $39,622 |
| Slavs | 45.6 /100 | #178 | Average $39,613 |
| Immigrants | Germany | 45.1 /100 | #179 | Average $39,603 |
| Immigrants | Kenya | 41.6 /100 | #180 | Average $39,535 |
| Tsimshian | 41.4 /100 | #181 | Average $39,530 |
| Tlingit-Haida | 40.5 /100 | #182 | Average $39,513 |
| Hungarians | 40.3 /100 | #183 | Average $39,510 |
| Europeans | 37.7 /100 | #184 | Fair $39,457 |
| Immigrants | West Indies | 36.9 /100 | #185 | Fair $39,441 |
| Colombians | 36.9 /100 | #186 | Fair $39,439 |
| Swedes | 36.0 /100 | #187 | Fair $39,421 |
| Bermudans | 35.9 /100 | #188 | Fair $39,418 |
| Senegalese | 34.2 /100 | #189 | Fair $39,384 |
Demographics Similar to Australians by Median Female Earnings
In terms of median female earnings, the demographic groups most similar to Australians are Immigrants from Eastern Europe ($43,309, a difference of 0.0%), Egyptian ($43,305, a difference of 0.010%), Immigrants from Lithuania ($43,317, a difference of 0.020%), Maltese ($43,357, a difference of 0.11%), and Immigrants from Croatia ($43,258, a difference of 0.11%).
| Demographics | Rating | Rank | Median Female Earnings |
| Bolivians | 100.0 /100 | #47 | Exceptional $43,445 |
| Immigrants | Indonesia | 100.0 /100 | #48 | Exceptional $43,412 |
| Immigrants | Serbia | 100.0 /100 | #49 | Exceptional $43,385 |
| Immigrants | Uzbekistan | 100.0 /100 | #50 | Exceptional $43,363 |
| Maltese | 100.0 /100 | #51 | Exceptional $43,357 |
| Immigrants | Lithuania | 99.9 /100 | #52 | Exceptional $43,317 |
| Immigrants | Eastern Europe | 99.9 /100 | #53 | Exceptional $43,309 |
| Australians | 99.9 /100 | #54 | Exceptional $43,308 |
| Egyptians | 99.9 /100 | #55 | Exceptional $43,305 |
| Immigrants | Croatia | 99.9 /100 | #56 | Exceptional $43,258 |
| Ethiopians | 99.9 /100 | #57 | Exceptional $43,243 |
| Paraguayans | 99.9 /100 | #58 | Exceptional $43,173 |
| Estonians | 99.9 /100 | #59 | Exceptional $43,106 |
| Immigrants | Latvia | 99.9 /100 | #60 | Exceptional $43,099 |
| Immigrants | Bulgaria | 99.9 /100 | #61 | Exceptional $43,085 |