Italian vs Immigrants from Morocco Median Female Earnings
COMPARE
Italian
Immigrants from Morocco
Median Female Earnings
Median Female Earnings Comparison
Italians
Immigrants from Morocco
$41,505
MEDIAN FEMALE EARNINGS
97.7/ 100
METRIC RATING
105th/ 347
METRIC RANK
$42,229
MEDIAN FEMALE EARNINGS
99.5/ 100
METRIC RATING
82nd/ 347
METRIC RANK
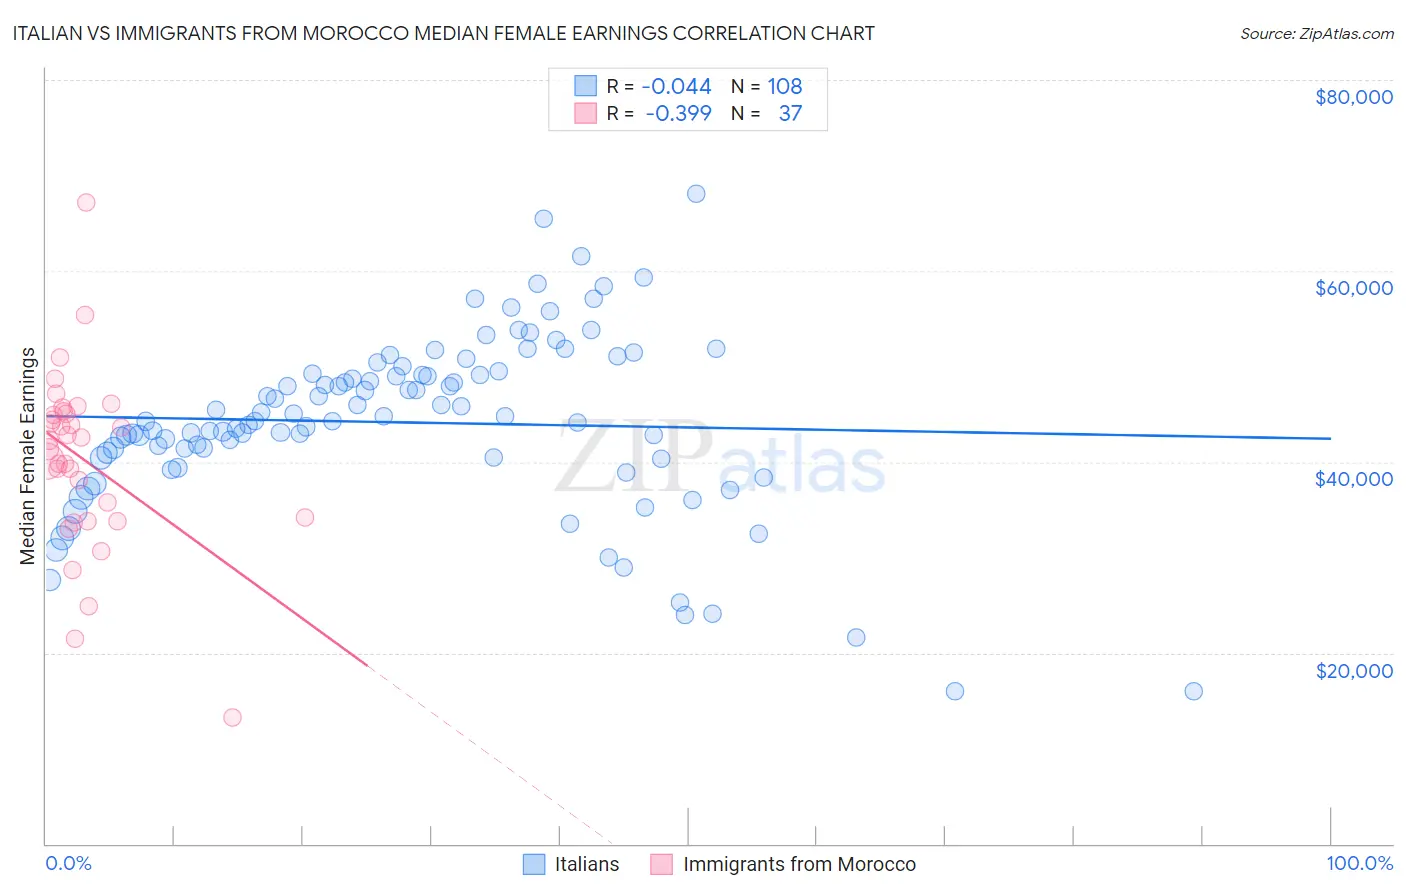
Italian vs Immigrants from Morocco Median Female Earnings Correlation Chart
The statistical analysis conducted on geographies consisting of 573,135,086 people shows no correlation between the proportion of Italians and median female earnings in the United States with a correlation coefficient (R) of -0.044 and weighted average of $41,505. Similarly, the statistical analysis conducted on geographies consisting of 178,902,158 people shows a mild negative correlation between the proportion of Immigrants from Morocco and median female earnings in the United States with a correlation coefficient (R) of -0.399 and weighted average of $42,229, a difference of 1.7%.
Median Female Earnings Correlation Summary
| Measurement | Italian | Immigrants from Morocco |
| Minimum | $15,938 | $13,173 |
| Maximum | $68,125 | $67,179 |
| Range | $52,187 | $54,006 |
| Mean | $44,140 | $40,274 |
| Median | $44,292 | $42,277 |
| Interquartile 25% (IQ1) | $40,427 | $34,012 |
| Interquartile 75% (IQ3) | $49,180 | $45,224 |
| Interquartile Range (IQR) | $8,753 | $11,212 |
| Standard Deviation (Sample) | $9,271 | $9,469 |
| Standard Deviation (Population) | $9,228 | $9,340 |
Similar Demographics by Median Female Earnings
Demographics Similar to Italians by Median Female Earnings
In terms of median female earnings, the demographic groups most similar to Italians are Immigrants from Zimbabwe ($41,527, a difference of 0.050%), Immigrants from Eritrea ($41,485, a difference of 0.050%), Palestinian ($41,484, a difference of 0.050%), Jordanian ($41,464, a difference of 0.10%), and Chinese ($41,461, a difference of 0.10%).
| Demographics | Rating | Rank | Median Female Earnings |
| Immigrants | Scotland | 98.7 /100 | #98 | Exceptional $41,771 |
| Immigrants | Barbados | 98.4 /100 | #99 | Exceptional $41,685 |
| Romanians | 98.3 /100 | #100 | Exceptional $41,663 |
| Immigrants | Fiji | 98.3 /100 | #101 | Exceptional $41,656 |
| Immigrants | Poland | 98.2 /100 | #102 | Exceptional $41,630 |
| Immigrants | Argentina | 97.9 /100 | #103 | Exceptional $41,554 |
| Immigrants | Zimbabwe | 97.8 /100 | #104 | Exceptional $41,527 |
| Italians | 97.7 /100 | #105 | Exceptional $41,505 |
| Immigrants | Eritrea | 97.6 /100 | #106 | Exceptional $41,485 |
| Palestinians | 97.6 /100 | #107 | Exceptional $41,484 |
| Jordanians | 97.5 /100 | #108 | Exceptional $41,464 |
| Chinese | 97.5 /100 | #109 | Exceptional $41,461 |
| Immigrants | Western Asia | 97.0 /100 | #110 | Exceptional $41,375 |
| Immigrants | Canada | 97.0 /100 | #111 | Exceptional $41,373 |
| Immigrants | North America | 96.7 /100 | #112 | Exceptional $41,319 |
Demographics Similar to Immigrants from Morocco by Median Female Earnings
In terms of median female earnings, the demographic groups most similar to Immigrants from Morocco are Immigrants from Sierra Leone ($42,214, a difference of 0.030%), Armenian ($42,212, a difference of 0.040%), Immigrants from Southern Europe ($42,275, a difference of 0.11%), Immigrants from Moldova ($42,304, a difference of 0.18%), and Laotian ($42,133, a difference of 0.23%).
| Demographics | Rating | Rank | Median Female Earnings |
| New Zealanders | 99.7 /100 | #75 | Exceptional $42,446 |
| Immigrants | Italy | 99.7 /100 | #76 | Exceptional $42,446 |
| Immigrants | Albania | 99.6 /100 | #77 | Exceptional $42,388 |
| Immigrants | Kazakhstan | 99.6 /100 | #78 | Exceptional $42,386 |
| Greeks | 99.6 /100 | #79 | Exceptional $42,336 |
| Immigrants | Moldova | 99.6 /100 | #80 | Exceptional $42,304 |
| Immigrants | Southern Europe | 99.5 /100 | #81 | Exceptional $42,275 |
| Immigrants | Morocco | 99.5 /100 | #82 | Exceptional $42,229 |
| Immigrants | Sierra Leone | 99.5 /100 | #83 | Exceptional $42,214 |
| Armenians | 99.5 /100 | #84 | Exceptional $42,212 |
| Laotians | 99.4 /100 | #85 | Exceptional $42,133 |
| Immigrants | St. Vincent and the Grenadines | 99.3 /100 | #86 | Exceptional $42,108 |
| Lithuanians | 99.3 /100 | #87 | Exceptional $42,108 |
| Immigrants | Northern Africa | 99.3 /100 | #88 | Exceptional $42,084 |
| Immigrants | Afghanistan | 99.3 /100 | #89 | Exceptional $42,055 |